Lecture by Professor Imre Janszky about random error.
31
1 Random Error Imre Janszky Faculty of Medicine NTNU
-
Upload
epinor -
Category
Presentations & Public Speaking
-
view
95 -
download
0
Transcript of Lecture by Professor Imre Janszky about random error.

1
Random Error
Imre Janszky
Faculty of Medicine
NTNU
2
” The statistical education of scientists emphasizes a flawed approach to data analysis that should have been discarded long ago. This defective method is statistical significance testing. ... It has produced countless misinterpretations of data that are often amusing for their folly, but also hair-raising in view of the serious consequences.”
Kenneth Rothman

3

4
Overview
• P value and hypothesis testing
• Misconceptions and problems with p value and statistical significance
• History of statistical significance
• Confidence intervals and estimation
• Regression toward the mean
• Multiple comparisons

5
P value and hypothesis testing
We need :
• A sample from a population
• Set up a null hypothesis concerning the
population
• Set up an alternative hypothesis concerning
the population
• Contrast the data with the null hypothesis
6
P value- What is it?
Upper one-tailed p value:
• The probability that the test statistic will be
greater than or equal its observed value
assuming that the null hypothesis is true
Lower one-tailed p value
• The probability that the test statistic will be
lower than or equal its observed value
assuming that the null hypothesis is true

7
P value- What is it?
Two-tailed p value:
• Non-directional alternative hypothesis
• Usually defined as twice the smaller of the
upper and lower p values

8
P value- What is it?
• P value is a measure of the consistency
between the data obtained in a sample and a
null hypothesis concerning the big population
• Simplified definition: P value refers to the
probability, assuming that the null hypothesis
is true, that the data obtained in a study
would demonstrate an association as far from
the null-hypothesis as, or farther than, what
was actually obtained
9
Example – difference in body
weight of men and women
• A sample from the big population of men and
women
• The null hypothesis: ∆weight = 0
• Alternative hypothesis: ∆weight ≠ 0

10
• We observed that in our sample, ∆weight=5
kg, i.e., on average, men are heavier than
women by 5 kg
• P=0.01
• Using the simplified definition: If in the big
population of men and women ∆weight=0,
then the probability to obtain a difference of
+5 kg or higher than that or to obtain a
difference of -5kg or lower than that between
men and women in our sample is 1%
Example – body weight of men
and women

11
P value - What is it not?
• ≠ the probability that the null hypothesis
is true
• ≠ the probability that a finding is just by
chance
• ≠ strength of the association
• ≠ degree of imprecision

12
Statistical significance, hypothesis
testing
• Based on a predefined cut off for p
value
• Typically, the null hypothesis is rejected
if p<0.05 and not rejected if p>0.05
• Type I error is the incorrect rejection of a
true null hypothesis
• Type II error is the incorrect lack of
rejection of a false null hypothesis
13
Problems with statistical significance
• Court analogy: the defendant is assumed to be innocent until it is proved otherwise/ the null hypotheses is assumed to be true until we can reject it
• However, decisions in medicine are not be based on a p value from a single study
• In contrast with the courts, “gray zones” are acceptable
• Very common misconception: lack of significance is an evidence for lack of effect
• Loss of important information with simple dichotomization

14
History of statistical significance
• Modern use of statistical significance was
developed in business applications needing
decisions based on single results
• At the beginning there was no universal
agreement on what should be the cut-off, or
whether an universal cut-off is needed at all

15
History of statistical significance
• Developers of hypothesis testing (Egon
Pearson and Jerzy Neyman) emphasized
that the cut off values should be chosen
based on the concrete situation
• Roland Fisher published a very influential
statistical textbook:Statistical Methods for
Research Workers (first edition in 1925)

16
• In his book, Fisher published distribution
tables for different statistics for the calculation
of selected p values, including 0.05
• He also stated: ” Personally, the writer
prefers to set a low standard of significance
at the 5 per cent point, and ignore entirely all
results which fail to reach this level. ”
History of statistical significance

17
Why statistical significance become
so widespread?
• Relatively easy calculation (S vs NS instead
of calculating a concrete p value)
• Feeling of objectivity
• Simplified interpretation for the researcher
and for the readers
• Easy writing
• False impression of certainty
18
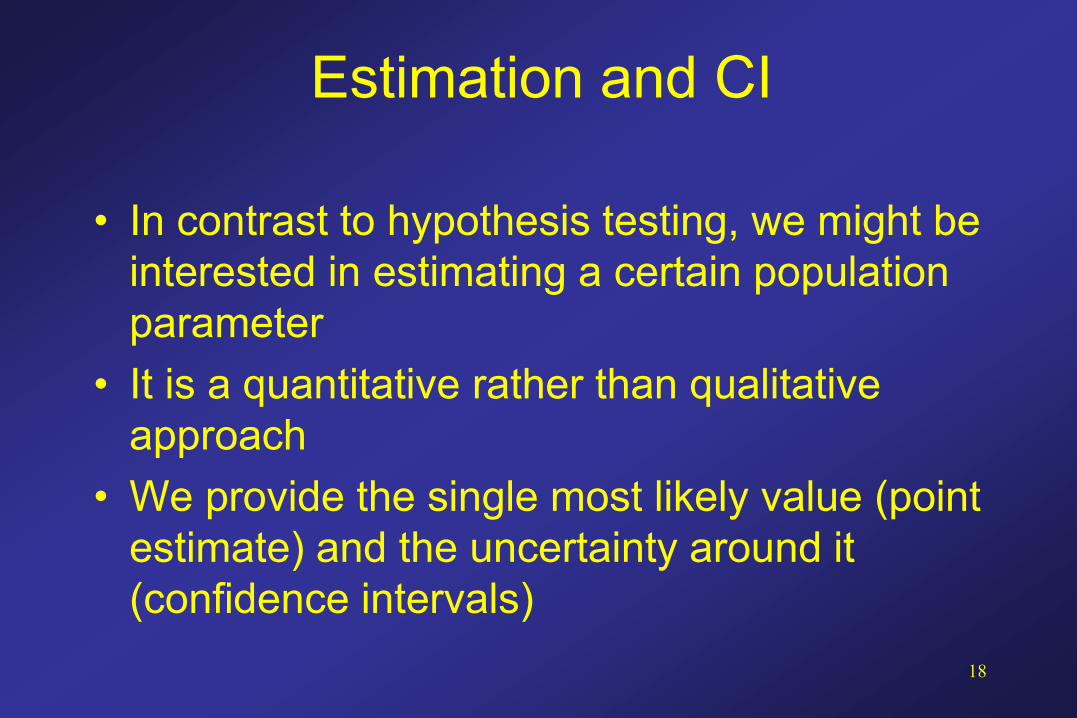
Estimation and CI
• In contrast to hypothesis testing, we might be
interested in estimating a certain population
parameter
• It is a quantitative rather than qualitative
approach
• We provide the single most likely value (point
estimate) and the uncertainty around it
(confidence intervals)
19
Estimation and CI
• 95% CI= over unlimited repetitions of the
study the 95% confidence interval will contain
the true population parameter with a
frequency of no less than 95%
• CI allows you to consider the effect size and
its uncertainty separately

20
Suggestions
• We shall avoid “statistical significance” as a
simple dichotomy of study results
• If you use p values, report the actual values
(reserve stars for hotels…)
• Use confidence intervals instead of p values

21
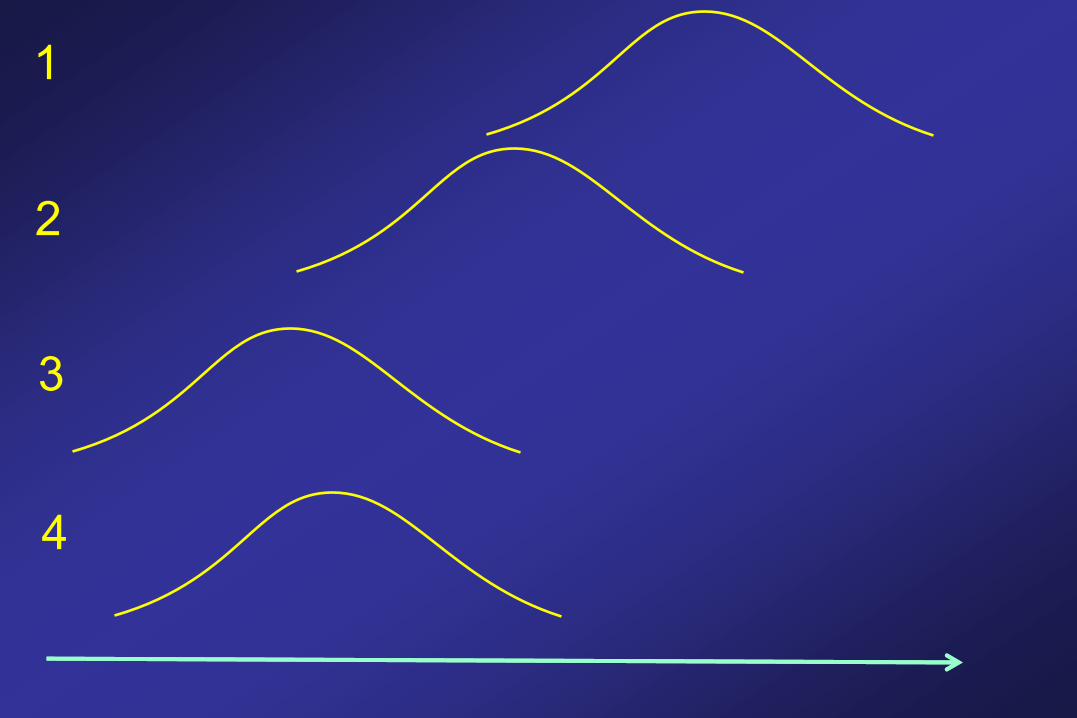
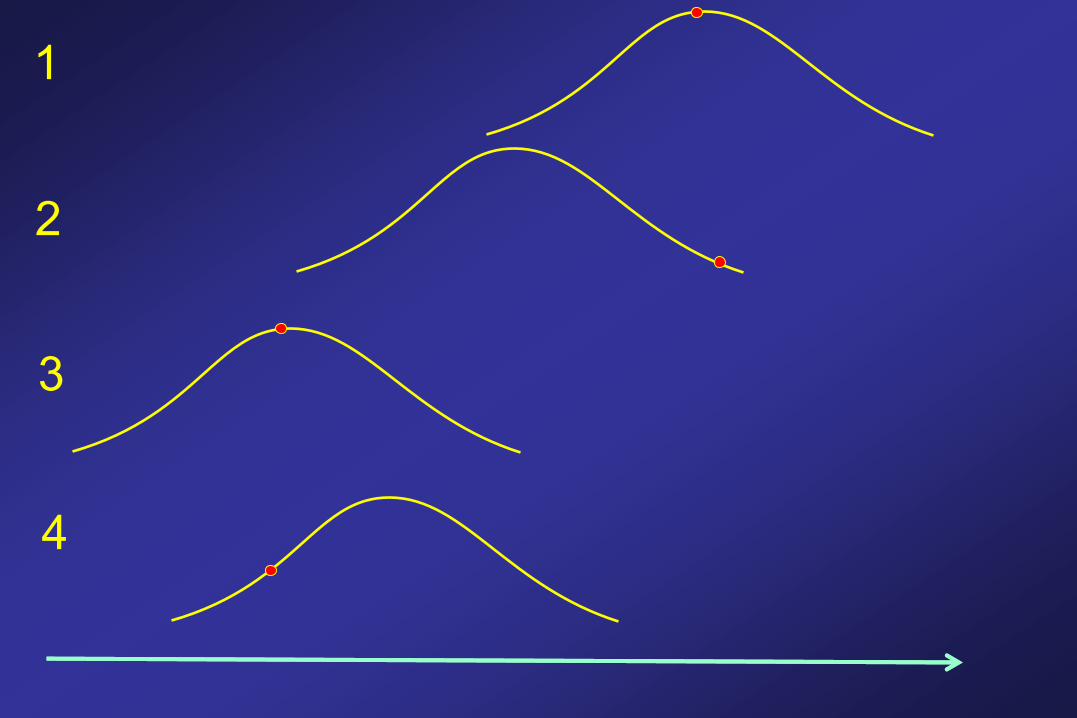
Regression toward the mean
1
2
3
4
1
2
3
4

1
2
3
4

25
Multiple comparisons

26
Multiple comparisons
• With increasing number of indepedent
associations examined for statistical
significance the probability that at least one
association will be statistically significant is
increasing.
• For example: with 20 indepent comparisons
the probability of at least one statistically
significant finding is 64% given that all 20 null
hypotheses are true

1
2
3
4

1
2
3
4

1
2
3
4
30
Multiple comparisons
• Conventional adjustments for multiple
comparisons are based on increasing the P
value in order to reduce false positive
findings – on expense of increased false
negative findings

31
Suggestions • For most situations (i.e. interest in individual
associations with specific hypotheses, no
immediate decision is needed) it is
satisfactory if you present your estimates
WITHOUT any adjustment for multiple
comparisons but present the number of
comparisons made
• Consider adjustment for multiple
comparisons if you do not have specific
hypotheses and/or when you really need to
the make a decision