LECTURE 3 Basics of atmospheric composition and physics AOSC 434 AIR POLLUTION Russell R. Dickerson.
50
LECTURE 3 Basics of atmospheric composition and physics AOSC 434 AIR POLLUTION Russell R. Dickerson
-
Upload
austen-montgomery -
Category
Documents
-
view
226 -
download
9
Transcript of LECTURE 3 Basics of atmospheric composition and physics AOSC 434 AIR POLLUTION Russell R. Dickerson.

LECTURE 3
Basics of atmospheric composition and physics
AOSC 434
AIR POLLUTION
Russell R. Dickerson


Ib. ATMOSPHERIC PHYSICS
Seinfeld & Pandis: Chapter 1Finlayson-Pitts: Chapter 2
1.Pressure: exponential decay2.Composition3.Temperature
The motion of the atmosphere is caused by differential heating, that is some parts of the atmosphere receive more radiation than others and become unstable.

VERTICAL PROFILES OF PRESSURE AND TEMPERATUREMean values for 30oN, March
Tropopause
Stratopause

N2
O2
Ar
O3
Inert gasesCO2
H2
←SO2, NO2,CFC’s, etc
PM
COCH4
N2O
Composition of the Earth’s Troposphere
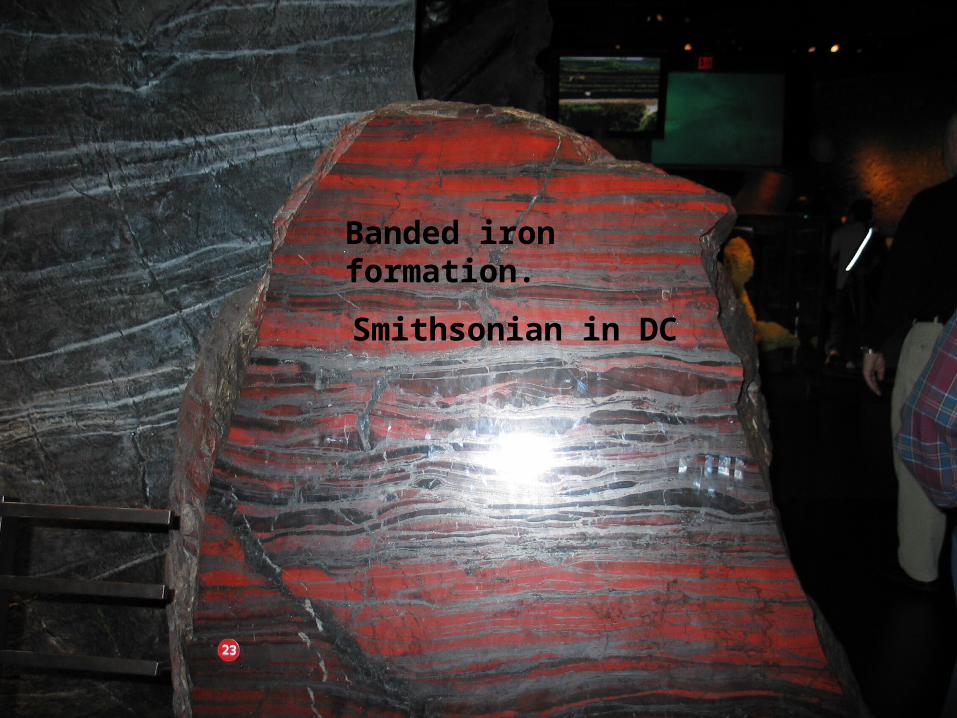
Banded iron formation.
Smithsonian in DC

About 3E9 years ago, cyanobacteria began producing O2 in photosynthesis; initially consumed by iron and organic matter in oceans. O2 is toxic to anaerobic organisms – the first great extinction. (Range of PO2 estimates)

Units of pressure:
1.00 atm. = 14.7 psi = 1,013 mb = 760 mm Hg (torr) = 33.9 ft H₂O
= 29.9” Hg = 101325 Pa
A Pascal is a Nm⁻² (kg m s-2 m-2 ) thus hPa = mb.
Units of Volume: liter, cc, ml, m³
Units of temp: K, °C
Units of R: 0.08206 L atm mole-1 K-1
8.31 J mole-1 K-1
R’ = R/Mwt = 0.287 J g-1K-1
For a mole of dry air which has the mass 29 g.
Problem for the student: calc Mwt. Wet (2% H₂O vapor by volume) air.

1A. Derive Hypsometric EquationStart with The Ideal Gas Law
PV = nRT or P = ρR’T or P = R’T/α
Where R’ = R/Mwt
Mwt = MOLE WT. AIR
ρ = DENSITY AIR (g/l)
α = SPECIFIC VOL AIR = 1/ρ
We assume that the pressure at any given altitude is due to the weight of the atmosphere above that altitude. The weight is mass times acceleration.
P = W = mg
But m = Vρ
For a unit area V = Z
P = Zρg

For a second, higher layer the difference in pressure can be related to the difference in height.
dP = − g ρ dZ
But
ρ = P/R’T
dP = − Pg/R’T * dZ
For an isothermal atmosphere g/R’T is a constant. By integrating both sides of the equation from the ground (Z = 0.0) to altitude Z we obtain:

Where H₀ = R’T/g we can rewrite this as:
*HYPSOMETRIC EQUATION*
Note: Scale Height: H₀ ~ 8 km for T = 273K
For each 8 km of altitude the pressure is down by e⁻¹ or one “e-fold.”
Problems for the student: Derive an expression for pressure as a function of altitude using base two and base ten instead of base e. Calculate the scale height for the atmospheres of Venus and Mars.
Ans. base 2 = H₀*ln(2) = 5.5 km
base 10 = H₀*ln(10) = 18 km
)/exp( 00 HZPPZ

1B. TEMPERATURE LAPSE RATE
Going to the mountains in Shenandoah National Park the summer is a nice way to escape Washington’s heat. Why? Consider a parcel of air. If it rises it will expand and cool. If we assume it exchanges no heat with the surroundings (a pretty good assumption, because air is a very poor conductor of heat) it will cool “adiabatically.”
Calculating the dry adiabatic lapse rate.
First Law Thermodynamics*:
dU = đQ – đW
Or
đQ = dU + đW = dU + PdV
*watch out for work done by the system or on the system.

WHERE
U = Energy of system (also written E)
Q = Heat across boundaries
W = Work done by the system on the surroundings
H = Internal heat or Enthalpy
ASSUME:
a) Adiabatic (dQ = dH = 0.0)
b) All work PdV work
(remember α = 1/ρ)
dH = Cp dT – α dP
CpdT = α dP
dT = (α/Cp) dP

Remember the Hydrostatic Equation
OR
Ideal Gas Law
Result:
This quantity, -g/Cp, is a constant in a dry atmosphere. It is called the dry adiabatic lapse rate and is given the symbol γ₀, defined as −dT/dZ.
For a parcel of air moving adiabatically in the atmosphere:
(gP/R'T)dZdP
dZgdP
)(
dZTRPC
gPTRdT
PTR
p '
)('
/'
pCgdZdT //
kmK /8.90
)( 12012 ZZTT
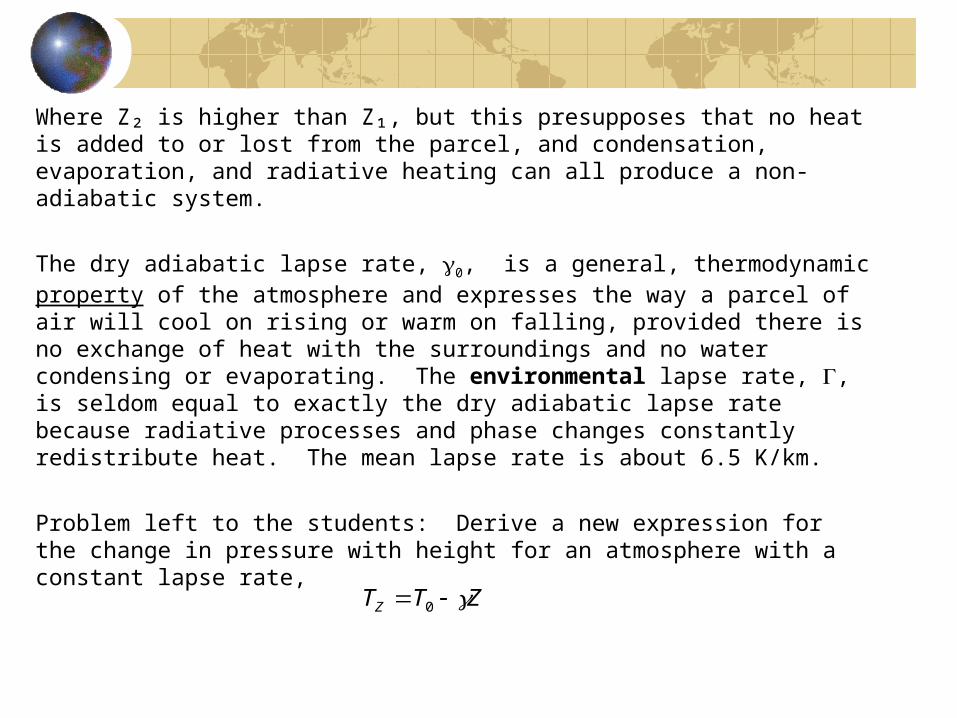
Where Z₂ is higher than Z₁, but this presupposes that no heat is added to or lost from the parcel, and condensation, evaporation, and radiative heating can all produce a non-adiabatic system.
The dry adiabatic lapse rate, 0, is a general, thermodynamic property of the atmosphere and expresses the way a parcel of air will cool on rising or warm on falling, provided there is no exchange of heat with the surroundings and no water condensing or evaporating. The environmental lapse rate, , is seldom equal to exactly the dry adiabatic lapse rate because radiative processes and phase changes constantly redistribute heat. The mean lapse rate is about 6.5 K/km.
Problem left to the students: Derive a new expression for the change in pressure with height for an atmosphere with a constant lapse rate,
ZTTZ 0

2. STABILITY AND THERMODYNAMIC DIAGRAMS
Gray lines – thermodynamic property
Black lines – measurements or soundings
Three days
a < γ₀ stable
b = γ₀ neutrally stable
c > γ₀ unstable
On day a a parcel will cool more quickly than surroundings – air will be cooler and return to original altitude.
On day b a parcel will always have same temperature as surroundings – no force of buoyancy.
On day c a parcel will cool more slowly than surroundings – air will be warmer and rise.

17
Convective Instabilitydry air
cba

Example 1, early morning
Pressure, mb Temp., °C Dew point, °C
1000 7 6
920 7 7
870 6 0
840 3.5 -1.5
700 -8 -16
500 -27 -36
300 -58
250 -67
200 -65
Tropopause
Inversion layer
Saturated air
(T = TD)

Example 2, mid-day
Pressure, mb Temp., °C Dew point, °C
1000 8.5 5.5
860 0.5 -3
710 -8 -17
550 -21.5 -31.5
490 -22.5 -45
330 -45
285 -51
200 -51
Tropopause
Frontal Inversion layer

Skew-T handout
Very important for air pollution and mixing of emissions with free troposphere. Formation of thermal inversions.
In the stratosphere the temperature increases with altitude, thus stable or stratified.
DFN: Potential temperature, θ : The temperature that a parcel of air would have if it were brought to the 1000 hPa level (near the surface) in a dry adiabatic process. You can approximate it quickly,
or a proper derivation from dq = CpdT – dp = 0 yields:
0 ZTZz
θz = T (1000 hPa/Pz) R’/Cp
= T (1000 hPa/Pz)0.286

DIURNAL CYCLE OF SURFACE HEATING/COOLING:
z
T0
1 km
MIDDAY
NIGHT
MORNING
Mixingdepth
Subsidenceinversion
NIGHT MORNING AFTERNOON

22
If the parcel reaches saturation, the condensation of water adds heat, and the rising air cools at a new, slower rate, s. For details, see Wallace and Hobbs.Since s< d, we must also consider conditions between the two stability criteria for dry and saturated.
unstable Absolutely
neutralDry
unstablelly Conditiona
neutral Saturated
stable Absolutely
d
d
ds
s
s
= parcel lapse (thermodynamically determined) rate. = environment (observed) lapse rate.

Plume looping, Baltimore ~2pm.


Plume Lofting, Beijing in Winter ~7am.

High levels of air pollution in Beijing contain a large quantity of PM 2.5. © iStockPhoto.com/beijingstory.
Marshall J PNAS 2013;110:8756-8756
©2013 by National Academy of Sciences

Chinese Y12 (Twin Otter) for the airborne campaign over NE China April 2005

►
►
►
►


~ 100 μg m-3 ↓↑ ~ 15 μg m-3

5 April 2005 Ahead of Front
0
500
1000
1500
2000
2500
3000
3500
4000
0 200 400 600 800 1000 1200 1400
[CO] (ppb)
Alt
itu
de
(m)
← Shenyang, 5 April 2005
← NE USA median

Mean SO2 in NE China and NE US
0
500
1000
1500
2000
2500
3000
3500
4000
4500
0 5 10 15 20 25SO2 (ppb)
Alt
itu
de
(m
)
NE China mean (8flights from April 2005)
NE US mean (381flights from 2000-2003)
NE China flight aheadof cold front 5 April2005)

Washington, DC
✪ Washington, DC
Baltimore, MD
DISCOVER-AQ Case StudyMODIS true color image 21 July 2011
Bay breeze:Winds veer w/ alt

Hot (Tmax > 100oF)Humid, rel stable PBL.
UMD Cessna


PM2.5 ~ 40 g m-3

UMD Cessna

Copyright R. R. Dickerson 2011 42
Atmospheric Circulation and Winds

Copyright R. R. Dickerson 2011 43
ITCZ

Copyright R. R. Dickerson 2011 44
Mid latitude cyclone with fronts

Copyright R. R. Dickerson 2011 45Fig. 9.13
Warm Front

Copyright R. R. Dickerson 2011 46Fig. 9.15
Cold front
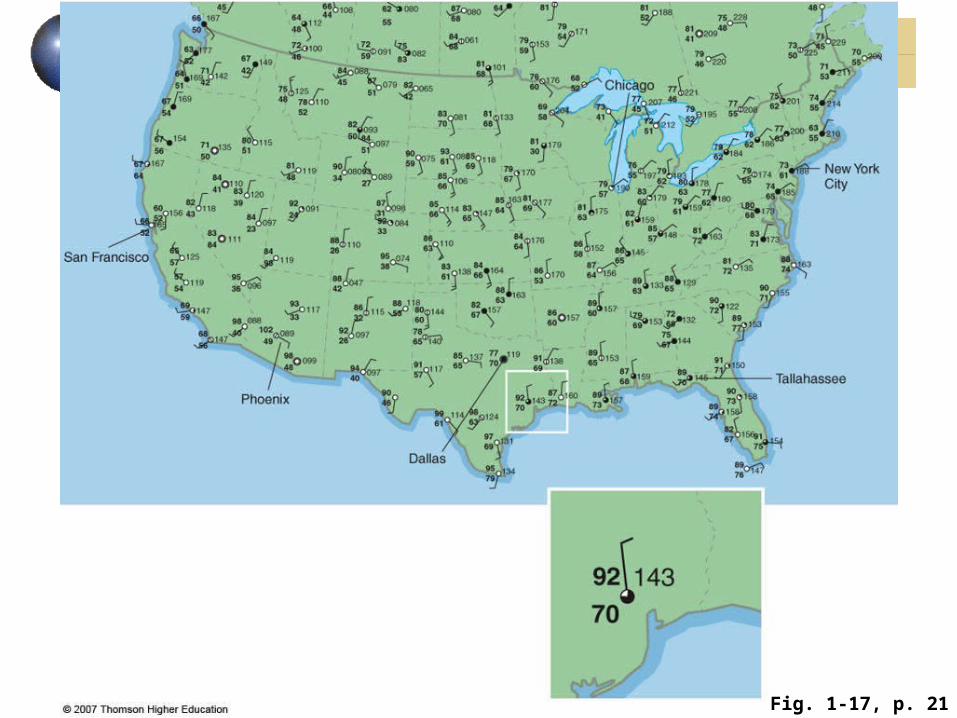
Copyright R. R. Dickerson 2011 47Fig. 1-17, p. 21

Copyright R. R. Dickerson 2011 48Fig. 1-16, p. 19

Copyright R. R. Dickerson 2011 49Fig. 1-16, p. 19

Copyright R. R. Dickerson 2011 50
Detailed weather symbols