Lecture 21 Confidence Intervals T and Chi squared ...
30
Sample Variance 1 ଵ ଶ ଶ ଶ ୀଵ ଶ ଶ ୀଵ
Transcript of Lecture 21 Confidence Intervals T and Chi squared ...
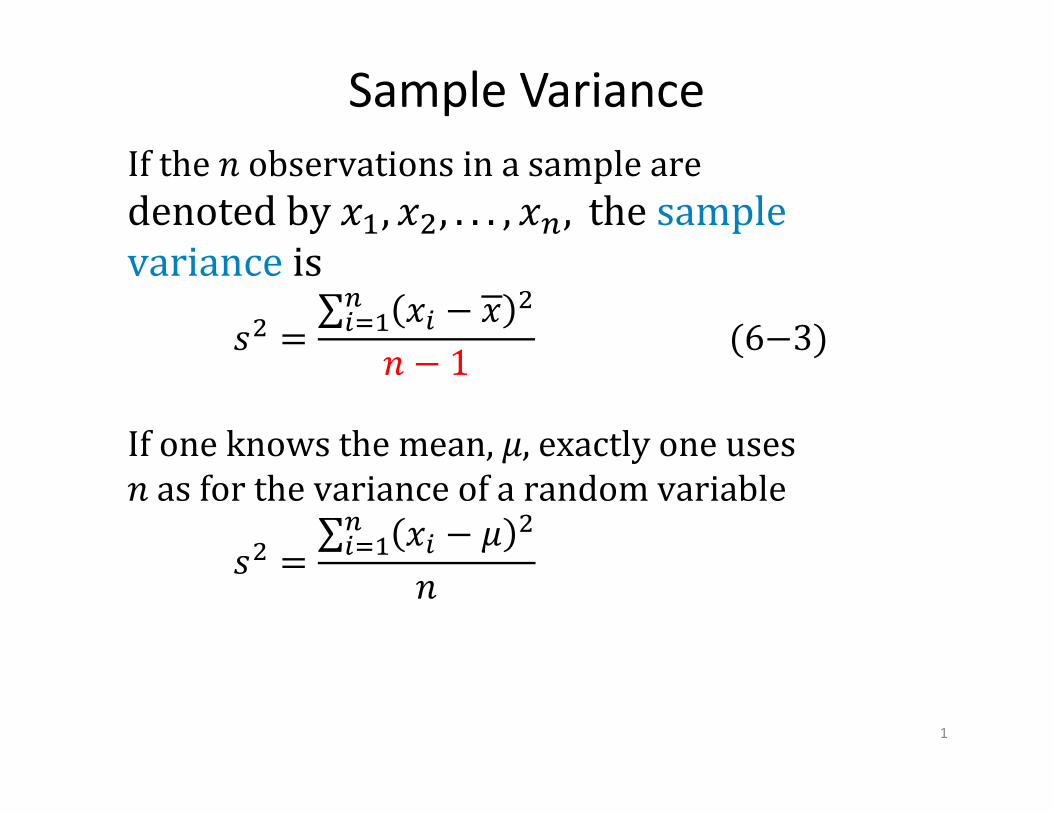
Sample Variance
1

Why divide by n‐1?
• The sample mean is on average closer to sample points , than the true mean .
• Why? Consider a sample of size n=1. Then = while µ≠ . Dividing by n would give s=0, while dividing by n‐1 would leave s undefined (0/0)
• For n=2, is exactly halfway between and while µ is further apart
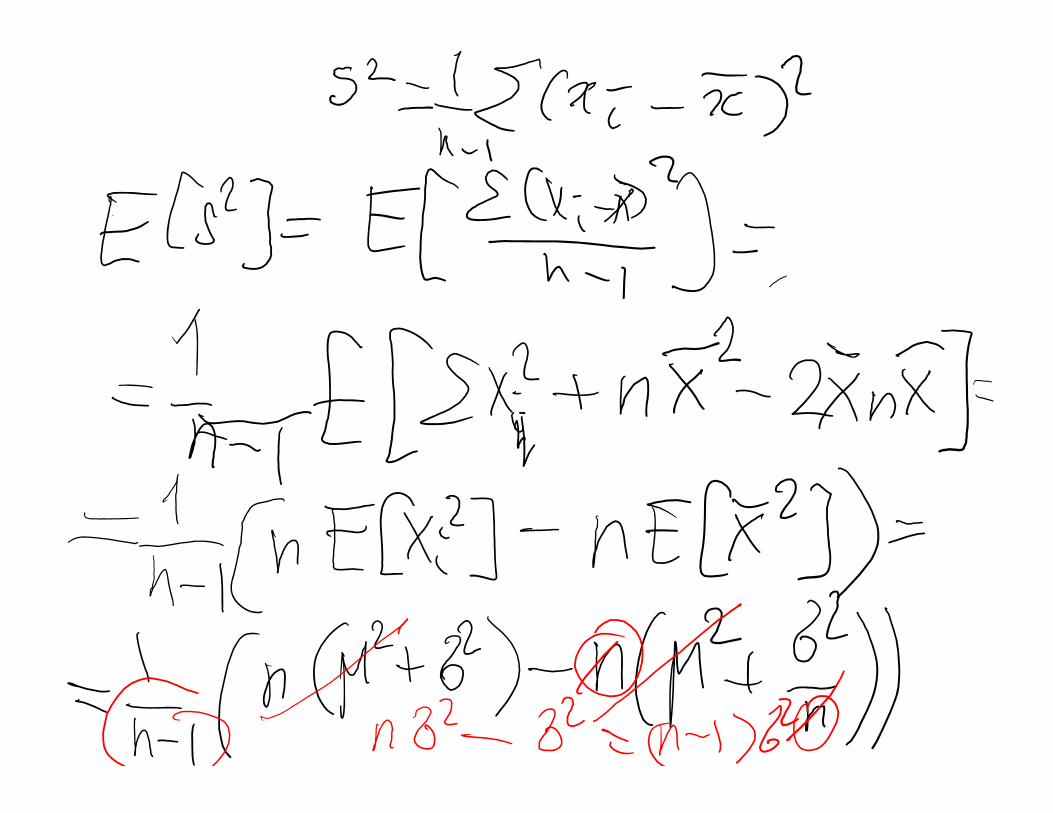
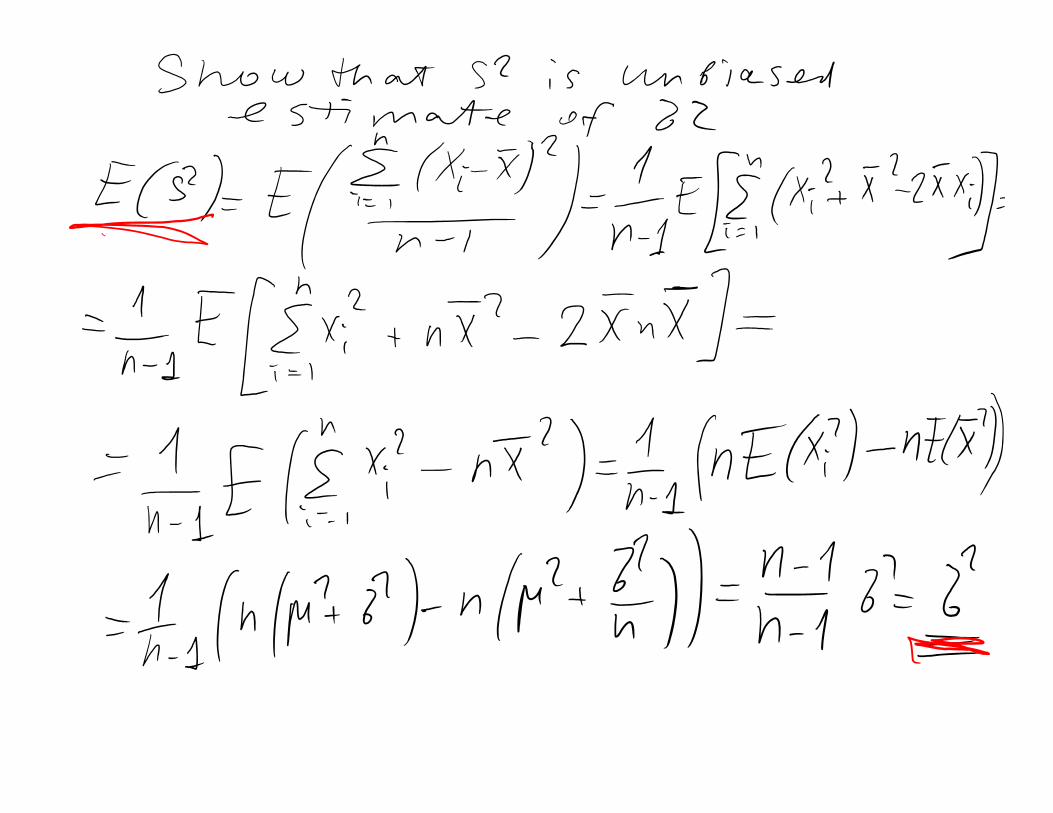

Example 7‐4: Sample Variance S2 is Unbiased
Sec 7‐3.1 Unbiased Estimators 5
𝐸 𝑆 𝐸∑ 𝑋 𝑋
𝑛 11
𝑛 1𝐸 𝑋 𝑋 2𝑋𝑋
1𝑛 1 𝐸 𝑋 𝑛𝑋
1𝑛 1 𝜇 𝜎 𝑛 𝜇
𝜎𝑛
1𝑛 1 𝑛𝜇 𝑛𝜎 𝑛𝜇 𝜎
1𝑛 1 𝑛 1 𝜎
Confidence Intervals

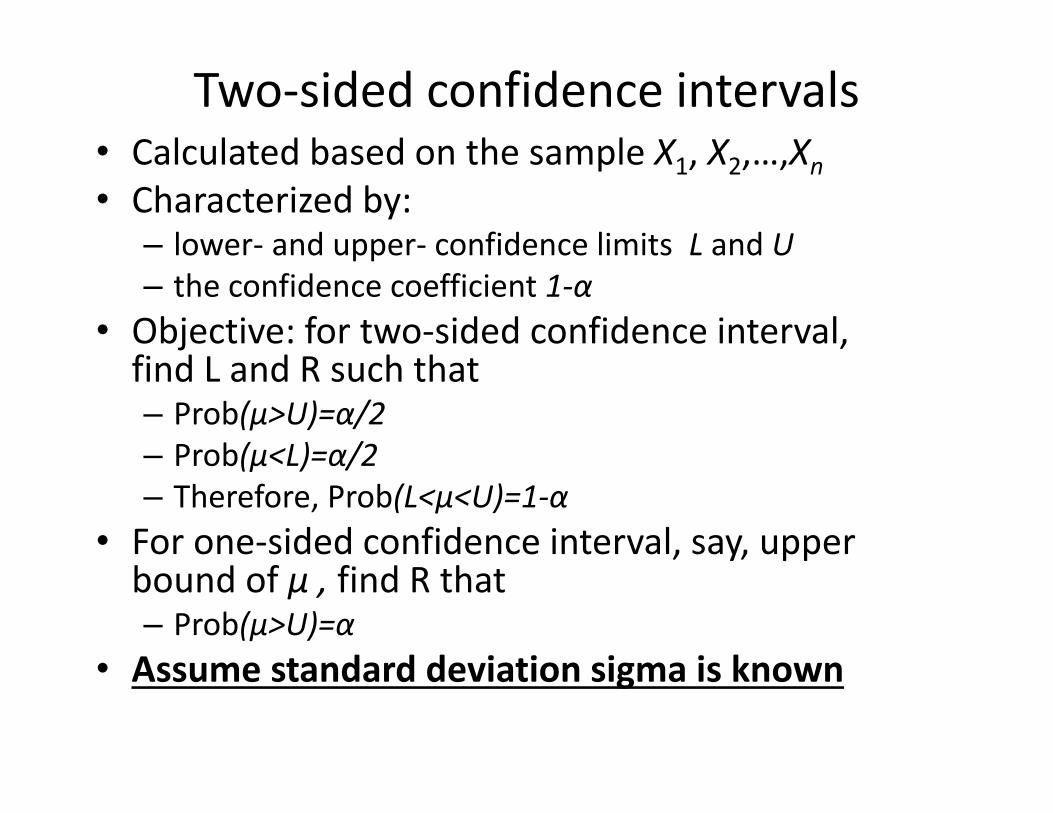
• Calculated based on the sample X1, X2,…,Xn• Characterized by: – lower‐ and upper‐ confidence limits L and U– the confidence coefficient 1‐α
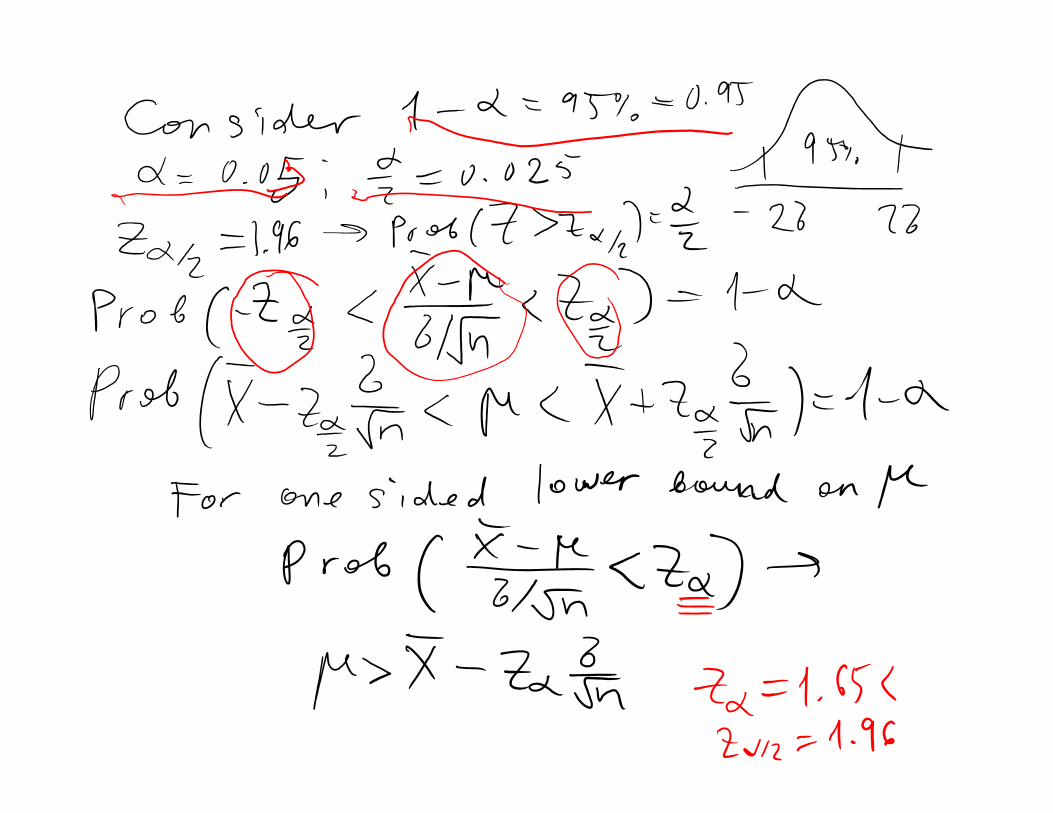
• Objective: for two‐sided confidence interval, find L and R such that – Prob(μ>U)=α/2– Prob(μ<L)=α/2– Therefore, Prob(L<μ<U)=1‐α
• For one‐sided confidence interval, say, upper bound of μ , find R that – Prob(μ>U)=α
• Assume standard deviation sigma is known
Two‐sided confidence intervals

𝜶 𝟐⁄ 𝜶 𝟐⁄
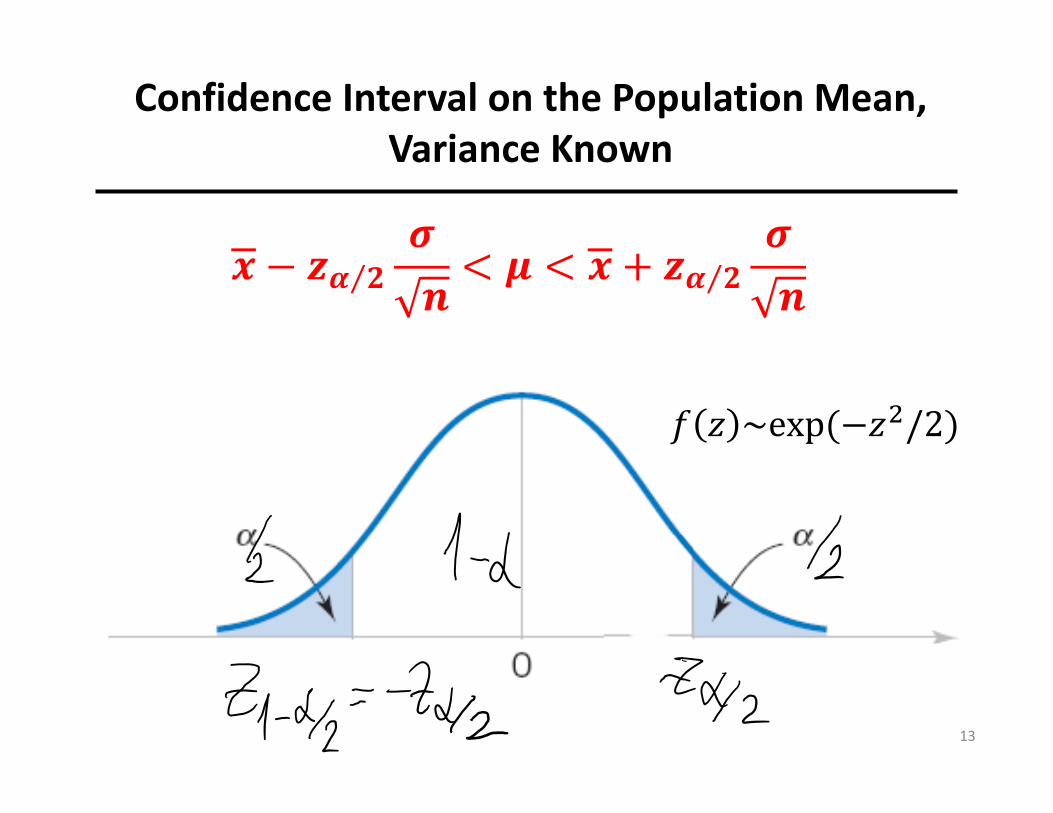
Confidence Interval on the Population Mean, Variance Known
13
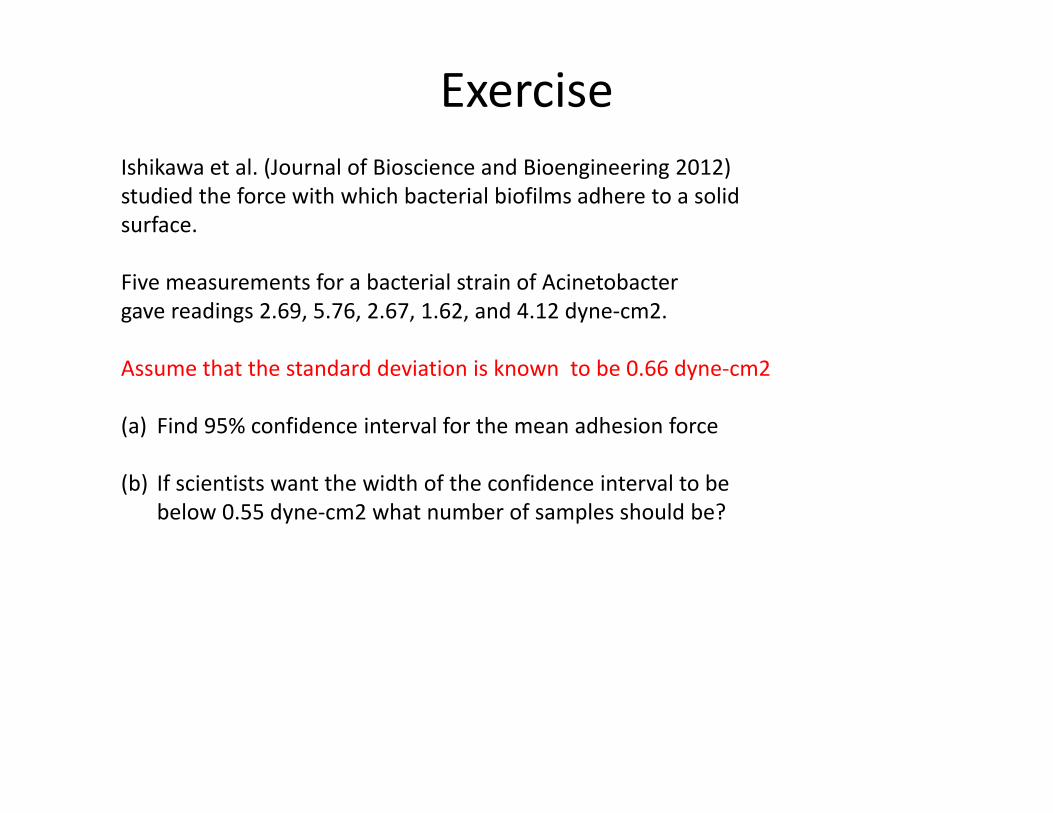
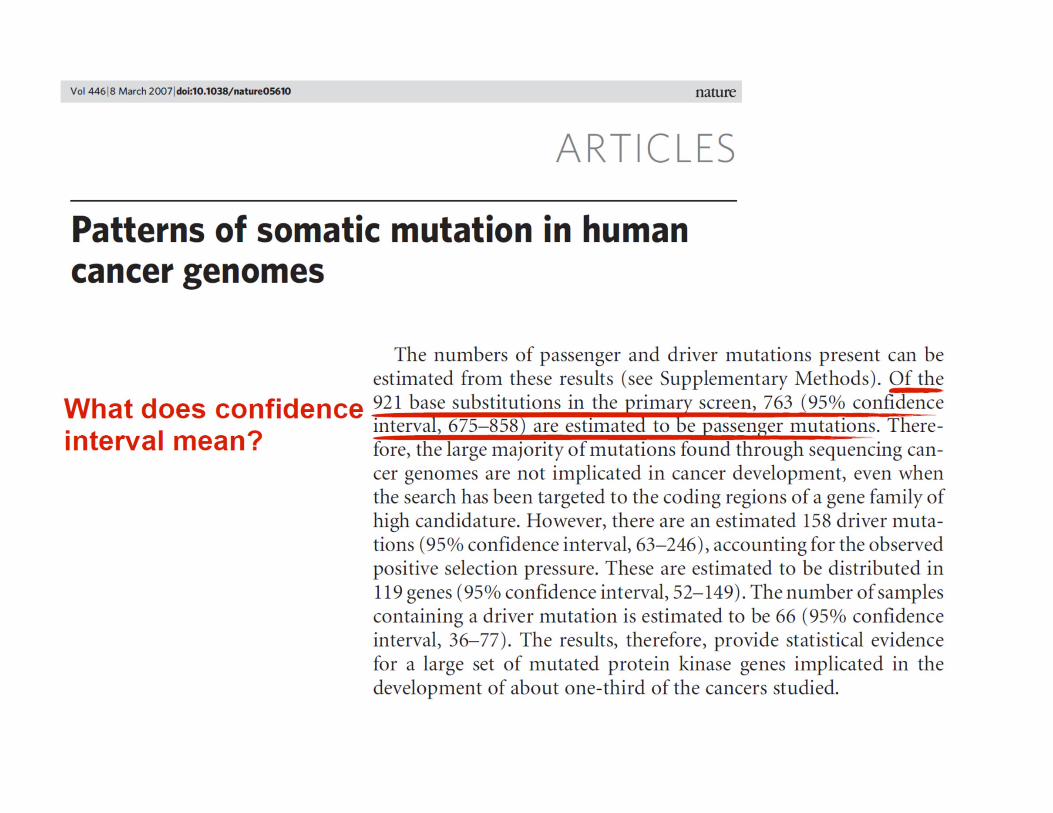
Ishikawa et al. (Journal of Bioscience and Bioengineering 2012) studied the force with which bacterial biofilms adhere to a solid surface.
Five measurements for a bacterial strain of Acinetobactergave readings 2.69, 5.76, 2.67, 1.62, and 4.12 dyne‐cm2.
Assume that the standard deviation is known to be 0.66 dyne‐cm2
(a) Find 95% confidence interval for the mean adhesion force
(b) If scientists want the width of the confidence interval to be below 0.55 dyne‐cm2 what number of samples should be?
Exercise

Ishikawa et al. (Journal of Bioscience and Bioengineering 2012) studied the force with which bacterial biofilms adhere to a solid surface. Five measurements for a bacterial strain of Acinetobacter gavereadings 2.69, 5.76, 2.67, 1.62, and 4.12 dyne‐cm2. Assume that the standard deviation is known to be 0.66 dyne‐cm2
(a) Find 95% confidence interval for the mean adhesion force
(b) If scientists want the width of the confidence interval to be below 0.55 dyne‐cm2 what number of samples should be?
3.372,
2 2
Matlab exercise
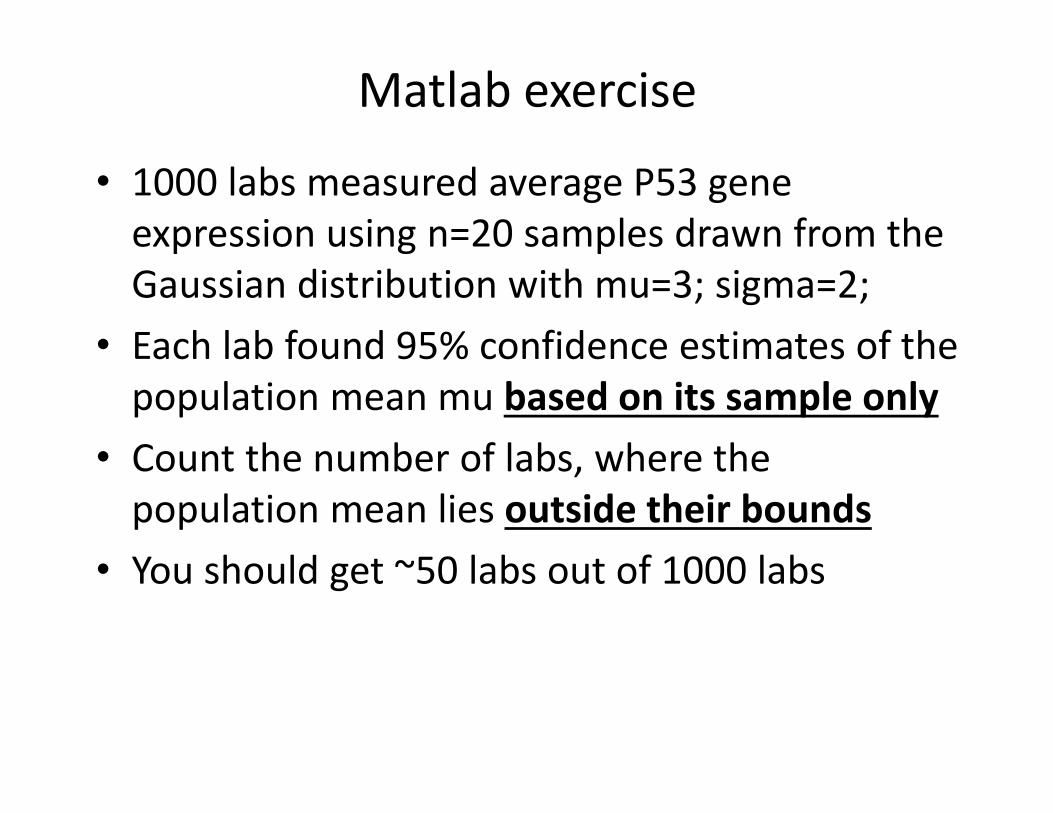
• 1000 labs measured average P53 gene expression using n=20 samples drawn from the Gaussian distribution with mu=3; sigma=2;
• Each lab found 95% confidence estimates of the population mean mu based on its sample only
• Count the number of labs, where the population mean lies outside their bounds
• You should get ~50 labs out of 1000 labs

How I did it • n=20; k_labs=1000;• rand_table=2.*randn(n,k_labs)+3;• sample_mean=mean(rand_table,1);• CI_low=sample_mean‐1.96.*2./sqrt(n);• CI_high=sample_mean+1.96.*2./sqrt(n);• k_above=sum(3>CI_high)• k_below=sum(3<CI_low)• figure; ndisp=100; errorbar(1:ndisp, sample_mean(1:ndisp),ones(ndisp,1).*1.96.*2./sqrt(n),'ko');
• hold on; plot(1:ndisp, 3.*ones(ndisp,1),'r‐');
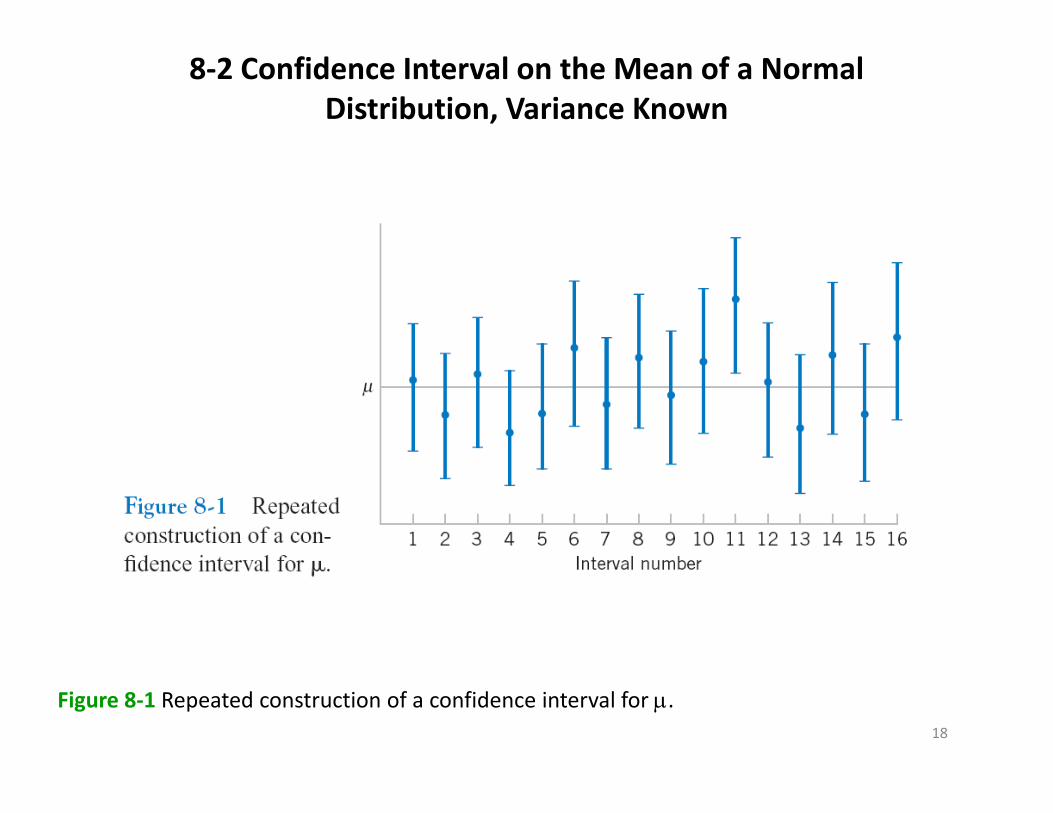
8‐2 Confidence Interval on the Mean of a Normal Distribution, Variance Known
Figure 8‐1 Repeated construction of a confidence interval for .18

So far in estimating confidence intervals for population mean we assumed that the population variance σ2
is known
Then (or when n>>1, say 20 and above) one can use the Normal Distribution to calculate confidence intervals
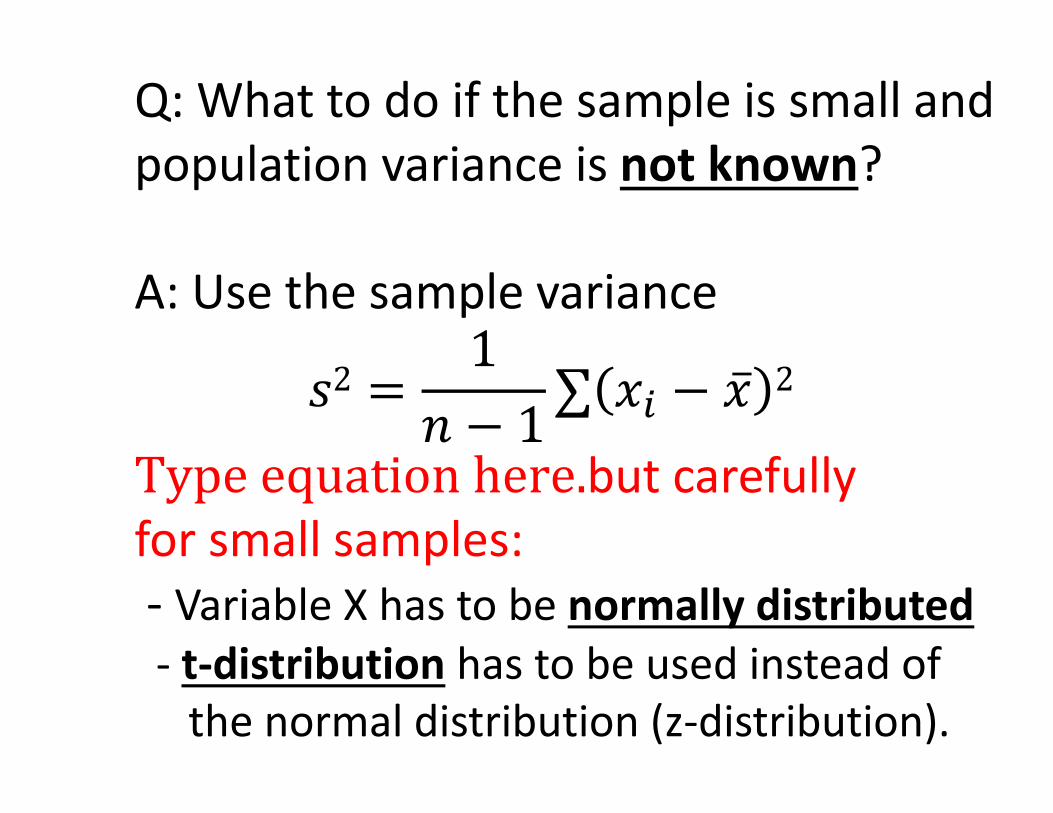
Q: What to do if the sample is small and population variance is not known?
A: Use the sample variance
but carefully for small samples:‐ Variable X has to be normally distributed‐ t‐distribution has to be used instead of the normal distribution (z‐distribution).
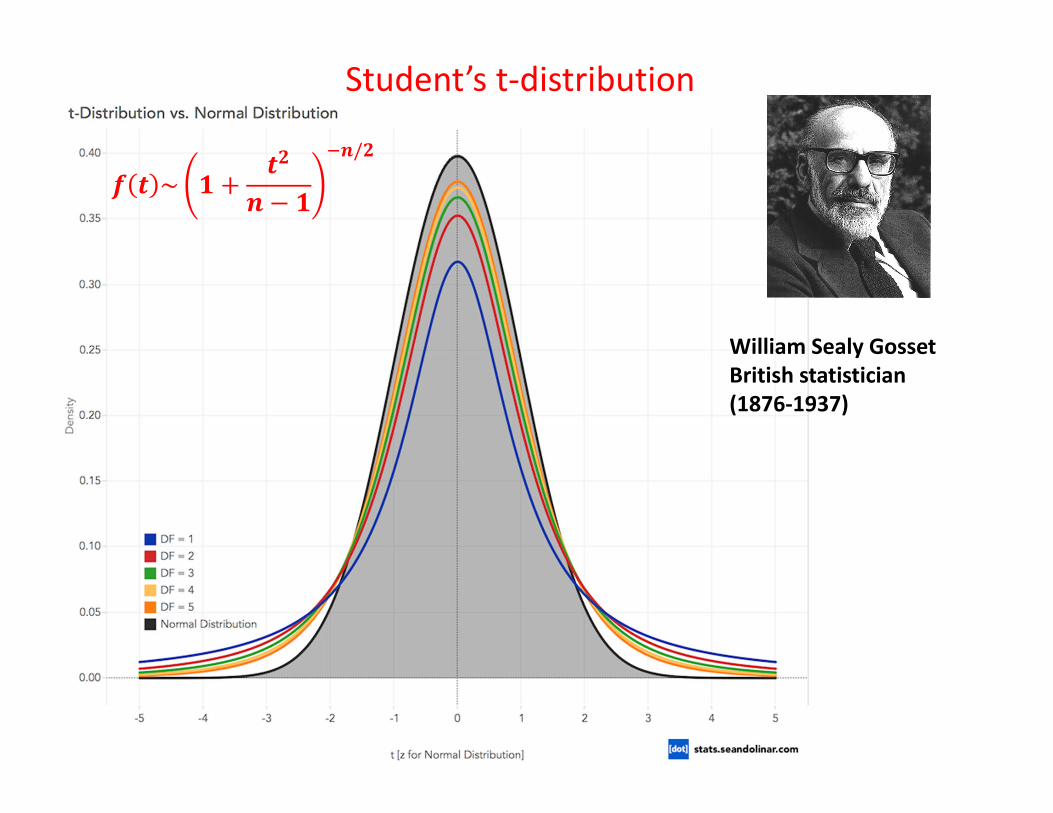
William Sealy GossetBritish statistician (1876‐1937)
Student’s t‐distribution
𝒇 𝒕 ~ 𝟏𝒕𝟐
𝒏 𝟏
𝒏/𝟐
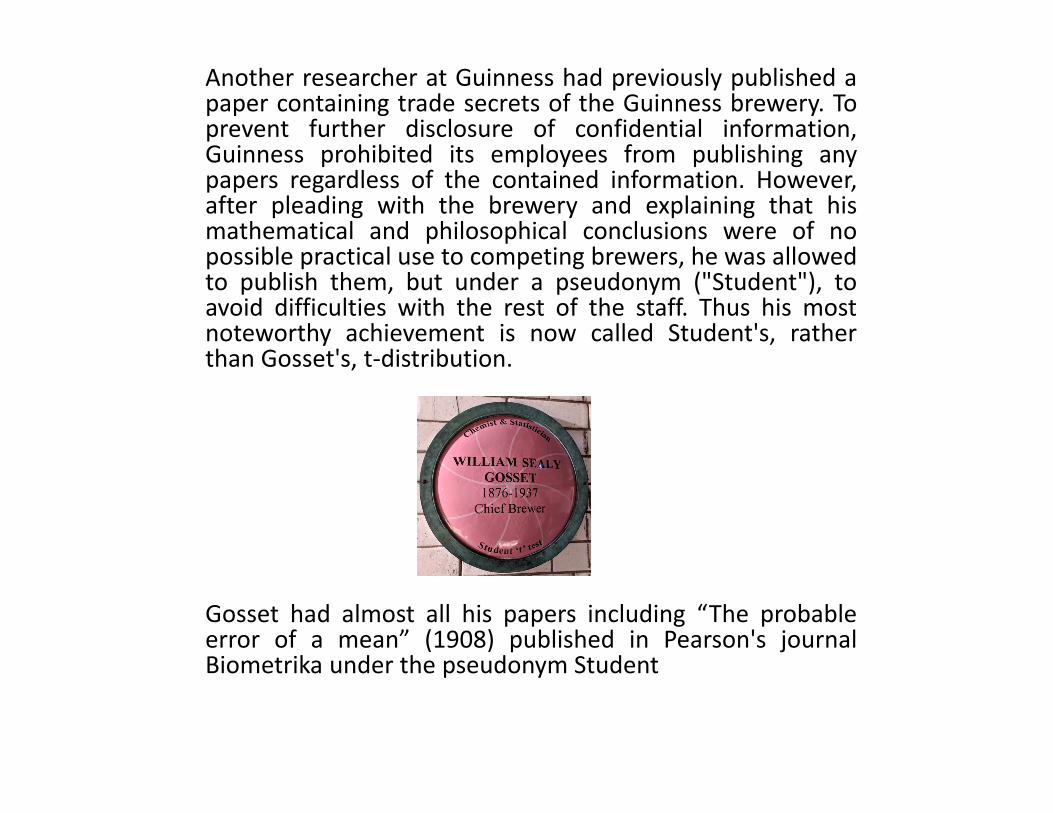
Another researcher at Guinness had previously published apaper containing trade secrets of the Guinness brewery. Toprevent further disclosure of confidential information,Guinness prohibited its employees from publishing anypapers regardless of the contained information. However,after pleading with the brewery and explaining that hismathematical and philosophical conclusions were of nopossible practical use to competing brewers, he was allowedto publish them, but under a pseudonym ("Student"), toavoid difficulties with the rest of the staff. Thus his mostnoteworthy achievement is now called Student's, ratherthan Gosset's, t‐distribution.
Gosset had almost all his papers including “The probableerror of a mean” (1908) published in Pearson's journalBiometrika under the pseudonym Student

Play with Mathematica notebook
http://demonstrations.wolfram.com/ComparingNormalAndStudentsTDistributions/
By Gary McClelland

Student’s tdistribution
8‐3 Confidence Interval on the Mean of a Normal Distribution, Variance Unknown
24
/
𝜶 𝟐,𝒏 𝟏⁄
𝜶 𝟐,𝒏 𝟏⁄
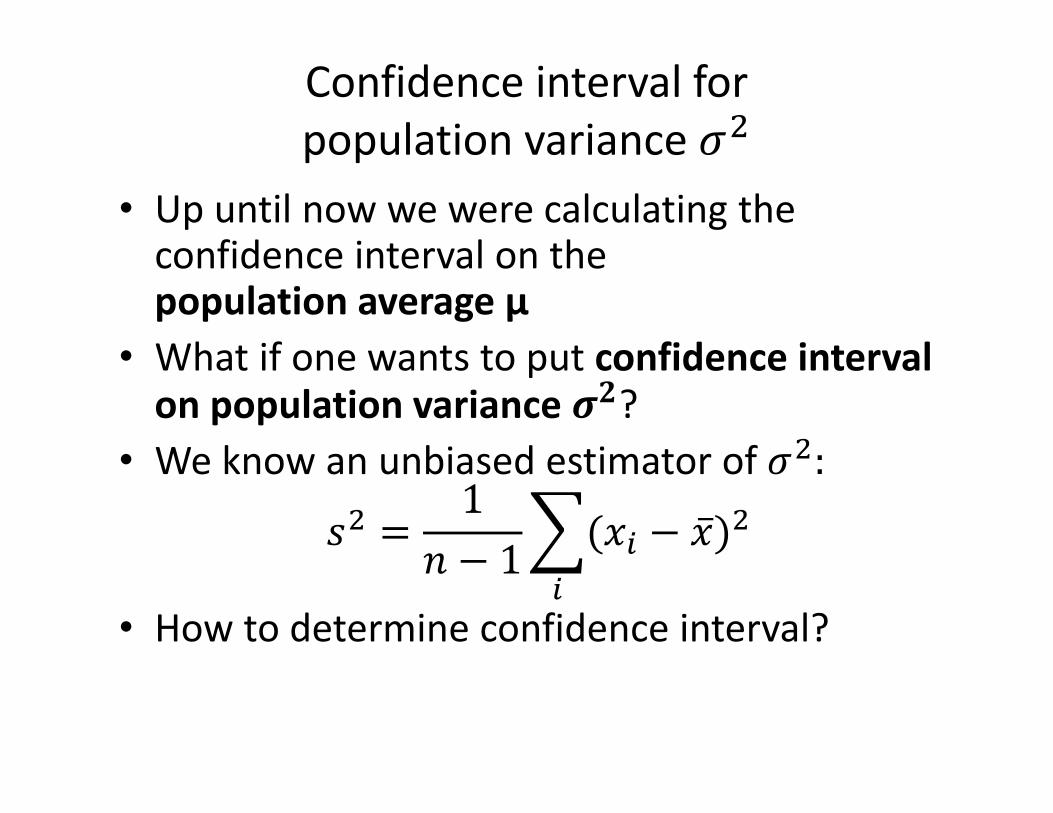
Confidence interval for population variance
• Up until now we were calculating the confidence interval on the population average µ
• What if one wants to put confidence interval on population variance 𝟐?
• We know an unbiased estimator of
• How to determine confidence interval?
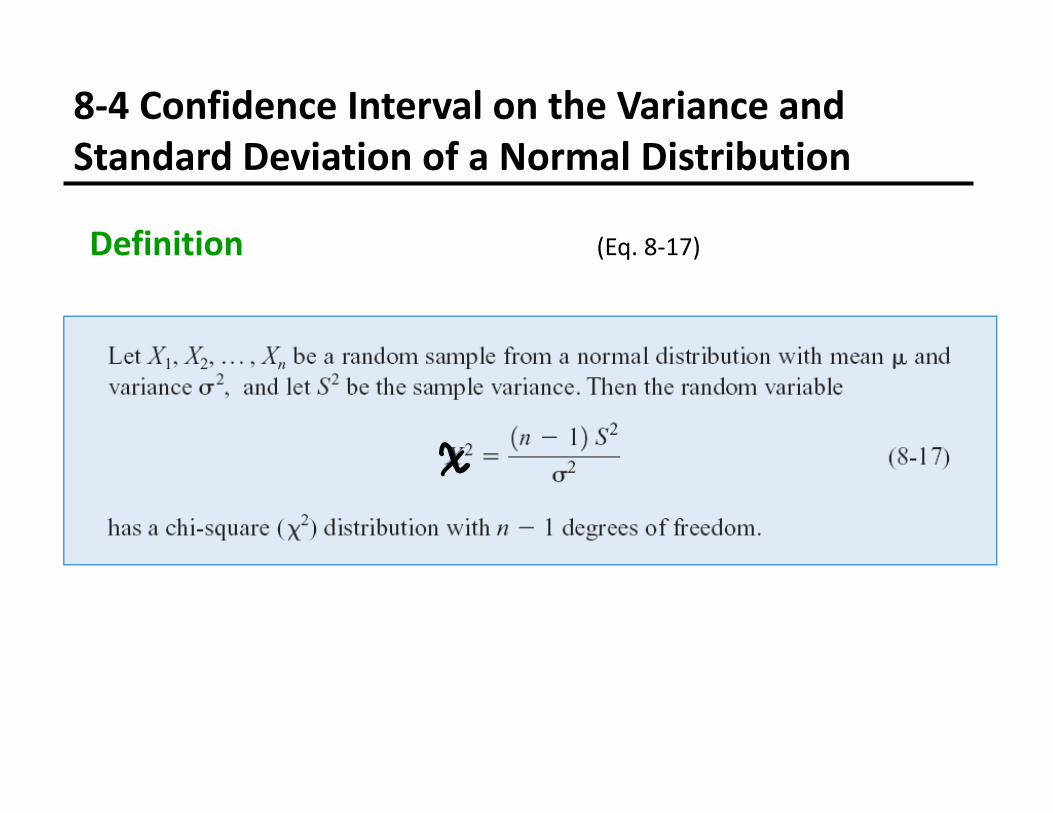
Definition (Eq. 8‐17)
8‐4 Confidence Interval on the Variance and Standard Deviation of a Normal Distribution

27
8‐4 Confidence Interval on the Variance and Standard Deviation of a Normal Distribution
k=n‐1
X=(n‐1)S2/σ2We know n, S2 want to estimate σ2
f(x,n) ~ x(n‐1)/2‐1exp(‐x/2)
It is just Gamma PDFwith r=(n‐1)/2, and λ=1/2
Mean value:n‐1
Standard deviation:

Play with Mathematica notebook
http://demonstrations.wolfram.com/ChiSquaredDistributionAndTheCentralLimitTheorem/
By Peter Falloon
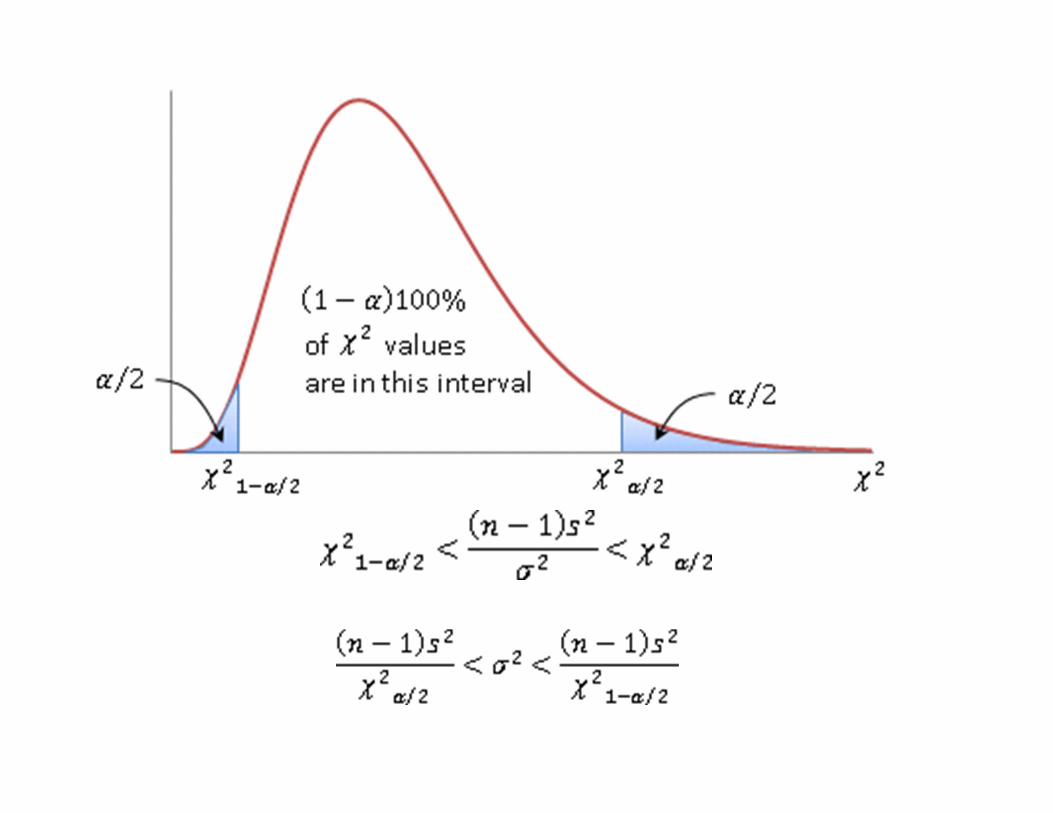

Definition (Eq. 8‐19)
8‐4 Confidence Interval on the Variance and Standard Deviation of a Normal Distribution
30