Lecture 2: Software Metrics - swt.informatik.uni … Area Project Management: Content...
48
– 2 – 2017-04-27 – main – Softwaretechnik / Software-Engineering Lecture 2: Software Metrics 2017-04-27 Prof. Dr. Andreas Podelski, Dr. Bernd Westphal Albert-Ludwigs-Universität Freiburg, Germany
Transcript of Lecture 2: Software Metrics - swt.informatik.uni … Area Project Management: Content...

–2
–2
017
-04
-27
–m
ain
–
Softwaretechnik / Software-Engineering
Lecture 2: Software Metrics
2017-04-27
Prof. Dr. Andreas Podelski, Dr. Bernd Westphal
Albert-Ludwigs-Universität Freiburg, Germany

Topic Area Project Management: Content–
2–
20
17-0
4-2
7–
Sb
lock
con
ten
t–
2/42
•VL 2 Software Metrics
• Properties of Metrics
• Scales
• Examples
• Cost Estimation
• Deadlines and Costs
• Expert’s Estimation
• Algorithmic Estimation
• Project Management
• Project
• Process and Process Modelling
• Procedure Models
• Process Models
•...
Process Metrics
• CMMI, Spice
.
..
VL 3
.
..
VL 4
.
..
VL 5

Content–
2–
20
17-0
4-2
7–
Sco
nte
nt
–
3/42
• Survey: Expectations on the Course
• Software Metrics
• Motivation
• Vocabulary
• Requirements on Useful Metrics
• Excursion: Scales
• Excursion Excursion: Mean, Median, Quartiles
• Example: LOC
• Other Properties of Metrics
• Base Measures vs. Derived Measures
• Subjective and Pseudo Metrics
• Discussion

Survey: Previous Experience–
2–
20
17-0
4-2
7–
Se
xpe
ctat
ion
s–
4/42
10
20
30
0 1 2 3 4 5 6 7 8 9 10
Project Management
10
20
30
0 1 2 3 4 5 6 7 8 9 10
Requirements Engineering
10
20
30
0 1 2 3 4 5 6 7 8 9 10
Programming
10
20
30
0 1 2 3 4 5 6 7 8 9 10
Design Modelling
10
20
30
0 1 2 3 4 5 6 7 8 9 10
Software Quality Assurance
westphal
Bleistift
westphal
Bleistift
westphal
Bleistift

Expectations–
2–
20
17-0
4-2
7–
Se
xpe
ctat
ion
s–
5/42
• general
✔ work with others in a large software development team
✔ communicate results to other people
✔ learn how to properly document the work
✔ know, how to acquire knowledge on aspects of SW Eng. on our own
✔ get to know industry standards, investigate their strengths / weaknesses
✔ overview, terminology, and references for own enquiries
✘ know about trustful internet sources to get such information whileworking
✔ understanding the procedure of software production, including commonmishaps at each step
✔ systematically analyse the steps of software development which are done“implicitly” in smaller, self-made projects
✔ course is balanced with theoretical as well as practical scenarios
✔ getting tools (roughly specific ideas) for attacking problems
✔ have some fun, learn a lot [...] not only for the further studying or workingbut also for life
• other courses
(✘) Vorallem hoffe ich auf eine sinnvolle Verbindung zum Softwarepraktikum.
Introduction L 1: 24.4., Mon
Scales, Metrics, L 2: 27.4., Thu
- 1.5., Mon
T 1: 4.5., Thu
Costs, L 3: 8.5., MonDevelopment L 4: 11.5., Thu
Process L 5: 15.5., Mon
T 2: 18.5., Thu
L 6: 22.5., Mon
- 25.5., Thu
L 7: 29.5., MonRequirementsEngineering L 8: 1.6., Thu
- 5.6., Mon
- 8.6., Thu
T 3: 12.6., Mon
- 15.6., Thu
L 9: 19.6., Mon
L10: 22.6., Thu
Arch. & Design L 11: 26.6., Mon
T 4: 29.6., Thu
L 12: 3.7., Mon
L 13: 6.7., ThuSoftwareModelling
L 14: 10.7., Mon
T 5: 13.7., Thu
Patterns L 15: 17.7., Mon
L16: 20.7., ThuQA (Testing,Formal Verif.) L 17: 24.7., Mon
Wrap-Up L18: 27.7., Thu
westphal
Bleistift
westphal
Bleistift
westphal
Bleistift
westphal
Bleistift
westphal
Bleistift

Expectations Cont’d–
2–
20
17-0
4-2
7–
Se
xpe
ctat
ion
s–
6/42
• project management
✔ minimize risks, estimate project duration,
(✘) the financial part: how much money can can you demand for software?
(✔) how to estimate cost/time, without resorting to years of experience
✔ different life stages of a software
✔ become acquainted with the most common procedures of softwaredevelopment
✔ selection of right process for a project.
(✘) learn how things are done in real companies
• requirements
✔ How to communicate between customer and software team effectively
✔ formalise software engineering problems
✔ learn how to specify the requirements
(✔) how to write something based on customer’s wishes, which isunambiguous (for the programmers), but understandable for thecustomer, such that the customers can check on their own what is meant.
Introduction L 1: 24.4., Mon
Scales, Metrics, L 2: 27.4., Thu
- 1.5., Mon
T 1: 4.5., Thu
Costs, L 3: 8.5., MonDevelopment L 4: 11.5., Thu
Process L 5: 15.5., Mon
T 2: 18.5., Thu
L 6: 22.5., Mon
- 25.5., Thu
L 7: 29.5., MonRequirementsEngineering L 8: 1.6., Thu
- 5.6., Mon
- 8.6., Thu
T 3: 12.6., Mon
- 15.6., Thu
L 9: 19.6., Mon
L10: 22.6., Thu
Arch. & Design L 11: 26.6., Mon
T 4: 29.6., Thu
L 12: 3.7., Mon
L 13: 6.7., ThuSoftwareModelling
L 14: 10.7., Mon
T 5: 13.7., Thu
Patterns L 15: 17.7., Mon
L16: 20.7., ThuQA (Testing,Formal Verif.) L 17: 24.7., Mon
Wrap-Up L18: 27.7., Thu
westphal
Bleistift

Expectations Cont’d–
2–
20
17-0
4-2
7–
Se
xpe
ctat
ion
s–
7/42
• design
✔ techniques and vocabulary to express design
✔ learn how to use basic and maybe some advanced techniques, modelsand patterns in software development
✔ the modern techniques: [...] Test Driven Design, Behaviour Driven Design
✔ acquire knowledge in UML
✔ principles of reasonable software architectures
(✘) verification of architectures
(✔) what distinguished well-designed SW from bad-designed ones
✘ how to quantify and check things like “good usability”
✘ focus on software architecture
• Implementation
(✘) write reusable and maintainable code
(✘) knowing the adequate codes for the certain software
• Quality Assurance
(✔) Which software qualities are more important for different types of SW?
(✘) test code in a reusable efficient way
(✔) extend my basic knowledge on verification methods (unit tests etc.)
(✘) conduct a review
Introduction L 1: 24.4., Mon
Scales, Metrics, L 2: 27.4., Thu
- 1.5., Mon
T 1: 4.5., Thu
Costs, L 3: 8.5., MonDevelopment L 4: 11.5., Thu
Process L 5: 15.5., Mon
T 2: 18.5., Thu
L 6: 22.5., Mon
- 25.5., Thu
L 7: 29.5., MonRequirementsEngineering L 8: 1.6., Thu
- 5.6., Mon
- 8.6., Thu
T 3: 12.6., Mon
- 15.6., Thu
L 9: 19.6., Mon
L10: 22.6., Thu
Arch. & Design L 11: 26.6., Mon
T 4: 29.6., Thu
L 12: 3.7., Mon
L 13: 6.7., ThuSoftwareModelling
L 14: 10.7., Mon
T 5: 13.7., Thu
Patterns L 15: 17.7., Mon
L16: 20.7., ThuQA (Testing,Formal Verif.) L 17: 24.7., Mon
Wrap-Up L18: 27.7., Thu
westphal
Bleistift

Content–
2–
20
17-0
4-2
7–
Sco
nte
nt
–
8/42
• Survey: Expectations on the Course
• Software Metrics
• Motivation
• Vocabulary
• Requirements on Useful Metrics
• Excursion: Scales
• Excursion Excursion: Mean, Median, Quartiles
• Example: LOC
• Other Properties of Metrics
• Base Measures vs. Derived Measures
• Subjective and Pseudo Metrics
• Discussion

Software Metrics
–2
–2
017
-04
-27
–m
ain
–
9/42

–2
–2
017
-04
-27
–S
me
tric
intr
o–
10/42
Engineering vs. Non-Engineering–
1–
20
16-0
4-1
8–
Se
ngi
ne
eri
ng
–
6/36
workshop(technical product)
studio(artwork)
Mentalprerequisite
the existing andavailable technicalknow-how
artist’s inspiration,among others
Deadlines can usually be plannedwith sufficient precision
cannot be planned dueto dependency onartist’s inspiration
Price oriented on cost,thus calculable
determined by marketvalue, not by cost
Norms andstandards
exist, are known, andare usually respected
are rare and, if known,not respected
Evaluation andcomparison
can be conducted usingobjective, quantifiedcriteria
is only possiblesubjectively,results are disputed
Author remains anonymous,often lacks emotionalties to the product
considers the artwork aspart of him/herself
Warranty andliability
are clearly regulated,cannot be excluded
are not defined and inpractice hardlyenforceable
(Ludewig and Lichter, 2013)
westphal
Bleistift
westphal
Bleistift

Vocabulary–
2–
20
17-0
4-2
7–
Svo
cab
ula
ry–
11/42
metric — A quantitative measure of the degree to which a system, component, or pro-cess posesses a given attribute.See: quality metric. IEEE 610.12 (1990)
quality metric —
(1) A quantitative measure of the degree to which an item possesses a given qualityattribute.
(2) A function whose inputs are software data and whose output is a single numericalvalue that can be interpreted as the degree to which the software possesses a givenquality attribute. IEEE 610.12 (1990)

Software Metrics: Motivation and Goals–
2–
20
17-0
4-2
7–
Sgo
als
–
12/42
Important motivations and goals for using software metrics:
• specify quality requirements
• assess the quality of products and processes
• quantify experience, progress, etc.
• predict cost/effort, etc.
• support decisions
Software metrics can be used:
• prescriptive, e.g., “all prodecures must not have more then N parameters”, or
• descriptive, e.g., “procedure P has N parameters”.
A descriptive metric can be
• diagnostic, e.g., “the test effort was N hours”, or
• prognostic, e.g., “the expected test effort is N hours”.
Note: prescriptive and prognostic are different things.
• Examples: support decisions by diagnostic measurements:
(i) Measure CPU time spent per procedure, then “optimize” most time consuming procedure.
(ii) Measure attributes which indicate architecture problems, then re-factor accordingly.
westphal
Bleistift

Recall: Software Quality (ISO/IEC 9126-1:2000 (2000))
–2
–2
017
-04
-27
–S
goal
s–
13/42
software related quality
process quality . . .
product quality
functionality
suitabilityaccuracy
interoperability
security
reliability
maturity
fault tolerancerecoverability
usability
understandability
learnability
operability
attractiveness
efficiencytime behaviour
resource utilisation
maintainability
analysability
changeability
stability
testability
portability
adaptability
installability
co-existence
replaceability
westphal
Bleistift
westphal
Bleistift
westphal
Bleistift
westphal
Bleistift
westphal
Bleistift

Useful Metrics–
2–
20
17-0
4-2
7–
Sgo
als
–
14/42
• For material goods, useful metrics are often pretty obvious:
Th
ors
ten
Har
tman
n,C
CB
Y-S
A3
.0,h
ttp
s://
com
mo
ns.
wik
ime
dia
.org
/w
/in
de
x.p
hp
?cu
rid
=73
7312
Sim
on
A.E
ugs
ter,
CC
BY
-SA
3.0
,co
mm
on
s.w
ikim
ed
ia.o
rg/
w/
ind
ex.
ph
p?c
uri
d=7
90
02
45
• Not so obvious for immaterial goods, like software.
westphal
Bleistift

Content–
2–
20
17-0
4-2
7–
Sco
nte
nt
–
15/42
• Survey: Expectations on the Course
• Software Metrics
• Motivation
• Vocabulary
• Requirements on Useful Metrics
• Excursion: Scales
• Excursion Excursion: Mean, Median, Quartiles
• Example: LOC
• Other Properties of Metrics
• Base Measures vs. Derived Measures
• Subjective and Pseudo Metrics
• Discussion
westphal
Bleistift
westphal
Bleistift

Requirements on Useful Metrics–
2–
20
17-0
4-2
7–
Sre
qo
nm
etr
ics
–
16/42
Definition. A software metric is a function m : P → S which assigns to eachproband p ∈ P a valuation yield (“Bewertung”) m(p) ∈ S. We call S the scale of m.
In order to be useful, a (software) metric should be:
differentiated worst case: same valuation yield for all probands
comparable ordinal scale, better: rational (or absolute) scale (→ in a minute)
reproducible multiple applications of a metric to the same proband shouldyield the same valuation
available valuation yields need to be in place when needed
relevant wrt. overall needs
economical worst case: doing the project gives a perfect prognosis of projectduration — at a high price;irrelevant metrics are not economical (if not available for free)
plausible (→ pseudo-metric)
robust developers cannot arbitrarily manipulate the yield;antonym: subvertible
westphal
Bleistift

Excursion: Scales
–2
–2
017
-04
-27
–m
ain
–
17/42

Scales and Types of Scales–
2–
20
17-0
4-2
7–
Ssc
ale
s–
18/42
Scales S are distinguished by supported operations:
=, 6=<, > (withtransitivity)
min,max
percen-tiles, e.g.median
∆propor-
tionnatural0 (zero)
nominal scale ✔ ✘ ✘ ✘ ✘ ✘ ✘
ordinal scale ✔ ✔ ✔ ✔ ✘ ✘ ✘
interval scale(with units)
✔ ✔ ✔ ✔ ✔ ✘ ✘
rational scale(with units)
✔ ✔ ✔ ✔ ✔ ✔ ✔
absolute scale a rational scale where S comprises the key figures itself
Examples: Nominal Scale
• nationality, gender, car manufacturer, geographic direction, train number, . . .
• Software engineering example: programming language (S = {Java, C, . . . })
→ There is no (natural) order between elements of S; the lexicographic order can be imposed(“C < Java”), but is not related to the measured information (thus not natural).

Scales and Types of Scales–
2–
20
17-0
4-2
7–
Ssc
ale
s–
18/42
Scales S are distinguished by supported operations:
=, 6=<, > (withtransitivity)
min,max
percen-tiles, e.g.median
∆propor-
tionnatural0 (zero)
nominal scale ✔ ✘ ✘ ✘ ✘ ✘ ✘
ordinal scale ✔ ✔ ✔ ✔ ✘ ✘ ✘
interval scale(with units)
✔ ✔ ✔ ✔ ✔ ✘ ✘
rational scale(with units)
✔ ✔ ✔ ✔ ✔ ✔ ✔
absolute scale a rational scale where S comprises the key figures itself
Examples: Ordinal Scale
• strongly agree > agree > disagree > strongly disagree; Chancellor > Minister (administrative ranks);
• leaderboard (finishing number tells us that 1st was faster than 2nd, but not how much faster)
• types of scales, . . .
• Software engineering example: CMMI scale (maturity levels 1 to 5) (→ later)
→ There is a (natural) order between elements of M ,but no (natural) notion of distance or average.

Scales and Types of Scales–
2–
20
17-0
4-2
7–
Ssc
ale
s–
18/42
Scales S are distinguished by supported operations:
=, 6=<, > (withtransitivity)
min,max
percen-tiles, e.g.median
∆propor-
tionnatural0 (zero)
nominal scale ✔ ✘ ✘ ✘ ✘ ✘ ✘
ordinal scale ✔ ✔ ✔ ✔ ✘ ✘ ✘
interval scale(with units)
✔ ✔ ✔ ✔ ✔ ✘ ✘
rational scale(with units)
✔ ✔ ✔ ✔ ✔ ✔ ✔
absolute scale a rational scale where S comprises the key figures itself
Examples: Interval Scale
• temperature in Fahrenheit
• “today it is 10°F warmer than yesterday” (∆(ϑtoday, ϑyesterday) = 10°F)
• “100°F is twice as warm as 50°F”: . . . ? No. Note: the zero is arbitrarily chosen.
• Software engineering example: time of check-in in revision control system
→ There is a (natural) notion of difference ∆ : S × S → R, but no (natural) proportion and 0.

Scales and Types of Scales–
2–
20
17-0
4-2
7–
Ssc
ale
s–
18/42
Scales S are distinguished by supported operations:
=, 6=<, > (withtransitivity)
min,max
percen-tiles, e.g.median
∆propor-
tionnatural0 (zero)
nominal scale ✔ ✘ ✘ ✘ ✘ ✘ ✘
ordinal scale ✔ ✔ ✔ ✔ ✘ ✘ ✘
interval scale(with units)
✔ ✔ ✔ ✔ ✔ ✘ ✘
rational scale(with units)
✔ ✔ ✔ ✔ ✔ ✔ ✔
absolute scale a rational scale where S comprises the key figures itself
Examples: Rational Scale
• age (“twice as old”); finishing time; weight; pressure; price; speed; distance from Freiburg. . .
• Software engineering example: runtime of a program for given inputs.
→ The (natural) zero induces a meaning for proportion m1/m2.

Scales and Types of Scales–
2–
20
17-0
4-2
7–
Ssc
ale
s–
18/42
Scales S are distinguished by supported operations:
=, 6=<, > (withtransitivity)
min,max
percen-tiles, e.g.median
∆propor-
tionnatural0 (zero)
nominal scale ✔ ✘ ✘ ✘ ✘ ✘ ✘
ordinal scale ✔ ✔ ✔ ✔ ✘ ✘ ✘
interval scale(with units)
✔ ✔ ✔ ✔ ✔ ✘ ✘
rational scale(with units)
✔ ✔ ✔ ✔ ✔ ✔ ✔
absolute scale a rational scale where S comprises the key figures itself
Examples: Absolute Scale
• seats in a bus, number of public holidays, number of inhabitants of a country, . . .
• “average number of children per family: 1.203” – what is a 0.203-child?The absolute scale has been used as a rational scale (makes sense for certain purposes if done with care).
• Software engineering example: number of known errors.
→ An absolute scale has a median, but in general not an average in the scale.

Something for the Mathematicians. . .–
2–
20
17-0
4-2
7–
Ssc
ale
s–
19/42
Recall:
Definition. [Metric Space (math.)]
Let X be a set. A function d : X ×X → R is called metric on Xif and only if, for each x, y, x ∈ X ,
(i) d(x, y) ≥ 0 (non-negative)
(ii) d(x, y) = 0 ⇐⇒ x = y (identity of indiscernibles)
(iii) d(x, y) = d(y, x) (symmetry)
(iv) d(x, z) ≤ d(x, y) + d(y, z) (triangle inequality)
(X, d) is called metric space.
→ different from all scales discussed before;a metric space requires more than a rational scale.
→ definitions of, e.g., IEEE 610.12, may use standard (math.) names for different things

Something for the Computer Scientists. . .–
2–
20
17-0
4-2
7–
Ssc
ale
s–
20/42
• A function which
• assigns to each algorithm (or problem, or program)
• a complexity class(worst-, average-, best-case; deterministic, non-deterministic; space, time; . . . ),
can be seen as a metric (according to our earlier definition):
• probands P : set of algorithms (or problems, or programs)
• scale S: problem classes like O(N).
Example:
• Problem p: “does element E occur in unsorted, finite list L”?
• Complexity metric (worst-case; deterministic; time):
• p is in O(N), N = |L| (length of list).
→ the McCabe metric (in a minute) is sometimes called complexity metric(in the rough sense of “complicatedness”).
→ descriptions of software metrics may use standard (comp. sc.) names for different things.
westphal
Bleistift
westphal
Bleistift

Excursion Excursion: Communicating Figures
–2
–2
017
-04
-27
–m
ain
–
21/42

Project Management: Metrics on People–
2–
20
17-0
4-2
7–
Sm
ed
ian
–
22/42
Definition. A software metric is a function m : P → S which assigns to eachproband p ∈ P a valuation yield (“Bewertung”) m(p) ∈ S. We call S the scale of m.
10
20
30
0 1 2 3 4 5 6 7 8 9 10
Requirements Engineering
• Here: P is the set of participants in the survey of the course “Software Engineering”.
• Scale: S = {0, . . . , 10} (ordinal scale; has = and 6=, < and >, min and max).
• Measurement procedure: self-assessment (→ subjective measure).

Reduce Information Further–
2–
20
17-0
4-2
7–
Sm
ed
ian
–
23/42
10
20
30
0 1 2 3 4 5 6 7 8 9 10
Requirements Engineering
• Arithmetic mean: 2.284 (not in the scale!)
• Minimum and maximum: 0 and 10
• Median: 1 (the value such that 50% of the probands have yields below and above)
westphal
Bleistift
westphal
Bleistift
westphal
Bleistift
westphal
Bleistift
westphal
Bleistift

Reduce Information Further–
2–
20
17-0
4-2
7–
Sm
ed
ian
–
23/42
10
20
30
0 1 2 3 4 5 6 7 8 9 10
Requirements Engineering
• Arithmetic mean: 2.284 (not in the scale!)
• Minimum and maximum: 0 and 10
• Median: 1 (the value such that 50% of the probands have yields below and above)
• 1st and 3rd Quartile: 1 and 4 (25%, 50%)
• a boxplot visualises 5 aspects of data at once (whiskers sometimes defined differently):
100 % (maximum)
75 % (3rd quartile)
50 % (median)
25 % (1st quartile)
0 % (minimum)
median: 1
average: 2.284
RE Experience 2017
median: 1
avg: 2.091
RE Experience 2016
westphal
Bleistift

2017 vs. 2016–
2–
20
17-0
4-2
7–
Sm
ed
ian
–
24/42
median: 1
average: 2.2069
Management 2017 Management 2016
median: 1
average: 2.284
RE Experience 2017
median: 1
avg: 2.0909
RE Experience 2016
median: 3
average: 3.9432
Programming 2017
median: 3avg: 3.7922
Programming 2016
median: 1
average: 2.1932
Modelling 2017
median: 1avg: 1.4459
Modelling 2016
median: 1
average: 2.5682
QA 2017
median: 2avg: 2.3766
QA 2016

Back From Excursion: Scales
–2
–2
017
-04
-27
–m
ain
–
25/42

Content–
2–
20
17-0
4-2
7–
Sco
nte
nt
–
26/42
• Survey: Expectations on the Course
• Software Metrics
• Motivation
• Vocabulary
• Requirements on Useful Metrics
• Excursion: Scales
• Excursion Excursion: Mean, Median, Quartiles
• Example: LOC
• Other Properties of Metrics
• Base Measures vs. Derived Measures
• Subjective and Pseudo Metrics
• Discussion

Requirements on Useful Metrics–
2–
20
17-0
4-2
7–
Sm
etr
ics2
–
27/42
In order to be useful, a (software) metric should be:
differentiated worst case: same valuation yield for all probands
comparable ordinal scale, better: rational (or absolute) scale
reproducible multiple applications of a metric to the same proband should yield thesame valuation
available valuation yields need to be in place when needed
relevant wrt. overall needs
economical worst case: doing the project gives a perfect prognosis of project duration— at a high price;irrelevant metrics are not economical (if not available for free)
plausible (→ pseudo-metric)
robust developers cannot arbitrarily manipulate the yield;antonym: subvertible
westphal
Bleistift

Example: Lines of Code (LOC)–
2–
20
17-0
4-2
7–
Sm
etr
ics2
–
28/42
1 /* h t t p s : / / de . w i k i p e d i a . o r g / w i k i /2 * L i s t e _ v o n _ H a l l o−Welt−Programmen /3 * H%C3%B 6 h e r e _ P r o g r a m m i e r s p r a c h e n#J a v a */4
5 c l a s s Ha l l o {6
7 pub l i c s t a t i c void
8 main ( S t r i n g [ ] a r g s ) {9 System . out . p r i n t (
10 " Ha l l o Welt ! " ) ; // no n e w l i n e11 }12 }
dimension unit measurement procedure
program size LOCtot number of lines in total
net programsize
LOCne number of non-empty lines
code size LOCpars number of lines with notonly comments andnon-printable
deliveredprogram size
DLOCtot,DLOCne,DLOCpars
like LOC, only code(as source or compiled)given to customer
(Ludewig and Lichter, 2013)
differentiated
comparable
reproducible
available
relevant
economical
plausible
robust
westphal
Bleistift
westphal
Bleistift
westphal
Bleistift
westphal
Bleistift
westphal
Bleistift
westphal
Bleistift
westphal
Bleistift
westphal
Bleistift
westphal
Bleistift

More Examples–
2–
20
17-0
4-2
7–
Sm
etr
ics2
–
29/42
characteristic(‘Merkmal’)
positive example negative example
differentiated program length in LOC CMM/CMMI level below 2
comparable cyclomatic complexity review (text)
reproducible memory consumption grade assigned by inspector
available number of developers number of errors in the code(not only known ones)
relevant expected developmentcost; number of errors
number of subclasses (NOC)
economical number of discoverederrors in code
highly detailed timekeeping
plausible cost estimationfollowing COCOMO(to a certain amount)
cyclomatic complexity of aprogram with pointeroperations
robust grading by experts almost all pseudo-metrics
(Ludewig and Lichter, 2013)

Other Properties of Metrics
–2
–2
017
-04
-27
–m
ain
–
30/42

Kinds of Metrics: ISO/IEC 15939:2011–
2–
20
17-0
4-2
7–
Sm
etr
icki
nd
s–
31/42
base measure — measure defined in terms of an attribute and the method for quanti-fying it. ISO/IEC 15939 (2011)
Examples:
• lines of code, hours spent on testing, . . .
•
derived measure — measure that is defined as a function of two or more values of basemeasures. ISO/IEC 15939 (2011)
Examples:
• average/median lines of code, productivity (lines per hour), . . .
•

Kinds of Metrics: by Measurement Procedure–
2–
20
17-0
4-2
7–
Sm
etr
icki
nd
s–
32/42
objective metric pseudo metric subjective metric
Procedure measurement, counting,possibly standardised
computation (based onmeasurements orassessment)
review by inspector,verbal or by given scale
Advantages exact, reproducible,can be obtainedautomatically
yields relevant, directlyusable statement on notdirectly visiblecharacteristics
not subvertable,plausible results,applicable to complexcharacteristics
Disadvantages not always relevant,often subvertable,no interpretation
hard to comprehend,pseudo-objective
assessment costly,quality of results dependson inspector
Example,general
body height, air pressure body mass index (BMI),weather forecast for thenext day
health condition,weather condition (“badweather”)
Example inSoftwareEngineering
size in LOC or NCSI;number of (known) bugs
productivity;cost estimationby COCOMO
usability;severeness of an error
Usually used for collection of simplebase measures
predictions (costestimation);overall assessments
quality assessment;error weighting
(Ludewig and Lichter, 2013)

Pseudo-Metrics
–2
–2
017
-04
-27
–m
ain
–
33/42
Pseudo-Metrics–
2–
20
17-0
4-2
7–
Sp
seu
do
–
34/42
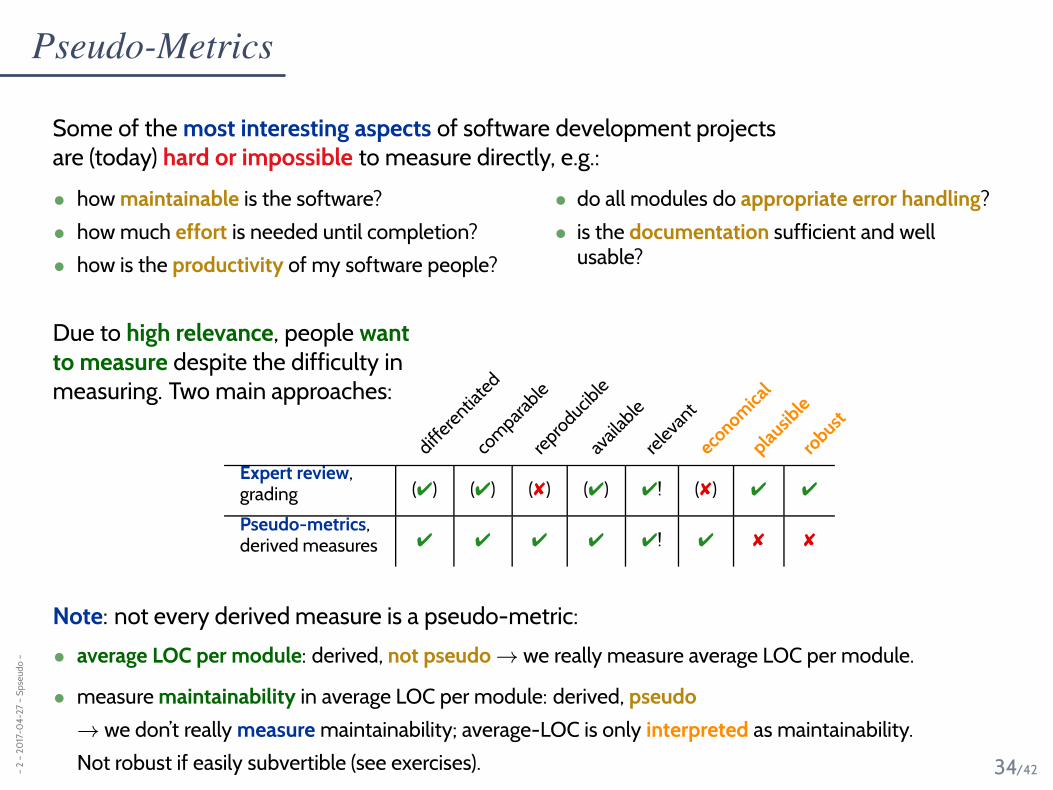
Some of the most interesting aspects of software development projectsare (today) hard or impossible to measure directly, e.g.:
• how maintainable is the software?
• how much effort is needed until completion?
• how is the productivity of my software people?
• do all modules do appropriate error handling?
• is the documentation sufficient and wellusable?
Due to high relevance, people wantto measure despite the difficulty inmeasuring. Two main approaches:
differ
entia
ted
com
parab
lere
produc
ible
avail
able
rele
vant
econom
ical
plausib
lero
bust
Expert review,grading (✔) (✔) (✘) (✔) ✔! (✘) ✔ ✔
Pseudo-metrics,derived measures ✔ ✔ ✔ ✔ ✔! ✔ ✘ ✘
Note: not every derived measure is a pseudo-metric:
• average LOC per module: derived, not pseudo → we really measure average LOC per module.
• measure maintainability in average LOC per module: derived, pseudo
→ we don’t really measure maintainability; average-LOC is only interpreted as maintainability.
Not robust if easily subvertible (see exercises).
westphal
Bleistift

Pseudo-Metrics Example–
2–
20
17-0
4-2
7–
Sp
seu
do
–
35/42
Example: productivity (derived).
• Team T develops software S with LOC N = 817 in t = 310h.
• Define productivity as p = N/t, here: ca. 2.64 LOC/h.
• Pseudo-metric: measure performance, efficiency, quality, . . .of teams by productivity (as defined above).
• team may write
x
:=
y
+
z;
instead of x := y + z;
→ 5-time productivity increase, but real efficiency actually decreased.
→ not (at all) plausible.
→ clearly pseudo.
westphal
Bleistift

Can Pseudo-Metrics be Useful?–
2–
20
17-0
4-2
7–
Sp
seu
do
–
36/42
• Pseudo-metrics can be useful if there is a (good) correlation (with few false positives and fewfalse negatives) between valuation yields and the property to be measured:
valuation yieldlow high
qu
alit
yhigh
false positive
×
true positive
× ×
× × ×
× ×
low
true negative
× ×
×
× ×
false negative
×
× ×
• This may strongly depend on context information:
• If LOC was (or could be made non-subvertible (→ tutorials)),then productivity could be useful measure for, e.g., team performance.
westphal
Bleistift

McCabe Complexity–
2–
20
17-0
4-2
7–
Sm
ccab
e–
37/42
complexity —
(1) The degree to which a system or component has a design or implementation that isdifficult to understand and verify. Contrast with: simplicity.
(2) Pertaining to any of a set of structure-based metrics that measure the attribute in (1).
IEEE 610.12 (1990)
Definition. [Cyclomatic Number [graph theory]]
Let G = (V,E) be a graph comprising vertices V and edges E.
The cyclomatic number of G is defined as
v(G) = |E| − |V |+ 1.
Intuition: minimum number of edges to be removed to make G cycle free.
westphal
Bleistift

McCabe Complexity Cont’d–
2–
20
17-0
4-2
7–
Sm
ccab
e–
38/42
Definition. [Cyclomatic Complexity [McCabe, 1976]]
Let G = (V,E) be the Control Flow Graph of program P .
Then the cyclomatic complexity of P is defined as v(P ) = |E| − |V | + p where p is thenumber of entry or exit points.
1 void i n s e r t i o n S o r t ( i n t [ ] a r r a y ) {2 f o r ( i n t i = 2 ; i < a r r a y . l e n g t h ; i + + ) {3 tmp = a r r a y [ i ] ;4 a r r a y [0] = tmp ;5 i n t j = i ;6 whi l e ( j > 0 && tmp < a r r a y [ j − 1 ] ) {7 a r r a y [ j ] = a r r a y [ j − 1 ] ;8 j −−;9 }
10 a r r a y [ j ] = tmp ;11 }12 }
Number of edges: |E| = 11Number of nodes: |V | = 6 + 2 + 2 = 10External connections: p = 2
→ v(P ) = 11 − 10 + 2 = 3
1
2
3
4
5
8
7
6
10
Entry
Exit
westphal
Bleistift
westphal
Bleistift
westphal
Bleistift
westphal
Bleistift
westphal
Bleistift
westphal
Bleistift
westphal
Bleistift
westphal
Bleistift

McCabe Complexity Cont’d–
2–
20
17-0
4-2
7–
Sm
ccab
e–
38/42
Definition. [Cyclomatic Complexity [McCabe, 1976]]
Let G = (V,E) be the Control Flow Graph of program P .
Then the cyclomatic complexity of P is defined as v(P ) = |E| − |V | + p where p is thenumber of entry or exit points.
• Intuition: number of paths, number of decision points.
• Interval scale (not absolute, no zero due to p > 0);easy to compute
• Somewhat independent from programming language.
• Plausibility:
+ loops and conditions are harder to understand thansequencing.
− doesn’t consider data.
• Prescriptive use:
“For each procedure, either limit cyclomaticcomplexity to [agreed-upon limit] or providewritten explanation of why limit exceeded.”
1
2
3
4
5
8
7
6
10
Entry
Exit

Code Metrics for OO Programs (Chidamber and Kemerer, 1994)–
2–
20
17-0
4-2
7–
Sm
ccab
e–
39/42
metric computation
weighted methodsper class (WMC)
n∑
i=1
ci , n = number of methods, ci = complexity of method i
depth of inheritancetree (DIT)
graph distance in inheritance tree (multiple inheritance ?)
number of childrenof a class (NOC)
number of direct subclasses of the class
coupling betweenobject classes (CBO)
CBO(C) = |Ko ∪Ki|,Ko = set of classes used by C , Ki = set of classes using C
response for a class(RFC)
RFC = |M ∪⋃
iRi|, M set of methods of C ,
Ri set of all methods calling method i
lack of cohesion inmethods (LCOM)
max(|P | − |Q|, 0), P = methods using no common attribute,Q = methods using at least one common attribute
• objective metrics: DIT, NOC, CBO; pseudo-metrics: WMC, RFC, LCOM
. . . there seems to be agreement that it is far more important to focus on empirical validation (orrefutation) of the proposed metrics than to propose new ones, . . . (Kan, 2003)

Content–
2–
20
17-0
4-2
7–
Sco
nte
nt
–
40/42
• Survey: Expectations on the Course
• Software Metrics
• Motivation
• Vocabulary
• Requirements on Useful Metrics
• Excursion: Scales
• Excursion Excursion: Mean, Median, Quartiles
• Example: LOC
• Other Properties of Metrics
• Base Measures vs. Derived Measures
• Subjective and Pseudo Metrics
• Discussion
westphal
Bleistift
westphal
Bleistift
westphal
Bleistift
westphal
Bleistift
westphal
Bleistift
westphal
Bleistift

References
–2
–2
017
-04
-27
–m
ain
–
41/42
References–
2–
20
17-0
4-2
7–
mai
n–
42/42
Chidamber, S. R. and Kemerer, C. F. (1994). A metrics suite for object oriented design. IEEE Transactions onSoftware Engineering, 20(6):476–493.
IEEE (1990). IEEE Standard Glossary of Software Engineering Terminology. Std 610.12-1990.
ISO/IEC (2011). Information technology – Software engineering – Software measurement process. 15939:2011.
ISO/IEC FDIS (2000). Information technology – Software product quality – Part 1: Quality model. 9126-1:2000(E).
Kan, S. H. (2003). Metrics and models in Software Quality Engineering. Addison-Wesley, 2nd edition.
Ludewig, J. and Lichter, H. (2013). Software Engineering. dpunkt.verlag, 3. edition.