Lecture 2 Multivariate Data Analysis and Visualization
33
Advanced Strategies for Metabolomic Data Analysis Dmitry Grapov, PhD Metabolomic Data Analysis
description
west coast metabolomics center, data analysis, metabolomics, summer sessions in metabolomics 2013, dmitry grapov
Transcript of Lecture 2 Multivariate Data Analysis and Visualization
Advanced Strategies for Metabolomic Data Analysis
Dmitry Grapov, PhD
Met
abol
omic
Dat
a An
alys
is

Analysis at the Metabolomic Scale

Multivariate Analysis
Samples
variables

Multivariate Analysis
• Visualization• Clustering• Projection• Modeling • Networks
Simultaneous analysis of many variables

ClusteringIdentify
•patterns
•group structure
•relationships
•Evaluate/refine hypothesis
•Reduce complexity
Artist: Chuck Close

Cluster AnalysisUse the concept similarity/dissimilarity to group a collection of samples or variables
Approaches•hierarchical (HCA)•non-hierarchical (k-NN, k-means)•distribution (mixtures models)•density (DBSCAN)•self organizing maps (SOM)
Linkage k-means
Distribution Density

Hierarchical Cluster Analysis• similarity/dissimilarity defines “nearness” or distance
X
Y
euclidean
X
Y
manhattan Mahalanobis
X
Y*
non-euclidean
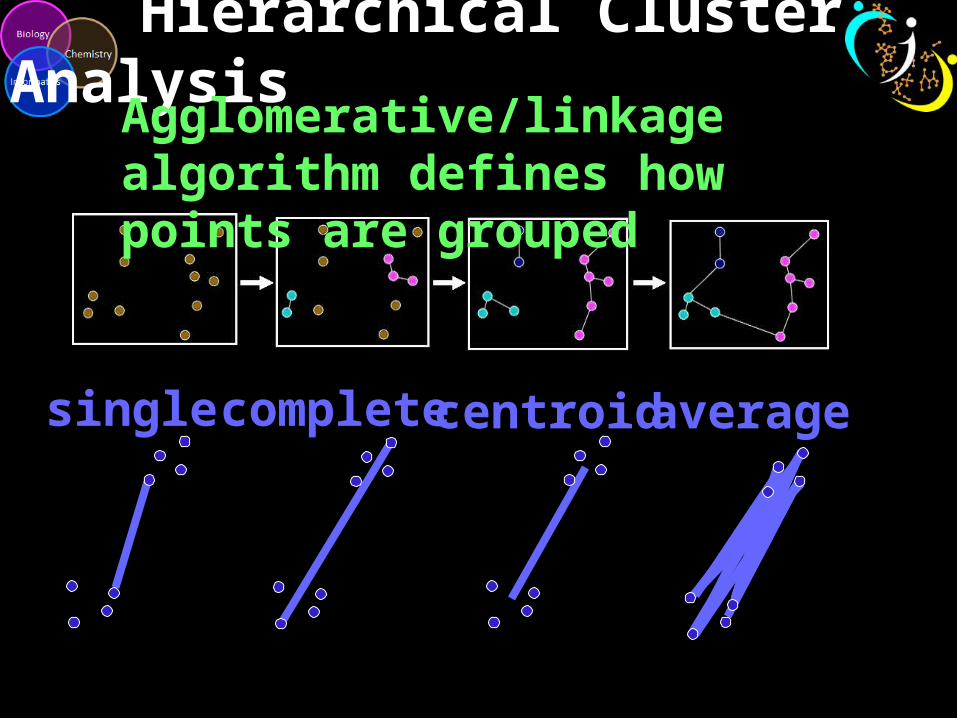
Hierarchical Cluster Analysis
single complete centroid average
Agglomerative/linkage algorithm defines how points are grouped

Hierarchical Cluster Analysis (cont.)
Sim
ilarit
y
x
xx
x

Overview Confirmation
How does my metadata match my data structure?
Hierarchical Cluster Analysis (cont.)

Multidimensional Scaling
PLoS ONE 7(11): e48852. doi:10.1371/journal.pone.0048852

Projection of Data
The algorithm defines the position of the light sourcePrincipal Components Analysis (PCA)
• unsupervised• maximize variance (X)
Partial Least Squares Projection to Latent Structures (PLS)
• supervised• maximize covariance (Y ~ X)

PCA: GoalsPrincipal Components (PCs)
•non-supervised
•projection of the data which maximize variance explained
Results
1.eigenvalues = variance explained
2.scores = new coordinates for samples (rows)
3.loadings = linear combination of original variables
James X. Li, 2009, VisuMap Tech.

Interpreting PCA Results
Variance explained (eigenvalues)
Row (sample) scores and column (variable) loadings

PCA Example
*no scaling or centering
glucose
219021
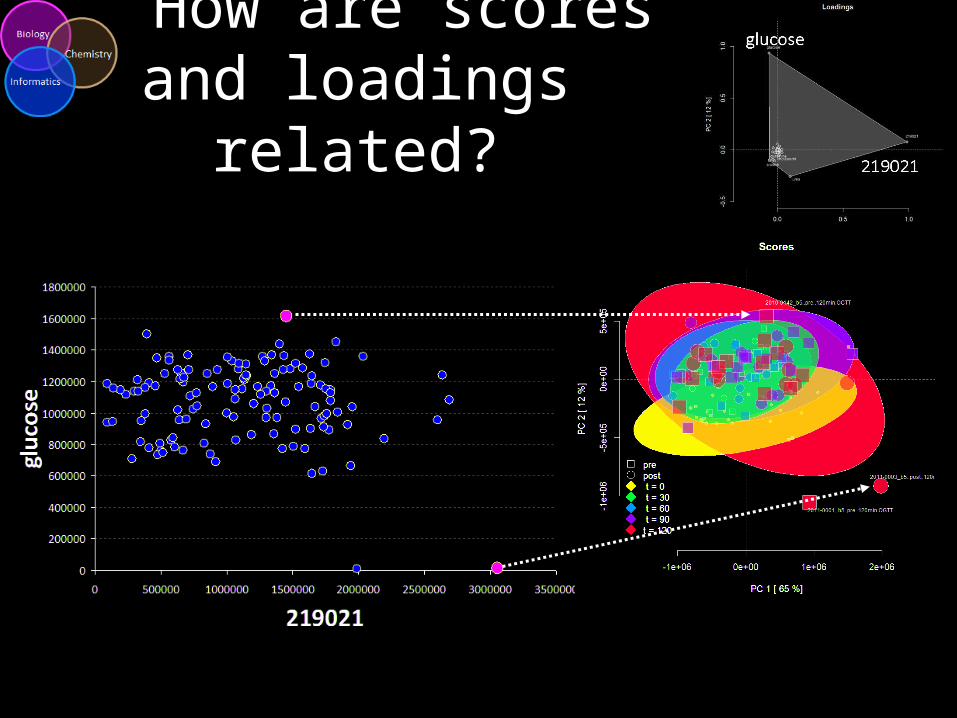
How are scores and loadings related?

Centering and Scaling
van den Berg RA, Hoefsloot HC, Westerhuis JA, Smilde AK, van der Werf MJ (2006) Centering, scaling, and transformations: improving the biological information content of metabolomics data. BMC Genomics 7: 142.

Data scaling is very important!
*autoscaling (unit variance and centered)
glucose (GC/TOF)
glucose (clinical)
219021

Use PLS to test a hypothesis
Loadings on the first latent variable (x-axis) can be used to interpret the multivariate changes in metabolites which are correlated with time
time = 0 120 min.

Modeling multifactorial relationships
dynamic changes among groups~two-way ANOVA

“goodness” of the model is all about the perspective
Determine in-sample (Q2) and out-of-sample error (RMSEP) and compare to a random model
•permutation tests
•training/testing

Biological Interpretation
• Visualization• Enrichment• Networks
– biochemical– structural– spectral– empirical
Projection or mapping of analysis results into a biological context.

Ingredients for Network Analysis
1. Determine connections• biochemical (substrate/product) • chemical similarity• spectral similarity• empirical dependency (correlation)
2. Determine vertex properties• magnitude• importance• direction• relationships

Organism specific biochemical relationships and information
Multiple organism DBs
•KEGG
•BioCyc
•Reactome
•Human
•HMDB
•SMPDB
Making Connections Based on Biochemistry

Biochemical Networks

•Use structure to generate molecular fingerprint
•Calculate similarities between metabolites based on fingerprint
•PubChem service for similarity calculations•http://pubchem.ncbi.nlm.nih.gov//score_matrix/score_matrix.cgi
•online tools•http://uranus.fiehnlab.ucdavis.edu:8080/MetaMapp/homePage
BMC Bioinformatics 2012, 13:99 doi:10.1186/1471-2105-13-99
Making Connections Based on structural similarity

Structural Similarity Network

Making Connections Based on spectral similarity
Watrous J et al. PNAS 2012;109:E1743-E1752
•Connect molecules based on EI or MS/MS spectral similarity
•Useful for linking annotated analytes (known) to unknown

Spectral Similarity Network
Watrous J et al. PNAS 2012;109:E1743-E1752

Making connections based on empirical relationships
•Connect molecules based on strength of correlation or partial-correlation

Treatment Effects Network
=
MetabolitesShape = increase/decreaseSize = importance (loading)Color = correlation
Connectionsred = Biochemical relationships violet = Structural similarity

Summary
Multivariate analysis is useful for: • Visualization• Exploration and overview• Complexity reduction• Identification of multidimensional
relationships and trends• Mapping to networks• Generating holistic summaries of
findings

Resource
•Mapping tools (review)• Brief Bioinform (2012) doi: 10.1093/bib/bbs055
•Tutorials and Examples• http://imdevsoftware.wordpress.com/category/uncategorized/ • https://github.com/dgrapov/TeachingDemos
•Chemical Translations Services• CTS: http://cts.fiehnlab.ucdavis.edu/
•R-interface: https://github.com/dgrapov/CTSgetR • CIR: http://cactus.nci.nih.gov/chemical/structure
•R-interface: https://github.com/dgrapov/CIRgetR