Lecture 10 Under Attack! -...
19
Lecture 10 Under Attack!
Transcript of Lecture 10 Under Attack! -...

Lecture 10
Under Attack!
11.15 am
12.15 pm
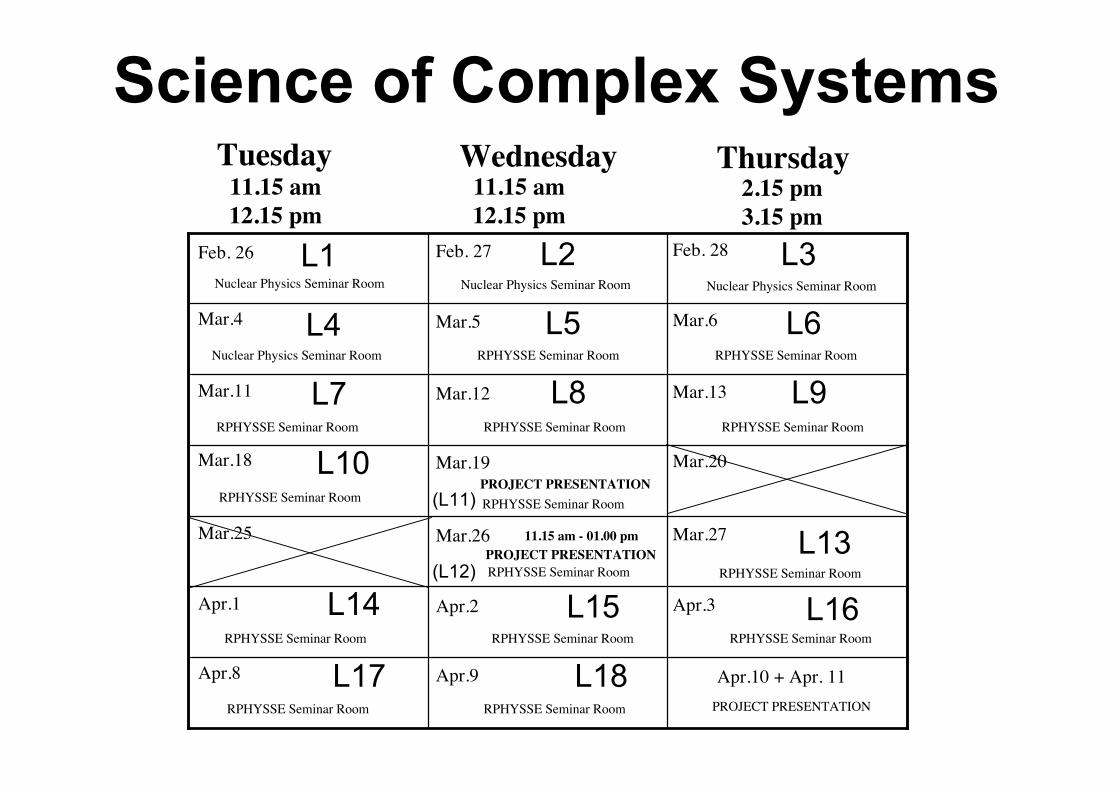
Tuesday Wednesday Thursday11.15 am
12.15 pm
2.15 pm
3.15 pm
Feb. 26 Feb. 27 Feb. 28
Mar.4 Mar.5 Mar.6
Mar.11 Mar.12 Mar.13
Mar.18 Mar.19 Mar.20
Mar.25 Mar.26 Mar.27
Apr.1 Apr.2 Apr.3
Apr.8 Apr.9 Apr.10 + Apr. 11
Nuclear Physics Seminar Room Nuclear Physics Seminar Room Nuclear Physics Seminar Room
Nuclear Physics Seminar Room RPHYSSE Seminar Room RPHYSSE Seminar Room
RPHYSSE Seminar Room RPHYSSE Seminar Room RPHYSSE Seminar Room
RPHYSSE Seminar Room RPHYSSE Seminar Room
RPHYSSE Seminar Room RPHYSSE Seminar Room
RPHYSSE Seminar Room RPHYSSE Seminar Room RPHYSSE Seminar Room
RPHYSSE Seminar Room PROJECT PRESENTATIONRPHYSSE Seminar Room
PROJECT PRESENTATION
PROJECT PRESENTATION
11.15 am - 01.00 pm
Science of Complex Systems
L1 L2 L3
L4 L5 L6
L7 L8 L9
L10(L11)
(L12)
L13
L14 L15 L16
L17 L18
In which kind of space networks live?
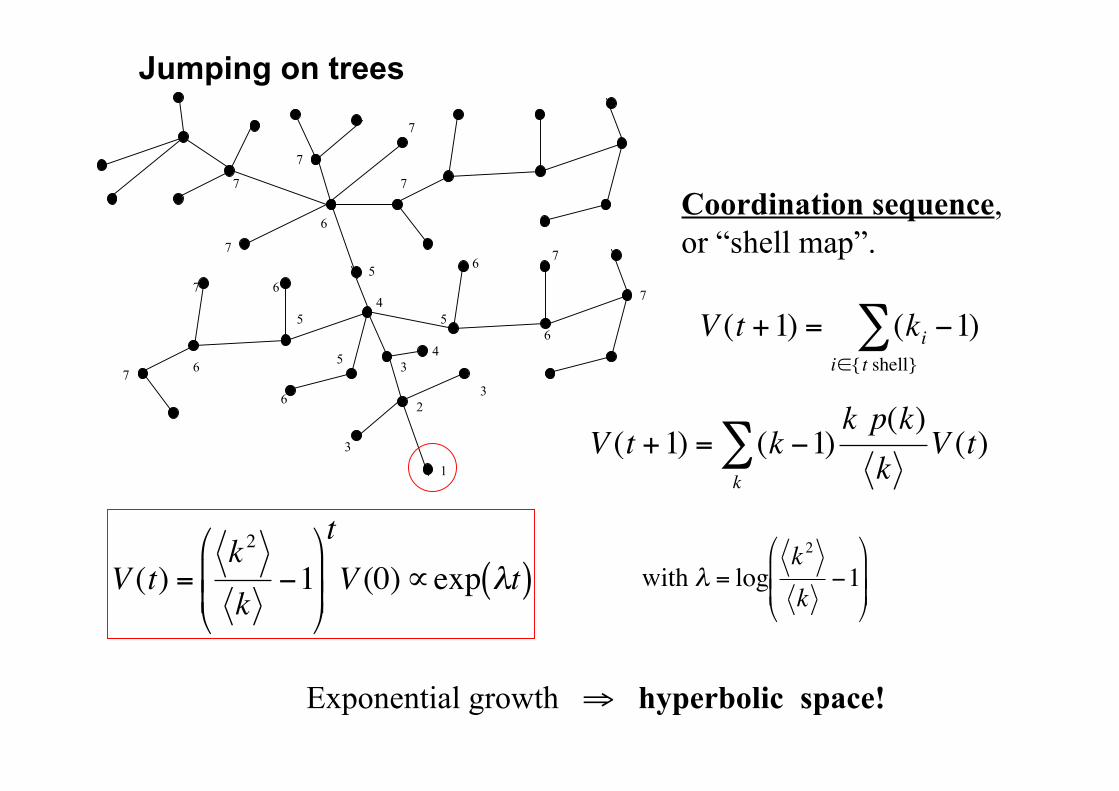
Jumping on trees
1
2
3
3
3
4
4
5
5
5
5
6
6
6
6
6
6
7
7
7
7
7
7
7
7
7
!
V (t +1) = (ki"1)
i#{ t shell}
$
!
V (t +1) = (k "1)k p(k)
kV (t)
k
#
!
V (t) =k2
k"1
#
$
% %
&
'
( (
t
V (0))exp *t( )
Exponential growth ! hyperbolic space!
Coordination sequence,
or “shell map”.
!
with " = logk
2
k#1
$
%
& &
'
(
) )

Euclidean space: Hyperbolic space:
!
V (t)" td#1
!
V (t)"exp #t( )
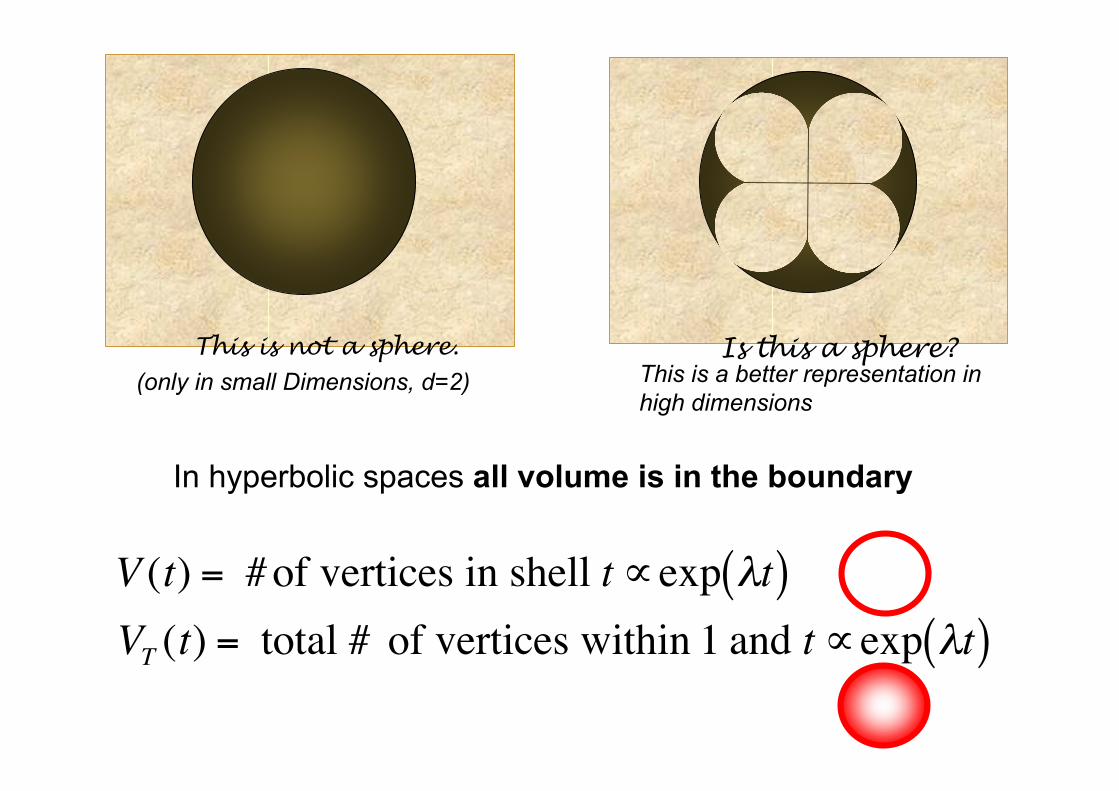
This is not a sphere. Is this a sphere?
!
V (t) = #of vertices in shell t "exp #t( )
In hyperbolic spaces all volume is in the boundary
!
VT(t) = total # of vertices within 1 and t "exp #t( )
(only in small Dimensions, d=2) This is a better representation in
high dimensions

Under attack: Network Resilience
R. Albert, H. Jeong & A.L. Barabasi, Error and attack tolerance of complex networks, Nature, 406 (2000) 378
Real-world networks are often highly resilient to attacks
concerning random deletion of their vertices.
Resilience can be measured in different ways, but perhaps
the simplest indicator of resilience in a network is the
variation in the fraction of vertices in the largest component
(giant component). We know [Lecture 8] that such quantity
varies as:
!
s =1+k
2
2 k " k2
A phase transition occurs when <k2> = 2<k> and a ‘giant
component’ first appears (or disappears). [Lecture 8]
Under attack II - percolation
In a percolation process, vertices or edges are ether
“occupied” or “unoccupied” (present or non-present) and one
ask how the resulting graph is connected.
One the main original motivation for the percolation theory was
the study of spreading of diseases. But in general it applies to
a very vast class of phenomena involving transport through
networks.
Among the applications there are the study of percolation of
petroleum and natural gas through semi-porous rock (CO2
sequestration being an “hot” contemporary topic).
Flow of electricity through complex conducting material is
another typical example but examples are also found in
economic and social systems as, for instance diffusion of
innovation through firms.
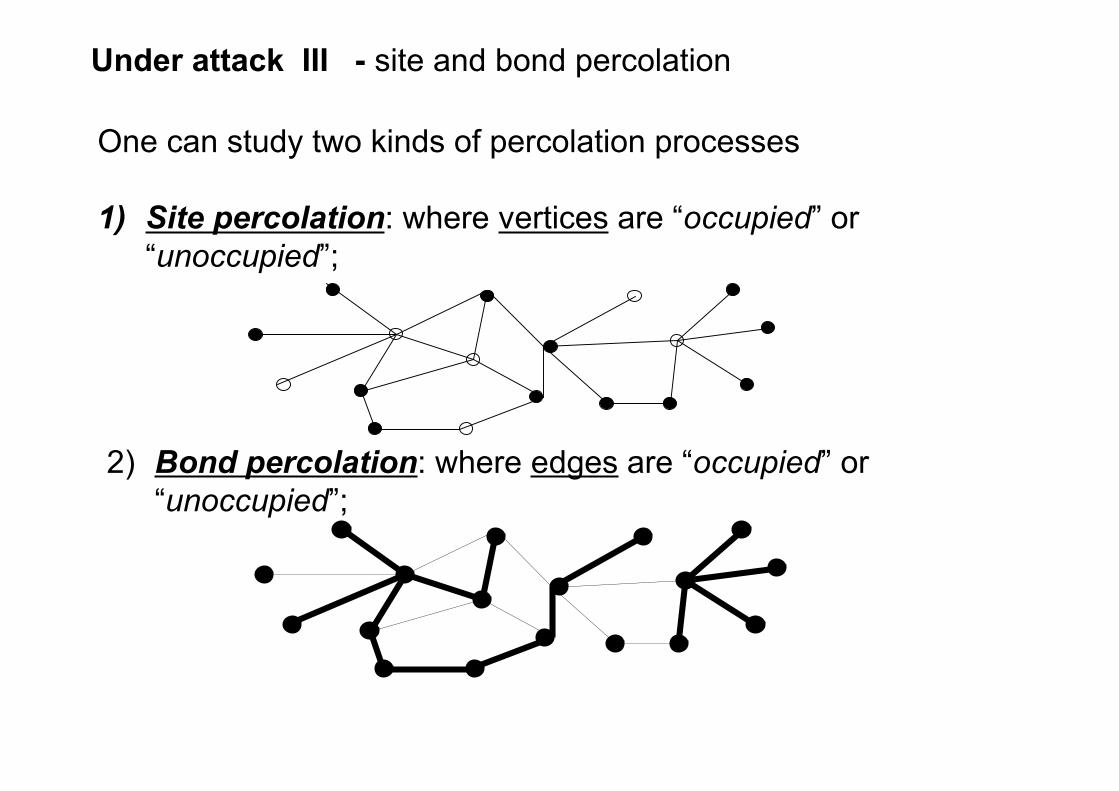
Under attack III - site and bond percolation
One can study two kinds of percolation processes
1) Site percolation: where vertices are “occupied” or
“unoccupied”;
2) Bond percolation: where edges are “occupied” or
“unoccupied”;

Under attack IV - site percolation
The resilience to random failure (or removal) of vertices in a
network is equivalent to a site percolation problem.
Reuven Cohen, Keren Erez,Daniel ben-Avraham, and Shlomo Havlin,
Resilience of the Internet to Random Breakdowns Phys. Rev. Lett. 85 (2000) 4626-4628.
Let us take an existing graph (generated with configuration
model) with degree distribution p(k) and let us keep only a
fraction q of “occupied” vertices. We want to study the
properties of the new graph made of the occupied vertices
only.

Under attack V - site percolation
!
˜ p (k') = p(k)k
k '
"
# $ %
& ' q
k'(1( q)
k(k'
k= k '
)
*
Probability that a vertex has k incident edges.
All the possible ways to pick k’
vertices among the k neighboring
vertices
Probability of k’ occupied vertices
the degree distribution counting the number of edges from a
given occupied vertex to other occupied vertices becomes
Probability that a vertex has k’ occupied neighbors
Probability of k-k’ unoccupied vertices
!
k' = q k
!
k '2
= q2k2
+ q(1" q) k

Under attack VI - site percolation
!
s =1+k
2
2 k " k2
Largest component size:
Largest component size:
!
s' =1+k '
2
2 k ' " k'2
Percolation threshold:
!
k '2
k '= 2
!
s' "#

Under attack VII - site percolation: threshold
For Poisson random graph we have <k2> = <k> (1+<k>) and
such transition is at q<k> = 1.
!
k '2
k '= 2
!
q k2
= (1+ q) k
For scale free graphs with
(! > n+1) and
!
P(k) =
0 for k = 0k"#
$ (#) for k > 0
%
& '
( '
For large ", we have
!
kn
=" (# $ n)
" (#)
!
q =" (# $1)
" (# $ 2) $" (# $1)for ! > 3
the transition is at

Under attack VIII - site percolation in scale free networks
!
k2"#For smaller ! (! ! 3) we have that
!
q k2
= (1+ q) k
!
q" 0
No percolation threshold!
Attempts to put internet down by randomly attacking routers will
be unsuccessful unless one puts down 100% of the routers.
Analogously epidemics will spread unless 100% of the
population is immunized.
therefore only when

Under attack IX - site percolation targeted attacks
On the contrary targeted attacks that puts selectively down the
the most connected sites will be very successful.
The fraction of vertices that must be removed from a network to destroy the giant
component, if the network has the form of a configuration model with a power-law
degree distribution of exponent ", and vertices are removed in decreasing order of
their degrees.
Under attack X - site percolation: cascading failures
In some networks, such as electrical power networks, the
operation of the network is such that the failure of one vertex
or edge results in the redistribution of the load to other nearby
vertices or edges. If vertices or edges fail when the load on
them exceeds some maximum capacity, then this mechanism
can result in a cascading failure or avalanche in which the
redistribution of load pushes another vertex or edge over its
threshold and causes it to fail, leading to further
redistribution.(Examples: Northeast Blackout of 2003 USA-
Canada, 2003 Italy blackout).
Model: a vertex fails if a fraction "i of its neighbors have failed.
The model starts from an initial (small) density of failures andtakes the "i as iid numbers drawn from a distribution f(").
The onset of the cascading process can be mapped onto the
percolation problem.
D. J. Watts, A simple model of global cascades on random networks, Proc. Natl. Acad. Sci. USA, 99 (2002), pp. 5766–5771.
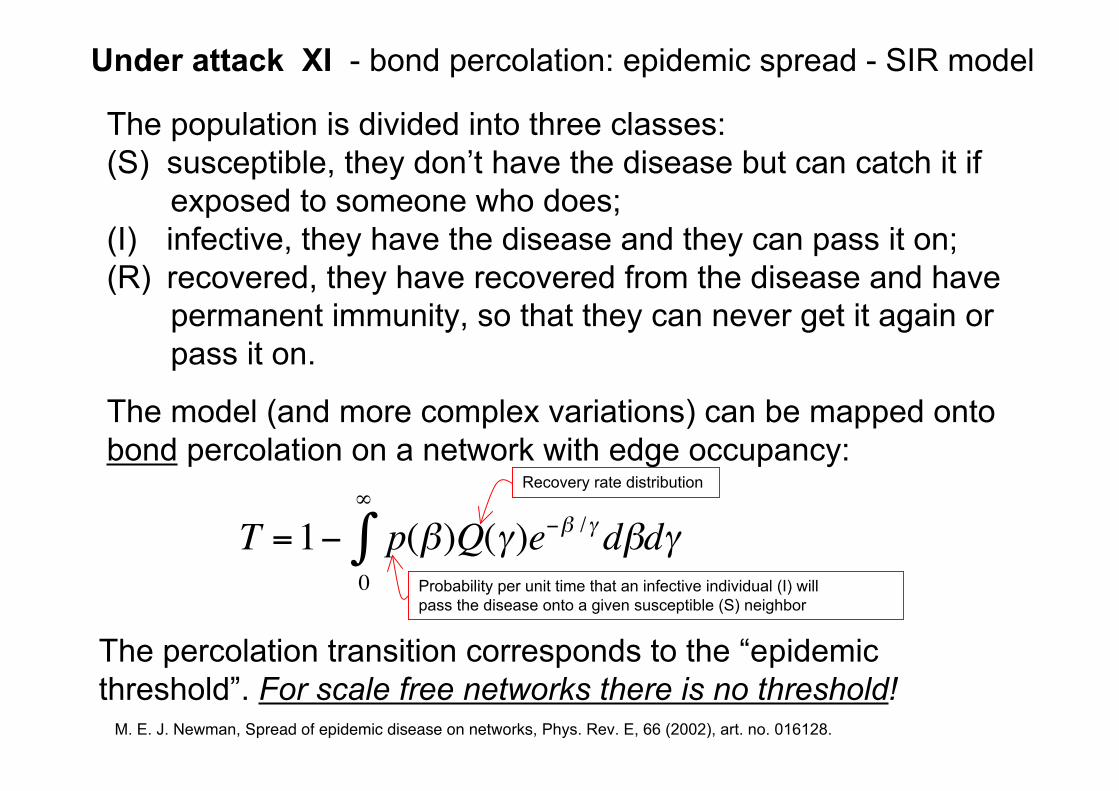
Under attack XI - bond percolation: epidemic spread - SIR model
The population is divided into three classes:
(S) susceptible, they don’t have the disease but can catch it if
exposed to someone who does;
(I) infective, they have the disease and they can pass it on;
(R) recovered, they have recovered from the disease and have
permanent immunity, so that they can never get it again or
pass it on.
The model (and more complex variations) can be mapped onto
bond percolation on a network with edge occupancy:
!
T =1" p(#)Q($)e"# /$
0
%
& d#d$Probability per unit time that an infective individual (I) will
pass the disease onto a given susceptible (S) neighbor
The percolation transition corresponds to the “epidemic
threshold”. For scale free networks there is no threshold!
Recovery rate distribution
M. E. J. Newman, Spread of epidemic disease on networks, Phys. Rev. E, 66 (2002), art. no. 016128.
Under attack XII
Scale free networks (from configuration model) are impossible
to immunize and easy to destroy with targeted attacks….
Likely, configuration models are not realistic models for real
networks. For instance, one finds finite percolation thresholds
for scale free graphs with negative degrees correlations.
Furthermore, one gets non zero threshold by incorporating
“geographical effects” (local community structures), low
dimensional embeddings or high transitivity.
Under attack XIII - Vaccinations
The same properties that make the network extremely
vulnerable can make vaccinations extremely effective.
If the virus spreading can be mapped onto a bond percolation
problem the vaccination is a site percolation problem therefore
one must study the combination of the two.
Vaccination of a few targeted vertices can stop the spreading
of the disease.
R. Pastor-Satorras and A. Vespignani, Epidemic spreading in scale-free networks, Phys. Rev. Lett., 86 (2001), 3200-3203.
R. Pastor-Satorras and A. Vespignani, Epidemics and immunization in scale-free net- works, in Handbook of Graphs and
Networks, S. Bornholdt and H. G. Schuster, eds., (Wiley-VCH, Berlin, 2003).