Leaner and Greener: Sustainability at Work in...
56
NOVEMBER 2012 SUSTAINABILITY AT WORK IN TRANSPORTATION
Transcript of Leaner and Greener: Sustainability at Work in...

November 2012
SuStainability at Work in tranSportation

ii Leaner and Greener: Sustainability at Work in Transportation
Dear Friends,
Transportation is more than just highways, cars, trains, and buses. Transportation connects people—to their jobs, to their communities, and to each other. Transportation reaches across the nation to improve the economy and our quality of life.
In 2001, AASHTO and FHWA created the Center for Environmental Excellence to promote environmental stewardship and encourage innovative ways to streamline the transportation project delivery process. In 2003, AASHTO published our Taking the High Road report, which chronicled the important contributions state transportation agencies make to society and the environment. We published a follow-up report, Above and Beyond in 2009 to document the additional environmental and social contributions of state DOTs’ projects and programs.
This third report, Leaner and Greener, showcases the efforts transportation agencies—including DOTs, MPOs, and transit providers—are undertaking to speed up project delivery and cut costs while protecting and even improving environmental resources.
Through programmatic environmental solutions, DOTs are moving away from “reinventing the wheel” for project-level environmental considerations. They are using systematic approaches to meet sustainability goals—not just in project development, but during everyday maintenance of their systems as well. They are showing that such an approach results in improved environmental outcomes and less cost to the taxpayer.
The programs shown here are just a few of the many innovative and cost-saving strategies being deployed by transportation agencies across the nation to benefit society and the environment.
John HorsleyExecutive Director
Letter from AASHTO’s Executive Director

iiiLeaner and Greener: Sustainability at Work in Transportation
Dear Friends,
Environmental stewardship has always been a major priority of the Federal Highway Administration (FHWA). And so it was a natural extension of our work to join with AASHTO in 2001 to create the Center for Environmental Excellence (Center). We applaud the Center for providing a national showcase and shining a light on sustainability best practices that benefit our environment, our communities, and our economy.
This report examines a subject that is especially important to me: how we can speed project delivery, save money, and still protect and improve our environment. These principles are at the heart of the Every Day Counts (EDC) initiative we launched in 2009 along with our AASHTO partners.
Warm-mix asphalt (WMA) is one of the technologies we’re advancing through EDC. It requires less fuel, results in lower emissions, and can extend the paving season in colder climates, which is extremely important as we continue our efforts to create jobs. Through EDC, we are working with states to encourage them to adopt WMA as a standard part of their paving work. Streamlining transportation projects is an important priority for the Obama administration, which falls right in line with EDC.
Programmatic agreements reduce or eliminate project and regulatory compliance unknowns, create new and more flexible standards, and provide a proactive and consistent approach to project delivery. FHWA is using programmatic agreements to save historic bridges before repair becomes fiscally impossible due to safety and structural concerns.
With the use of programmatic agreements, FHWA is able to cut the time by more than half to repair these bridges. Rehabilitating these bridges extends their useful life in a sustainable way and has benefits to the community that far outweigh their function as transportation facilities. Historic bridges have cultural and community significance in addition to serving as important transportation links. FHWA is currently rolling out webinars on rehabilitating historic bridges and producing programmatic agreements for their management, including the work of the Indiana agreement described in Chapter 3.
In fact, programmatic agreements are one of the EDC strategies that were included in the new transportation bill, MAP-21. Through our work, we’ve left an imprint on this important legislation, which President Obama signed into law in July. Many of our project delivery strategies are included in the bill or complement its provisions. I believe we’re poised to take project delivery to the next level.
A key to being successful is the ability to evaluate both the process and the results. FHWA’s new self-evaluation tool INVEST is a voluntary self-evaluation scoring system that enables transportation agencies to gauge their performance in adopting sustainability best practices grouped in three categories—system planning, project development, and operations and maintenance. By offering states a collection of best practices, INVEST really serves two purposes.
First, it inspires them with workable solutions that allow them to incorporate sustainability into their transportation projects. And, second, it gives them a tool for measuring their progress. This tool can evaluate all the initiatives highlighted in Leaner and Greener, and we would like to see used for every project.
Achieving sustainability in transportation is an ongoing, collaborative process. The FHWA is proud to work alongside all our partners to advance sustainable transportation practices that serve us now and will serve us in the future.
Victor M. MendezAdministrator
Letter from FHWA’s Administrator


vLeaner and Greener: Sustainability at Work in Transportation
table of ContentS
IntroductIonWhat “Leaner and Greener” Means . . . . . . . . . . . . . . . . . . . . . . . . . . . . . . . . . . . . . . . . . . . . .1
chapter oneLeaner and Greener Solutions for Transportation . . . . . . . . . . . . . . . . . . . . . . . . . . .3
chapter tWoSustainable Infrastructure Maintenance . . . . . . . . . . . . . . . . . . . . . . . . . . . . . . . . . . . . . . .7
chapter threeFaster, Cheaper, and Better Project Delivery . . . . . . . . . . . . . . . . . . . . . . . . . . . . . . . 19
chapter FourLeaner and Greener Leadership Vision . . . . . . . . . . . . . . . . . . . . . . . . . . . . . . . . . . . . . . 31
chapter FIveConclusions . . . . . . . . . . . . . . . . . . . . . . . . . . . . . . . . . . . . . . . . . . . . . . . . . . . . . . . . . . . . . . . . . . . . . . . . . 47
SuStainability at Work in tranSportation

vi Leaner and Greener: Sustainability at Work in Transportation
Acknowledgements
AASHTO and the Center for Environmental Excellence gratefully acknowledge the following individuals and organizations for their contributions to this report:
• Mike Brady, California DOT
• Jeff Caster, Florida DOT
• Judy Gates, Maine DOT
• Julie Hunkins, North Carolina DOT
• Frank Pafko, Minnesota DOT
• Amy Phillips, Senior Editor, BNA Research and Custom Solutions
• Carol Lee Roalkvam, Washington State DOT
• Federal Highway Administration, with special thanks to Shari Schaftlein, Bethany Bacher-Gresock, Susan Jones, Richard Taylor, Mike Culp, Tom Everett, and other staff members
• Federal Transit Administration, with special thanks to Antoinette Quagliata
• High Street Consulting Group, with special thanks to Joe Crossett and Rob Padgette
• RBA Group, with special thanks to Andras Fekete

1
While working to provide the nation with safe, efficient, and reliable means of transporta-tion, state departments of transportation (DOTs) are faced with the challenges of filling the widening gap between transportation investment needs and transportation funding, while balancing community concerns, and protecting environmental quality. To successfully meet these challenges, DOTs are using sustainable practices to become leaner and greener.
Leaders in transportation know that, in addition to meeting mobility and safety needs, transportation investments must balance three important objectives:
_ Fiscal responsibility; _ Community quality of life; and _ Commitment to a better environment.
The idea of balancing economic, environmental, and community objectives is sometimes called sustainability or meeting the triple bottom line; leaner and greener also has the same meaning.
What does leaner and greener look like? This report provides many examples, and the Kansas Department of Transportation’s (KDOT) investment in ecologically friendly mowing practices offers a simple illustration. Thanks to an agreement with the Audubon Society of Kansas and other groups, KDOT’s mowing policies are promoting re-growth of prairie habitat along many of the 146,000 acres of land adjacent to the state’s highways while saving the DOT about $1.5 million a year in lower fuel costs and enhancing road users’ safety.
INtroductIoNWhat “Leaner andGreener” Means

2 Leaner and Greener: Sustainability at Work in Transportation
The basic elements of leaner and greener transportation investments do not change from state to state; but the individual solutions agencies choose are diverse. For example, part of the North Carolina Department of Transportation’s solution is cost-efficient low-impact bridge replacement designs that have decreased bridge replacement time by as much as four years and typically shrink project costs by 25 percent while supporting water quality goals. In Minnesota, the DOT’s solution includes smart snow and ice removal practices to reduce salt usage and associated winter maintenance costs while reducing impacts to the environment and enhancing safety.

3
To further exemplify what being leaner and greener means for transportation agencies, this report outlines a variety of practices and programs being implemented in transporta-tion agencies across the nation that are simultaneously cutting costs, helping the environ-ment, and strengthening communities.
The Federal Highway Administration (FHWA) supports state DOTs in their efforts to become leaner and greener through several initiatives, including its new Infrastructure Voluntary Evaluation Sustainability Tool (INVEST). INVEST is a voluntary self-evaluation scoring system that enables transportation agencies to gauge their performance in adopt-ing sustainability best practices grouped in three categories—system planning, project development, and operations and maintenance. Each of the three categories is scored independently. INVEST allows DOTs to assign a bronze-, silver-, gold-, or platinum-level status to their initiatives, based on sustainability characteristics of the project or program being evaluated. DOTs can use the results of an INVEST evaluation to support implemen-tation of sustainable practices in pending project decisions or to identify potential changes to business processes.
Many of the sustainable highway practices presented by INVEST promote cost savings and benefits to social, envi-ronmental, and economic systems. For example, items such as quality construction, designing pavement for long life, life-cycle concepts, recycled materials, and improved safety can all show an overall lower cost as well as benefits to society. The goal of INVEST is to encourage sustainable principles to be applied to the largest extent practicable on highway proj-ects. Some of the agencies that are already piloting INVEST include Minnesota, North Carolina, and Ohio.
chapter oNeLeaner and Greener soLutions for transportation
Autumn Parkway in Minnesota.

4 Leaner and Greener: Sustainability at Work in Transportation
Building a leaner (and greener) Bridge in Cleveland
In February 2009, the Ohio Department of Transportation initiated the first of two projects designed to replace the aging steel truss bridge that carries Interstate 90 over the Cuyahoga River Valley and into Cleveland’s central business district. The first Innerbelt project, developing a new westbound bridge adjacent to the existing bridge, demonstrates how Ohio DOT is working to make its major transportation investments leaner and greener by reducing cost, maximizing benefits, and conserving resources.
The Innerbelt project’s design and construction team found several ways to cut project costs while conserving resources and getting the bridge built faster, including:
• Smaller Bridge Footprint—By using a creative bridge design that featured a modified alignment from the one originally proposed, the project team was able to reduce the amount of earthwork needed during construction by about 35,000 cubic yards and decrease the amount of steel and other materials needed to build the bridge;
• Construction Vehicle Fuel Savings—By using construction vehicles with greater load-carrying capacity, more than 28,559 gallons of diesel fuel were saved during construction; resulting in a savings of about $93,000;1
• Carbon Emissions Reductions—By reducing fuel usage during earthmoving, the project saved more than 337 metric tons of CO2 emissions during construction.
• Materials Recycling—The demolition debris from the project was processed and sorted. More than half of all materials were recycled including more than 4.1 million pounds of steel—about the weight of 1,028 average-size sedans!
Based on these and other leaner and greener attributes, Ohio DOT has used FHWA’s INVEST sustainability self-assessment tool to give the project a silver rating.
1 Cleveland Innerbelt Project, Sustainability Summary, Dec 2011; U.S. Department of Energy national average diesel fuel cost of $3.27/gallon.
Cleveland Innerbelt Bridge.Photos courtesy of Ohio DOT.

5Leaner and Greener: Sustainability at Work in Transportation
The initiatives profiled in this report show how transportation agencies are striving to become leaner and greener in all aspects of what they do, from operations and mainte-nance activities to project delivery and in developing a leadership vision for the agency:
_ Sustainable Infrastructure Operations and Maintenance• Minnesota DOT’s snow and ice removal program;• Kansas DOT’s roadside mowing program;• Rhode Island DOT’s stormwater solutions;• Green pavement across the country; and• Arizona DOT’s solar powered emergency lighting.
_ Faster, Cheaper, and Better Project Delivery with Improved Environmental Outcomes• Accelerated bridge construction techniques across the country;• Indiana DOT’s historic bridges program;• New York State DOT’s GreenLITES program;• Puget Sound Regional Council’s Transportation 2040 Plan; and• Maryland State Highway Administration’s Model of Sustainability and Integrated
Corridors (MOSAIC) planning tool.
_ Setting a Leaner and Greener Leadership Vision• Los Angeles METRO’s Sustainability Implementation Plan;• Massachusetts DOT’s GreenDOT initiative;• North Carolina DOT’s accountability framework; and• Numerous state DOT efforts to institutionalize sustainable practices and programs.
For more information about state DOTs’ sustainable practices, visit the Center for Envi-ronmental Excellence by AASHTO website at http://environment.transportation.org.

Plows clear the roads in MinnesotaPhoto courtesy of Minnesota DOT.

7
Pavement never rests—roads serve the needs of the nation’s economy and its communities 24/7. This means there is no end to maintenance needs: with the jolt of passing vehicles, cracks in pavement spread; vegetation along medians must be cut in the spring, summer, and fall; and, in many places, winter’s arrival brings ice and snow that must be cleared. States spend a considerable share of transportation dollars on maintaining their existing transportation systems.
DOTs are finding that small changes in daily maintenance practices to address sustain-ability can amount to tangible economic, societal, and environmental results when they are repeated system-wide.
Beating Blizzards with Less Salt in MinnesotaThe cost of snow and ice removal is high. Across the northern United States, DOTs spend millions of dollars to spread 10 to 15 million tons of salt-based anti-icing material on roads each year. However, excessive use of deicers may harm salt sensitive plants and water quality.
The Minnesota Department of Transportation (MnDOT) is a leader among cold weather states in finding ways to cut the cost of snow and ice clear-ance while keeping drivers safe and protecting the environ-ment. During the 2010 and 2011 winter season—with the third highest total annual snowfall recorded in Minnesota in 40 years (one third more severe than the 10-year aver-age winter severity index)—MnDOT used only 25 percent more salt than normal while exceeding its statewide perfor-mance targets for bare lane regain time. Using innovative
chapter twosustainabLe infrastructure Maintenance
In the winter of 2010–2011, Mndot used about 32,000 fewer tons of salt than typical, helping save about $2.2 million in costs.

8 Leaner and Greener: Sustainability at Work in Transportation
snow removal practices, MnDOT saved an estimated $2.2 million in salt costs, reduced the impact to the environment, and enhanced travelers’ safety.2
How does MnDOT achieve these savings while meeting or exceeding its performance goals? The answer is through a combination of plow driver training, best practices, and technology innovations:
_ “Salt Solutions” Training: Through MnDOT’s Salt Solutions Program, plow drivers are trained in high-tech virtual snow plow cabs about how to use deicers in “the right amount, at the right time, in the right way.”
_ Best Practices: Through the use of advanced techniques, such as applying liquid brine in advance of a storm to “anti-ice” roads, MnDOT reduces the volume of salt required to keep roads safe.
_ Technology Innovations: Through technology innovations, such as roadway sensors that detect and report hazardous conditions or calibration technology to ensure plows dispense materials effectively, MnDOT reduces its use of salt.
Snowplows are not the only way Minnesota highways stay drivable in the wintertime. Living snow fences—barriers made of trees, shrubs, and native grasses located along roads—are another best practice that is becoming a feature of Minnesota’s roadways. Properly designed and placed, these living barriers trap snow as it blows across the landscape, piling it up before it reaches a road. Living snow fences prevent big snowdrifts from stranding motorists,
improve drivers’ visibility, and reduce crashes. They also reduce spend-ing on plows and, by keeping highways clear, help reduce shipping delays for goods and services.
MnDOT is working with the U.S. Department of Agriculture and local landowners adjacent to roadways to promote installation of living snow fences. Efforts are still in their infancy, with about 30 miles of living snow fences installed so far, but MnDOT has identified an additional 1,200 miles of highway with chronic snow drifting problems.
In addition to improving safety and reducing costs, living snow fences are an environmentally sound solution for snow management, as less salt and fuel are needed to keep roadways clear. The living fences also provide wildlife habitat, control soil erosion, improve water qual-ity, reduce spring-time flooding, and sequester carbon to reduce atmospheric carbon dioxide. On average, according to MnDOT, the
2 MnDOT, 2010-2011 Annual Winter Maintenance Report (2012).
a living snow fence offers benefits worth $17 for every $1 spent.

9Leaner and Greener: Sustainability at Work in Transportation
cost–benefit ratio of implementing a living snow fence practice is 17:1, a $17 dollar return for every program dollar spent.3
Supporting Prairie Habitat Equals Reduced Mowing Costs in KansasManaging vegetation along highway medians and roadsides keeps roads safer for travelers by improving visibility. The Kansas Department of Transportation (KDOT) is responsible for managing 146,000 acres of vegetated rights-of-way along a 10,000-mile system of state highways. KDOT has responsibility for more acres of publicly owned grassland in Kansas than any other governmental or private entity.
KDOT worked with the Audubon Society and other partners to develop an approach to roadside mowing that enhances wildlife habitat and restores ecosystems native to the state, but also stretches KDOT’s mainte-nance budget and enhances the state’s natural beauty.
In 2008, KDOT staff facilitated a meeting with the Audubon Society of Kansas, the Natural Resources Conservation Service, the Grassland Heritage Founda-tion, the Kansas Department of Wildlife and Parks, the Kansas Native Plant Society, and others to discuss ways the DOT could better manage its right of way. Some of the KDOT practices that resulted from these discus-sions include:
_ Less Use of Herbicides: KDOT staff has increased efforts to make sure they are only spot spraying, rather than broadly applying chemicals;
_ Reduced Mowing Area and Frequency: For most of the 146,000 acres of vegetated roadsides along the state’s highway system, mowing is now limited to 15 feet from the shoulder and around approaching intersections for maximum safety. This allows native grasses and wildflowers to flourish in rights of way that extend beyond the 15 feet by reducing annual mowing to alternate, or even every third or fourth
3 MnDOT Living Snow Fences, Media Fact Sheet (Undated).
$1
$17
cost–Benefit ratio of Imple-menting a Living Snow Fence practice in Minnesota
Photos courtesy of Kansas DOT.

Photo courtesy of Kansas DOT.
10 Leaner and Greener: Sustainability at Work in Transportation
year as needed to preserve plant vigor. In the past, KDOT has mowed these areas annually or more often. KDOT has also changed the timing of full fence-to-fence mowing from early fall to November to avoid interference with late fall wildflower seed propagation.
_ New Seed Mixes: KDOT has changed its seed mixes to include more native plants and wildflowers. Although it varies by region, their
standard seed mix generally contains 10 to 15 different native grass species and 18 to 25 native wildflower species.
These changes have resulted in a 30 percent reduction in acres mowed, reduced fuel use, and saved nearly $1.5 million per year in fuel costs while improving habitat along Kansas highways and ensuring driver safety.4
Rhode Island’s Stormwater Solutions Program—Cleaner Water and Lower CostsIn January 2011, the Rhode Island Department of Environmental Management completed new stormwater regulations that will dramatically influence the design of new highway infrastructure projects across Rhode Island by incorporating Low Impact Development (LID) as the industry standard for development. LID is an approach to land development that works with nature to manage stormwater as close to its source as possible and treats it as a resource rather than a waste product. It reduces the impact of built areas and promotes natural movement of water within an ecosystem.
The Rhode Island Department of Transportation (RIDOT) has taken a leadership role in developing a Stormwater Solutions outreach and education initiative to support imple-mentation of the new state-level rules as well as RIDOT’s ongoing compliance with the federal Municipal Separate Storm Sewer Systems (MS4) program. Stormwater Solutions is funded by RIDOT. The initiative is being implemented in partnership with the Rhode Island Department of Environmental Management; the University of Rhode Island Coop-erative Extension’s Nonpoint Education for Municipal Officials program; and the Southern Rhode Island Conservation District. As part of the initiative, a team of professionals from these organizations is developing materials to educate and inform towns, cities, and the general public across the state on complying with the new stormwater regulations.
4 Kansas DOT, 2001–2010, A Decade of Progress, Projects and Engagement, 2011.
Kdot has achieved a 30 percent reduction in acres mowed and saved $1.5 million in fuel costs with its eco-friendly mowing practices.

11Leaner and Greener: Sustainability at Work in Transportation
Through the Stormwater Solutions outreach effort, more than two dozen training work-shops for RIDOT and municipal employees have been completed. The training has included new ways to prevent runoff pollution at public works garages and construction sites; inclusion of improved pollution controls in new project designs, construction prac-tice, and routine maintenance; and designing for green streets and ways communities can make a difference in preventing stormwater pollution.
RIDOT is also integrating LID techniques in new project designs. An early example of this integration is the reconstruction of Route 138 in South Kingstown. LID techniques will convey stormwater away from the road through grassed swales instead of standard piping and inlets, saving construction costs, improving water quality, and enhancing the road’s appearance. The project also includes a landscaped bio-retention feature in a roundabout to provide water quality treatment and to infiltrate stormwater into the ground.
RIDOT is working to reduce impacts to stormwater at the source by conducting commu-nity outreach to educate the public and municipal officials on the importance of pollution prevention and applying environmentally sustainable and cost saving LID techniques. These source reduction activities, which include everyday actions such as reduced use of fertilizer, litter control, hazardous material control, and use of ground infiltration and bio-swales to filter pollutants, reduce the need to build and maintain expensive treatment structures and provide opportunities for creating greener, more visually attractive land-scapes along roadsides.
Stormwater Solutions offers easy-to-use materials for public education and outreach to inform communities about ways they can help manage stormwater runoff. The materials are designed for use by municipalities, stormwater managers, watershed organizations, or interested civic groups.
Waterview in Newport, Rhode Island.

12 Leaner and Greener: Sustainability at Work in Transportation
By proactively integrating LID and sustainable practices into a comprehensive outreach and education program, Stormwater Solutions is finding leaner and greener ways to pro-tect the environment, save money, achieve regulatory goals, and build public support for sustainable transportation infrastructure.
Black and Green—Sustainable Pavement PracticesWear and tear on the nation’s asphalt and concrete pavements is an inevitable result of con-tinual traffic and freeze-thaw weather. This results in a perpetual cycle of pavement repairs and roadway reconstruction that DOTs must undertake to meet their customers’ perfor-mance expectations. The process of maintaining roads is resource- and energy-intensive, and is expensive. About 500 million tons of asphalt pavement material are used in road construction and repair every year in the United States.5 About 25 percent of Interstates are paved with concrete and 65 percent of the nation’s bridges are built with concrete.6
Across the nation, DOTs are finding ways to control pavement preservation costs, cut landfill waste, and save energy while keeping pavement smoothness and bridge condition performance on target:
_ America’s Most Recycled Resources—Reclaimed Asphalt and Concrete: Old asphalt and concrete pavements are commonly recycled during pavement repairs. Once removed, asphalt pavement, otherwise known as reclaimed asphalt pavement (RAP), can be reused in road construction as high quality asphalt binder and aggregate. When considering that materials costs make up 70 percent of the cost of repaving, RAP usu-ally offers a significant cost savings over the use of virgin material.
The use of RAP has become widespread among DOTs over the last 30 years. A 2007 survey found that trans-portation agencies reclaim about 100 million tons of asphalt each year with new pavement typically contain-ing about 20 percent RAP.7 For example, since FY 2006, the Texas Department of Transportation has reclaimed and reused about 15 million tons of roadway material, saving space in landfills and reducing the environmen-tal impact of new roadway material production and transport.
5 FHWA, Reclaimed Asphalt Pavement in Asphalt Mixtures: State of the Practice (2011).
6 American Road and Transportation Builders Association, The Economic Impacts of Prohibiting Coal Fly Ash Use in Transportation Infrastructure Construction (2011).
7 National Asphalt Pavement Association, Black and Green—Sustainable Asphalt Now and Tomorrow (2009) http://www.asphaltpavement.org/images/stories/sustainability_report_2009.pdf.
transportation agencies reclaim about 100 million tons of asphalt each year—making asphalt the most recycled product in the united States.

Photo courtesy of National Asphalt Pavement Association.
13Leaner and Greener: Sustainability at Work in Transportation
The use of reclaimed asphalt and concrete reduces the need to use virgin aggregate, which is a scarce commodity in some areas of the United States. Increased use of re-cycled aggregate can significantly reduce greenhouse gas emissions by eliminating the significant fuel consumption required to acquire, process, and transport raw materials for virgin mix.
_ From Roofs to Roads—Recycled Shingles: The Missouri Department of Transporta-tion (MoDOT) is one of many state transportation agencies across the nation that allow contractors to use roof shingles that have been removed from rooftops in their asphalt mix. An asphalt mix made with 5 percent recycled shingles results in a 20 percent reduction in liquid asphalt purchases. The result is a durable, more-rut resistant asphalt at a lower price. MoDOT estimates use of recycled shingles saves $3 to $5 per ton of asphalt.8 Considering that a typical resurfacing project uses about 30,000 tons of asphalt, savings achieved per project total about $90,000 to $150,000. Beyond the cost savings, this practice also helps MoDOT in its environ-mental stewardship efforts. According to the Missouri Department of Natural Resources, an estimated 146,500 tons of roofing materials are disposed of in Missouri landfills each year. By reusing tear-off shingles, MoDOT reduces disposal of the shingles in landfills.
_ Warm-Mix Asphalt Saves Energy, Improves Pavement Quality: Conventional meth-ods for making asphalt pavement require heating up a hot mix of rock and asphalt
8 MoDOT website: http://www.modot.mo.gov/goinggreen/shingles.htm.
using recycled roof shingles in fresh asphalt saves Modot $3 to $5 per ton of asphalt, or about $90,000 to $150,000 on a typical resurfacing project.

14 Leaner and Greener: Sustainability at Work in Transportation
binder to drive off moisture and make it pliable. Warm-mix manufacturing technolo-gies brought to the United States from Europe in the early 2000s save energy and costs by allowing for production and placement of asphalt at lower temperatures. Less heat means less fuel and lower emissions and potentially lower fuel costs. Using warm-mix asphalt (WMA) can reduce energy consumption during the manufacturing of the asphalt pavement mixture by an average of 15 to 30 percent, which decreases total life-cycle greenhouse gas emissions by 5 percent.9 In a two-year performance study conducted for Virginia Department of Transportation, which is one of the states begin-ning to use WMA, the Virginia Transportation Research Council estimated that using warm-mix asphalt as part of the DOT’s maintenance program could provide Virginia with about a $1.15 million annual savings over the cost of hot-mix asphalt, which they attributed to the longer lifespan of WMA compared to regular asphalt.10
WMA was originally explored for its environmental benefits, but contractors and agen-cies also have discovered construction performance benefits, including a longer paving season in northern climates and a longer window of opportunity for compacting pave-ment, which improves pavement smoothness. Through the FHWA Every Day Counts
9 National Asphalt Pavement Association, Black and Green—Sustainable Asphalt Now and Tomorrow (2009) http://www.asphaltpavement.org/images/stories/sustainability_report_2009.pdf.
10 Virginia Transportation Research Council, Performance of Virginia’s Warm Mix Asphalt Trial Sections (2010).
Country Club Plaza Shopping Center in Kansas City, Missouri, at dusk.

15Leaner and Greener: Sustainability at Work in Transportation
initiative, WMA was identified as a proven technology and is being promoted nation-ally. As a result, an overwhelming majority of states already have adopted WMA as a standard practice and all states are now planning to incorporate it.
_ Perpetual Pavements Cut Repair Costs: One of the keys to sustainability is longevity. Perpetual pavement is a pavement designed and built to last more than 50 years with-out requiring major structural rehabilitation or reconstruction. Perpetual pavement reduces costs because it decreases the need for deep pavement repairs and reconstruc-tion. It also reduces congestion because minor surface rehabilitation can be performed in shorter work windows. Perpetual pavement decreases environmental impacts by reducing the amount of material resources used over the pavement’s life. According to FHWA, the initial cost of a perpetual asphalt pavement is 10 to 25 percent more than a conventional pavement. However, the overall lifecycle costs of a perpetual asphalt pavement are considerably lower when the extended pavement life and lower frequency of maintenance and rehabilitation activity costs are included. Perpetual asphalt pavements are being constructed by many state transportation agencies. In 2011, five state DOTs were recognized with the Perpetual Pavement Award from the Asphalt Pave-ment Alliance:11
• Alabama DOT for an 8.5-mile section of State Route 17 in Washington County;
• Florida DOT for a 13.2-mile section of State Route 997 in Miami-Dade County;
• Kentucky Transportation Cabinet for a 6.6 mile-section of Hal Rogers Parkway in Leslie County;
• Minnesota DOT for a 16.7-mile section of U.S. Trunk Highway 71 in Stearns and Todd Counties; and
• Pennsylvania DOT for a 2.7-mile section of State Route 210 in Armstrong County.
11 Asphalt Pavement Alliance, 2011 Perpetual Pavement Award Winners; http://asphaltroads.org/perpetual- pavement/2011-perpetual-pavement-award-winners.html.
Minnesota, MN Trunk Highway 61. 2010 Perpetual Pavement Award Winner.Photo courtesy of Asphalt Pavement Alliance.
Kentucky, I-65 in Halt County. 2009 Perpetual Pavement Award Winner.Photo courtesy of Asphalt Pavement Alliance.

16 Leaner and Greener: Sustainability at Work in Transportation
Photos courtesy of Arizona DOT.

17Leaner and Greener: Sustainability at Work in Transportation
“having emergency lights that can operate without an engine running saves all of us money on vehicle maintenance. It reduces wasted fuel and helps the environment while still meeting the safety needs of adot workers.”
John Nichols Arizona DOT Director of Administrative Services
Solar-Powered Emergency Lights Help DOT Fleet Save Fuel in ArizonaWhen DOT crews are working on the side of the road, the flashing warning lights atop their trucks are crucial to workers’ safety and to the protection of passing motorists. But DOT trucks must keep their engines idling to maintain power for the safety lights, without which the vehicle’s battery would quickly be drained.
According to research published by the Transportation Research Board, overnight and workday idling of trucks consumes well over 2 billion gallons of oil (mostly diesel) yearly in the United States.12 A study by the Arizona Department of Transportation (ADOT) showed that its trucks typically idle 60 percent of the time they are in use, primarily to provide power for emergency lights.
To save fuel and cut the amount of air pollutants emitted by maintenance vehicles, ADOT is pilot-testing a solar powered version of its traditional lighting system for trucks that takes advantage of Arizona’s plentiful sunshine. The pilot test will verify the durability and performance of the lighting system under different climate conditions around the state. Forty-six ADOT vehicles are equipped with solar lighting, which stores energy in lithium batteries.13 A side benefit is that the new system also takes less time to install than tradi-tional lighting rigs.
Results from the ADOT pilot indicate that its solar equipped vehicles cut idle time from 60 percent to 7 percent of vehicle operating time. Based on these numbers, a single light duty van operated by ADOT could save about 439 gallons of diesel fuel a year for an average approximate savings of $1,170.14
With independently powered solar lights, crews can pull off the highway and run the emergency lights with the engine turned off, so emissions are reduced and drivers are safely alerted to maintenance workers along the highway. ADOT staff expects the new light-ing to pay for itself in the first year of use from fuel cost savings.
12 Source: Gains, L; Vyas; A, and Anderson, J; Estimation of Fuel Use by Idling Commercial Trucks; Center for Transportation Research, Argonne National Laboratory (2006).
13 Source: ADOT engages in energy efficient measures to save money, ADOT Press Release, (Nov 21, 2011); ADOT continues to explore solar lighting to save on fuel, ADOT Press Release (May 1, 2012).
14 Based on idle fuel use rate of 0.352 gal/hour and diesel fuel cost of $3.27/gallon.

New York City LED lampposts.Photographer Ryan Pyle.
18 Leaner and Greener: Sustainability at Work in Transportation
ADOT plans to install solar emergency lights on 50 additional vehicles, incorporating improvements such as battery packs with a higher heat tolerance, an improved remote control unit with more power level indicators, and additional lighting.
New Options for Roadway LightingMany state DOTs are looking to save energy and cut costs through improved roadway lighting technology.
New York State DOT has developed a simple guide for replacing its roadway lighting with new light source technolo-gies to maintain visibility for safety, while reducing energy use. The agency found the potential energy savings ranged from about 7 percent to 50 percent, depending upon the roadway type.15
The California Department of Transporta-tion has begun installing approximately 70,000 light-emitting diode (LED) light fixtures on state and federal roadways and maintenance facilities across the state. The agency expects leaner and greener results, with energy savings of 30 to 50 percent, as well as fewer greenhouse gas emissions.16
15 Bullough, J.; Guide For Optimizing the Effectiveness and Efficiency of Roadway Lighting: Final Report; The Lighting Research Center, Rensselaer Polytechnic Institute (June 2012) https://www.dot.ny.gov/divisions/ engineering/technical-services/trans-r-and-d-repository/C10-14_Final%20Report.pdf.
16 California Transportation Agency Embarks On Conversion of Highway Lighting to LED, AASHTO Climate Change Briefing, Vol. 2, # 52, (March 3, 2012).

19
chapter threefaster, cheaper, and better project deLivery
Project development begins with transportation plans, including statewide long-range transportation plans and corridor studies. By including sustainability in transportation plans, it is ensured that sustainability will be considered when project delivery strategies are first formulated. Choices made during the design phase of project delivery determine infrastructure form and function for a generation. Several of the transportation agencies profiled in this report have developed leaner and greener approaches to transportation planning and project design to ensure balance among project costs, community values and environmental resources. This section examines a few exemplary approaches among trans-portation agencies for incorporating leaner and greener approaches into both the planning and design phases of project delivery.
Accelerated Bridge Construction Methods Save Dollars, Time, and ResourcesThe wise use of resources is a cornerstone of achieving sustainable leaner and greener outcomes. Accelerated bridge construction technologies, including prefabricated bridge elements and systems and slide-in bridge construction, have been advanced through FHWA’s Every Day Counts Initiative.17 These new technologies to accelerate construction of the nation’s deteriorating bridges cut costs, increase safety, and minimize inconvenience to travelers. According to FHWA, using these techniques, DOTs can replace bridges within 48 to 72 hours and reduce the time associated with traditional planning, design, and con-struction efforts by years. In addition, the designs and materials used in accelerated bridge technologies produce safer, more durable bridges with longer service lives than conven-tional bridges.
17 FHWA Every Day Counts Initiative, Accelerated Bridge Construction, http://www.fhwa.dot.gov/ everydaycounts/edctwo/2012/abc.cfm.
20 Leaner and Greener: Sustainability at Work in Transportation
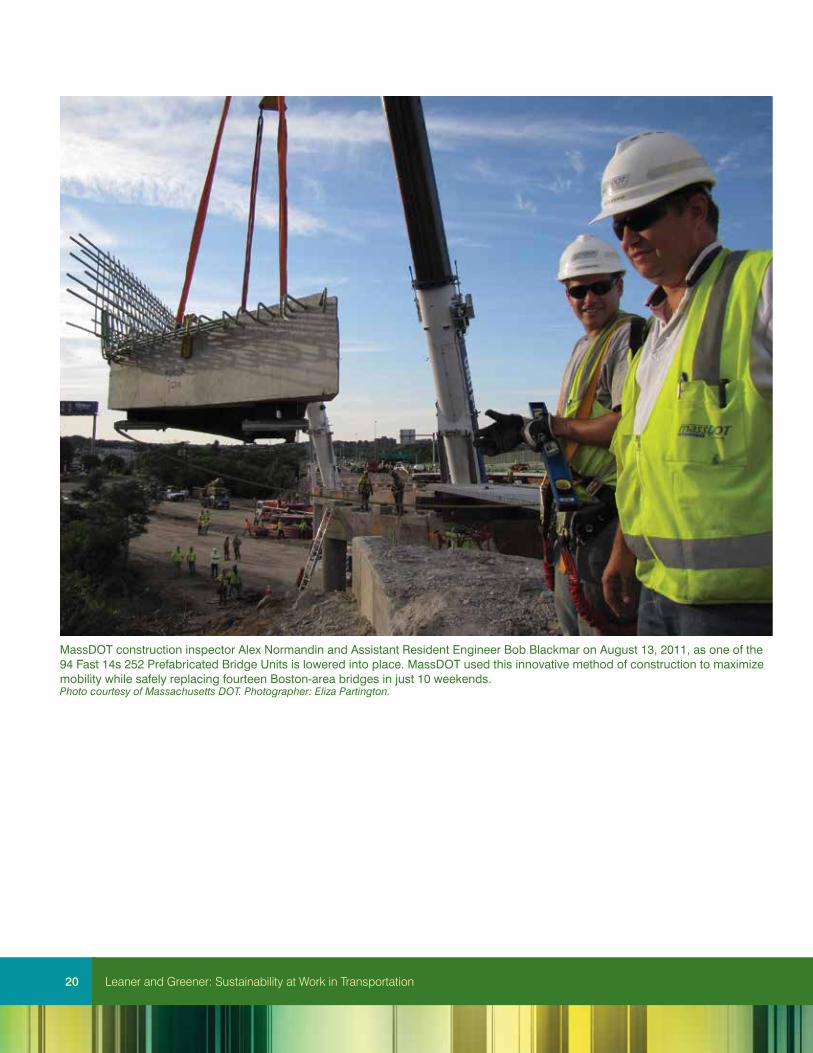
MassDOT construction inspector Alex Normandin and Assistant Resident Engineer Bob Blackmar on August 13, 2011, as one of the 94 Fast 14s 252 Prefabricated Bridge Units is lowered into place. MassDOT used this innovative method of construction to maximize mobility while safely replacing fourteen Boston-area bridges in just 10 weekends.Photo courtesy of Massachusetts DOT. Photographer: Eliza Partington.

21Leaner and Greener: Sustainability at Work in Transportation
Such methods also can lessen the environmental impact of construction. Heavy equipment needed for bridge construction is located off-site in factories rather than on the construc-tion site, avoiding disruption to sensitive ecosystems, such as wetlands. Shorter construc-tion time also allows projects to be scheduled around critical times for plant growth or animal life, such as fish spawning season.
FHWA reports that 44 states have already deployed accelerated bridge construction meth-ods. For example, Massachusetts DOT used prefabricated, modular superstructure units to complete a replacement of the I-93 Northbound Bridge over Riverside Avenue in Medford, Massachusetts. The bridge replacement took one weekend rather than the years of work that would have been required if conventional construction methods had been used. The project was part of MassDOT’s Fast 14 project, which replaced 14 bridge structures on I-93 over a series of weekends in 2011.
Georgia DOT used prefabricated bridge elements on the I-85 bridge in Troup County, Georgia, cutting time for the project completion from 30 months to just over 16 months, and cutting costs by 45 percent.
Indiana DOT’s Historic Bridge Preservation Program Speeds Up Projects, Saves Community Landmark BridgesHistoric bridges are an important part of Indiana’s transportation network and a source of community pride. During the 1990s, Indiana Department of Transportation (INDOT) identified over 18,000 public bridges in need of preservation, repair, and replacement. Due to the large volume of project-by-project reviews, consultations and decision making on historic eligibil-ity, effects, and mitigation, many replacement bridge projects were taking five or more years to progress to the construction phase.
In 2002, the National Trust for Historic Preservation included Indiana’s historic bridges on America’s 11 Most Endangered Places list. As a result, bridge owners, fund-ing partners, and preservationists in Indiana recognized the need to find common ground regarding the efficient execution of Section 106 of the Historic Preservation Act and agree on a consistent approach for identify-ing and preserving historic bridges. FHWA’s Indiana Division began working on a solution with INDOT
Historic Indiana bridge: Knox.Photos courtesy of Indiana DOT.
Many Indiana bridges take a year or less to replace, instead of five years or more, thanks to a new partnering agreement that allows the state to preserve the most significant historic bridges.

22 Leaner and Greener: Sustainability at Work in Transportation
and other stakeholders including federal, state, and local elected officials; preservation groups; tourism organiza-tions; chambers of commerce; and trail user groups. Their efforts culminated in a formal programmatic agreement (PA) that laid out new procedures for evaluating, manag-ing, and preserving Indiana’s historic bridges, signed by the Indiana FHWA Division, Indiana State Historic Preserva-tion Officer, Advisory Council on Historic Preservation, INDOT, and the Indiana Historic Spans Task Force. The agreement includes provisions for conducting a historic bridge survey; a detailed project development process for select and non-select bridges; standard treatments for historic bridges; and provision for development of a Stan-dards for Rehabilitation of Bridges on Low Volume Roads for inclusion in the INDOT Design Manual. Managing historic bridges through the PA provides more flexible standards, eliminates project and regulatory compliance uncertainty, and provides a proactive and consistent approach to his-toric bridge preservation in Indiana.
Pursuant to the programmatic agreement, survey work resulted in the designation of about 400 historically signifi-cant bridges that deserve priority for preservation. Over 30 priority bridge projects have progressed under the PA, providing cost savings and faster project delivery as well as enhanced environmental preservation.
The PA allows INDOT to more efficiently and effectively preserve and protect historic bridges by identifying bridges with historic value throughout the state and strategically planning to preserve the most significant historic bridges before rehabilitation becomes cost prohibitive. Rehabilitat-ing historic bridges when appropriate instead of allowing bridges to deteriorate to the point of needing replacement not only saves a historic resource, but also reduces the resource consumption, environmental impacts, and energy use associated with demolition and new construction. Also, the time to advance most bridge replacement projects to construction under the PA has been reduced from five or more years to a year or less.
The National Trust’s 11 Most Endangered Historic Proper-ties website now reports the status of Indiana’s historic
Historic Indiana bridges (top to bottom): St. Joseph, Randolph, Carroll, and Parke.Photos courtesy of Indiana DOT.

23Leaner and Greener: Sustainability at Work in Transportation
bridges as saved, which is a testament to successful collaboration. Successful program-matic agreements for historic bridges have been implemented by numerous state DOTs, including Ohio, Vermont, Minnesota, Oregon, and Texas.18
Sustainable Project Design in New YorkIn 2008, the New York State Department of Transportation (NYSDOT) developed the Green Leadership In Transportation Environmental Sustainability (GreenLITES) pro-gram. GreenLITES was created to ensure that New York’s transportation infrastructure balances what is beneficial to people, while considering what is economically sound and environmentally compatible.
GreenLITES is modeled after the U.S. Green Building Council’s LEED program. Every new project design at NYSDOT is evaluated using a sus-tainability scoring system that measures the extent to which the project incorporates sustainable design choices in terms of: 1) site setting, 2) water quality, 3) materials and resources, 4) energy and atmosphere, and 5) inno-vation. Meeting GreenLITES criteria helps to ensure the most efficient use of limited dollars to achieve sustainable outcomes.
Depending on a project’s score, one of four GreenLITES certification levels may be assigned:
_ GreenLITES Certified: A project design has incorporated a number of sustainable choices;
_ GreenLITES Silver: A project design’s sustainable choices have a high level of impact or advance the state of practice;
_ GreenLITES Gold: A project’s design includes a substantial number of sustainable choices with many of these choices having a high level of impact or having advanced the state of practice; or
_ GreenLITES Evergreen: A project design has incor-porated the highest number of sustainable choices with many of these choices having an extremely high level of positive impact. Additionally, these projects may advance the state of practice or are innovative in the way environmental sustainability is approached on the project.
18 Best Practices and Lessons Learned on the Preservation and Rehabilitation of Historic Bridges, National Cooperative Highway Research Program, Project 25-25 (66), June 2012.
every new project design in nYSdot must be evaluated using a sustainability scoring system.
Image courtesy of New York State DOT.

24 Leaner and Greener: Sustainability at Work in Transportation
Long Island’s NY Route 347 reconstruction project, which broke ground in 2010, is one of the NYSDOT projects that received an Evergreen GreenLITES rating. The project includes the addition of a continuous third travel lane in each direction; a separate bike and shared-use pedestrian path; major intersection improvements; seven new bus stops for transit riders; and a number of environmentally sustainable amenities and benefits including solar lighting at new bus shelters, high-visibility crosswalks, and a rain garden with filtration swale to treat roadway storm water runoff. The project will provide substantial mobility and safety benefits for motorists, pedestrians, and transit users in the Route 347 corridor.
GreenLITES is credited with helping to expedite Route 347’s delivery and cutting project costs. By adopting GreenLITES principles, NYSDOT was able to produce a design solution that addressed the needs of the community, while cutting project costs from $400 million to around $80 million.
GreenLITES is a self-certification program used internally for NYSDOT to measure its performance, recognize and promote good practices, and identify areas in need of improvement. It also provides NYSDOT with a way to demonstrate to the public how it is advancing sustainable practices.
NYSDOT has expanded the Green-LITES certification program to recog-nize and promote sustainable operations and maintenance activities. The Opera-tions Division has identified over 100 tasks that can be tracked and scored to ensure continuous improvement. These include a wide range of practices such as installation of living snow fences, appli-cation of brine prior to winter storms, and restoration of stream banks.
The department is now looking to apply GreenLITES to regional activities and the planning process.
GreenLITES was recognized in 2009 by the Council of State Governments under their prestigious Innovations Award program, and in 2010 received the AASHTO President’s Award for Environment.
Living snow fences.Photos courtesy of New York State DOT.

25Leaner and Greener: Sustainability at Work in Transportation
Puget Sound’s 2010 “Transportation 2040” Plan Sets 30-Year Vision for Sustainable TransportationTravel forecasters predict that by 2040, the Puget Sound region will experience a 40 percent growth in travel.19 The Puget Sound Regional Council (PSRC) is charged with ensuring the region is equipped to accommodate more cars; trucks; air, rail, and ferry passengers; freight; pedestrians; cyclists; and transit riders as demand grows. PSRC’s Trans-portation 2040 plan lays out a 30-year vision for funding and building sustainable trans-portation programs and projects throughout the four-county Seattle-Tacoma region.
Transportation 2040 translates the PSRC’s broad commitment to transportation sustain-ability into tangible actions. The Plan is built around three equal and interrelated strategies that together define what sustainable transportation means for the region and are designed to influence overall transportation investment decisions:
_ Congestion Relief and Better Mobility: To improve system efficiency, the plan rec-ommends creating smart corridors with advanced technology, better information, advanced tolling approaches, and strategic capacity improvements. As an example, one project underway in the Puget Sound region is Washington State DOT’s (WSDOT) deployment of an Active Traffic Management System, including the use of high-tech
19 PSRC, Transportation 2040 Plan Executive Summary (2010).
It’s a good year for lupines along Interstate 5 near Everett, Washington. More than just a colorful springtime show, wildflowers help maintain water quality by preventing erosion on the slopes along the freeway.Photo courtesy of Washington State DOT. Photographer: Dave Tschirgi.

26 Leaner and Greener: Sustainability at Work in Transportation
overhead signs displaying variable speed limits, lane status, and real-time traffic infor-mation so drivers know what is happening on the road ahead. The first signs were installed on northbound I-5, a major freeway traversing the southern part of Seattle. Since then, WSDOT has implemented similar systems on SR520, completed in Novem-ber 2010, and I-90, completed in June 2011. Active traffic management improves safety, reduces congestion, and improves the environment. Although more collision data will be needed for a statistical analysis of collision frequency, WSDOT officials expect to see a measurable and statistically significant reduction in collisions. Congestion relief also means reduced fuel consumption as traffic spends less time stuck in jams.
_ Environmental Protection: A key focus of the PSRC’s long-range plan is to protect and improve the region’s environmental health. This includes ensuring that the region has healthy air, ensuring that transportation projects are better equipped to handle storm-water runoff, and addressing transportation’s role in reducing greenhouse gas emissions and adapting to climate change.
_ New Approach to Funding: The Transportation 2040 financial strategy relies on tradi-tional funding sources in the early years but later transitions to add funding from new user fees, which could include high-occupancy-toll lanes, full facility tolling, and other pricing approaches that replace the gas tax and help manage use of the transportation system.
Puget Sound Ferry.Photo courtesy of Washington State DOT.

27Leaner and Greener: Sustainability at Work in Transportation
Detailed recommendations for program changes and major new projects in three major focus areas help transform Transportation 2040’s vision for sustainable transportation into reality:
_ Maintain, Preserve, and Operate: The plan’s highest priority is to maintain, preserve, and operate the region’s transportation system, and represents the largest program cost;
_ Increase System Efficiency: Use transportation system management strategies like Active Traffic Management and tolling to improve efficiency of the existing transporta-tion system; and
_ Strategically Expand Capacity: Implement strategic capacity investments in all modes of transportation including a 100 percent increase in peak local transit service, bike and pedestrian improvements in regional growth centers, and completion of a network of roadway projects. These investments would rely on users of the new highway capacity to pay for improvements through highway tolling.
Variable speed lanes.Photo courtesy of Washington State DOT.

28 Leaner and Greener: Sustainability at Work in Transportation
Model of Sustainability and Integrated Corridors (MOSAIC) Planning Tool Will Speed Up Project Delivery and Assure Sustainable Transportation Decisions in MarylandFaced with some of the country’s most congested travel corridors, which include the Bal-timore and Washington, D.C. metropolitan areas, transportation planners and engineers at Maryland’s State Highway Administration (SHA) are challenged to find cost-effective transportation solutions that help travelers beat congestion, while protecting Maryland’s precious environmental resources and community quality of life.
Historically, the journey for reaching such solutions has taken many years or even decades. MOSAIC is a new planning calculator developed by the Maryland SHA and the University of Maryland to help transportation planners and their stakeholders move more quickly along the project development path by providing a clear and succinct quantitative assess-ment of the relative environmental, cost, mobility, safety, and economic impacts associated with different project options. MOSAIC also produces a balanced assessment of trade-offs associated with different project alternatives.
Learning from its experience in delivering complex highway improvements like I-95’s Woodrow Wilson Bridge and the Intercounty Connector in the Washington, DC suburbs, SHA recognized the need for a new generation of data-driven decision-support tools.
ICC Interchange.Photo courtesy of ICC Project Team.

29Leaner and Greener: Sustainability at Work in Transportation
By integrating data sets from dozens of statewide databases and giving users the power to analyze them at the click of a mouse, MOSAIC will help the agency swiftly identify project options to optimize environmental, cost, mobility, safety, and economic considerations, and use this analysis to target transportation improvements that offer the best sustainabil-ity performance.
When applied to the US 15 corridor north of Fred-rick, Maryland, the MOSAIC model suggested that converting at-grade intersections to grade-separated interchanges along the US 15 corridor would be more effective in enhancing sustainability than constructing additional travel lanes. Both of the two improvement types would have positive sustainability results com-pared with the no-build scenario.20
At present, MOSAIC’s analytic capabilities are limited to evaluation of projects requiring grade-separated
20 State Highway Administration Research Report: Comprehensive Highway Corridor Planning With Sustainability Indicators, Lei Zhang Principal Investigator, (Oct. 2011).
Bike lane along Woodrow Wilson Bridge that spans the Potomac River.Photo courtesy of Maryland State Highway Administration.
By integrating MoSaIc data into the planning process, Sha staff and their stakeholders can make more informed decisions, more quickly while protecting the environment and eliminating the need for much more costly studies.

30 Leaner and Greener: Sustainability at Work in Transportation
interchanges or general-purpose lanes. In the future, its capabilities may be expanded to include high-occupancy-vehicle lanes, high-occupancy-toll lanes, express-toll lanes, bus-only lanes, lane removal, light rail, and park-and-ride lots.
While MOSAIC offers quantitative answers to complex questions, it also provides a data-driven decision tool to the complex process of planning transportation improvements. Maryland SHA anticipates that use of MOSAIC will encourage early and productive dis-cussions among stakeholders which will help advance projects more quickly, while ensur-ing that they reach more balanced and affordable solutions.
Ultimately, the MOSAIC tool will be integrated with the Maryland Statewide Transporta-tion Model through SHA’s Enterprise GIS system. The Maryland Statewide Transportation Model is a multi-layer travel demand model working at national, statewide, and urban levels to forecast and analyze key measures of transportation system performance. Com-bined with econometric and land-use models, it provides analytic support to long-range transportation planning, scenario analysis of land use patterns, network changes, and economic development assessments. SHA’s Enterprise GIS system is the starting point for achieving the vision for an extremely powerful GIS-based decision support system that integrates multiple data layers, enabling SHA to make sustainable transportation invest-ment decisions.
Regardless of season, weather, or day of the week, shopping remains a steady and significant attraction in Frederick County, located conveniently off of US 15.Photo courtesy Tourism Council of Frederick County.

31
chapter fourLeaner and Greener Leadership vision
For many agencies, sustainable transportation practices are becoming the norm for doing business. Being leaner and greener is becoming part of the mainstream transportation vocabulary and a true commitment to action.
Leadership vision and organizational changes are often the seeds of an agency’s efforts to become leaner and greener. Following are some of the many examples of leadership and organizational change strategies that are helping transportation agencies become leaner and greener.
Los Angeles Links Investment in Transportation with Cost Savings, Energy Efficiency, and Community Quality of LifeLos Angeles County Metropolitan Transportation Authority (LAC-MTA) buses and trains carry 1.4 million trips every weekday, making it one of the largest transit operators in the nation.21 LACMTA also has responsibility for planning all transportation projects within Los Ange-les County and building and operating the county’s high-occupancy-vehicle lanes.
The LACMTA’s Board has put sustainability front and center in its vision for the agency’s future. In 2008, voters approved Measure R, which authorizes LACMTA to spend a projected $40 billion on traffic relief and transportation upgrades throughout the county over the next
21 LACMTA Ridership Statistics—System-wide Ridership Estimate—Average Weekday Boardings (Bus and Rail) http://www.metro.net/news/pages/ridership-statistics/.
LA Metro red line at Union Station.Photo courtesy of Los Angeles County Metropolitan Transit Authority.

32 Leaner and Greener: Sustainability at Work in Transportation
30 years.22 The Board’s 2008 Metro Sustainability Implementation Plan was developed to ensure that transportation decisions are fiscally responsible, socially equitable, and exhibit environmental stewardship.23 Some of the Board’s initial sustainability-focused initiatives include:
_ A Greenhouse Gas Emissions (GHG) Management Plan: LACMTA has developed a GHG Management Plan that has an initial focus on measurement of the agency’s GHG emissions footprint and long-term development of mitigation and adaptation strategies. As of early 2011, 100 percent of LACMTA’s bus fleet was powered by compressed natu-ral gas fueled engines that function more efficiently, contribute less GHG emissions, and reduce particulate matter with the benefit of reducing energy costs while improving public health and protecting the environment;
_ Energy Sustainability Initiatives: LACMTA is investing in numerous energy con-servation and management initiatives and feasibility studies, including the Energy Conservation and Management Plan, which are helping LACMTA save $2 million per year in energy costs. Additional energy conservation initiatives undertaken in 2012 are expected to yield an additional $800,000 in annual savings. Implementation examples include large-scale solar energy projects, energy retrofits at selected buildings, and a pilot installation of wayside energy storage to capture railcar braking energy;
_ Implementation of Sustainable Design Guidelines: LACMTA is incorporating sus-tainability elements into its design and construction projects. For example, LACMTA’s new 45,000 square foot San Gabriel Valley Sector office was the first agency constructed
22 Measure R Overview—LACMTA website, http://www.metro.net/projects/measurer/.
23 LACMTA, Metro Sustainability Implementation Plan (2008).
LACMTA bus hub.Photos courtesy of California DOT.

33Leaner and Greener: Sustainability at Work in Transportation
facility to be awarded a gold Leadership in Environment and Design (LEED) rating. The new building cuts energy use by 25 percent and water consumption by 50 percent compared to a conventional structure, thus saving LACMTA over $75,000 in utility costs each year;24
_ Deployment of an Environmental Management System (EMS): With funding sup-port from the Federal Transit Administration, LACMTA is using an Environmental Management System (EMS) to incorporate sustainable practices into all levels of its operations and across multiple impact areas including water and energy use, emissions, and waste generation. Actions undertaken as a result of the EMS include increased use of energy efficient light fixtures and installation of water and energy efficient dryers in vehicle cleaning facilities; and
_ Staffing for Sustainability: LACMTA has established two full-time staff positions dedicated to managing its sustainability initiatives across the agency, a transportation sustainability energy manager and a transportation sustainability policy manager.
LACMTA’s Board is making an annual $2 million commitment to sustainability-related capital improve-ments—efforts that support multiple elements of the agency’s 3P’s of Sustainability: people, planet, and profit. Within five years, these investments are expected to return an equivalent value in measurable utility savings.
24 Metro News Release: Metro’s First Green Transit Facility Achieves Gold LEED Rating for Environmental Quality (Nov 24, 2008).
LACMTA bus hub.Photos courtesy of California DOT.
LacMta’s sustainability invest-ments are expected to pay for themselves in five years or less.

34 Leaner and Greener: Sustainability at Work in Transportation
GreenDOT Vision Aims to Make MassDOT a National Leader in “Greening” TransportationIn 2010, the Massachusetts Department of Transportation (MassDOT) kicked-off a new initiative called GreenDOT to position itself as a national leader in greening state transportation systems. GreenDOT embeds sustainability into MassDOT’s core businesses from strategic planning to project design and construction to system operations. It has three goals: reducing greenhouse gas emissions; promot-ing walking, bicycling, and public transit; and support for smart growth development. MassDOT is pursuing the GreenDOT Vision and plans to achieve the three GreenDOT goals by making sustainabil-ity an integral part of every MassDOT employee’s job and by integrating these objectives into its organizational vision and mission.
The GreenDOT initiative includes groundbreaking greenhouse gas reduction targets man-dated under Massachusetts’s 2008 Global Warming Solutions Act. GreenDOT sets a goal of reducing greenhouse gas emissions by over two million tons by 2020 by balancing highway system expansion projects with other projects that support smart growth development and that promote public transit, walking, and bicycling.
Image courtesy of Massachusetts DOT.

35Leaner and Greener: Sustainability at Work in Transportation
Greendot sets a goal of reducing greenhouse gas emissions from transportation in Massachusetts by over two million tons by 2020.
The GreenDOT Implementation Plan outlines specific goals in seven areas: air, energy, land, materials, policy/planning, waste, and water. For each goal, the plan lists a series of tasks with indicators and time horizons for 2013, 2015, and 2020, for each of the MassDOT divi-sions responsible for implementation.
The tasks and indicators for each time horizon will be integrated into MassDOT’s perfor-mance management efforts, and include a type of score card to track progress on achieving the goals.
For example, for the goal of reducing greenhouse gas emissions, the plan identifies the follow-ing tasks: increase vehicle electrification facilities, increase use of alternative and renewable fuels, increase fuel efficiency of light duty vehicles, increase fuel efficiency of maintenance and construction equipment, increase telecommuting and meetings by web conference, and track progress toward statewide GHG reduction and other sustainability goals.
l Reduce greenhouse gas emissions
l Improve statewide air quality
l Consume less energy
l Increase reliance on renewable energy
l Minimize energy + chemicals used in maintenance
l Enhance ecological performance of MassDOT-impacted land
l Improve life-cycle impacts of investments
l Purchase environmentally preferred products
l Build green facilities for MassDOT
l Design a multi-modal transportation system
l Promote healthy transportation + livable communities
l Achieve zero solid waste disposal
l Reduce all exposure to hazardous waste
l Use less water
l Improve ecological function of water systems
Green DOT Goals
Source: MassDOT GreenDOT Implementation Planhttp://www.massdot.state.ma.us/GreenDOT/GreenDOTImplementationPlan.aspx

36 Leaner and Greener: Sustainability at Work in Transportation
The plan then provides a set of indicators for each of the tasks, with goals to reach for each time horizon. For example, for the goal of increasing vehicle electrifica-tion, indicators include: two truck electrification facili-ties to be piloted at highway service areas by 2013, way-side electrification stations to be installed at six highway service areas by 2015, and truck wayside electrification to be provided at all highway service areas by 2020.
Examples of GreenDOT efforts underway include: _ Increased use of hybrid, electric, and clean diesel
vehicles; _ Installation of electric vehicle chargers along the
state highway system; _ Use of energy efficient LED bulbs in all new traffic
and tunnel lights; _ Planting of slow-growing grass requiring less mow-
ing for reduced energy use; _ Water recycling and conservation in bus and vehicle
washing; and _ Use of warm, lower emission asphalt mix to replace hot mix on road repairs.
“Massdot is committed to having a positive impact on our environment while moving our customers and goods safely, reliably and efficiently. the Green dot Implementation plan will help move us forward to achieving our sustainability goals by providing us with a framework to measure successful implementation through a performance management system.”
Richard A. Davey Secretary and CEO, Massachusetts
Department of Transportation

37Leaner and Greener: Sustainability at Work in Transportation
NCDOT’s Accountability Framework: A Blueprint for SustainabilityRecent sustainability leadership efforts include work by North Carolina Department of Transportation (NCDOT) to integrate the concepts of sustainability into its decision-making and to make the link between mobility and support for communities and regions across the state. The effort has resulted in the articulation of eight principles with corre-sponding outcomes, objectives, and performance measures. The eight principles focus on: moving people and goods; choices; connectivity; resource protection; prosperity; account-ability; healthy communities; and organizational responsibility.
The initiative began with an extensive review of sustainability plans across all state DOTs. The purpose of the review was to identify and synthesize the best practices in promot-ing sustainability and creating a framework for sustainable decision-making. Following this review, an internal NCDOT survey was conducted to identify existing sustainable practices and better understand how the department views the concept of sustainability. Focus groups with agency staff, and interviews with external stakeholders—including other state agencies, MPOs/RPOs, councils of government, transit service providers, and private industry partners—were used to present and discuss the concept of sustainability, identify additional practices and initiatives that align with those concepts, and shape the subsequent principles and objectives. The department then identified metrics that would be used to access consistency and progress in meeting outcomes associated with each of the principles.

38 Leaner and Greener: Sustainability at Work in Transportation
Motorcyclist travels along the Blue Ridge Parkway.Photo courtesy of VisitNC.com.

39Leaner and Greener: Sustainability at Work in Transportation
Integration of the concepts of sustainability are reflected in NCDOT’s newly expanded mission statement: “Con-necting people and places safely and efficiently, with accountability and environmental sensitivity, to enhance the economy, health, and well-being of North Caro-lina.” The DOT’s mission was expanded and refined to recognize broadened responsibilities and aspirations, and now emphasizes a triple bottom line of economic development, human health and well-being, and envi-ronmental resource stewardship.
The principles have also been integrated into NCDOT’s statewide transportation plan (2040 Plan) and its 5- and 10-year transportation improvement programs (Policy to Projects). Efforts are also underway to evaluate project prioritization criteria and enhance consideration of sustainability concepts in the project prioritization process.
The effort has culminated in the development of an Accountability Framework that links sustainability-related principles to key overarching plans and policies, strategies, and performance measures to monitor implementation progress and effectiveness over time. Further integration of these concepts into initiatives and decision-making is key to imple-mentation. Other implementation elements include a communications plan, monitoring, and continuous improvement.
connecting people and places safely and efficiently, with ac-countability and environmental sensitivity, to enhance the econ-omy, health, and well-being of north carolina.

40 Leaner and Greener: Sustainability at Work in Transportation
Institutionalizing Leaner and Greener PracticesAn increasing number of transportation agencies across the nation have established procedures, plans, and dedicated staff to institutionalize leaner and greener practices across their programs and projects. Additional examples of these cross-cutting efforts include the following:
oregon dotA pioneer in sustainable transportation, the Oregon Department of Transportation (ODOT) was the first state transportation agency to adopt an agency-wide sustainability plan. Issued in 2004, that plan stressed inclusion of sustainability considerations in the update of the Oregon Transportation Plan, implementation of a sustainable bridge deliv-ery program (OTIA III), and development of an environmental management system for ODOT’s maintenance yards.
In 2008, ODOT embarked on a broader three-volume sustainability plan aimed at address-ing both internal and external operations in seven focus areas: health and safety; social responsibility/workforce well-being and development; environmental stewardship; land use and infrastructure; energy/fuel use and climate change; material resource flows; and economic health. Volume I of the plan, issued in 2008, provides the vision and framework for ODOT’s sustainability goals and strategies.
Volume II of the sustainability plan, completed in 2010, sets goals, strategies, and perfor-mance measures for ODOT’s internal operations, such as its facilities and fleet. It includes goals such as increasing use of alternative fuels and electric vehicles in the ODOT fleet, reducing the amount of waste generated by facilities, and decreasing greenhouse gas
emissions from overall agency opera-tions. Volume III of the plan, which has not yet been completed, will address goals and strategies for management and operation of the statewide trans-portation system. This will include sustainable practices in project delivery, highway design, and construction; and identification of the best tools to man-age and implement sustainability within individual projects.
The long list of sustainable practices and programs overseen by ODOT’s sustain-ability program manager and the cross-discipline ODOT Sustainability Council are documented in an annual sustain-ability progress report. Some examples
Gorge Highway overlooking the Columbia River.Photo courtesy of Travel Oregon. Photographer Paul Geddis.

41Leaner and Greener: Sustainability at Work in Transportation
include installation of electric vehicle charging stations, purchase of electric vehicles, increased use of alternative fuels such as biodiesel for the ODOT fleet, and installation of solar panels on ODOT right-of-ways for the first-ever Solar Highway projects.
ODOT also considers sustainability in project decision-making. The Columbia River Crossing Project—a joint effort of the Oregon and Washington DOTs—was the first in the nation to include a project-level sustainability plan. Sustainability goals for the project are to be achieved through a long list of project elements, including addition of high capacity transit, reducing vehicle miles traveled, use of tolling, electronic safety technologies, bicy-cle and pedestrian facilities, and use of sustainable construction materials and methods.
ODOT is also working with its sister agency, the Department of Land Conservation and Development, to implement the Oregon Sustainable Transportation Initiative (OSTI), an integrated statewide effort to reduce greenhouse gas emissions from the transportation sector while creating healthier, more livable communities and greater economic opportunity.
Washington State dotA leader in sustainability, the Washington State Department of Transportation (WSDOT) has incorporated the concept in all aspects of its work. The department’s sustainable prac-tices are posted on the Internet and are described in a series of folio fact sheets to educate the public.25 Examples of WSDOT’s leaner and greener efforts cut across a broad range of focus areas:
_ Improving mobility and traffic operations with the installation of electronic, variable speed limit and lane status signs, electronic tolling, ramp meters, roundabouts, and high-occupancy-vehicle lanes;
_ Conserving fuels and energy through the West Coast Green High-way Initiative to support the use of electric and alternative-fuel vehicles; upgrading the WSDOT vehicle fleet; and installation of solar-powered traffic control systems;
_ Promoting economic vitality and stewardship by addressing key traffic chokepoints, investing in rail, separating freight from rail and light-vehicle traffic around ports, and boosting incident response and traffic management;
25 Washington State DOT Sustainable Transportation folio, http://www.wsdot.wa.gov/NR/ rdonlyres/0CBC867A-B34A-4F39-B1C7-8ECBE2581780/0/Sustainable_092111_WEB.pdf (Fall 2011).

42 Leaner and Greener: Sustainability at Work in Transportation
_ Focusing on preservation and maintenance of the existing system by promoting longer lasting pave-ments, using recycled materials, using native plants, and using precision roadway salt applications in winter months to minimize amount of salt needed;
_ Improving safety by installing cable median bar-riers, cleaning catch basins and drains to prevent flooding, retrofitting bridges and structures to withstand earthquakes, and building roundabouts to improve traffic flow and reduce the risk of collisions;
_ Improving design and construction techniques with innovative engineering for structures that can endure a harsher climate, and innovative contracting for more efficient project delivery;
_ Protecting and enhancing the environment by removing fish passage barriers, addressing storm-water pollution by preventing erosion and filtering runoff, connecting wildlife habitat, and restoring natural vegetation;
_ Advancing community partnerships by integrating bicycle and pedestrian elements into highway projects and increasing investments to promote carpools, vanpools, transit, and telecommuting; and
_ Reducing emissions linked to climate change through efforts focused on operating the system efficiently, lowering the carbon content of fuels, supporting improved vehicle technologies, and supporting a variety of transportation options.
district of columbia dotThe District of Columbia Department of Transporta-tion’s (DDOT) Sustainability Plan identifies eight prior-ity areas for sustainability and establishes goals, actions, measures, and targets for each. The priority areas are promoting transportation and land use linkage; improv-ing mode choices, accessibility, and mobility; making effective cost assessments in decision-making; sup-porting the economy; improving DDOT operations and project development processes; protecting the environment and conserving resources; climate change adaptation; and promoting livability and safety. For each priority area, measures and targets are identified, such as reduction of annual greenhouse gas emissions from DDOT projects by 5 percent annually.
“at Washington State dot, a sustainable transportation system preserves the environment, is durable, takes into account how we build and the materials we use, and is managed and oper-ated using policies and strategies that meet society’s present needs without compromising the ability of future generations to meet their own needs.”
Paula Hammond Secretary, Washington State Depart-
ment of Transportation and Chair, AASHTO Sustainable Transportation:
Energy, Infrastructure, and Climate Solutions Steering Committee
DC visitors enjoy sightseeing with Segues, using the proper bike lanes for safety.Photo courtesy of Meredith LaDue.

43Leaner and Greener: Sustainability at Work in Transportation
DDOT also is advancing its Great Streets initiative, with efforts such as the Nannie Helen Burroughs Avenue project. By reducing the number of traffic lanes from four lanes to a single lane in each direction, DDOT was able to install raised landscaped medians to create pockets to protect pedestrians and motorists and add bike lanes for safer cycling. The project includes low impact development (LID) features, such as bioretention areas, stormwater planters, and permeable concrete sidewalks, all of which help treat stormwater and reduce runoff into local waterways
DDOT also has launched a Green Alley pilot program to demonstrate use of permeable pavement and other LID techniques in alleys throughout the city.
california dot (caltrans)Launched in 2010, Caltrans’s Smart Mobility frame-work seeks to ensure that the state’s transportation investments achieve balanced outcomes for mobility, environmental protection, social equity, and economic growth. The framework establishes six Smart Mobility principles: location efficiency, reliable mobility, health and safety, environmental stewardship, social equity, and a robust economy. Under the framework, transpor-tation planning and project design are conducted based on seven newly established place-types. For each place-type, performance measures are developed to align with the principles.
A key element of the Smart Mobility framework is the development of the California Interregional Blueprint, a statewide land use–transportation plan that will integrate the state’s various modal plans and incorporate individual blueprints developed by regions across the state.26
chicago dotChicago Department of Transportation’s (CDOT) Action Agenda, Chicago Forward, outlines how the city will achieve a range of leaner and greener goals for transportation.27 For example, Chicago’s GreenStreets effort recognizes the importance of trees in an urban setting. The program plants trees along and near major streets and targets areas in the city with high urban heat island effects.
26 Caltrans: Smart Mobility 2010: A Call to Action for the New Decade, http://www.dot.ca.gov/hq/tpp/offices/ ocp/smf_files/SmMblty_v6-3.22.10_150DPI.pdf, and Smart Mobility Fact Sheet, http://www.dot.ca.gov/ hq/tpp/offices/ocp/smf_files/smf_factsheet_may2012.pdf (2012).
27 Chicago Forward: Department of Transportation Action Agenda, http://www.cityofchicago.org/ dam/city/depts/cdot/Admin/ChicagoForwardCDOTActionAgenda.pdf (2012).

44 Leaner and Greener: Sustainability at Work in Transportation
CDOT also has installed more than 100 Green Alleys, which incorporate permeable pavement to filter stormwater; high-albedo pavement to reflect sunlight and reduce urban heat island effects; recycled materials; and dark sky-compliant light fixtures. The city also is working to retrofit traffic signals and streetlights with more energy-efficient lighting elements and fixtures. Converting from high-pressure sodium to halide fixtures alone is expected to save 15.2 million kilowatt hours in energy use, prevent the emission of nearly 10,500 metric tons of CO2, and save taxpayers $850,00 in electric bills each year.
Sustainable Streetscape in ChicagoThe Cermak/Blue Island Sustainable Streetscape demonstration project in Chicago exem-plifies the types of leaner and greener practices Chicago DOT is pursuing across the city:
_ Use of permeable pavement, bioswales, planters, and street trees to divert 80 percent of typical average annual rainfall from sewers.
_ Use native or drought-tolerant plants to eliminate the use of potable water for landscape irrigation.
_ Improvements to bus stop shelters, signage, and lighting; bike lanes; and sidewalks. _ Use of reflective surfaces and dark-sky friendly light fixtures to reduce energy use
by 40 percent compared to traditional streetscapes. _ Recycling of at least 90 percent of construction waste and use of recycled content for at
least 10 percent of construction materials. _ Reducing ambient summer street temperatures on streets and sidewalks through the
use of high-albedo (more highly reflective) pavement, permeable pavements, roadway coatings, landscaping, and trees.
_ Use of low-sulfur fuel for construction vehicles, limiting idling, and ensuring 40 percent of materials are from local sources—extracted, harvested, recovered, or manufactured within 500 miles.
A) Alley with impermeable pavement and poor drainage. B) Alley incorporating green alley principles. Photos courtesy of City of Chicago DOT.
A B

45Leaner and Greener: Sustainability at Work in Transportation
Illinois dotIn 2010, the Illinois Department of Transportation (IDOT) joined other DOTs in efforts to institutionalize sustainability by establishing an agency sustainability point person. The IDOT sustainable practices manager is part of the Business Services group of IDOT’s Department of Finance and Administra-tion. This position is responsible for all sustainability activities and recommen-dations to allow for more consistent and coordinated actions across IDOT.
One of the sustainability efforts IDOT has spearheaded is the Illinois Liv-able and Sustainable Transportation (I-LAST) Rating System and Guide. In a three-year collaboration among the Illinois Department of Transportation, the Illinois Road and Transportation Builders Association, the American Council of Engineering Companies of Illinois, and over 25 engineering and construction community representa-tives, the I-LAST sustainability initiative was developed to guide and measure sustainable performance in the high-way sector. I-LAST is a voluntary self-evaluation tool that provides a comprehensive list of practices that have the potential to bring sustainable results to highway projects; establishes a simple and efficient method of evaluating (scoring) transportation projects with respect to sustainability elements; and records and recognizes the use of sustainable practices in the transportation industry.
Other sustainability-related efforts underway at IDOT led by the sustainable practices manager include:
_ Promoting awareness about sustainability within IDOT to encourage cohesiveness on sustainability across the agency;
_ Implementation of PrePass, which is an automatic vehicle identification system that allows transponder-equipped commercial vehicles to be prescreened at designated weigh facilities, therefore saving traveler time and fuel and cutting carbon emissions;
_ Establishment of a bio-fuel signage program that promotes access to E-85 fuel stations located on Interstates across the state of Illinois and elsewhere in the Midwest;

46 Leaner and Greener: Sustainability at Work in Transportation
_ Tracking IDOT’s success in meeting sustainability goals over time; and _ Creation of an internal Green Team made up of representatives from across the DOT
to provide a forum for sharing sustainability strategies.
At IDOT, the sustainable practices manager’s efforts depend on support from a network of staff throughout the organization. By creating a sustainability-focused position, IDOT can better promote its successes, build stronger relationships with communities, protect environmental resources, and reduce costs.

47
The challenges that are driving interest in sustainability are clear and no state is unaffected: Transportation leaders and their agencies must find ways to simultaneously fix aging transportation infrastructure; fill a widening gap between transportation investment needs and funding; bring life to the economy; and protect and enhance environmental quality.
In this environment, transportation agencies are seizing opportunities to create smart transportation solutions that not only balance fiscal responsibility and support for a robust economy, but also promote a vibrant community quality of life and show a strong commitment to protect-ing the environment. However, no one-size-fits-all solution exists and states’ efforts are described by many names—sustainability, leaner and greener, triple bottom line, and good business sense—to name a few.
The practices described in this report demonstrate that sustainable transportation practices are becoming the norm for doing business in many agencies. In an economic climate where cost savings are essential, leaner and greener sustainability is on the way to becoming part of the main-stream transportation vocabulary—not just as a slogan, but as a real commitment to action.
chapter fIveconcLusions

48 Leaner and Greener: Sustainability at Work in Transportation
These commitments are evident in a wide range of actions underway at DOTs across the nation:
_ Reducing mowing and use of herbicides while saving money and enhancing wildlife habitat;
_ Increasing use of native plants and wildflowers; _ Implementing precision application methods and natural solutions like living snow
fences to reduce use of salt and chemicals in winter months; _ Using of low-impact development techniques to manage stormwater, such as permeable
pavement, bio-swales, planters, and street trees; _ Recycling of asphalt and concrete pavement and demolition debris; _ Using warm-mix asphalt and recycled asphalt shingles in pavement; _ Increasing lifespan of roads using perpetual asphalt pavements; _ Increasing use of innovative solar lighting technologies on maintenance vehicles and
energy efficient lighting on roadways; _ Using innovative technologies such as prefabricated bridge elements; _ Promoting alternative fuels and vehicles; _ Promoting transportation options including bicycling, walking, and transit; _ Using programmatic agreements for faster project delivery with better outcomes; _ Institutionalizing sustainability commitments through all elements of DOT programs
and practices, including DOT facilities as well as transportation planning, design, maintenance, and operations; and
_ Rating and certification systems to track sustainability performance and promote proj-ects and programs that meet the triple bottom line.
Night paving operations, Hwy 51, Arden Hills, Minnesota. Photo courtesy of Minnesota DOT.

Photo courtesy of California DOT. Photographer Janis DeVerter.
49Leaner and Greener: Sustainability at Work in Transportation
The Center for Environmental Excellence by AASHTO will continue to document and promote the kind of programs and activities showcased in this report. The Center main-tains a website section dedicated to sustainability that includes a sustainability overview, recent developments, case studies, research, documents and reports, and relevant orga-nizations and training. The Center will continue to maintain and update the site with the innovative programs and projects happening at the state DOTs. Visit the Center website athttp://environment.transportation.org.

american association of Statehighway and transportation officials444 North Capitol Street, N.W.Suite 249Washington, DC 20001
environment.transportation.org
Publication Code: LAG-1
ISBN: 978-1-56051-525-8
Copyright © 2012, Center for Environmental Excellence by AASHTO
All Rights Reserved. This book, or parts thereof, may not be reproduced in any form without written permission of the publisher. Printed in the United States of America.
This material is based upon work supported by the Federal Highway Administration under Cooperative Agreement No. DTFH61-07-H-00019. Any opinions, findings, and conclusions or recommendations expressed in this publication are those of the Author(s) and do not necessarily reflect the view of the Federal Highway Administration.
The paper on which this report is printed is made of 55% recycled materials— 30% post-consumer waste—and certified by the Forest Stewardship Council (FSC). Visit www.fscus.org/paper for more information on FSC certified paper.