Lean Enterprise Distribution Tactics with Customer · PDF fileLean Enterprise Distribution...
116
Lean Enterprise Distribution Tactics with Customer Supply Chain Integration by Eric A. White B.S. Mechanical Engineering Kettering University 1999 Submitted to the Sloan School of Management and the Department of Mechanical Engineering in Partial Fulfillment of the Requirements for the Degrees of Master of Science in Mechanical Engineering and Master of Science in Management in conjunction with the Leaders for Manufacturing Program at the MASSACHUSETTS INSTITUTE OF TECHNOLOGY June 2003 2003 Massachusetts Institute of Technology All Rights Reserved Signature of Author _______________________________________________________ Department of Mechanical Engineering MIT Sloan School of Management June 9, 2003 Certified by _____________________________________________________________ Stephen C. Graves Abraham J. Siegel Professor of Management Science and Engineering Systems Thesis Supervisor Certified by _____________________________________________________________ Deborah Nightingale Professor of the Practice of Aeronautics and Astronautics and Engineering Systems Thesis Supervisor Read by ________________________________________________________________ David Hardt Professor of Mechanical Engineering and Engineering Systems Thesis Reader Accepted by _____________________________________________________________ Margaret Andrews Executive Director, MBA Program MIT Sloan School of Management Accepted by _____________________________________________________________ Ain Sonin Chairman, Graduate Committee Department of Mechanical Engineering
Transcript of Lean Enterprise Distribution Tactics with Customer · PDF fileLean Enterprise Distribution...

Lean Enterprise Distribution Tactics with Customer Supply Chain Integration by
Eric A. White
B.S. Mechanical EngineeringKettering University 1999
Submitted to the Sloan School of Management and the Department of Mechanical Engineering
in Partial Fulfillment of the Requirements for the Degrees of
Master of Science in Mechanical Engineering and
Master of Science in Management in conjunction with the Leaders for Manufacturing Program
at the MASSACHUSETTS INSTITUTE OF TECHNOLOGY
June 2003 ª2003 Massachusetts Institute of Technology
All Rights Reserved
Signature of Author _______________________________________________________ Department of Mechanical Engineering
MIT Sloan School of Management June 9, 2003
Certified by _____________________________________________________________ Stephen C. Graves
Abraham J. Siegel Professor of Management Science and Engineering Systems Thesis Supervisor
Certified by _____________________________________________________________ Deborah Nightingale
Professor of the Practice of Aeronautics and Astronautics and Engineering Systems Thesis Supervisor
Read by ________________________________________________________________ David Hardt
Professor of Mechanical Engineering and Engineering Systems Thesis Reader
Accepted by _____________________________________________________________ Margaret Andrews
Executive Director, MBA Program MIT Sloan School of Management
Accepted by _____________________________________________________________ Ain Sonin
Chairman, Graduate Committee Department of Mechanical Engineering

Lean Enterprise Distribution Tactics with Customer Supply Chain Integration
by
Eric A. White
B.S. Mechanical EngineeringKettering University 1999
Submitted to the Sloan School of Management and the Department of Mechanical Engineering
in Partial Fulfillment of the Requirements for the Degrees of
Master of Science in Mechanical Engineering and
Master of Science in Management
Abstract
This thesis focuses on distribution tactics developed and analyzed for the lean extended enterprise of a chemical/imaging firm. The work describes the application and concept of value delivery heijunka as a key capability of lean extended enterprises. The thesis also encompasses topics important for lean extended enterprises. Notable topics include the theory of the firm and the evolution of business models, technologies, and lean enterprises as complex adaptive systems. The central concept of partitioning complexity through heijunka in value creation, value capture, value development, and value delivery is proposed. Future research of heijunka complexity partitioning is suggested for lean extended enterprises and natural complex adaptive systems.
Company: Eastman Kodak Co.; Rochester, NY; chemical/imaging industry
Thesis Advisors: Stephen C. Graves Abraham J. Siegel Professor of Management Science and Engineering Systems
Deborah Nightingale Professor of the Practice of Aeronautics and Astronautics and Engineering Systems
Keywords: lean enterprise, supply chain, distribution, evolution, complex adaptive systems
2

Acknowledgements
I would like to thank Eastman Kodak Co. for sponsoring this work. I greatly appreciate the company’s continuing support of the Leaders For Manufacturing program. I sincerely hope I added enough value from the project and this thesis in return for the value that I gained from the experience.
I also thank the Leaders For Manufacturing program for its support. The faculty, staff, corporate partners, and peers in the program truly are an amazing community of people. It has been a privilege and an honor to learn, work, and live with you.
In particular, I would like to acknowledge the following individuals:
Stephen Graves, thesis advisor – for your deep insights Deborah Nightingale, thesis advisor – for your creativity and flexibility Earl Chapman, Eastman Kodak Co., supervisor – for your inspiration and determination Tom Mooney, Eastman Kodak Co. – for your energy and persistence
I would personally like to thank Jon Griffith, Patty Sullivan, and Nancy Young-Wearly for letting Elizabeth and I into your lives. You have been great friends and supporters throughout the program. Your friendships have made this experience significantly more enjoyable and stimulating.
I would also like to thank my family, particularly my parents Graham, Joann, Jack, and Pat. I have been awed by the substantial support and guidance you have provided through this long and sometimes painful process.
I dedicate this thesis to my wife Elizabeth. I thank you so much for your patience and understanding throughout these stressful months. We have endured so much together. I hope I can provide as much love and support as you have afforded me during this journey. Although it has been difficult, I would only be willing to go through it for you.
3

Table of Contents
Abstract ............................................................................................................................... 2Acknowledgements .............................................................................................................. 3Table of Contents ................................................................................................................ 4Chapter 1: Introduction ..................................................................................................... 6
1.1 Lean enterprise activities at Eastman Kodak Co. .................................................... 61.2 Motivation................................................................................................................ 91.3 Organization............................................................................................................. 9
Chapter 2: Literature Review .......................................................................................... 102.1 Supply Chain & Operations Research (OR) .......................................................... 102.2 Logistics ................................................................................................................. 122.3 Operations and Technology Strategy..................................................................... 122.4 Alliances ................................................................................................................ 16
2.5 Organizational Strategy............................................................................................. 182.6 Prescriptive Accounts ............................................................................................ 182.7 Historical Taxonomies ........................................................................................... 232.8 Massachusetts Institute of Technology resources.................................................. 26
Chapter 3: Project Analysis............................................................................................. 293.1 Problem Statement ................................................................................................. 293.2 Situation/Background ............................................................................................ 29
3.2.1 Approach......................................................................................................... 293.2.2 Summary of Findings...................................................................................... 30
3.3 Current value stream map ...................................................................................... 303.4 Training simulation of current and future value streams ....................................... 333.5 Heijunka process description and challenges ........................................................ 42
3.5.1 Withdrawal card process................................................................................. 423.5.2 Production card process .................................................................................. 433.5.3 Heijunka challenges ........................................................................................ 44
3.6 Supply chain model................................................................................................ 483.6.1 Information collection..................................................................................... 483.6.2 Model construction ......................................................................................... 483.6.3 Model analysis ................................................................................................ 52
3.7 Value Stream Future State Map ............................................................................. 533.8 Implementation ...................................................................................................... 54
3.8.1 Constraint discovery ........................................................................................ 543.8.2 Constraint mitigation ....................................................................................... 543.8.3 Team preparation ............................................................................................ 58
Chapter 4: Organizational Processes.............................................................................. 594.1 Three Perspectives on Organizational Processes ................................................... 59
4.1.1 Strategic design ............................................................................................... 594.1.2 Political ........................................................................................................... 60
4.1.2.1 Major Stakeholders .................................................................................. 604.1.2.2 Compatibility of interests......................................................................... 614.1.2.3 Distribution of Political Power ................................................................ 624.1.2.4 History of Lack of Conflict Complicated Buy-In .................................... 62
4

4.1.3 Cultural ........................................................................................................... 633.1.3.1 Symbolic Meaning of the Lean Enterprise Distribution Project.............. 634.1.3.2 Infusion of New Cultural Value: Total Value.......................................... 634.1.3.3 Communication of Lean Enterprise Distribution within Kodak Culture. 644.1.3.4 My Role Within the Kodak Culture......................................................... 644.1.3.5 Interactions of the Three Perspectives ..................................................... 64
4.2 Leading the Change Process .................................................................................. 654.2.1 Sensemaking ................................................................................................... 654.2.2 Relating ........................................................................................................... 654.2.3 Visioning......................................................................................................... 664.2.4 Inventing ......................................................................................................... 674.2.5 My “Dual Parallel Approach” Change Signature; Feedback; Team Quality . 67
4.3 Evaluation and Recommendations......................................................................... 684.3.1 Evaluation Using Metrics ............................................................................... 684.3.2 Evaluation as a Change Process...................................................................... 68
Chapter 5: Theory and application.................................................................................. 695.1 Theory of the Firm ................................................................................................. 69
5.1.1 Neoclassical View (Economics) ..................................................................... 695.1.2 Transaction Cost (TC) View (Coase) ............................................................. 695.1.3 Transaction Cost (TC) View (Williamson) ..................................................... 705.1.4 Agency View .................................................................................................. 715.1.5 Stakeholder View............................................................................................ 715.1.6 Schumpeter View............................................................................................ 725.1.7 Resource-Based View (RBV) ......................................................................... 735.1.8 Dynamic Capabilities View ............................................................................ 735.1.9 Integrated model of the generic firm .............................................................. 745.1.10 Evolutionary view - Dual level individual with single mode (evolutionary economics; biological reductionism) ........................................................................ 75
5.2 Evolutionary view – Hierarchical individuals with multiple modes (White) ........ 785.2.1 Revision of agency to hierarchical evolutionary “individuals” ...................... 795.2.2 Revision of efficacy to include multiple modes of change............................. 805.2.3 Revision of scope to include structural, historical, and functional factors ..... 815.2.4 Synthesis of revisions ..................................................................................... 84
5.3 Application to Business Models and Technologies ............................................... 855.4 Application to Lean Extended Enterprises ............................................................ 88
: Conclusion..................................................................................................... 94Chapter 6Appendix A - Model .......................................................................................................... 95
A.1 Item data................................................................................................................ 95A.2 Time data............................................................................................................... 95A.3 Demand data ......................................................................................................... 95A.4 Supply data............................................................................................................ 96A.5 Inventory data ....................................................................................................... 97A.6 Cost data.............................................................................................................. 100A.7 Project valuation data.......................................................................................... 104
Appendix B – Business Case ........................................................................................... 105Bibliography ................................................................................................................... 106
5

Chapter 1: Introduction
My previous experience in the aerospace industry placed me in a terrific position to recognize best practices in lean manufacturing. I had previously been involved in basic lean manufacturing processes. Aerospace Improvement Workshops (AIWs), or kaizen events, were initialized by Boeing and spread to their suppliers. I was involved with several of these kaizens and their preparations at Moog, Inc. before coming to the Leaders For Manufacturing program.
In my experience, these kaizen events seemed to be the pinnacle of the Toyota Production System. I learned throughout the program and in my experience at Eastman Kodak Co. that kaizen is the “tip of the iceberg.” Kaizen events are one of many different techniques within the Toyota Production System that make the system effective.
1.1 Lean enterprise activities at Eastman Kodak Co.
I had the opportunity to work in the Kodak Operating System (KOS) office at Kodak. The KOS office was the central lean office that advances lean principles throughout Eastman Kodak Company. It based its activities on the Toyota production system. The KOS office had representatives within most manufacturing flows. It attempted to retain and build lean knowledge in manufacturing by facilitating a variety of activities, including kaizen improvement events. The creation of the "Enterprise KOS" office marks the organizational beginning to develop a lean extended enterprise.
Although there are many techniques, there are several key principles to lean production and also the lean extended enterprise. In the words of Taiichi Ohno, one of the primary founders of lean production,
All we are doing is looking at the time line; from the moment the customer gives us an order to the point when we collect cash. And we are reducing that time line by removing the non-value-added wastes (Ohno ix).
The opportunity to work in a lean production office as effective and energetic as the Kodak Operating System office was inspiring. They had a remarkable ability to bring external ideas and energy into Eastman Kodak Co., as well as involving every part of the organization to institutionalize both the vision and techniques of TPS.
During my previous experience, I had primarily been involved in value stream mapping, 5S, and kaizen activities. I expanded my mental model for the reasons behind kaizen activities. They should have been directed at problems that continuous improvement from the shop floor could not overcome on their own without external brainstorming and initiative. Therefore, as I came to quickly realize at KOS, there were many more techniques and tactics in TPS. Some of these included:
6
• Level production volume and product mix (heijunka) • Base production plans on customers’ order volume (genryo seisan, takt) • Reduce setup change time and lot size • Piece-by-piece transfer of parts between processes (ikko-nagashi) • Flexible task assignment for volume change, productivity improvement (shojinka) • Multitask job assignment along the process flow (takotei-mochi) • U-shape machine layout that facilitates flexible and multiple task assignment • Automatic detection of defects and automatic shutdown of machines (jidoka) • Foolproof prevention of defects (poka-yoke) • Assembly line stop cord (andon cord) • Real-time feedback of production troubles (andon signboard) • On-the-spot inspection by direct workers • Separation of value-adding from non-value adding work (mizusumashi) • Building-in quality (tsukurikomi) • Cleanliness, order, discipline on the shop floor (5-S) • Visual management • Frequent revision of standard operating procedures (standard work improvement) • Quality circles • Standardized tools for quality improvement (7 tools for QC, QC story) • Worker involvement in preventive maintenance (total productive maint./TPM) • Low-cost automation or semi-automation with just enough functions • Production Preparation Process (3P)
The Kodak Operating System office was keenly aware of the difficulties in integrating the diverse techniques of TPS to make the system function. They created a powerful symbol for this challenge of every company attempting to improve their processes. This symbol was a puzzle with the different techniques. None of these techniques represent the essence of the Toyota Production System alone. They must be part of a philosophy and vision that sustains each of these techniques in the quest for an integrated lean extended enterprise. The KOS “puzzle” is illustrated below:
Figure 1.1.1 Kodak Operating System “Puzzle”
7
Image removed due to copyright reasons.
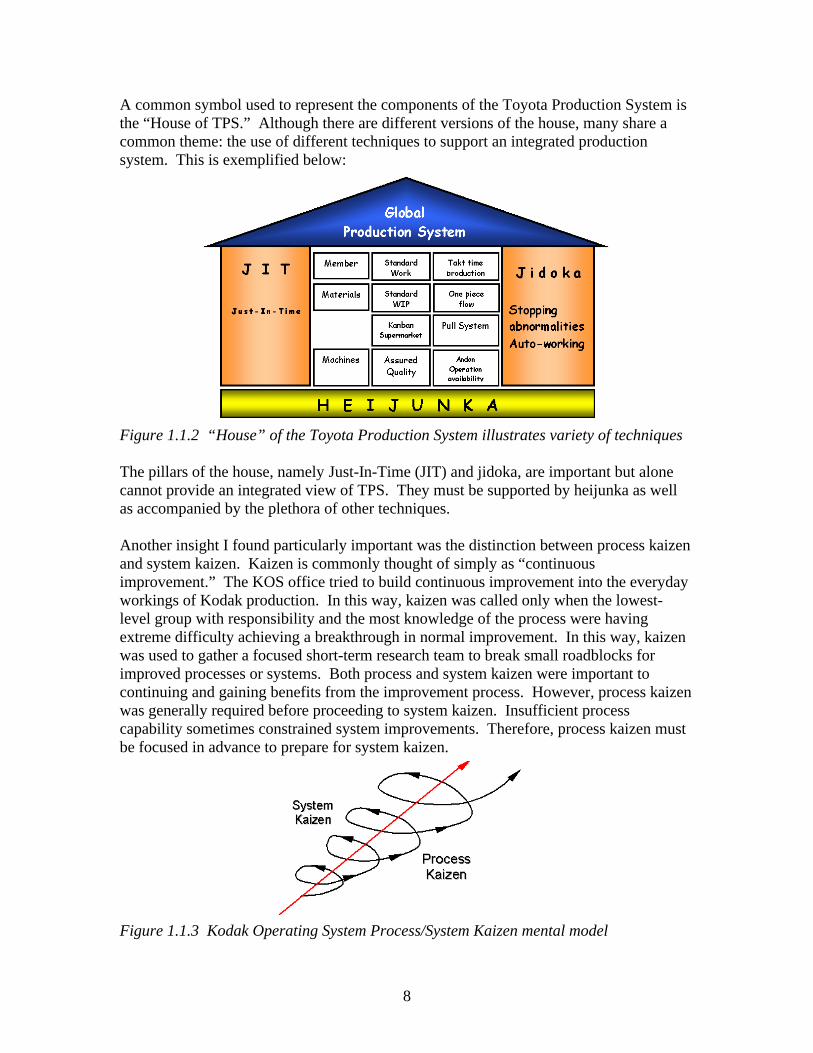
A common symbol used to represent the components of the Toyota Production System is the “House of TPS.” Although there are different versions of the house, many share a common theme: the use of different techniques to support an integrated production system. This is exemplified below:
Figure 1.1.2 “House” of the Toyota Production System illustrates variety of techniques
The pillars of the house, namely Just-In-Time (JIT) and jidoka, are important but alone cannot provide an integrated view of TPS. They must be supported by heijunka as well as accompanied by the plethora of other techniques.
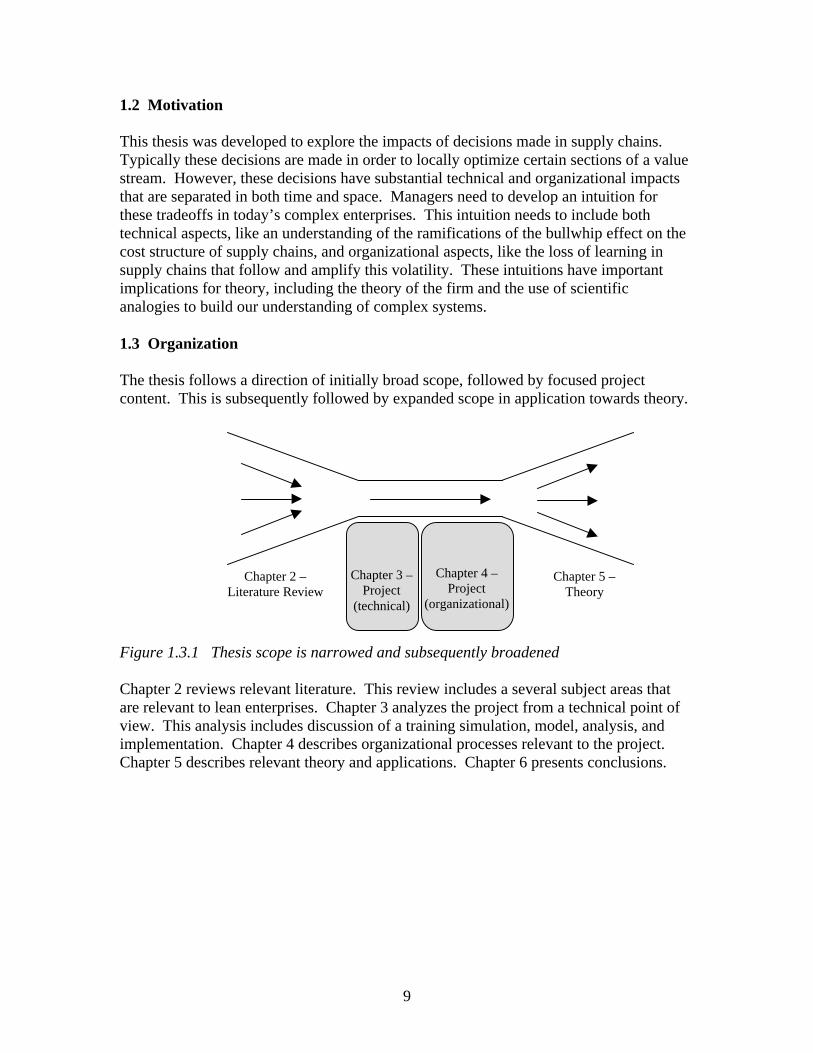
Another insight I found particularly important was the distinction between process kaizen and system kaizen. Kaizen is commonly thought of simply as “continuous improvement.” The KOS office tried to build continuous improvement into the everyday workings of Kodak production. In this way, kaizen was called only when the lowest-level group with responsibility and the most knowledge of the process were having extreme difficulty achieving a breakthrough in normal improvement. In this way, kaizen was used to gather a focused short-term research team to break small roadblocks for improved processes or systems. Both process and system kaizen were important to continuing and gaining benefits from the improvement process. However, process kaizen was generally required before proceeding to system kaizen. Insufficient process capability sometimes constrained system improvements. Therefore, process kaizen must be focused in advance to prepare for system kaizen.
Figure 1.1.3 Kodak Operating System Process/System Kaizen mental model
8
1.2 Motivation
This thesis was developed to explore the impacts of decisions made in supply chains. Typically these decisions are made in order to locally optimize certain sections of a value stream. However, these decisions have substantial technical and organizational impacts that are separated in both time and space. Managers need to develop an intuition for these tradeoffs in today’s complex enterprises. This intuition needs to include both technical aspects, like an understanding of the ramifications of the bullwhip effect on the cost structure of supply chains, and organizational aspects, like the loss of learning in supply chains that follow and amplify this volatility. These intuitions have important implications for theory, including the theory of the firm and the use of scientific analogies to build our understanding of complex systems.
1.3 Organization
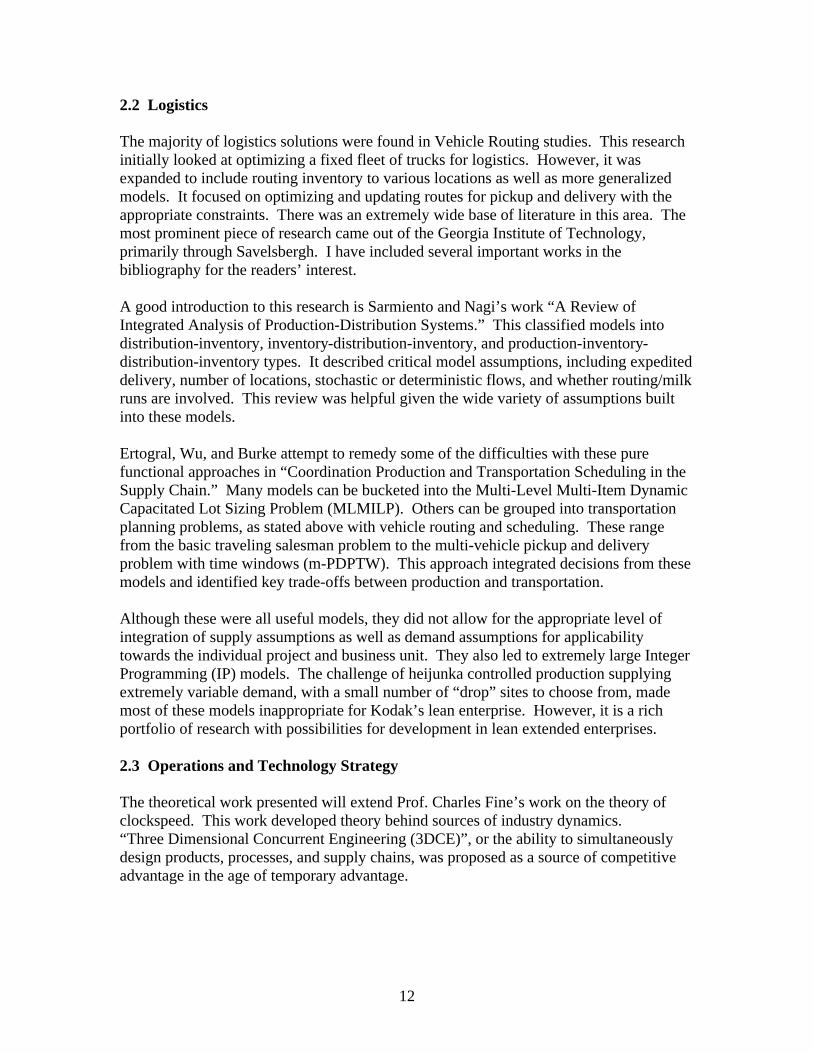
The thesis follows a direction of initially broad scope, followed by focused project content. This is subsequently followed by expanded scope in application towards theory.
Project (technical)
Project (organizational)
Literature Review Theory Chapter 3 – Chapter 4 – Chapter 2 – Chapter 5 –
Figure 1.3.1 Thesis scope is narrowed and subsequently broadened
Chapter 2 reviews relevant literature. This review includes a several subject areas that are relevant to lean enterprises. Chapter 3 analyzes the project from a technical point of view. This analysis includes discussion of a training simulation, model, analysis, and implementation. Chapter 4 describes organizational processes relevant to the project. Chapter 5 describes relevant theory and applications. Chapter 6 presents conclusions.
9

Chapter 2: Literature Review
There is a growing literature on the lean enterprise. This can be classified into several areas: supply chain & operations research, logistics, operations and technology strategy, organizational strategy, historical taxonomies, prescriptive accounts, and MIT resources.
2.1 Supply Chain & Operations Research (OR)
The majority of supply chain and operations research literature focus on operations that optimize information and material flows within an existing transaction-based enterprise. Most of this surrounds a variety of patterns, like the bullwhip effect, and mitigation techniques, like Quick Response (QR), Vendor Managed Inventory (VMI), and Collaborative Planning, Forecasting, and Replenishment (CPFR).
Chen, Zrezner, Ryan, and Simchi-Levi developed a seminal paper on information strategies named “Quantifying the Bullwhip Effect in a Simple Supply Chain: The Impact of Forecasting, Lead Times, and Information.” The paper clarified that the bullwhip effect can be reduced, but not completely eliminated, by centralizing demand information. This was important to consider for this project. Most managers assume that improving information flows will solve the bullwhip. The conclusion supports the use of production leveling in lean extended enterprises to protect the chain and enable systematic reduction in supply chain costs through learning.
Gerard Cachon and Marshall Fisher wrote “Supply Chain Inventory Management and the Value of Shared Information.” Their primary finding was that implementing information technology to accelerate and smooth the physical flow of goods through a supply chain is significantly more valuable than using information technology to expand the flow of information. It assumed one supplier, N identical retailers, and stationary stochastic consumer demand with inventory holding and back-order penalty costs. The conclusion could be subordinated to Chen’s basic finding that improving information flows do not attack the root cause of demand amplification in supply chains.
Stephen Graves wrote a paper titled “A Single-Item Inventory Model for a Non-Stationary Demand Process.” This provided an important conclusion that there is no value to allowing upstream stages to see exogenous downstream demand. It assumed a non-stationary demand process (IMA of order (0,1,1)). It finds that the demand process for the upstream stage is not only non-stationary but also more variable than that for the downstream stage. This finding bolsters Cachon’s conclusion that improving the breadth of information flows is not a high leverage point.
Yossi Aviv wrote two effective papers on collaborative forecasting: “The Effect of Collaborative Forecasting on Supply Chain Performance” and “Gaining Benefits from Joint Forecasting and Replenishment Processes: The Case of Auto-Correlated Demand.” The first article concluded that firms interested in collaborative forecasting need to have unique forecasting capabilities. Aviv also found that the benefits of collaborative forecasting increase when implemented in conjunction with Quick Response programs
10

and advanced demand information. The second article built off Graves’ insights with integration of non-stationary demand into assumptions for information sharing. He found that “in implementation of VMI programs, it is crucial to ascertain that the supplier will be capable of observing and incorporating early demand signals that are at least as informative as those observed by the retailer; otherwise, collaborative forecasting may be necessary, and if not justified, LMI may be the best choice …” (Aviv 71). The concept of unique forecasting capabilities is important for the effectiveness of improving the breadth of information flow. Firms should either utilize fundamentally different sources of information and expand the breadth or use demand leveling to prevent amplification.
Li et al. wrote an intriguing article titled “The Effects of Information Sharing Strategies on Supply Chain Performance.” It found that under situations of high demand variability, a hybrid information sharing strategy is superior to several alternatives, including order information sharing, final consumer demand sharing, inventory information sharing, and shipment information sharing. This hybrid strategy would combine final consumer demand with inventory information sharing to improve the overall performance of the supply chain when variability of demand mix is high. This analysis was applicable since both our total volume demand variability was high combined with extremely high variability in mix. However, demand leveling was not included in the analysis.
Chen wrote a working paper titled “Information Sharing and Supply Chain Coordination.” The base-stock supply chain model was argued to provide a smoother demand process for upstream, yet using reorder points established the lower cost for the extended enterprise. He argued “it is dangerous if we take as our goal the reduction or elimination of the bullwhip effect…the existence of the bullwhip effect is only a characteristic of an operating policy, which reflects the economic forces underlying the supply chain. It is a symptom, not a problem” (Chen 32). Therefore, Chen saw the challenge of the bullwhip effect as a tradeoff of demand variability reduction versus higher system cost. Heijunka processes need to be considered in this juxtaposition, potentially breaking this “tyranny of the or” for the “possibility of the and,” in which a lean extended enterprise can both reduce signal variability and reduce system costs.
A variety of this research also focused on inventory postponement and Strategic Inventory Placement (SIP). After initial attempts to analyze the supply chain with an SIP model, the author discovered implementation difficulties with this approach for Eastman Kodak Co.’s operational strategy. These strategies required increased upstream flexibility from the current state that utilized the stability from the pacemaker process. The KOS office was confident the demand leveling strategy provided the foundation upon which upstream system improvements and system kaizen could reduce upstream inventories and more than offset costs involved with strategically placing inventory downstream.
11
2.2 Logistics
The majority of logistics solutions were found in Vehicle Routing studies. This research initially looked at optimizing a fixed fleet of trucks for logistics. However, it was expanded to include routing inventory to various locations as well as more generalized models. It focused on optimizing and updating routes for pickup and delivery with the appropriate constraints. There was an extremely wide base of literature in this area. The most prominent piece of research came out of the Georgia Institute of Technology, primarily through Savelsbergh. I have included several important works in the bibliography for the readers’ interest.
A good introduction to this research is Sarmiento and Nagi’s work “A Review of Integrated Analysis of Production-Distribution Systems.” This classified models into distribution-inventory, inventory-distribution-inventory, and production-inventory-distribution-inventory types. It described critical model assumptions, including expedited delivery, number of locations, stochastic or deterministic flows, and whether routing/milk runs are involved. This review was helpful given the wide variety of assumptions built into these models.
Ertogral, Wu, and Burke attempt to remedy some of the difficulties with these pure functional approaches in “Coordination Production and Transportation Scheduling in the Supply Chain.” Many models can be bucketed into the Multi-Level Multi-Item Dynamic Capacitated Lot Sizing Problem (MLMILP). Others can be grouped into transportation planning problems, as stated above with vehicle routing and scheduling. These range from the basic traveling salesman problem to the multi-vehicle pickup and delivery problem with time windows (m-PDPTW). This approach integrated decisions from these models and identified key trade-offs between production and transportation.
Although these were all useful models, they did not allow for the appropriate level of integration of supply assumptions as well as demand assumptions for applicability towards the individual project and business unit. They also led to extremely large Integer Programming (IP) models. The challenge of heijunka controlled production supplying extremely variable demand, with a small number of “drop” sites to choose from, made most of these models inappropriate for Kodak’s lean enterprise. However, it is a rich portfolio of research with possibilities for development in lean extended enterprises.
2.3 Operations and Technology Strategy
The theoretical work presented will extend Prof. Charles Fine’s work on the theory of clockspeed. This work developed theory behind sources of industry dynamics. “Three Dimensional Concurrent Engineering (3DCE)”, or the ability to simultaneously design products, processes, and supply chains, was proposed as a source of competitive advantage in the age of temporary advantage.
12

Figure 2.3.1 Double Helix depicting evolution of industry/product structure (Fine, 49).
As the clockspeed ideas around 3DCE developed, Fine developed the challenge of “Technology Roadmapping.” This attempted to create an understanding of the interactions between five key dynamics, or the “Five Cogs.” The “Five Cogs” included dynamics of government and regulation, business cycles, industry structures, corporate strategies, and technologies.
Figure 2.3.2 Five Cogs of Technology Roadmapping (Fine, lecture Spring 2002)
Fine’s notion of clockspeed was complemented by Clayton Christensen’s ideas around disruptive innovation. According to Christensen’s notion of the “Innovator’s Dilemma,” incumbent firms are frequently displaced by newcomers because of rigidities developed from overserving their markets with sustaining business models. Lower performance disruptive business models initially take over lower tiered and lower margin markets, developing their performance to displace incumbent firms.
13
Image removed due to copyright reasons.
Image removed due to copyright reasons.

Figure 2.3.3 The “Innovator’s Dilemma” (Christensen, 17)
Christensen linked this concept with the architecture literature. He argued sustaining business models compete through functionality using an integral architecture, while disruptive business models compete through speed and customization using a modular architecture.
Figure 2.3.4 Sources of Competitive Advantage (Christensen, 147)
The author further argued that many Japanese firms, including lean extended enterprises like Toyota, had disruptive business models that evolved into sustaining business models focusing increasingly on upper tiers of customers.
“Toyota attacked the lowest tiers of the North American automobile market in the 1960s with its Corona model. Over time, this strategy created new growth markets. The cars were so simple and ultimately so reliable that they became second cars in the garages of middle-income Americans. This track worked until Toyota encountered competition in this tier from other Japanese companies such as Datsun (Nissan), Honda, and Mazda. To maintain its profit margins, Toyota then introduced models targeted at more demanding consumers-first the Corolla and the Tercel, then the Camry, the 4Runner, and the Lexus, and finally the Avalon line” (Christensen et al., 86)
14
Image removed due to copyright reasons.
Image removed due to copyright reasons.

Both these approaches assumed there was a correct strategic balance between value creation, delivery, and capture. This was an interesting proposition developed by Henderson and continued in Technology Strategy classes at the MIT Sloan School.
Figure 2.3.5 Balance the three components of value (Nicholas, 4).
Michael Hammer wrote two interesting books on reengineering. His model of the reengineering process was an interesting approach to change management. Reengineering was essentially high level incremental innovation to remove non-value added waste from business processes. In certain ways, it was similar to the Production Preparation Process (3P) at Kodak. Both 3P and reengineering were utilized as novel ways of introducing new products or business processes. In addition to these functions, 3P was utilized for fundamental changes in demand, product design changes, and new plant introductions. Although there are many similarities between reengineering and lean with their focus on reducing non-value added waste, reengineering can be seen as one of many other lean techniques.
Figure 2.3.7 Reengineering Process (Hammer, MIT guest lecture 03/31/2003)
15
Image removed due to copyright reasons.
Image removed due to copyright reasons.

2.4 Alliances
The majority of strategic alliance literature defined strategic alliances and described the processes of their strategy, formation, and maintenance. Alliances can be segmented between the level of commitment: transactional, strategic, and permanent alliances. They can also be differentiated by the level of control.
Figure 2.4.1 Strategic alliances enhance commitment and have hybrid governance (Harbison & Pekar, 4)
The majority of lean extended enterprise alliances fall into the strategic alliance segment. Gulati, Ring, and Gomes-Casseres are other authors cover basic strategic alliances.
Dyer distilled alliance tasks into an alliance life cycle with specific processes.
Figure 2.4.2 Alliances have predictable life cycle stages and processes (Dyer et al., 40)
The best literature I found on strategic alliances came from Doz and Hamel’s Alliance Advantage. The powerful message emanating from the book was the partitioning of alliance logic between co-option, cospecialization, and competence learning.
16
Image removed due to copyright reasons.
Image removed due to copyright reasons.

Figure 2.4.3 Logic of alliance value creation, delivery, and capture (Doz & Hamel, 36)
In addition to life cycle processes, Doz and Hamel analyzed effective alliance logic combinations.
Figure 2.4.4 Lean extended enterprises use robust alliance patterns (Doz&Hamel, 107)
Lean extended enterprises like Airbus tended to combine all three logics of co-option, cospecialization, and internalization in order to create, deliver, and capture value. Extended enterprises that are less effective tended to ignore strategic, organizational, and cultural compatibility constraints.
17
Image removed due to copyright reasons.
Image removed due to copyright reasons.
2.5 Organizational Strategy
Robert Gibbons developed a series of concepts around relational contracts and the boundary of the firm. He argued a new perspective that the relationship between parties is most important and that the make/buy decision should be subjected to this relationship. There were four main points to his argument:
1. ownership can stop hold-up 2. using formal instruments to stop one hold-up problem typically creates another 3. relational contracts offer important advantages over formal contracts and
ownership structures, but is vulnerable to reneging4. implementing the best feasible relational contract requires optimizing the
boundary of the firm
Gibbons argued that relational contracts are contingent on the environment, not inherently efficient, and path dependent. His research supports the empirical findings that lean extended enterprises leverage effective relational contracts against mass enterprise competition. These enterprises mitigate reneging on relational contracts through a variety of measures, including employee transfers (shukko) and dual primary supplier contracting.
2.6 Prescriptive Accounts
The best introduction to TPS was Monden’s Toyota Production System. It included terrific detail and integration between the logic, methodology, and techniques. The logic between some of the techniques is illustrated below.
Figure 2.6.1 Logic behind Toyota Production System (Monden, 73)
18
Image removed due to copyright reasons.

Jones’ and Womack’s Seeing the Whole: Mapping the Extended Value Stream was an introductory work into methods to explicitly define and quantify the value stream across the extended enterprise. The logic of the approach was well defined:
• Raise consciousness in every firm and function of the enormous waste in the current state
• Raise consciousness in every firm and function of the effect of its actions on every other function and firm touching the value stream
• Learn how a value stream team with representatives from every firm can envision a series of Future States and an Ideal State for their shared value streams
• Learn how the team can progressively implement: o A Future State 1 in which smooth, leveled pull and flow are introduced
within every facility touching the value stream o A Future State 2 in which smooth, leveled pull and frequent replenishment
loops are introduced between every facility touching the value stream (eliminating warehousing and cross-docking in the process)
o An Ideal State by compressing the value stream and introducing right-sized technologies
• Learn how the value stream teams can share costs and gains to create win-win-win outcomes for every value stream participant (Jones 2002).
Following these steps, the KOS office attempted to raise consciousness in executive management of the enormous waste in the current state as well as the effect of actions taken at different stages in the supply chain. Through the model and business case, the project attempted to learn how to achieve a Future State. Additional Future States included techniques like milk runs, effective pacemaker activity, and direct connection into customer processes.
Jeffrey Dyer established a prescriptive account for organizations attempting to develop a lean extended enterprise in Collaborative Advantage. He used empirical evidence from Toyota’s enterprise to extrapolate issues for the creation of a lean extended enterprise. His mental model grew out of the transaction cost viewpoint, in that he identified the three key sources of competitive advantage as dedicated asset investments, knowledge-sharing routines, and interfirm trust.
Figure 2.6.2 Transaction cost sources of advantage for lean enterprises (Dyer, 38)
Dedicated assets were embodied in site specialization, physical asset specialization, and human specialization. Toyota used a variety of techniques to facilitate knowledge
19
Image removed due to copyright reasons.

sharing of both tacit and explicit knowledge, including supplier associations, on-site consulting, supplier learning teams (jishuken/PDA groups), problem-solving teams, employee transfers (shukko), and performance feedback with process monitoring.
Figure 2.6.3 Organizational learning mechanisms at Toyota (Dyer, 64)
Learning developed through a multitude of methods at Toyota. For the extended enterprise, these were primarily driven by the supplier association, consulting divisions, and supplier learning teams (jishuken).
Figure 2.6.4 Lean extended enterprise learning organizations at Toyota (Dyer, 32)
Dyer argued that trust reduced transactions costs, lead to superior knowledge sharing, and facilitated investments in dedicated assets. Finally, Dyer described lessons for implementation of lean enterprises, including developing subnetworks, multilateral relationships, and reciprocity by the lead firm.
Sako developed an interesting extension of Dyer’s work on learning mechanisms in lean extended enterprises. He compared and contrasted these learning mechanisms across three extended enterprises: Toyota, Nissan, and Honda. There were important similarities and differences between approaches that determined the extent of “lean” in extended enterprises. Three interesting similarities were found:
1. The recipients of supplier development assistance were divided into an inner group, who received tacit hands-on process assistance, and an outer group, who were limited to improvement incentives like long-term agreements
20
Image removed due to copyright reasons.
Image removed due to copyright reasons.

2. Multiple channels of supplier development were offered. This balanced between self/mutual learning amongst suppliers and more heavy-handed assistance for immediate tangible results.
3. The scope of supplier development activity got broader and deeper in practice.
Although there were similarities, Toyota’s extended enterprise was leaner as a result of two primary differences. The resulting differences are also illustrated below.
• Toyota shared actual practices above and beyond representation of routines in contrast to Honda and Nissan.
• Toyota developed enabling practices to support the evolutionary learning process. These include excluding direct rivals from group learning processes and developing a bifurcated structure to support detailed learning from internal factories shielding from commercial negotiations. (Sako, 27-29).
Figure 2.6.5 Lean extended enterprises focus on evolutionary learning (Sako, 40)
Toyota understood the necessity to teach evolutionary capability development throughout the production network. This fundamental realization was crucial to maintaining and furthering their relative competitive advantage throughout the 1980’s and 1990s. As a result, although Jishuken groups for suppliers came about in the 1970s, they were kept “under wraps” from external visitors and firms for almost twenty years.
Although the analysis was limited to a taxonomy and subsequent prescriptive account of extended enterprise learning mechanisms, there was an undercurrent of focus upon evolutionary capability building. Sako demonstrated his understanding of the challenges involved in developing evolutionary capabilities.
Individual assistance is good whenever we are looking for quick results…Jishuken is good for developing and training people, both at the suppliers and at Toyota…It would most certainly be quicker for an expert [in OMCD] to take a lead and provide answers [to a supplier], but this would not result in developing the skills of those who are led. The strength of the Toyota Production System lies in
21
Image removed due to copyright reasons.

creating as many people who can implement and put into practice the TPS on their own as possible. So the most important thing for the survival of TPS is human resource development (Sako, 12).
This account was a vivid metaphor to the need for pursuing multiple capability enhancement, or “taishitsu kyoka” – “the strengthening of one’s constitution” – across multiple levels: individuals, groups, and firms.
Bowen and Spear described Toyota’s learning processes in “DNA of the Toyota Production System.” Spear clarified the explanation of how Toyota embeds learning experiments and evolutionary improvement capability through four rules:
The pathway rule states: Specify who will get what product, service, or information from whom over a simple pathway. Test this refutable hypothesis by asking, ‘Was the actual supplier the expected supplier?’ If the customer’s need was met by an unexpected supplier, then the pathway was under designed; too few resources were committed. Conversely, if an expected supplier was not needed, then too many resources were committed to the pathway.
The connection rule states: Specify how each customer will make ‘unambiguous’ requests that indicate what to deliver, when, and in what volume directly of an immediate supplier, and specify how each supplier will make responses directly to his or her immediate customers. Test this refutable hypothesis by asking, ‘Was the actual response the expected response?’ If the supplier fell behind and orders accumulated, then customer need was underestimated or the supplier capability was overestimated. Conversely, if the supplier produced and delivered ahead of actual customer need, then the customer need was overestimated or the supplier capability was underestimated.
The activity rule states: Specify each activity’s work-element content, sequence, timing, location, and outcome. Test this refutable hypothesis by asking, ‘Was the actual activity performed as designed, generating the expected outcome?’ If the work was not performed as designed, then something about the worker’s preparation caused him or her to fail. If the work was done as designed, but an inadequate outcome resulted, then the design itself was inadequate.
The improvement rule states: Specify that the smallest group affected by a problem (i.e., the activity doer or the connection or pathway users) is responsible for its immediate resolution. Specify a qualified teacher to help in problem solving work. Specify that problems be solved by constructing bona fide, hypothesis testing experiments. Specify that improvement continue in the direction of ideal production and delivery. Test that problems are resolved by the affected individual or group as experiments by asking ‘Are problems being recognized and ‘counter-measured’ when and where they occur by the people affected by the problem?’ If not, then readjust the scope and scale of hierarchical responsibility to match better the actual nature and frequency with which problems are actually occurring. Individuals can be trained and groups can be re-formed based on updated expectations of the nature and frequency of problems. (Spear C, 20-21)
22

The pathway, connection, activity, and improvement rules are ingrained in Toyota’s people and processes. The combination of clear specifications with frequent, self-diagnostic tests creates the organizational space for emergent improvement.
Figure 2.6.7 Rules-in-use for building self-diagnostic, adaptive systems (Spear C,19)
2.7 Historical Taxonomies
The most useful reference in the historical taxonomies category was Takahiro Fujimoto’s Evolution of a Manufacturing System at Toyota. It was a vivid description of both the current state of Toyota’s lean enterprise as well as its evolution since Toyota’s formation.
I found Fujimoto’s definition of the Toyota Production System to be appropriately scoped and specific. The author defined TPS as a “dense, regular, and accurate transmission of value-carrying information between flexible (information-redundant) information assets. The system for higher productivity and shorter throughput time is designed from the information receiver side, while the system for higher conformance quality is designed from the information source side” (Fujimoto, 125).
Similar to Sako’s emphasis, Fujimoto focused on two primary capabilities of TPS: the ability to continuously improve productivity/throughput time and quality. The dense information network that supported TPS capabilities resulted in improved productivity and throughput time. This included a variety of techniques, including JIT, black box parts, andon line stops, multi-skilled workers with flexible task assignments (shojinka), and levelization across production volume and mix (heijunka).
Figure 2.7.1 Dense information transmission improves throughput capability (Fujimoto, 111)
23
Image removed due to copyright reasons.
Image removed due to copyright reasons.

The transmission of accurate information throughout the network supported Toyota’s quality capability. This information system was enhanced by supplier kaizen, maintenance of process information through TPM and standard work, and fast feedback of defect information.
Figure 2.7.2 Accurate information transmission improves quality capability (Fujimoto,113)
The text distinguished between what most western adherents to TPS think the system represents versus the evolution and causal sources of the system. Fujimoto identified several important techniques of TPS and illustrated how they emerged through Toyota’s evolution. The breadth and depth of the analysis is illustrated below.
Table 2.7.3 Evolutionary development paths of TPS subsystems (Fujimoto, 76).
24
Image removed due to copyright reasons.
Image removed due to copyright reasons.

This important distinction, between TPS and a static view of “best practice” is an extremely important fact for every lean practitioner. Although many techniques of lean are applicable to all firms, they must be chosen, initialized, institutionalized, and evolved so that firms can build these into sustainable competitive advantages. The techniques known as TPS by most western observers are already substantially dated. Most firms, both east and west, need to cross an increasingly vast chasm to gain competitive parity with lean enterprises like Toyota.
Although Fujimoto was similar to Sako in holding an evolutionary mental model, he disagreed with Sako on the reliance upon notions of tacit knowledge sharing as a key differentiator of lean extended enterprises.
“the most organic version…is to a large extent standardized, articulated, and functionally transparent…We should not rely entirely on this logic [of tacit knowledge] when analyzing manufacturing routines of a modern mass-production system, be it Toyota’s or Ford’s” (Fujimoto 124).
Nishiguchi’s Strategic Industrial Sourcing provided another superb example of Japanese industrial evolution with particular emphasis on supplier relationships. His insights quickly ended the monolithic cultural assumptions behind Japanese extended enterprise capabilities, as well as the transaction cost views assumptions behind related assets. He relied heavily upon historical and structural constraints to explain industrial development. He also developed the “Aisin Fire” case study to demonstrate the substantial power of Toyota’s lean extended enterprise subnetworks to problem solve and learn.
There is also a rich field of historical taxonomies in the field of Japanese keiretsu. Most of these originated from the late 1980’s through the mid 1990’s. They mostly focused on the basic classification and taxonomy of the Japanese keiretsu. The more insightful accounts distinguish between “horizontal/capital keiretsu” and “vertical/production keiretsu.” The seminal work on the Japanese keiretsu was Michael Gerlach’s Alliance Capitalism: The Social Organization of Japanese Business.
Gerlach’s account of the keiretsu detailed the transformation of pre-World War 2 zaibatsu, or family based conglomerates, into post-World War 2 vertical keiretsu. He identified several horizontal keiretsu techniques, includes cross-shareholding and senior management meetings.
Another sample of the taxonomy of Japanese keiretsu is Miyashita and Russell’s Keiretsu: Inside the Hidden Japanese Conglomerates. This account also made the distinction between horizontal and vertical keiretsu.
Interestingly, the keiretsu taxonomies relied heavily on two primary sources. These were annual reviews by two organizations: Dodwell Marketing Consultants and “kenyo keiretsu”. They primarily tracked inter-company shareholding and senior management meetings as indicators of keiretsu membership. These reports were primarily logistical and did not delve into the significance or evolution of the networks involved.
25

The most dynamic taxonomy of the Japanese keiretsu was Richter’s Strategic Networks: The Art of Japanese Interfirm Cooperation. This account expanded slightly upon these types of business networks, notably between capital keiretsu, production keiretsu, and trans-keiretsu. Primary examples of capital keiretsu were Mitsui, Mitsubishi, Sumitomo, Fuyo, Sanwa, and Dai-ichi Kangyo. Primary examples of production keiretsu were Toyota, Nissan, Mitsubishi Motors, Hitachi, and Fujitsu. Primary examples of trans-keiretsu included R&D consortia or bilateral alliances with western firms. It also discussed knowledge creation, driving forces behind strategic networks and their evolution. Richter argued that Japanese alliances are evolving from semi-closed to permeable networks, as illustrated below.
Figure 2.7.4 Japanese keiretsu are emerging as permeable networks (Richter, 93)
Lincoln and Ahmadjian follow in this taxonomic keiretsu tradition. Similar to Richter’s view of evolving keiretsu relationships, they found Toyota was simultaneously internalizing its relationships with Daihatsu and Hino while moving towards more open networks for standardized parts. Other traditionally openly networked industries like consumer electronics were moving toward permeable and closed networks. As keiretsu relationships move to permeable networks, the strategic advantage for lean extended enterprises like Toyota will be the ability to “effectively restructure its alliances when circumstances warrant” (Ahmadjian & Lincoln, 698)
2.8 Massachusetts Institute of Technology resources
Several Leaders For Manufacturing students in the class of 2003 were instrumental in the co-evolution of thinking on lean enterprises. These included Brian Bowers, Ted Piepenbrock, and Lou Rassey. We were approaching the prospect of extended enterprises from a variety of directions. The intellectual and practical challenges provided by lean extended enterprises are great. Only through meaningful intellectual discussion will we expand our understanding of these complex phenomena.
Ted Piepenbrock and Brian Bowers began looking at Fine’s “Five Cogs” for a Technology Roadmapping class. They developed the “telephone pole” symbol below to represent the cascading relationship of these different dynamics for the aerospace
26
Image removed due to copyright reasons.

27
industry. For instance, regulatory and government policy dynamics shifted from a vertical functional emphasis of “higher, faster, farther” to a horizontal program emphasis on “better, faster, cheaper.” This cascaded down through bullwhip dynamics, disintegration across several value chains, an implied change in corporate strategy towards building enterprise management capabilities, and refocusing attention towards different dimensions of technology dynamics. Figure 2.8.1 “Telephone pole” of roadmapping five dynamics (Piepenbrock/Bowers, 6) The four of us have been building upon this initial analysis to further our understanding of architecting lean enterprises. The conversation around lean enterprises also proceeded in the Lean Aerospace Initiative (LAI) at M.I.T. Debbie Nightingale and Kirk Bozdogan were strong contributors to this process. The LAI consortium started defining the principles and processes of lean enterprises. This process began with the development of the Lean Enterprise Model (LEM) and was followed by the creation of the Lean Enterprise Self Assessment Tool (LESAT) with the Transition-to-Lean (TTL) Roadmap. Figure 2.8.2 Transition-to-Lean (TTL) Roadmap
Deborah Nightingale © 2000 Massachusetts Institute of Technology
Entry/Re - entry Cycle
Focus on the Value Stream
Initial Lean Vision
Short Term Cycle
Create & Refine Transformation Plan
Lean Transformation
Framework
Adopt Lean Paradigm
Enterprise Strategic Planning
Focus on Continuous Improvement
Outcomes on Enterprise
Metrics Implement Lean Initiatives Enterprise
Level Transformation
Plan
Develop Lean Structure & Behavior
Detailed Lean Vision
Environmental Corrective
Action Indicators Detailed
Corrective Action Indicators Decision to
Pursue Enterprise
Transformation
• Build Vision • Convey Urgency • Foster Lean Learning • Make the Commitment • Obtain Senior Mgmt. Buy - in
• Map Value Stream • Internalize Vision • Set Goals & Metrics • Identify & Involve Key Stakeholders
• Organize for Lean Implementation • Identify & Empower Change Agents • Align Incentives • Adapt Structure & Systems
• Identify & Prioritize Activities • Commit Resources • Provide Education & Training
• Monitor Lean Progress • Nurture the Process • Refine the Plan • Capture & Adopt New Knowledge
• Develop Detailed Plans • Implement Lean Activities
Enterprise Level Roadmap
+
+
Long Term Cycle
Deborah Nightingale © 2000 Massachusetts Institute of Technology
Government / Regulatory Policy Dynamics
Business Cycle Dynamics
Industry Structure Dynamics
Technology Dynamics
Corporate Strategy Dynamics
Murman et al. built on LAI’s theoretical base and clarified the tasks involved in three key areas: identifying, proposing, and delivering value to a balanced set of stakeholders for the enterprise. The stakeholder view of the enterprise was a dominant mental model for this set of ideas.
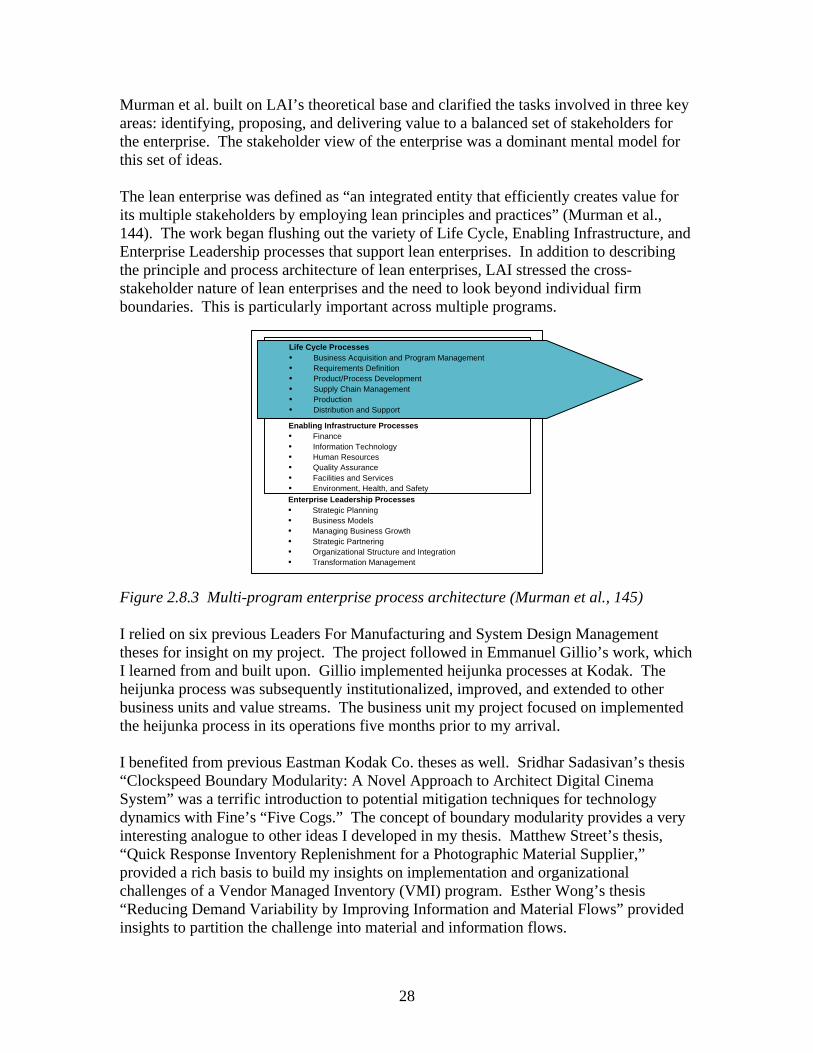
The lean enterprise was defined as “an integrated entity that efficiently creates value for its multiple stakeholders by employing lean principles and practices” (Murman et al., 144). The work began flushing out the variety of Life Cycle, Enabling Infrastructure, and Enterprise Leadership processes that support lean enterprises. In addition to describing the principle and process architecture of lean enterprises, LAI stressed the cross-stakeholder nature of lean enterprises and the need to look beyond individual firm boundaries. This is particularly important across multiple programs.
Life Cycle Processes • Business Acquisition and Program Management • Requirements Definition • Product/Process Development • Supply Chain Management • Production • Distribution and Support
Enabling Infrastructure Processes • Finance • Information Technology • Human Resources • Quality Assurance • Facilities and Services • Environment, Health, and Safety Enterprise Leadership Processes • Strategic Planning • Business Models • Managing Business Growth • Strategic Partnering • Organizational Structure and Integration • Transformation Management
Figure 2.8.3 Multi-program enterprise process architecture (Murman et al., 145)
I relied on six previous Leaders For Manufacturing and System Design Management theses for insight on my project. The project followed in Emmanuel Gillio’s work, which I learned from and built upon. Gillio implemented heijunka processes at Kodak. The heijunka process was subsequently institutionalized, improved, and extended to other business units and value streams. The business unit my project focused on implemented the heijunka process in its operations five months prior to my arrival.
I benefited from previous Eastman Kodak Co. theses as well. Sridhar Sadasivan’s thesis “Clockspeed Boundary Modularity: A Novel Approach to Architect Digital Cinema System” was a terrific introduction to potential mitigation techniques for technology dynamics with Fine’s “Five Cogs.” The concept of boundary modularity provides a very interesting analogue to other ideas I developed in my thesis. Matthew Street’s thesis, “Quick Response Inventory Replenishment for a Photographic Material Supplier,” provided a rich basis to build my insights on implementation and organizational challenges of a Vendor Managed Inventory (VMI) program. Esther Wong’s thesis “Reducing Demand Variability by Improving Information and Material Flows” provided insights to partition the challenge into material and information flows.
28

Chapter 3: Project Analysis
3.1 Problem Statement
The current economic and market changes facing Eastman Kodak Co. are increasingly important to understand operational and strategic priorities. The goal of the internship was to assist extension of lean efforts from the manufacturing function at Eastman Kodak Co. vertically to other functions within the company as well as horizontally across firms. The task involved maintaining Kodak’s lean manufacturing systems and deepening our understanding of the lean enterprise in order to extend its scope. As a result, the business unit would improve its profitability and the Kodak Operating System office would be in an improved position to deepen efforts at extending the lean enterprise into other areas.
3.2 Situation/Background
Globalization and technological change are forcing firms in virtually every industry to radically change the way they do business. Eastman Kodak Co. is a world class company that is finding the need to manage its businesses differently overall – to develop a lean enterprise. The silos of different functional groups – manufacturing, supply chain, sales, and distribution – within many firms are fairly deep. However, functional segregation also occurs across organizations. The result of both horizontal and vertical silos result in significantly higher costs to maintain service levels.
There are a variety of mitigation techniques to introduce in order to combat silos throughout the enterprise. These include a wide variety of supply chain techniques, like Efficient Consumer Response (ECR), Vendor Managed Inventory (VMI), Collaborative Planning, Forecasting, and Replenishment (CPFR). These techniques improve material and information flows, thus reducing cycle times and allowing for inventory reductions.
However, a fundamental component of lean enterprises neglected by these techniques is the relationship between firms themselves. Many firms believe competition only acts at the level of the individual firm. However, in business, as in nature, evolutionary processes act at multiple levels of the evolutionary hierarchy. Routines, functions, firms, individual alliances, and production networks are all evolutionary “individuals.”
3.2.1 Approach
The work performed during the project is described by the following: 1. Operational evaluation of alternative distribution scenarios 2. Financial analyses of scenarios 3. Vendor Managed Inventory 4. Collaborative Planning, Forecasting, and Replenishment with customers 5. Preparation of low volume/high mix production control system 6. Engineering and production layouts for new material flows 7. Thorough literature review on theory behind value creation/delivery/capture of
organizational alliances and evolution
29

3.2.2 Summary of Findings
The results from the project that benefited Eastman Kodak Co. were: • Identified business case for greater than $2 million Net Present Value project • Helped train executive management in lean enterprise techniques • Improved vertical functional communication • Initiated and maintained horizontal functional communication • Trained implementation team and prepared key materials
The conclusions and key lessons learned are: • Technical modeling and simulation should be components of an organizational
strategy for implementation. • Strategic alliances, and particularly strategic production networks, can be a
primary powerful source of competitive advantage, or “collaborative advantage.” • Managers need to understand the evolution of the firm, and importantly the lean
enterprise, in order to focus their efforts.
3.3 Current value stream map
The interesting aspect of Eastman Kodak Co.’s value stream is its length. It is difficult for individuals to gain a comprehensive view of the value stream due to limitations of experience. This was a particularly important constraint for the author as a newcomer to the organization. In this respect, the aid of the Kodak Operating System office and the business unit’s Supply Chain group was particularly important.
One of the first tasks in attacking waste in the enterprise was mapping the value stream. This task included two aspects: establishing a basic understanding of the supply chain for the entire business unit, and then choosing a value stream to focus on.
In order to get a comprehensive understanding of the supply chain, the author created a “Worldwide KOS Supply Chain Map” for the business unit in question. This map worked across value streams and locations to provide a basic understanding of material flows across the enterprise. For confidentiality reasons, this map is not included.
After understanding the basic material flows across value streams, the author was in a better position to choose a high leverage value stream for analysis and action. Although the author cannot disclose the specific business unit or product lines the value stream covered, a simplified view of the value stream process is illustrated.
To understand the supply chain, some basic concepts in film manufacturing need to be understood. The following few definitions will be useful:
Support: the tangible, thickest portion of the film upon which all other layers are placed; also called base. Two types of support are used: cellulose acetate and ESTAR.Cellulose acetate: support material made from wood fibers.ESTAR: support material made from petroleum.
30

Emulsion: A photosensitive evenly distributed mixture of gelatin and salts that form the imaging layers on support.
The customers of the supply chain were fulfilled through a daily phone process. This phone call initiated a distribution fulfillment operation through paper forms and the Qwik logistics system. This created the daily ship schedule that was fulfilled out of Kodak RDCs to their appropriate customers. The resulting pipeline inventory positions were used from DSM and SAP to create a daily heijunka pull signal from the supermarket at the end of the finishing process. The use of heijunka at this stage in the value stream is very different from traditional use of inventory and production in supply chains. Traditionally, production and the supply chain is made flexible to ensure guaranteed levels of service against variable demand.
Figure 3.3.1 Traditional view of inventory to stabilize downstream service (Chapman 24)
However, the heijunka process attempts to level this demand variability and push the variability into inventory. This process uses inventory to promote stability for all stages in the supply chain upstream of the pacemaker process that utilizes heijunka. This insensitivity to the demand signal provides significant advantages, particularly for long supply chains, to learn, improve operations and reduce their underlying cost structure.
Figure 3.3.2 Lean view of inventory to stabilize upstream supply chain (Chapman 28) These level volume and mix pulls generated production kanban requests. Production kanban accumulated to compensate for the lot size difference between two FIFO
31
Image removed due to copyright reasons.
Image removed due to copyright reasons.

connected operations. Signal kanban created pulls of “wide rolls,” which are 6,000’ to 12,000’ long and 54” wide rolls of coated sensitized film. This film was subsequently slit from 54” wide into the appropriate width for multiple slits, frequently 35mm wide. The slit rolls were then perforated and packaged appropriately for distribution. After the “wide rolls” have been pulled, replenishments were pulled from the “wide roll” supermarket. This process combined with other value streams at the push-pull boundary to generate demand for the upstream processes. Coating was Kodak’s primary monument, requiring production planning, capacity planning, and production control to issue schedules to all upstream operations. These schedules changed daily yet allowed for certain levels of coverage to cover cycle time and lead time differences. The coating process was initiating a level volume and mix schedule for the first time. This was a very difficult process to undergo given the supply uncertainties involved upstream. The solution, emulsion, dispersion, and gel operations all utilized push operations to supply melting. Both acetate and ESTAR support operations still used push mechanisms to supply coating.
DistributionSupport
Solution Mfg/Test
Emulsion Mfg/Test
Dispersion Mfg/Test
Synthetic Chemicals Finishing Regional
Distribution Center
Pull regionPush region
Customer A
Customer B
Customer C
Supply Chain Item Planning
Heijunka, DSM, SAP
Kodak Business Unit Regional Sales
DSM, SAP
Daily Daily with coverage
Production planning Capacity planning Production Control
SAP, OPAL, AMAPS
Daily
Daily Distribution Fulfillment
Qwik & paper
Daily Ship Schedule
Daily phone & paper
Slit Perf/ Pack
Daily
Daily
DailyMetals
Packaging VendorsGel
Melt / Test
FIFO Coat
FIFO
1 1
1
FIFO
FIFO
FIFO
Pattern Sequence
Manufacturing
Figure 3.3.3 Current value stream
32

33
3.4 Training simulation of current and future value streams After understanding the overall business unit material flows and selecting a value stream for analysis, the author needed to help team members in the Kodak Operating System office garner support to extend lean across Kodak’s enterprise. Many corporations believe they have made the transition to lean simply by introducing pull processes. Unfortunately, without other TPS techniques like leveling demand and lean enterprise distribution, the supply chain develops significant waste and is ultimately not sustainable. The purpose of the simulation was to create a vivid portrayal of this enterprise instability that is inherent in lean systems that lack the necessary downstream scope and stability. The writer helped Earl Chapman develop and execute the simulation for Kodak senior management. The audience included CEO Daniel Carp as well as the management of the business unit that my analysis and future implementation would impact. The simulation demonstrated Kodak’s current state of the pull region of the supply chain. Therefore, the simulation represented all the processes at the push-pull boundary and downstream. These processes included coating, finishing, central warehousing, regional warehousing, and logistics links. It was generalized across business units so that each could see the fundamental processes of the current state that affected their operations. The simulation layout is illustrated below: Figure 3.4.1 Pull processes alone do not make a supply chain lean (Chapman 21) The simulation was designed to mimic Kodak’s actual processes. In order to maintain the correct sequence of events, we broke the simulation into rounds. Each round consisted of several steps: 1 Demand generation 2 Demand fulfillment from regional warehouses 3 Transportation of material/information from central to regional warehouses 4 Truck planning 5 Central warehousing 6 Internal trucking between finishing and central warehouse 7 Finishing 8 Internal trucking from sensitizing to finishing 9 Sensitizing
REGION 1 WAREHOUS Customers
REGION 2 WAREHOUS Customers
CENTRAL WAREHOUSE
Black/Grey Finishing
White/Blue Finishing
Red/Tan Finishing
Sensitizing
Region 1 Truck Planning
Region 2 Truck Planning
Material flow
Information flow

34
I will describe each of these steps to demonstrate how a current state in a “lean production” company can, in reality, be anything but “lean.” Step 1: Demand generation The first step was demand generation. We created a product portfolio of six fictional products by color: gray, black, white, blue, red, and brown. The products were represented by Legosª in order to represent portions of larger upstream lot sizes, notably “wide rolls” in manufacturing and full trucks in logistics. Each regional distribution center was based on a real Kodak RDC. Simulated product demand was scaled down from real individual products at those real RDCs. The regions had unique portfolio patterns and demand biases. The Demand for Region 1 is illustrated below: Figure 3.4.2 Region 1 demand (Chapman and White, 14) The Demand for Region 2 is illustrated below: Figure 3.4.3 Region 2 demand (Chapman and White, 15)
0
1
2
3
4
5
6
7
8
9
10
1 2 3 4 5 6 7 8 9 10 11 12 13 14 15
Day
Dem
and
Gray 16
Black 8
White 16
Blue 8
Red 16
Tan 8
0
1
2
3
4
5
6
7
8
9
10
1 2 3 4 5 6 7 8 9 10 11 12 13 14 15
Day
Dem
and
Gray 16
Black 8
White 16
Blue 8
Red 16
Tan 8

Step 2: Demand Fulfillment
At the RDCs, each individual product was attached to a kanban denoting its region and product type. After reviewing the round’s new demand, the regional warehouse manager was responsible to fulfill the demand. They did this by removing product of each type from their inventory and placing it in the appropriate fulfillment bucket. This action “freed up” kanbans for upstream replenishment. After placing these kanban in “trucks” for return to the regional trucking planners, the regional warehouse managers replenished their inventories with the inventory waiting in trucks delivered the previous round. The receiving capacity of the regional warehouses was finite due to labor and physical constraints. This sometimes prevented receipt of the previous round’s shipment.
Under the current state, regional warehouses frequently had “lots of inventory, but none of the right product.” This arose primarily from local optimization and supply delays of product mix upstream. When a stockout occurred, this represented lost revenues in a saturated market and potentially lost points of market share. Therefore, the regional warehouse managers were given noisemakers to alert other members of the supply chain when they had difficulty filling demand.
The pictures of both regional warehouses are below.
Figure 3.4.4 Region 1 Warehouse
Figure 3.4.5 Region 2 Warehouse
35

Step 3: Transportation of material/information from central to each regional warehouses
The central warehouse allocated replenishment inventory for each regional warehouse the round before. In the previous step, each regional manager “freed up” replenishment request kanban when filling demand. At this round, transportation occurs in which planned and released material flows downstream from the central warehouse to each region and replenishment kanban information flows upstream from the regional warehouses to trucking planners.
Step 4: Truck planning
After information for downstream inventory replenishment arrives from the regional warehouses, this becomes information the trucking planners can use in this step. The trucking planners have to manage one of the constraints fundamental to logistics as well as warehouse management: pursuing full truck utilization and reducing the number of “picks” in the warehouse. In order to gain decent utilization, truck planners would like to “cube out” their trucks. Similar to traditional manufacturing, these planners would like to amortize their fixed “setup costs” for trucking across as much material as possible. This is analogous to maximizing the length of a production run for a particular machine setup. Likewise, managers in the central warehouse (or Central Distribution Center, CDC) would like to maximize the number of “picks” in a particular location of the warehouse in order to improve worker productivity. This results in the planners promoting two crucial elements: extreme truck configurations (full or empty) with low relative productive mix (maximizing the amount of one product type). As a result, the regional warehouses are frequently either overwhelmed or starved of replenishments, while the product mix comes in “slugs” regardless of what is needed.
The truck planners were given an arrayed space to lay out their deck of replenishment kanban. Using these new kanban and any remaining from previous rounds, the truck planner attempted to balance effective replenishments with functional pressures of pick minimization and full truck maximization.
Figure 3.4.6 Truck planners were pressured to run “full trucks” (Chapman and White, 8)
36
Image removed due to copyright reasons.

If planners were unable to “cube out” a “full truck,” they would hold the cards for the next round. This occurred frequently because the demand pattern did not provide enough constant demand of individual items or sizes of items. Truck planners were sometimes prevented from sending trucks because of individual item shortages at the CDC.
After the truck planners finished “cubing out” their trucks, they made picks from the warehouse in preparation for the next round. The planners placed the products and their planned kanban into trucks awaiting departure in the following round.
In order to bring visibility to the problems truck planners run into, they were given different noisemakers to bring attention when they did not have enough material to fill a truck for shipment or when they ran out of a particular product for replenishment.
The truck planning for each region is pictured below.
Figure 3.4.7 Truck planning for each region
Step 5: Central Warehousing
First, the central warehouse manager collected the “freed up” kanban for finishing and placed them in trucks. Second, the manager received inbound product and kanban from her receiving docks and placed them into storage.
Figure 3.4.8 Central Warehouse
37

Step 6: Internal trucking between finishing and the central warehouse
The internal trucking manager went on a milkrun using the “freed up” kanban from the central warehouse to pick up the appropriate material for the CDC. This material was subsequently deposited at the central warehouse receiving dock.
Step 7: Finishing
Finishing managers accumulated the kanban “freed up” by the internal trucking manager to generate signaled pulls from upstream. Finishing was fundamentally a disassembly process, in which “wide rolls” or “Master Rolls” from coating were slit, perforated, and packaged. These three sub-operations were condensed in the simulation to one process for simplicity since the processes were typically tightly connected with FIFO lanes. Due to lot size differences, finishing managers generally waited to slit a wide roll until there was enough final demand to consume it. Therefore, the kanban from the central warehouse needed to meet the appropriate number and mix for that particular product to generate a signal kanban instruction to pull a “wide roll” from inventory.
After the signal kanban permitted a wide roll withdrawal, the wide roll was slit (disassembled) and prepared for shipment in the next round. This lot sizing problem frequently left some demand from downstream unmet. In addition, finishing had capacity controls due to machine and labor constraints. Whenever a finishing line needed to use overtime to fulfill demand or ran out of wide roll supply, they used their noisemaker.
The finishing operation is depicted below.
Figure 3.4.9 Finishing
Step 8: Internal trucking from sensitizing to finishing
After finishing made their “wide roll” pulls from their supermarket, internal trucking replenished finishing’s inventories from the sensitizing inventory.
38
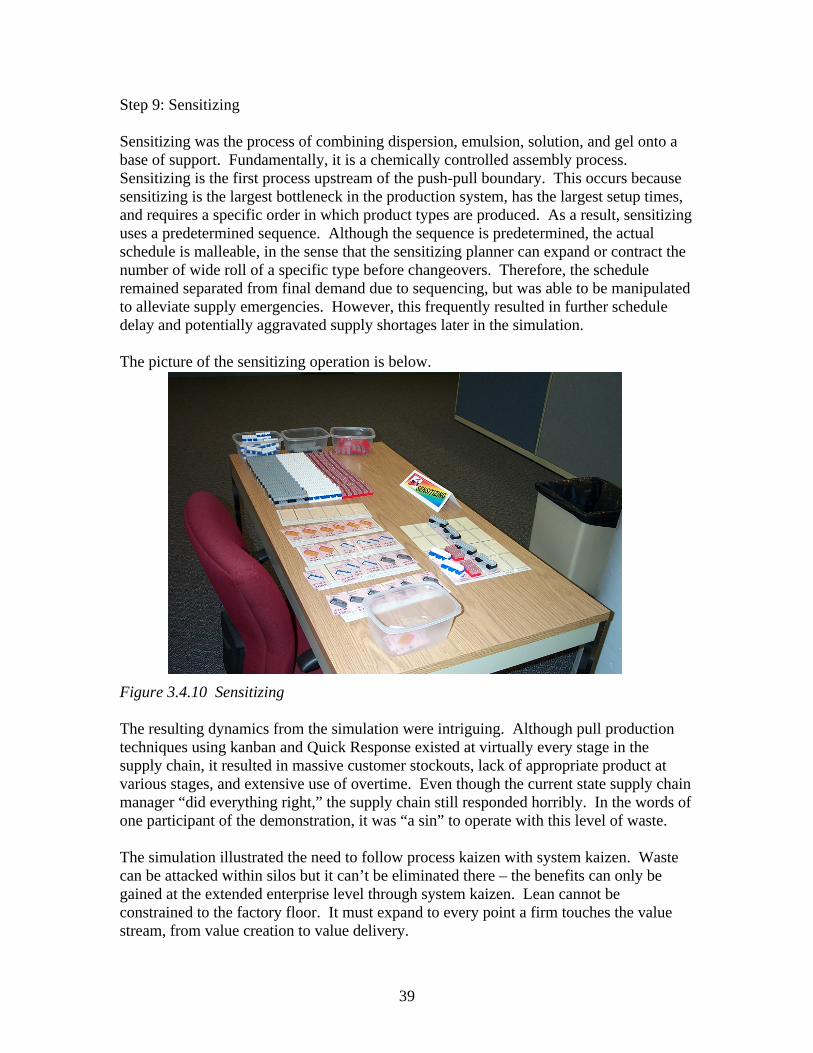
Step 9: Sensitizing
Sensitizing was the process of combining dispersion, emulsion, solution, and gel onto a base of support. Fundamentally, it is a chemically controlled assembly process. Sensitizing is the first process upstream of the push-pull boundary. This occurs because sensitizing is the largest bottleneck in the production system, has the largest setup times, and requires a specific order in which product types are produced. As a result, sensitizing uses a predetermined sequence. Although the sequence is predetermined, the actual schedule is malleable, in the sense that the sensitizing planner can expand or contract the number of wide roll of a specific type before changeovers. Therefore, the schedule remained separated from final demand due to sequencing, but was able to be manipulated to alleviate supply emergencies. However, this frequently resulted in further schedule delay and potentially aggravated supply shortages later in the simulation.
The picture of the sensitizing operation is below.
Figure 3.4.10 Sensitizing
The resulting dynamics from the simulation were intriguing. Although pull production techniques using kanban and Quick Response existed at virtually every stage in the supply chain, it resulted in massive customer stockouts, lack of appropriate product at various stages, and extensive use of overtime. Even though the current state supply chain manager “did everything right,” the supply chain still responded horribly. In the words of one participant of the demonstration, it was “a sin” to operate with this level of waste.
The simulation illustrated the need to follow process kaizen with system kaizen. Waste can be attacked within silos but it can’t be eliminated there – the benefits can only be gained at the extended enterprise level through system kaizen. Lean cannot be constrained to the factory floor. It must expand to every point a firm touches the value stream, from value creation to value delivery.
39

40
The root of the problems in the current state arose from local optimization at various stages in the supply chain. Individual functions maximized behavior favored by incentives, continued mental models of demand and supply patterns, and sometimes attempted to game the supply chain. For instance, trucking planners had localized incentives to only send “full trucks” of minimal product mix to the regional distribution centers. This resulted in batching and amplification of the replenishment signal. As a result, finishing and sensitizing had more difficulty matching large changes in demand. This impacted the supply chain with delays, overtime, inventory, and missed shipments. To compensate for these challenges, the future state was improved in two primary ways. First, a leveled signal was sent throughout the supply chain. Truck planning was replaced with heijunka control dedicated to each regional warehouse. This allowed the central warehouse to supply replenishments to the regional warehouses with level volume and mix. The heijunka process maintained truck utilization (“full trucks”), improved the predictability of logistics (e.g. four trucks per day), and reduced replenishment variability in volume and mix. Second, upstream operations leveraged this stability to globally optimize their activities, connections, and pathways. Each stage in the chain created level replenishment plans for their customer, clear ahead/behind visual controls, and standard work to leverage the increased confidence in the signal. Upstream inventories and supermarkets were drastically reduced due to improved synchronization across the supply chain. As a result, the central warehouse functioned as a cross dock in which planned materials came in simply as a collection point for leveled distribution. Similarly, finishing and sensitizing supermarkets were right sized for their supply lot size and leveled demand requirements. Sensitizing schedules were leveraged to produce “every part every day” given the improved predictability and reduced demand variability amplification. Note that the same demand patterns were used for both current and future states. The change in the nature of RDC inventories to be the primary buffers, heijunka leveling at truck planning, and upstream globally optimizations are illustrated below. Figure 3.4.11 Heijunka and standard work enabled global supply chain optimization
REGION 1 WAREHOUS Customers
REGION 2 WAREHOUS Customers
CENTRAL WAREHOUSE
Black/Grey Finishing
White/Blue Finishing
Red/Tan Finishing
Sensitizing
Region 1 Truck Planning
Region 2 Truck Planning
Material flow
Information flow

Overall, four simple tools were implemented throughout the supply chain: • Level volume • Standard Mix (i.e. Level both by item and total) • Ahead/Behind visual controls • Standardized Work (i.e. visual guides)
As a result, the simulation drastically improved supply chain dynamics on key metrics including customer service, inventory, fleet size, and required manufacturing capacity. The results are depicted below.
Metric Unleveled Leveled Change
Customer Some No backorders -100% Service backorders
Average RDC Inventory
90 Units 76 Units -15%
Average CDC Inventory
47 Units 16 Units -65%
Fleet size Approx 31 trucks
28 trucks -10%
Mfg Capacity 46 Units/Day @ 32 Units/Day -30% Max Max
Table 3.4.1 Simulation results
This set of solutions works because it attacks one of the four types of complexity in axiomatic design of complex systems: periodic time-dependent complexity. Since production systems contain hierarchical flow, this time-dependent complexity drives both real and imaginary complexity into upstream operations. Lee argued that periodicity should be introduced to prevent these systems from developing chaotic behavior. In a similar manner, heijunka leveling of volume and mix establishes a form of periodicity to leverage reduction of real and imaginary complexity throughout the supply chain.
Does uncertainty change with time?
complexity complexity
Real complexity
Imaginary complexity
Combinatorial complexity
Periodic complexity
from upstream standard work Source of supply chain complexity
Complexity
Time-independent Time-dependent
Source of benefits
Measure of uncertainty in achieving FR
Figure 3.4.12 Heijunka eliminates periodic complexity and liberates value from real and imaginary complexity (adapted from Lee, 3).
41

3.5 Heijunka process description and challenges
The simulation provided insight into the difficulties of using selective TPS techniques like pull within the supply chain without leveling and application to distribution. However, for the business unit I worked for, leveling was a fairly new phenomenon. It had been applied to a relatively small portion of the product portfolio. Although this portion was originally selected to include the majority of volume for the business unit, there were still many problems to be solved in the process. There were two basic information processes in heijunka: withdrawal and production.
3.5.1 Withdrawal card process
The withdrawal process began with daily shipments from RDC finished goods inventory to customers. These shipments were aggregated electronically through DSM and SAP and triggered the addition of withdrawal cards to “Box 1.” This box was the leveling box where withdrawal cards authorized the replacement of finished goods inventory at specified item and system takts. Items were divided into “A” items and “B” items, with the highest volume “A” items at the top of the box. “A” items were high volume items that were Made-To-Stock (MTS) at a specified daily takt. This takt was changed monthly to accommodate expected macro changes in demand and seasonal pre-builds. They were controlled with their “ahead-behind limits.” The ahead limit specified the maximum inventory needed to absorb demand variation. If the ahead limit was reached, finishing was getting ahead of demand and needed to obtain information to determine whether the item takt should be reduced. The behind limit represented the minimum inventory needed to cover supply leadtime. If the behind limit was reached, finishing was getting behind demand and needed to obtain information to determine whether the item takt should be increased. “B” items were low-to-mid volume items that were Made-To-Order (MTO). All “B” items were run together at a specified daily takt.
Every morning, there was a “morning huddle” consisting of the supply chain finished item planner, manufacturing management, manufacturing representatives, maintenance, quality, and KOS representatives on the plant floor. This group determined the ahead/behind health of items in Box 1. The group also analyzed previous daily production rates with expected system takts to identify macro issues. Maintenance, quality, and workforce issues were also discussed to understand impacts on the process.
“Box 2” was the loading box representing leveled volume and mix of customer demand. This box had a time schedule at which cards from all items were pulled. Box 2 was designed explicitly to represent customer demand – not production’s capability to fulfill demand. A separate production control mechanism, the “Escalation Box,” was used to identify and trigger diagnosis of production problems. As problems arose, withdrawal cards were placed in the column representing the source of difficulty. This became a visual Pareto chart of components and suppliers that hindered production and required self-correction.
42

After cards were pulled from the finishing supermarket at the specified time, the pallets were shipped to finished goods inventory at the appropriate RDC or CDC.
Figure 3.5.1 Heijunka withdrawal card sequence (Mooney, 9)
3.5.2 Production card process
The production card process flowed out of the withdrawal card process. As cards were shipped from the finishing supermarket to finished goods inventory at the appropriate RDC or CDC, production cards were freed. These freed cards were removed from the pallet and placed into “Box 3,” or the Lot Box. The Lot Box was required between operations when the upstream manufacturing unit was greater than the downstream shipment unit. Production cards were placed in the Lot Box until there was enough for a production lot. When the lot size was reached for an item, the signal kanban was placed in “Box 4,” or the Production Sequence Box. These boxes structured the sequence of work at the machine as well as provided ahead/behind controls. In finishing, Box 4 used a vacuum tube with colored golf balls as signal kanban. This allowed the slitting operators to see the next type of “wide roll” that needed to be pulled from the upstream supermarket. This “wide roll” was subsequently split, perforated, packaged, and combined with a production card on each pallet. These pallets closed the production card loop in the finishing supermarket, awaiting pulls for distribution.
The production card process is illustrated below.
43
Image removed due to copyright reasons.

2000000
4000000
6000000
8000000
10000000
12000000
14000000
16000000
18000000
20000000
22000000
Mea
n of
Tot
al d
eman
d
Month
Note: Sigma used for limits based on standard deviation.
XBar of Total demand
Figure 3.5.2 Heijunka production card sequence (Mooney, 9)
3.5.3 Heijunka challenges
The demand process for the product portfolio was extremely erratic. The value stream contained high demand variability: both total daily volume and individual product daily volume had coefficients of variance (C.O.V.) greater than 1.5.
Monthly system takts were based on average demand for all items in the value stream. However, the demand process was not in control. Variation of daily system volume in each month was extremely high. As a result, significant finished goods were needed to buffer demand variability. The variation in volume for all items, including seasonal months, is illustrated below.
0
Avg=4536208.64
LCL
UCL
All Items, Daily Volume
Seasonal
01 02 03 04 05 06 07 08 09 10 11 12 13 14 15
Month
Figure 3.5.3 All items daily volume was out of control for calculating system takt
Worse patterns of demand variability were prevalent at the individual item level.
44
Image removed due to copyright reasons.

Mea
n of
199
3534
'
Month
Note: Sigma used for limits based on standard deviation.
XBar of 1993534'
-2000000
-1000000
0
1000000
2000000
3000000
4000000
5000000
6000000
7000000
8000000
9000000
10000000
11000000
12000000
13000000
14000000
15000000
01 02 03 04 05 06 07 08 09 10 11 12 13 14 15
Avg=2263898.97
LCL
UCLIndividual Item, Daily Volume
Seasonal
Month
Figure 3.5.4 Individual item daily volume was out of control
As a result, it was very difficult to maintain the heijunka process for leveling both volume and mix. Leveling the total volume across items was moderately successful. The heavy line represents the heijunka planned system daily takt. The area chart represents the actual production volume. There were a variety of instances in which supply variability was particularly strong over the eleven months of data, including international and domestic plant loading, personnel, and quality issues.
All Items, Daily Volume
Day
Figure 3.5.5 System-level production scheduling was fairly close to system takt
The difficulty in heijunka is rooted at leveling the mix. This became evident at the product family level. As there are large demands for particular classes of items, local optimization for distribution, sales, and downstream operations placed extreme pressures on finishing and sensitizing to be flexible. As a result, “B” items that went unchallenged in breaking the B items cumulative takt effectively disrupted leveling the “A” items. The resulting amplification upstream and chaos in supply supermarkets was difficult to plan and create contingency plans for. “Wide roll” supermarkets were under pressure to stay large and respond quickly for uncertain future demand in order to buffer these breaks in the heijunka system. The resulting demand spikes from certain families of products are illustrated below.
45

Figure 3.5.6
Families of items, Daily Volume
Day
Family-level production scheduling became interrupted
At the individual item level, it was even more difficult to manage these demand spikes that were forced through the heijunka process. The result was spiraling variability in the loading process. As some items were allowed to break out of their takt, this effectively denied production of another item’s takt given technical and personnel capacity constraints. Therefore, as time progressed, these production gaps needed to be filled with larger batches and longer spans of time devoted to individual items. The resulting item-level difficulty is illustrated below.
Individual Items, Daily Volume
Day
Figure 3.5.7 Item-level production scheduling became erratic
In order to search for root causes, the author analyzed demand volume across the entire product portfolio. A pareto analysis of the contribution of individual items to the system’s cumulative takt illustrated that approximately 60% of the volume was included in the “A” item process. The combination of five high volume “B” items together broke the ability to control “B” item takt when strong demands coincided. Therefore, these items were converted from Make-To-Order “B” items into Make-To-Stock “A” items. This shift subsequently reduced demand amplification approximately 25% for the total daily volume in this business unit’s value stream.
46

Figure 3.5.8 Pareto of item volumes highlighted items to include in leveling process
Takt (volume/day)
After negotiation with operations, supply chain, and distribution, the suggested items were included in the daily heijunka process for leveling. The resulting leveling by mix improved quickly. However, due to the extreme demand variability in the nature of the business unit and manufacturing flexibility constraints, it was difficult to maintain certain heijunka requirements strictly. The application of heijunka creates vibrant debates within and between functions in order to determine the appropriate balance between inventory availability, flexibility in finishing, and upstream variability amplification. However, without using heijunka as a tool to uncover upstream opportunities, the assumption of local optimization would have continued unabated.
47

3.6 Supply chain model
A model was created to build an understanding of the potential benefits, tradeoffs, and costs in expanding lean techniques from manufacturing into distribution. The fulfillment process was broken up between the sales, distribution, supply chain, and manufacturing organizations. This resulted in a poorly designed fulfillment process in which each organization tended to optimize the portion of the chain under their control. Sales attempted to maximize the inventory coverage of both finished goods at the regional distribution centers and “wide roll” before finishing in order to guarantee a 100% service level. Distribution only shipped “full trucks” after queuing the appropriate materials for shipment. Supply chain attempted to retain sufficient safety stock within the entire value stream to guarantee sufficient service levels and lead times. Manufacturing desired a level signal and more lead time in order to reduce capacity and inventory requirements. Although each group had operational control over key decisions, the manufacturing organization was responsible for bottom line P&L costs, including inventory.
The executive simulation and heijunka challenges highlighted the need to cross these organizational boundaries in order to design and develop a lean enterprise. The process to develop a comprehensive model to understand the value stream’s real supply chain opportunities lay in gathering information, building the model, and analyzing the results.
3.6.1 Information collection
The process of gathering information was fairly important. The act of getting information required the author to travel internationally, have extended interaction across a variety of functions, and build a network of stakeholders. It meant retrieving information from a variety of sources. For instance, the author worked with the supply chain group to gather lead time information for the product portfolio, distribution to establish logistics lane rates, trucking configurations, and lead times, manufacturing to determine supply capacity, and warehousing to determine labor rates.
3.6.2 Model construction
From the literature review, there were a variety of supply chain and logistics techniques that remained difficult to apply to the project. The model was originally configured as an Integer Program (IP), yet quickly became too large to manage for technical and organizational/political reasons. Therefore, the author developed an Excel model to facilitate inclusion of different stakeholders’ assumptions.
The decisions of the model focused around five areas. First, the design of the supply chain was considered. The current state of the supply chain utilized two echelons of inventory between the finishing operation and the customers’ operations. These two echelons consisted of a regional distribution center and a customer owned and controlled local inventory. The design decision included whether to collapse these two echelons into a single echelon directly at the customer sites.
48

The second element of the model included the locations and rationale for inventory. The current state utilized inventory at two locations for different reasons: the customer site held inventory for consumption and excessive demand variability; the Kodak regional distribution center also held inventory for close, responsive, daily replenishment. In addition to these functions, the heijunka program in finishing used the RDC inventory as the primary buffer between demand variability and supply, requiring a significant inventory. This particular business unit had a large proportion of customer-specific finished goods that consisted of specialized packaging and film requirements. These constraints limited the effectiveness of risk pooling the regional distribution centers. Given these constraints, it was feasible to utilize inventory for several different means. First, finished goods inventory at the regional distribution center could continue to be used for close daily replenishment, minor risk pooling, and upstream heijunka buffering. Finished goods inventory at the customer site could continue to be utilized for consumption and demand variability. Second, with a single echelon supply chain design, the majority of inventory could be located downstream at the customers, upstream at Kodak finishing, or a hybrid of the two. Locating the majority of inventory downstream at customers would allow the inventory to be used both as the sole source of replenishment for customer operations and also as the primary buffer for Kodak’s heijunka process. The benefit of this would be immediate and preferred access to Kodak finished goods while the disadvantage would be loss of minor risk pooling. Locating the majority of inventory upstream at Kodak finishing would allow the inventory to be used both as the sole source of replenishment for customer operations and also as the primary buffer for Kodak’s heijunka process. The advantage of this rationale for inventory would be tighter connection with the Kodak finishing process and improved minor risk pooling while the difficulty would lie in maintaining a 100% replenishment service level. Using a hybrid inventory model would entail the benefits of immediate availability while potentially jeopardizing replenishment capability at customer sites. This would occur by filling too much of customers’ receiving space by the wrong portfolio of items.
The third decision the model needed to address was the logistics design: how to configure the logistics lanes. Three possibilities were modeled: indirect shipping, direct shipping, and milk runs. The current state used indirect shipping of trucks from Kodak finishing to regional distribution centers to customers. Direct shipping could be used to ship from Kodak finishing directly to individual customers. Milk runs could be utilized to ship from Kodak finishing to multiple customers per run. The direct shipping and milk run scenarios entailed very different lane configurations, carriers, and cost structures.
The fourth segment modeled the truck utilization decision: whether to use full or “less than full” trucks. This decision had substantial impacts upon the cost structure of logistics and the product mix that could be accommodated. Full trucks could be used to make shipments with a less precise customer item mix while entailing a lower logistics cost. However, this decision entailed other distribution and production tradeoffs, impacting inventory and other variables throughout the supply chain.
The fifth and final section represented the nature of the delivery process. This delivery process could be either flexible or level. Flexible delivery processes had the advantage of
49

being directly responsive to final customer demand yet suffered from logistics capacity constraints and increased logistics costs. Leveled logistics reduced volume sensitivity to downstream requirements by limiting absolute volumes while improving mix sensitivity by enabling a “ship every part every day” tactic. This tactic had the advantage of avoiding additional logistics and supply chain costs.
The five basic decisions the model needed to address coupled together into scenarios. In the following single echelon models, the decision to locate primary buffering inventory upstream at Kodak finishing required “less than full” trucks on a frequent basis to replenish customers. Customers in these scenarios lacked safety stock and therefore needed more frequent and precise fulfillment. In contrast, the decision to locate primary buffering inventories downstream at customer sites required full trucks. The logistics costs of frequent “less than full” trucks were substantial, thus requiring the coupling of full trucks to fulfill to primary downstream inventories.
Four distinct scenarios to the current state emerged. First, the primary buffering inventory could be located upstream at Kodak finishing. This enabled direct shipments with “less than full” trucks to replenish customers. Second, the primary buffering inventories could be located downstream at customers. This required direct shipments with full trucks to replenish individual customers. Third, the primary buffering inventory could be located upstream at Kodak finishing. This enabled milk runs with “less than full” trucks to replenish customers. Fourth, the primary buffering inventories could be located downstream at customers. This required milk runs with full trucks to replenish individual customers. These four alternative scenarios from the current state value stream are illustrated below.
Lane configuration
Inventory placement
Visual Description
Direct ship Upstream (Kodak finishing)
Less than full
Less than full
Less than full
Less than full
Full
Full
Full
Full
Downstream (Customer)
Milk run Upstream (Kodak finishing)
Downstream (Customer)
Figure 3.6.1 Alternate distribution scenarios to the current state
The structure of the model was designed to support analysis of the current state and these four scenarios. The structure is partitioned into several sections: items, time, demand, supply, inventory, cost, and project valuation.
50
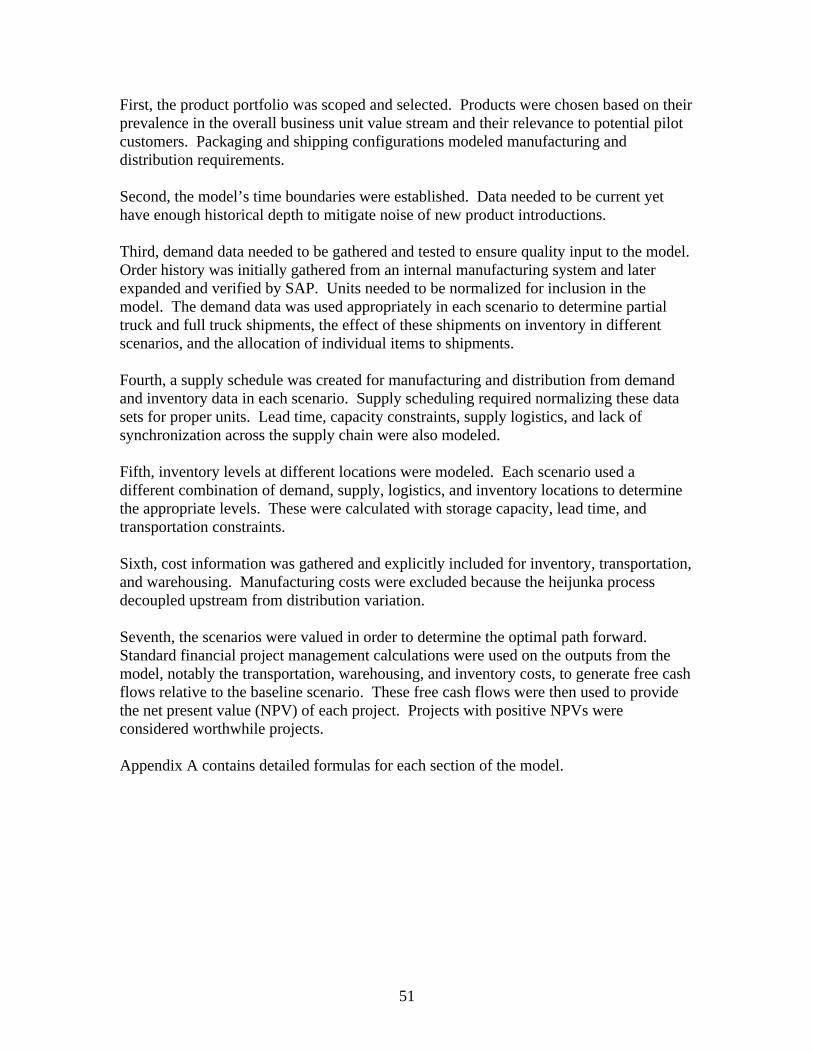
First, the product portfolio was scoped and selected. Products were chosen based on their prevalence in the overall business unit value stream and their relevance to potential pilot customers. Packaging and shipping configurations modeled manufacturing and distribution requirements.
Second, the model’s time boundaries were established. Data needed to be current yet have enough historical depth to mitigate noise of new product introductions.
Third, demand data needed to be gathered and tested to ensure quality input to the model. Order history was initially gathered from an internal manufacturing system and later expanded and verified by SAP. Units needed to be normalized for inclusion in the model. The demand data was used appropriately in each scenario to determine partial truck and full truck shipments, the effect of these shipments on inventory in different scenarios, and the allocation of individual items to shipments.
Fourth, a supply schedule was created for manufacturing and distribution from demand and inventory data in each scenario. Supply scheduling required normalizing these data sets for proper units. Lead time, capacity constraints, supply logistics, and lack of synchronization across the supply chain were also modeled.
Fifth, inventory levels at different locations were modeled. Each scenario used a different combination of demand, supply, logistics, and inventory locations to determine the appropriate levels. These were calculated with storage capacity, lead time, and transportation constraints.
Sixth, cost information was gathered and explicitly included for inventory, transportation, and warehousing. Manufacturing costs were excluded because the heijunka process decoupled upstream from distribution variation.
Seventh, the scenarios were valued in order to determine the optimal path forward. Standard financial project management calculations were used on the outputs from the model, notably the transportation, warehousing, and inventory costs, to generate free cash flows relative to the baseline scenario. These free cash flows were then used to provide the net present value (NPV) of each project. Projects with positive NPVs were considered worthwhile projects.
Appendix A contains detailed formulas for each section of the model.
51

3.6.3 Model analysis
The financial analysis that accompanied the operational model focused on the cost implications of each scenario. Although some of these scenarios could have impacted revenues, these effects were not as salient as the cost implications of the different tactical choices. The original analysis indicated the dominant solution was to placing the primary inventory and pacemaker as far downstream in the value stream as possible. This allowed “standard level mix” trucks to transport finished goods from Kodak finishing to customer sites. It also provided the customer with immediate access to the vast majority of inventory for their consumption under Vendor Managed Inventory. The analysis used the current state as the baseline cost against which all other scenarios were compared. All the projects had positive NPVs, although those with downstream primary inventories were prominent. The following NPVs are relative to the highest NPV project: Direct shipping with inventory downstream and expansion at the customer site.
0%
10%
20%
30%
40%
50%
60%
70%
80%
90%
100%
DIRECT: Finishing -->
customer with
inventory at Finishing
DIRECT: Finishing -->
customer with
HYBRID inventory
DIRECT: Finishing -->
customer with
inventory at customer & expansion
DIRECT: Finishing -->
customer with
inventory at customer &
trucks
Milkrun with inventory at
finishing
Milkrun with inventory at customers
& expansion
Milkrun with inventory at customers
& trucks
Project
Rel
ativ
e N
PV
(%
of
max
imu
m N
PV
$)
Figure 3.6.2 Relative initial NPVs favored direct shipping with inventory at customer
However, after presenting these findings to other stakeholders, the author soon needed to build substantially more assumptions into the analysis. Intra-month demand variability combined with the insensitive steady supply from the heijunka process created large swings in finished goods inventory. This finished goods inventory variability needed to be accommodated with storage capacity. Unfortunately, both Kodak’s finishing and different customers’ receiving capacities were too constraining for this level of inventory fluctuation. As a result, further details of building costs, marginal taxes, external storage in trailers and a variety of other options were researched. The resulting extension of the model confirmed the positive aspect of each of these scenarios over the baseline. However, it became apparent that the only short term feasible scenario was the hybrid direct shipping single echelon model. It was sub-optimal yet still financially positive.
The distribution of final NPVs are distributed below.
52

Physical constraints at individual sites
Figure 3.6.3 Hybrid scenario had highest feasible NPV
Although the NPV for the hybrid scenario was positive, the author needed to further analyze the business case in order to determine its validity. The transition to a business case had prevented the success of a previous LFM implementation in Quick Response. The author was determined to better understand the business case in order to prevent future dissolution after implementation. The resulting business case is normalized and detailed in Appendix B.
3.7 Value Stream Future State Map
After completing the operational model, analysis, and business case, the future state value stream was mapped. The future state combined direct “full truck” shipping and replenishment to each customer, hybrid storage at both Kodak finishing and customer sites, Vendor Managed Inventory (VMI) and Collaborative Planning Forecasting and Replenishment (CPFR). These changes only affected operations downstream of the push-pull boundary. The regional distribution center was eliminated and bypassed. Shipments between Kodak finishing and the regional distribution center were eliminated as well as shipment between the RDC and customers. Inventory shifted to reside close to value-adding operations. Since the majority of hybrid inventory needed to be located after Kodak finishing for constraint reasons, this became the location of the pacemaker in the value stream. Daily consumption and rolling forecasts were communicated directly to a distribution fulfillment team. This team coordinated pulls and shipments to balance level shipments, local inventories at customers, and logistics costs. The heijunka process was maintained in order to decouple upstream from unleveled distribution patterns. The future state of the value stream is illustrated below:
53

DistributionSupport
Solution Mfg/Test
Emulsion Mfg/Test
Dispersion Mfg/Test
Synthetic Chemicals Finishing
Pull regionPush region
Supply Chain Item Planning
Heijunka, DSM, SAP
Daily Daily with coverage
Production planning
Production Control SAP, OPAL, AMAPS
Daily
Daily
Slit Perf/ Pack
Metals
Packaging VendorsGel
Melt / Test
FIFO Coat
FIFO
1 1
1
FIFO
FIFO
FIFO
Pattern Sequence
Customer A
Customer B
Customer C
Daily: consumption & rolling forecast
Daily: consumption & rolling forecast
Distribution Fulfillment
Rolling schedule Daily
Daily: consumption & rolling forecast
Manufacturing
Capacity planning
Figure 3.7.1 Future state of value stream
3.8 Implementation
As the analysis got more specific, the constraints for the implementation began to emerge. These constraints needed to be discovered, contingency plans needed to be made, and the team needed to be prepared for the implementation.
3.8.1 Constraint discovery
The operational model brought a central dilemma to the fore: since this value streams calculated heijunka takts on monthly forecasts, any exceptions or unplanned deviations from that forecast immediately affected finished goods inventory. This occurred frequently and with large volumes for this business unit. As a result, the hybrid scenario needed to have sufficient storage capacity for the maximum amount of finished goods to cover this intra-forecast variability. In the case of Kodak finishing for this business unit and our customers, the existing capacity was not sufficient.
3.8.2 Constraint mitigation
The constraints could be mitigated, however, through several methods. First, Kodak needed to increase the density of its inventory storage in order to absorb the capacity from the warehouse. This could be accomplished several ways, including modifying the production floor layout if enough room is available, negotiating for more room in adjacent areas on site, externally storing inventory at the closest distribution center, externally storing inventory in trucks, externally storing inventory at a 3PL, and using devices within the constraints with minor modifications to the current plant floor.
54

Most of these options slowly were discounted as viable with improved information. There was not enough room in the production line’s current footprint, even with modifications to the layout, to facilitate the inventory capacity. The only production space available that was adjacent to the site was one or two floors above the site with extensive time required for material handling. The closest distribution center was the Central Distribution Center (CDC), which would impose even worse lead times and duplicate much of the waste in the current state of warehousing and truck planning. Externally storing inventory in trucks incurred prohibitive costs to the distribution system. Storing inventory at a 3PL increased our lead times substantially more than the business unit felt acceptable for the given customer base. This left the author to search for devices that let us accept the constraints and use minor modifications to the current plant floor.
Although several options were available, including Automated Storage and Retrieval Systems (ASRS), the KOS team was determined not to implement any monuments into the production system. Therefore, the team planned to purchase and install gravity-fed pallet flow conveyors. This would reduce the footprint of the inventory for forklift lanes while providing a non-powered FIFO lane. It also required minor modification to the layout in finishing. See the illustrations below.
Figure 3.8.1 Gravity-fed pallet flow conveyors
To support the use of these gravity-fed pallet flow conveyors, the author prepared the new layout for finishing. This included testing feasibility of the equipment with the physical dimensions of the building and the full portfolio of product packaging, obtaining permits for fire and safety, and estimating the new material flows. Finishing used “water spiders,” or “water striders” (mizusumashi) - workers who performed a wide range of tasks to enable other workers to perform a greater content of value added work. This is a way of creating more dense value adding flow and creating the potential to systematize improvements within and outside the flow. Frequently water spiders bring materials to the finishing line in specified quantities on specified routes, thus looking like the activity of a water spider. The new layout required rearrangements of water spider routes, supermarket sizes and locations, and outbound logistics. The resulting simplified layout of the pallet flow racks is illustrated below with the outbound customer logistics docks.
55

Gravity-fed pallet flow racks
Outbound logistics shipping dock
Figure 3.8.2 Modified finishing layout with gravity-fed pallet flow racks
The other component of mitigating the inventory constraints was initializing negotiations around Collaborative Planning, Forecasting, and Replenishment (CPFR) with customers. The pallet flow racks would allow the system to work given decent forecasts. However, this business unit suffered from bias in forecasts as well as exceptions. To counter the exceptions, information flow needed to be improved across the enterprise. This could be combated primarily through collaborative planning and forecasting. These processes would allow Kodak to drive less unnecessary inventory into the system through early identification and resolution of exceptions, allowing a larger amount of time to adjust the item-level takt.
Each of these steps has requirements for each party to fulfill. The process flow map from the Voluntary Interindustry Commerce Standards Association is depicted below:
1. Develop Front-End Agreement 2. Create Joint Business Plan 3. Create Sales Forecast 4. Identify Exceptions for Sales Forecast 5. Resolve/Collaborate on Exception Items 6. Create Order Forecast 7. Identify Exceptions for Order Forecast 8. Resolve/Collaborate on Exception Items 9. Order Generation & Fulfillment
Each of these steps has requirements for each party to fulfill. The system is depicted below:
56

Figure 3.8.3 Collaborative Planning, Forecasting, and Replenishment (CPFR) roadmap (VICS)
Although this roadmap is fairly complete, the author needed to negotiate this technique as an effective strategy for the business unit to pursue in combination with the strategy. The following results are the tentative agreement negotiated between different functions for further negotiation with customers:
Frequency Item
Daily Consumption (scanned pulls)
Inventory (on-hand)
Updated rolling horizon daily forecast • Current day + (x Days)
Weekly Forecast exception review & revisions
Monthly Key Performance Indicators (KPIs) review • Examples: forecast accuracy, inventory availability
Quarterly Business goals & strategies
Joint business plan, goals, and tactics
Table 3.8.1 Negotiated application of CPFR to hybrid scenario
57

Simultaneous with pursuing internal negotiations for CPFR information flows, the team established new information flows for Vendor Managed Inventory. In order to motivate customers to participate and align incentives to optimize all of distribution, consignment inventory at the customer locations was proposed. This business process redesign needed information inputs and outputs from international logistics and distribution as well as coordination and viability information from I.T.
The proposed order flows for direct shipment and consignment inventory included four processes: The consignment fill-up process moved inventory from Kodak finishing to the customer consignment location. The consignment issue process issued inventory to the customer and triggered billing at the time of consumption. The consignment return process returned inventory to the customer consignment location and credited the customer (for demand changes and quality problems). The consignment pick-up process moved inventory from the customer consignment location to Kodak finishing. The subsequent business processes are illustrated below.
Figure 3.8.4 Standard consignment order flow
3.8.3 Team preparation
The team was updated with the analysis results, project deliverables and process redesigns. Another KOS team member took over my role on the project team. Customer negotiations were underway at the time of internship closure.
58

Chapter 4: Organizational Processes
4.1 Three Perspectives on Organizational Processes
This section examines the project using the three perspectives for analyzing organizational processes: strategic design, political, and cultural.
4.1.1 Strategic design
The formal structure and strategy of the organization had substantial influence on the project.
The strategy of the unit sponsoring my project, Global Manufacturing, was to implement lean production in order to improve service and quality while reducing inventory, capital, and labor costs. This operations strategy was being applied across several business unit manufacturing flows.
The business unit constituted the wider environment of the organization in which I worked. The strategy of this business unit was to compete first on performance, quality, and service. However, as competition has gotten more intense in this market, supply flexibility and reliability have become significantly more important. These two metrics have become a key differentiator for the business unit against rivals like Fuji.
The immediate project goal of integrating customers into Kodak’s production control and logistics tended to emphasize Global Manufacturing’s unified operations strategy over the segmented corporate strategy of the business unit. However, I realized this project had been launched because the business unit’s understandable increasing needs for supply flexibility at the high end were placing severe operational and cost burdens on Global Manufacturing’s upstream operations. Up until this point, they had been able to significantly reduce costs in other business units, but had been unable to significantly change the cost structure of this unit’s business model.
Although the author is prevented from showing the formal designs of these two organizations in which the project was embedded, there is a very important “dotted line” relationship from the business unit to Global Manufacturing. This indirect relationship was an attempt at aligning behavior between these two organizations. However, underneath this seeming alignment, there was a severe lack of aligned strategy and metrics between the two organizations. This was a principle-agent problem in which the business unit cared principally about customer service while not being responsible for its effects, including required inventory levels and excessive manufacturing costs. After Global Manufacturing instituted heijunka, or production leveling, the resulting “hidden” costs of manufacturing capacity and overtime flexibility were dampened. However, the ability to integrate customers into production control and logistics would have provided customers with visibility to the principle-agent problem. As a result, the strategic design fundamentally hindered the project.
59

4.1.2 Political
4.1.2.1 Major Stakeholders
The stakeholders involved in the project were based in six functional areas. Customers and Manufacturing stood to gain the most from the project, while Sales, Distribution, Supply Chain planning, and I.T. had the most to lose.
Stakeholder Interest Gain Loss Customers Provide prints in the correct Improves product Potential for service
quantity, quality, and time to availability. drops due to tightness. complementors and customers. Reduces price, reducing
their operating costs and profit margins.
Sales Customer service. Potential increase in Loss in commissions commission from from one-time reduction improved volume effect on revenues.
in sales. Potential reduction in
Improved product availability. Potential to spend more time on service than requirements.
commission from reduced price effect on revenues. Potential for service drops due to tightness.
Distribution On-time and correct shipments.
Improved reliability and potential improvement of work process in content and timing.
Increased workload to multiple trucks during high usage. Higher mix of products to pick and load. Work reduction at distribution centers.
Supply chain – Inventory management. Increased inventory Reduced pipeline planning availability at customer. inventory. Increased
Access to real customer consumption for
visibility and responsibility for
planning. planning errors. Manufacturing Reduce manufacturing and
inventory costs. Improve processes to support quality and cost reduction.
Reduced manufacturing (capacity, inventory, labor) costs.
Takeover of distribution (particularly warehousing) functions increases workload and space requirements. Reduced overtime benefits to workers.
I.T. Improve communication and transaction systems to improve quality, speed, and cost.
Chance to upgrade systems with real-time information.
Complicated fulfillment process. Potentially negates role of ERP & supply chain software.
Table 4.1.1 Major stakeholders
The support of each of the stakeholders in the lean enterprise distribution project is shown in Figure 6. The majority of manufacturing and customer stakeholders accepted the project. However, some of this support was fragmented due to localized losses offsetting gains. These losses were important to both customers and manufacturing
60

managers who would personally face increased inventory storage requirements even with the fiscal and operational improvements for both organizations.
I also found the reverse situation of fragmented opposition to the project. Although certain functions like Sales and Supply Chain had substantial power to lose, they had thoughtful managers who understood the corporate- and network- wide benefits beyond their functional silos. These managers were willing to work with me and provide beachheads of support in order to advance the project.
Figure 4.1.1 Stakeholder map
4.1.2.2 Compatibility of interests
These interests across functions were not entirely compatible. Although there was operational reciprocity between Manufacturing and Distribution, it was extremely difficult to reconcile the diverging interests of these different groups. They can be changed to be better aligned through two efforts: a better corporate strategy for managing the tradeoff decision between the two groups and a more matrixed structure. First, a corporate strategy needs to be developed to understand and manage the tradeoff between cost and service for this business unit. The coexisting requirements of 100% service level and infinite flexibility with significant capacity/inventory/labor cost reduction is not a feasible corporate strategy: it is akin to a split-personality. Second, the single link between the business unit and a layer of manufacturing management is not significant enough to create any significant behavioral alignment between the two sets of groups. Individual first-line managers metrics need to be modified, possibly through a Balanced Scorecard initiative, to make a first rough-cut attempt at alignment and communication between these functions.
61

4.1.2.3 Distribution of Political Power
Customers and sales dominated the political environment. The source of this power is actually an interesting interplay of industry dynamics and corporate strategy. Kodak originally dominated the industry because it attained a first mover advantage. Pushing technology enhancements into silver halide film continually defended this first mover advantage. As a result, Kodak established significant market share. However, competing firms like Fuji have also been advancing the performance of their film portfolio. As a result, for some customers, the technology is fulfilling many of their performance requirements. This forced Kodak’s corporate strategy to segment the market between high and low ends. While Kodak still retains a strong position in the lower segment, this segment is their traditional base that provided the majority of volume and profit. While their segmentation strategy has been successful at the high end, the business unit needs to create a mitigation strategy if it hopes to retain substantial share of both segments. The lack of this mitigation strategy supporting the lower segment has resulted in them treating all products with the same metrics and priorities. This provides customers and sales with the most power of any stakeholder group.
The success of the project may provide the ability to devise an operations strategy that logically flows out of a segmented corporate strategy. This would relieve the business unit groups of many of their concerns while allowing manufacturing to pursue some of their cost objectives.
4.1.2.4 History of Lack of Conflict Complicated Buy-In
The previous section discussed the need for a segmented operations strategy to cascade down from the corporate strategy. Before the build-up of momentum in manufacturing for their own lean operations strategy, manufacturing accepted the logic and requirements of business unit. Thus conflicts were primarily based on unexpected demand or difficulties in planning, leading to requirements for manufacturing to flexibly respond. Thus, the problem was primarily how high manufacturing jumped in response to the request, not if manufacturing should jump at all. This lack of serious conflict made the project highlight complications arising out of the segmented corporate strategy and unified operations strategy for each subgroup.
Thus, many of the previous conflicts were amenable to effective conflict resolution and problem solving. However, the different nature of conflicts arising out of the project made them less responsive to this kind of resolution.
There have been disputes about this initiative. Due to the history of lack of conflict, most people’s views did not come out directly. They emerged during discussions of models or methods. I personally found this to be the case during my attempts to build assumptions into a model of the future system. Even though people could understand the model, they would continually add new and more controversial assumptions, making it increasingly difficult to bridge the gaps between groups. However, I was able to get people to see the
62

overall picture for Kodak across functional silos using models. Models became enablers for discussing interests and trying to cross-functional silos for the good of the company.
There were several measures I used to allow the less powerful parties to voice their interests as they related to the project. First, I included representatives from every function affected on the team. This would help to extract conflicts of interest as well as implementation challenges. Second, I attempted to use different types of interaction to resolve these conflicts. These included assumption inclusion in the model building process, brainstorming discussions, initiation of goodwill through thank you notes, and requesting check-outs and feedback from meetings. All of these activities built a subculture of open discussion without fear of reprisals. My only requirement was for members to be open to ideas that better positioned Kodak and the network as a whole in an improved financial and operational position.
4.1.3 Cultural
3.1.3.1 Symbolic Meaning of the Lean Enterprise Distribution Project
The Lean Enterprise Distribution project had a symbolic meaning for Kodak: the possibilities of expansion of lean from a manufacturing silo to the entire extended enterprise. For those of us in the Kodak Operating System office who understood the power of this concept as it applied to other industries, it was a small first step towards unleashing the competitive and evolutionary power of the production network.
However, the Lean Enterprise Distribution project had different symbolic meanings to different groups within the network. For customers, it was the opportunity to unlock cost reduction advantages. In the case of sales, the project represented a new direction in customer service, focusing less on requirements and more on value-added services. Distribution recognized it as a fundamentally new mental model in how logistics was fulfilled. For supply chain planning, the project represented a more leveraged and effective trend of inventory management. Manufacturing saw this as a building block out of their functional isolation. I.T. viewed this as a change initiative with significant cost reduction possibilities.
4.1.3.2 Infusion of New Cultural Value: Total Value
The Lean Enterprise Distribution project attempted to change many of the norms, values, and basic assumptions of the production network’s organizations. It was an extension of the corporate values of a “diverse and winning culture.” This corporate culture is very supporting of the growing lean subculture within manufacturing: the relentless search for total value. However, it is in partial opposition to other entrenched subcultures of partial value that unfairly trade benefits in one section of the extended enterprise for costs in another. In this manner, it is the beginning of a more aligned and holistic approach to corporate culture.
63
4.1.3.3 Communication of Lean Enterprise Distribution within Kodak Culture
The project was formally being framed to others as a joint project between the business unit and manufacturing to improve our business process. Although I was impressed by certain individuals’ grasp of the importance for business units beyond Business Unit X, upper management still needed to better understand the fundamental goals for the extended enterprise. As a result, I was a member of a Kodak Operating System team to build and present a live interactive model of Kodak’s future lean extended enterprise for senior management, co-sponsored by the COO Charles Brown. We presented this to a large segment of senior management: Kodak’s CEO Daniel Carp, the project’s host business unit president, every other business unit president, and a wide variety of other functions and units. It was an exciting first step in aligning metrics to facilitate development of a lean enterprise at Eastman Kodak Co.
4.1.3.4 My Role Within the Kodak Culture
I generally introduced myself to other organizational participants and members of my project team as a student from MIT working on a change implementation project for KOS. Although the Kodak Operating System office has sponsored around five internships in the last several years, Business Unit X had never experienced one before. I was easily accepted into the KOS sub-culture. However, it took significant sensitivity and time to get accepted into the other sub-cultures. Without further support, I believe people in these other subcultures will generally not appropriate the initiative for their own use because of the negative implications for their subcultures.
4.1.3.5 Interactions of the Three Perspectives
The three perspectives shed light on the limiting factors behind the project. The strategic design incoherence of alignment between segmented corporate and unified operational strategy and separation of manufacturing from the business unit, political domination by customers and sales, and significantly different cultural implications quickly constrained technical solutions I developed for the project.
The strategic design perspective held the logical crux of the problem: misaligned corporate with operational strategy. This misalignment informed the political analysis by providing a tactical slant to the individual interests of each sub-group. These sub-group tactics then needed to be translated and interpreted for that particular culture.
This realization became crucially important for me to move ahead. I recognized the organizational implications from the three lenses and began making headway.
64
4.2 Leading the Change Process
This section describes my application of the MIT Leadership Model for Catalyzing Action and Change to the Lean Enterprise Distribution project. It discusses how I went about carrying out the four processes of Sensemaking, Relating, Visioning, and Inventing (Kochan), as well as the consequences of these actions.
4.2.1 Sensemaking
My Sensemaking process consisted of two major components: listening and talking to people, and creating a mental model.
During the first three weeks of my internship, I focused on listening and talking with people. I held 1-on-1 interviews with 22 people in eight different groups. These interviews provided me with a variety of critical information, including the structure, culture, values, and resulting politics across groups. They also became opportunities to widen my scope of influence through additional contacts and referrals. However, these primarily became opportunities to “break the ice” and become enablers to develop working relationships. After these initial interviews were completed, I traveled to the primary sales region to see customers, the regional warehouse, and distribution planners that I would need to interface with.
I used a variety of other techniques to create my mental models of the situation. I attended the 7A.M. morning production “huddle” every day. This allowed me to begin to understand the issues many of the manufacturing, supply chain, and distribution people dealt with on a daily basis. I also created a KOS worldwide “supply chain board.” This board took up an entire wall and illustrated the “takt” or flow rate of the major products for the business unit I would be interfacing with. In addition, I quickly developed a stakeholder map with metrics to keep track of all these organizational relationships.
4.2.2 Relating
I developed the relating process through two stages: building credibility and developing working relationships.
I tried to build credibility during the first stage of relating. In a fairly rigid hierarchical culture, it is important to build credibility both from below and from above. From below, I worked on the production line and helped logistics with shipping for one week. As stated above, I attended the daily production “huddles.” From above, I requested help from a business unit manager to establish initial credibility with different functional managers. I also helped create and demonstrate a lean extended enterprise simulation for Kodak’s senior management. The combined credibility building from both below and above created the initial conditions for fruitful relating.
Second, I began developing working relationships. This was primarily done initially through brainstorming sessions, one-on-one preparation before team meetings, and model
65
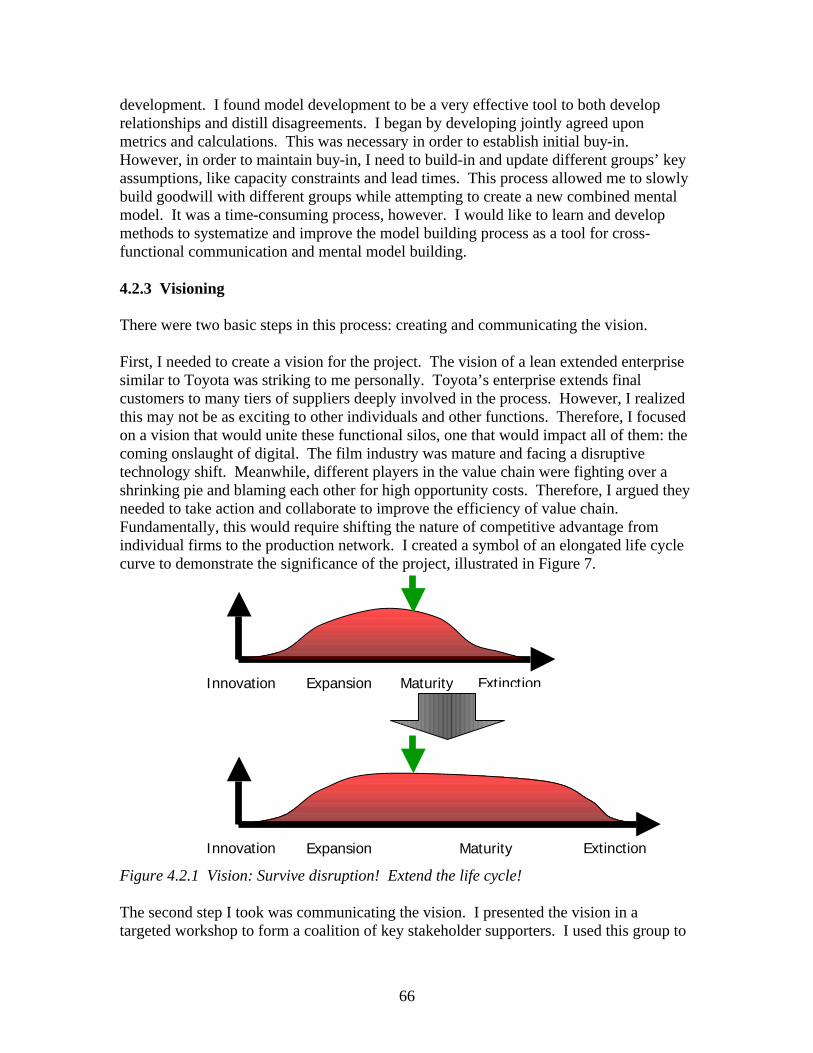
66
development. I found model development to be a very effective tool to both develop relationships and distill disagreements. I began by developing jointly agreed upon metrics and calculations. This was necessary in order to establish initial buy-in. However, in order to maintain buy-in, I need to build-in and update different groups’ key assumptions, like capacity constraints and lead times. This process allowed me to slowly build goodwill with different groups while attempting to create a new combined mental model. It was a time-consuming process, however. I would like to learn and develop methods to systematize and improve the model building process as a tool for cross-functional communication and mental model building. 4.2.3 Visioning There were two basic steps in this process: creating and communicating the vision. First, I needed to create a vision for the project. The vision of a lean extended enterprise similar to Toyota was striking to me personally. Toyota’s enterprise extends final customers to many tiers of suppliers deeply involved in the process. However, I realized this may not be as exciting to other individuals and other functions. Therefore, I focused on a vision that would unite these functional silos, one that would impact all of them: the coming onslaught of digital. The film industry was mature and facing a disruptive technology shift. Meanwhile, different players in the value chain were fighting over a shrinking pie and blaming each other for high opportunity costs. Therefore, I argued they needed to take action and collaborate to improve the efficiency of value chain. Fundamentally, this would require shifting the nature of competitive advantage from individual firms to the production network. I created a symbol of an elongated life cycle curve to demonstrate the significance of the project, illustrated in Figure 7. Figure 4.2.1 Vision: Survive disruption! Extend the life cycle! The second step I took was communicating the vision. I presented the vision in a targeted workshop to form a coalition of key stakeholder supporters. I used this group to
Expansion Maturity Extinction Innovation
Expansion Maturity Extinction Innovation

develop robust solutions across stakeholders, win them over, and prepare for a pilot implementation. This group was crucial to the long term success of the project. I needed this coalition to believe in both the vision and the project as an effective means of carrying it out.
4.2.4 Inventing
With the vision created, communicated, and a key coalition supporting it, I began inventing by segmenting the strategy into discrete tactics. This included improving material flows through direct shipping, improving information flows through Collaborative Planning, Forecasting, and Replenishment (CPFR), and establishing long term contracts to support the process. One of the key requirements to involving customers in this process was sharing benefits from improvements with them, as well as sharing risks of production fluctuation.
We were well on the way to beginning the pilot with new plant floor layouts, equipment specifications, and fire loading analyses completed
4.2.5 My “Dual Parallel Approach” Change Signature; Feedback; Team Quality
The experience taught me how much I care about including people in the change process while keeping sufficient momentum. In previous change initiatives, I have tended to oscillate between building momentum either from below or above. I had generally tried to include people and expected people to be helpful. However, since this would frequently not happen, as expected under the Three Lenses, I would react and break this inertia by going above the individual. This approach is not very effective because people first underestimate your resolve and then are blindsided by pressure from above. Instead, I have tried a more simultaneous approach so that people affected know that I wanted them involved and I care about their feelings, yet also understand that I need to maintain the project’s progress.
I took several lessons of leadership feedback that I will use to develop my leadership competencies. First, I need to anticipate challenges to projects farther in advance. For instance, before proposing methods or techniques, I need to anticipate which functions, groups, or individuals may have issues with the proposal. If I can anticipate this, I would potentially be able to propose the topic differently or bring proposals to mitigate their concerns. Second, I need to more frequently and directly voice my vision. I frequently only express the vision only once to people. However, repetition, strength, and examples are needed to drive other people to take on deep convictions.
Since I led a team as part of the project, I would rate the quality of team’s internal processes as moderately weak and boundary management as strong. As discussed above, the time and resource constraints created massive problems for the team formation and management processes. As a result, the team’s internal processes were weak. Although the delegation and boundary management tasks were performed decently, the lack of cohesion within the group prevented any cumulative leaps forward for the team. I
67

attempted to have the team improve through storming, but most of this resulted in members echoing their functional homes’ complaints instead of working as a team.
4.3 Evaluation and Recommendations
4.3.1 Evaluation Using Metrics
The single metric commonly discussed at Kodak concerning the internships is Net Present Value (NPV). As discussed previously, to be considered successful, projects must identify and at least partially implement a value of >= $1 million NPV. Using this metric, the project was successful since it both identified and partially implemented a project that exceeded this measure. This business case was described previously in this thesis. In addition, it helped train senior management in lean enterprise techniques, improved vertical functional communication, initiated horizontal functional communication, trained the implementation team and prepared key materials.
4.3.2 Evaluation as a Change Process
The findings from the internship were widely distributed within the affected functions. The recommendations have been generally accepted. Some groups, notably sales, have made their acceptance contingent upon customer approval in final negotiations. The implementation team is still intact and undergoing final customer negotiations. I believe the changes will be sustainable because of the relatively minor technical changes required. However, if misaligned operational strategy and metrics reemerge as dominant forces, it could hinder further rollout of the pilot. I believe that substantial organizational learning has occurred within the KOS office, particularly in understanding how important alignment of incentives is for the entire extended enterprise. I believe the learning will be diffused to other units in the organization as KOS establishes formal offices and builds influence in adjacent functions, notably logistics, product development, and process development.
Based upon my experience, I have several recommendations for those who might attempt a similar project in this setting in the future. They should replicate being involved in a tight sub-function like KOS who has aligned overall goals. This was an impressive hotbed of collaborative learning and progress. In addition, they also replicate early and serious sensemaking efforts. The time spent at this stage of the process is well worth the cost. However, they should do their visioning differently. I developed my vision too late in the process. By the time I really understand the fundamental cause preventing substantial support behind the project, it was almost too late to develop the vision, get support, and establish a quick win. In retrospect, I am still uncertain, even if I had known the fundamental problem of disconnected corporate and operational strategies, whether formalizing the vision would have solved the problem. I may have been working at too low a point in the organization to have solved that fundamental problem. However, the additional time may have proven critical given the correct powerful combination of coalition and vision.
68

Chapter 5: Theory and application
“Like fire and atomic power, the concept of adaptation must be handled with care” (Sober and Wilson, 101).
The Kodak Operating System office impressed me how effectively they learn, retain and institutionalize lean routines beneficial to Kodak. It made me consider how firms build routines and capabilities, as well as evolve and compete over time.
5.1 Theory of the Firm
In order to develop this understanding, I underwent an in depth literature review beyond that already discussed. It initially began with research on lean enterprises, logistics, supply chain, and operations research models. However, I soon recognized the need to develop a better understanding of the many dominant mental models in academic research underlying these other approaches. Unfortunately, most of the literature on the theory of the firm has significant overlap and lacks any explicit modeling. The resulting mental models were distilled from management literature. Many are supported by Scholl’s integrative work on management theories.
5.1.1 Neoclassical View (Economics)
The neoclassical view is the primary view held within economics. It assumes the function of the firm is to combine inputs through a production function. Under this mental model, all firms’ capabilities and products are homogeneous. These firms also are assumed to be perfectly rational and have perfect information. The price mechanism keeps markets in equilibrium. Meanwhile, individual firms have clear objective functions and always maximize profits.
Combining of Production Inputs
Production Inputs
Demand Products/ Services
Satisfiable Demand by
Firm
Reinvestments
Revenues
Surplus
SatisfiedNew Investments
Payout Demand
Figure 5.1.1 Mental model of the neoclassical view
5.1.2 Transaction Cost (TC) View (Coase)
Ronald Coase wrote a seminal article in 1937 entitled “The Nature of the Firm.” He argued that firms exist for the sole reason of the ability to coordinate productive decisions more effectively than the price mechanism of the market. The theory developed argued
69

s
s
s
Costs
n n
s
dd
that managers compete against the market to establish the lowest transaction costs. As transaction costs decline, firms will inherently grow larger.
Similar to the neoclassical view, TC assumes the function of the firm is to combine inputs through a production function. Under this mental model, all firms’ capabilities are not homogenous while products are the same. These firms are still assumed to be perfectly rational and have perfect information. The price mechanism keeps markets in equilibrium, also determining the optimal boundary of the firm. Individual firms have clear objective functions and always maximize profits.
Productive Inputs
Combining of Productive Demand Inputs Products/ Input 1 Input 2 Input nServicesVariable Costs
Fixed Costs
Total Satisfiable Satisfiable Demand Costs
Reinvestments
Revenues
Demand by Firm by Market
Surplus Satisfied Demand
New Investments Payout
Figure 5.1.2 Mental model of the Transaction Cost view (adapted from Scholl, 9)
5.1.3 Transaction Cost (TC) View (Williamson)
This view is the primary view behind many analysts of lean extended enterprises, notably Dyer. Williamson expanded upon Coase’s Transaction Cost view by including restricting assumptions of bounded rationality and opportunism upon individual agents of the firm. Meanwhile, additional environmental assumptions of information asymmetry within the firm and uncertainty in demand in the market amplify these constraints. Firms can mitigate individual agent’s opportunism through incentives and hierarchical control.
Similar to the traditional TC view, Williamson’s extension assumes the function of the firm is to combine inputs through a production function. Firms’ capabilities continue to be differentiated while products are homogenous. The major difference occurs around rationality and information: rationality is now bounded while information is both asymmetric and uncertain. The price mechanism keeps markets in equilibrium. The boundary of the firm is now complicated by asset specificity. Individual firms have potentially different objective functions.
Productive Inputs
Combining of Productive Inputs Products/
Service
Revenue
Surplus
Payout
Reinvestment
New Investments
Demand of Uncertain Degree
Satisfiable
Fixed Costs
Variable
Total Costs
Uncertai Input 1
Uncertai Input 2
Uncertain Input n
Satisfiable Demand by Market in Small
Number
Satisfie Deman
Bounded Rationality
Opportunism
Information Asymmetry
Asset
Demand by Firm
Specificity
Figure 5.1.3 Mental model of the extended Transaction Cost view (adapted from Scholl, 10)
70
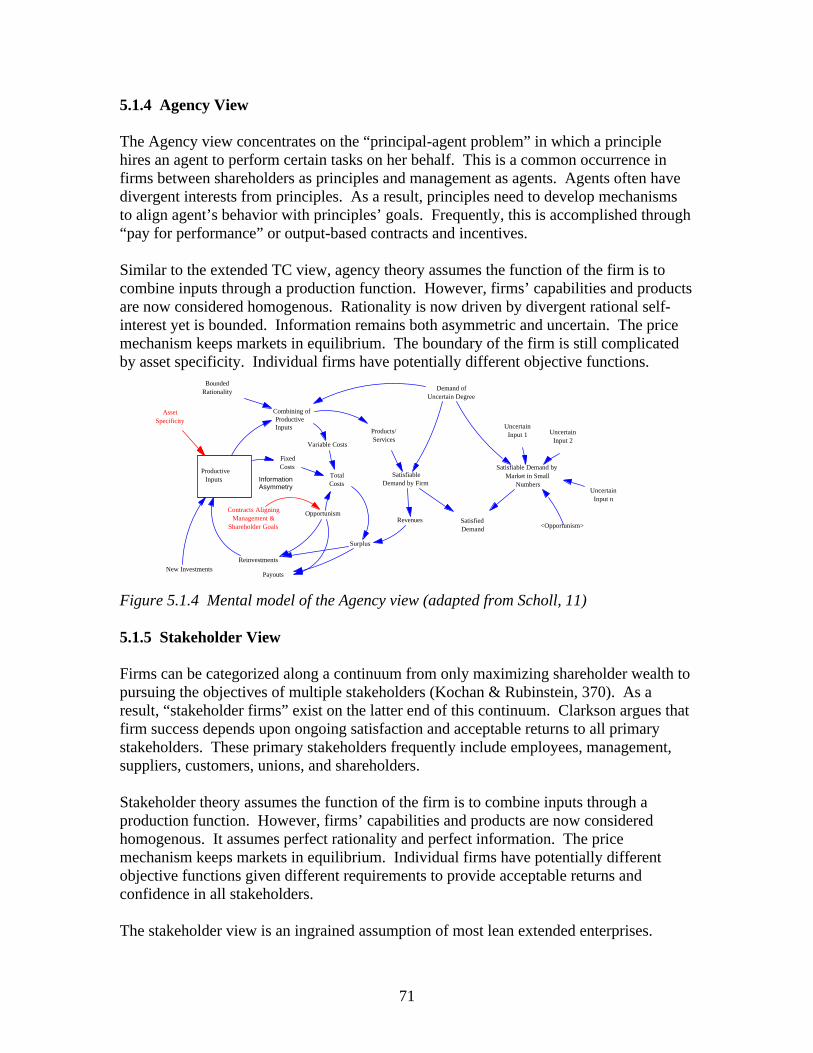
5.1.4 Agency View
The Agency view concentrates on the “principal-agent problem” in which a principle hires an agent to perform certain tasks on her behalf. This is a common occurrence in firms between shareholders as principles and management as agents. Agents often have divergent interests from principles. As a result, principles need to develop mechanisms to align agent’s behavior with principles’ goals. Frequently, this is accomplished through “pay for performance” or output-based contracts and incentives.
Similar to the extended TC view, agency theory assumes the function of the firm is to combine inputs through a production function. However, firms’ capabilities and products are now considered homogenous. Rationality is now driven by divergent rational self-interest yet is bounded. Information remains both asymmetric and uncertain. The price mechanism keeps markets in equilibrium. The boundary of the firm is still complicated by asset specificity. Individual firms have potentially different objective functions.
Productive Inputs
Combining of Productive Inputs Products/
Services
Revenues
Surplus
Payouts
Reinvestments New Investments
Demand of Uncertain Degree
Satisfiable Demand by Firm
Fixed Costs
Variable Costs
Total Costs
Uncertain Input 1 Uncertain
Input 2
Uncertain Input n
Satisfiable Demand by Market in Small
Numbers
Satisfied Demand
Bounded Rationality
Opportunism
<Opportunism>
Contracts Aligning Management &
Shareholder Goals
Asset Specificity
Information Asymmetry
Figure 5.1.4 Mental model of the Agency view (adapted from Scholl, 11)
5.1.5 Stakeholder View
Firms can be categorized along a continuum from only maximizing shareholder wealth to pursuing the objectives of multiple stakeholders (Kochan & Rubinstein, 370). As a result, “stakeholder firms” exist on the latter end of this continuum. Clarkson argues that firm success depends upon ongoing satisfaction and acceptable returns to all primary stakeholders. These primary stakeholders frequently include employees, management, suppliers, customers, unions, and shareholders.
Stakeholder theory assumes the function of the firm is to combine inputs through a production function. However, firms’ capabilities and products are now considered homogenous. It assumes perfect rationality and perfect information. The price mechanism keeps markets in equilibrium. Individual firms have potentially different objective functions given different requirements to provide acceptable returns and confidence in all stakeholders.
The stakeholder view is an ingrained assumption of most lean extended enterprises.
71

Figure 5.1.5 Mental model of the Stakeholder view (adapted from Scholl, 12)
5.1.6 Schumpeter View
Schumpeter developed a theory of “creative destruction” in which exogenous market shocks allow entrerpreneurs to creatively recombine productive inputs and resources. This enables these newcomers to establish competitive advantage and frequently conquer incumbent firms.
Schumpterian theory assumes the function of the firm is to combine inputs through a production function. However, firms’ capabilities and products are heterogeneous. It assumes bounded rationality and imperfect information. Markets are perpetually forced out of equilibrium due to these creative disruptions. Individual firms have potentially different objective functions given potential paths to competitive advantage.
Figure 5.1.6 Mental model of the Schumpeterian view (adapted from Scholl, 12)
72
Image removed due to copyright reasons.
Image removed due to copyright reasons.
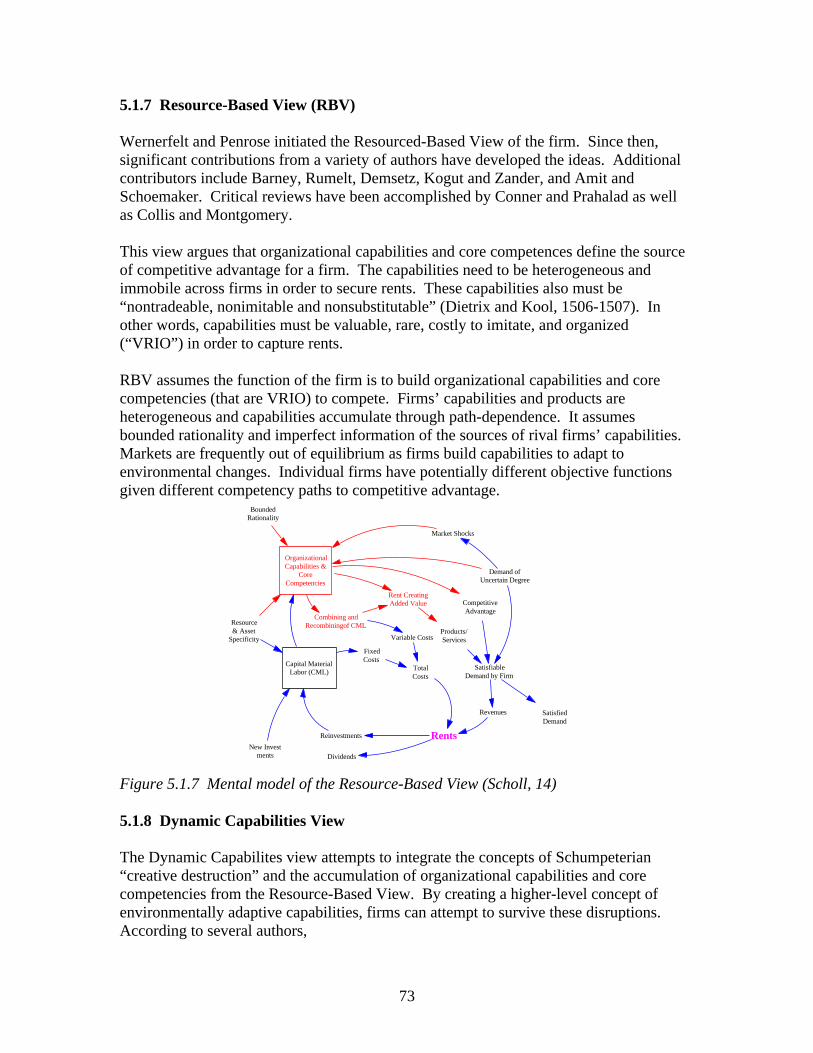
5.1.7 Resource-Based View (RBV)
Wernerfelt and Penrose initiated the Resourced-Based View of the firm. Since then, significant contributions from a variety of authors have developed the ideas. Additional contributors include Barney, Rumelt, Demsetz, Kogut and Zander, and Amit and Schoemaker. Critical reviews have been accomplished by Conner and Prahalad as well as Collis and Montgomery.
This view argues that organizational capabilities and core competences define the source of competitive advantage for a firm. The capabilities need to be heterogeneous and immobile across firms in order to secure rents. These capabilities also must be “nontradeable, nonimitable and nonsubstitutable” (Dietrix and Kool, 1506-1507). In other words, capabilities must be valuable, rare, costly to imitate, and organized (“VRIO”) in order to capture rents.
RBV assumes the function of the firm is to build organizational capabilities and core competencies (that are VRIO) to compete. Firms’ capabilities and products are heterogeneous and capabilities accumulate through path-dependence. It assumes bounded rationality and imperfect information of the sources of rival firms’ capabilities. Markets are frequently out of equilibrium as firms build capabilities to adapt to environmental changes. Individual firms have potentially different objective functions given different competency paths to competitive advantage.
BoundedRationality
Resource & Asset
Specificity
Capital Material Labor (CML)
Combining and Recombiningof CML
Products/ Services
Revenues
Rents
Dividends
Reinvestments
New Invest ments
Demand of Uncertain Degree
Satisfiable Demand by Firm
Fixed Costs
Variable Costs
Total Costs
Market Shocks
Competitive Advantage
Organizational Capabilities &
Core Competencies
Rent Creating Added Value
Satisfied Demand
Figure 5.1.7 Mental model of the Resource-Based View (Scholl, 14)
5.1.8 Dynamic Capabilities View
The Dynamic Capabilites view attempts to integrate the concepts of Schumpeterian “creative destruction” and the accumulation of organizational capabilities and core competencies from the Resource-Based View. By creating a higher-level concept of environmentally adaptive capabilities, firms can attempt to survive these disruptions. According to several authors,
73

Dynamic capabilities are “the ability to reconfigure, redirect, transform, and appropriately shape and integrate existing core competencies with external resources and strategic and complementary assets to meet the challenges of a time-pressured, rapidly changing Schumpeterian world of competition and imitation (Teece et al., p. 339).
This is an extremely important concept because it addresses the RBV assumption of infinite organizational plasticity. Instead, firms must develop their capability to transform competencies, which itself is a time- and path-dependent process. As a result, from a system dynamics perspective, the Dynamic Capabilities view establishes a “cascading tower” of organizational “stocks.”
Satisfied Demand
Capital Material Labor (CML)
Combining and Recombiningof
CML
Products/ Services
RevenuesRents
Dividends
Reinvestments New Invest
ments
Demand of Uncertain Degree
Satisfiable Demand by Firm
Fixed Costs
Variable Costs
Total Costs
Bounded Rationality
Market Shocks
Competitive Advantage
Organizational Capabilities &
Core Competencies
Rent Creating Added Value
Resource & Asset
Specificity
Search & Renewal
Capabilities
Permanent Market Turmoil
Figure 5.1.8 Mental model of the Resource-Based View (Scholl, 15)
5.1.9 Integrated model of the generic firm
Scholl developed an integrated model of a generic firm in order to better under firm longevity. He incorporated four disciplines into the system dynamics model: economics (theory of the firm), strategic management (resource- and knowledge-based theories of the firm), management science (stakeholder theory), and sociology (theory of synreference). It also built upon de Geus’ theory of the “Living Corporation.” The conclusion drawn from the formalization and integration of these theories resulted in validating the majority of de Geus’ arguments. Three of de Geus’ four traits of a “Living Corporation” were affirmed positively: organizational cohesion, sensitivity to the environment, and tolerance to new ideas.
The resulting “COSID” model included five model sectors: 1.) Capital, material, and labor; 2.) Organizational capabilities and core competencies; 3.) Search and renewal capabilities; 4.) Internal constituents’ confidence; and 5.) Discretionary funds.
74
Figure 5.1.9 Mental model of integrated generic firm, or “COSID Model” (Scholl, 185)
5.1.10 Evolutionary view - Dual level individual with single mode (evolutionary economics; biological reductionism)
Nelson and Winter initiated a new field of industrial analysis: evolutionary economic theory. It built upon Schumpeter’s theory of “creative destruction.” Evolutionary economic theory argued against the use of neoclassical theory due to its strong assumptions concerning perfect rationality and information. Nelson and Winter used the biological metaphor of natural selection and organizational genetics to describe ecological evolution among firms. The authors argued that firms develop routines, which are the organizational equivalent of genes. In this manner, routines function to ensure behavioral continuity as an organizational analogue of genetic heredity. Since routines are costly and raise conflict to change, they generally have a property of inertia. They defined three types of firm-specific routines: standard daily routines, periodically recurring routines to alter the course of action (e.g. adjustments to investment decisions according to current profitability), and standard routines for seeking improvements (of process and operating characteristics) (Scholl 63). Unlike routines, organizational capabilities and individual skills require conscious decision making. Dosi et al. argued firms adapt to disruption through combination and recombination of capabilities and knowledge.
Within evolutionary economics, most subsequent contributors have continued using Nelson & Winter’s assumptions. These assumptions include using routines as the unit of variation and relying upon replicators for evolutionary control. This argument states that the evolutionary dominance has a unidirectional flow from a single origination level in an underlying replicators (e.g. genes, routines) up into their larger system (e.g. organism, firm).
75
Image removed due to copyright reasons.

There have been minor deviations on this theme, notably by Mathews and Kwasnicki. Mathews attempted to link evolutionary economics with the Dynamic Capabilities view. He used resources, routines, and relations as the units of variation. This variation generally arose through replication, imitation, recombination, and creation. The firm remains the unit of selection with additional emphasis on co-evolution of advantaged clusters.
Kwasnicki developed a model similar to Nelson & Winter with two exceptions: it used products as the unit of selection and it addressed large-scale fitness changes. All the previous models assume a smooth environment of relative fitness resulting from variation, or “fitness landscape.” Kwasnicki attempted to integrate “rugged fitness landscapes” in which there are multiple peaks of high relative fitness. Firms undergoing replicator variation must pass through low relative fitness, or valleys, in this rugged landscape to reach higher peaks. R&D funds
publicized knowledge
search for innovation
search through imitation
inventions
modernization, innovation, and radical innovation
selection
unit cost
real profit and income
firm's capital
investment capacity
credit's availability
firm's saving
firm's debt
production and investment decisions
production offered for sale production sold on
the market
expected profit and income
price
technical competitiveness
capital productivity
product's competitiveness
market share estimation
average competitiveness estimation
market structure
average price estimation
expected production to be sold on the market
Figure 5.1.10 Mental model of evolutionary economics (Kwasnicki, 85)
Figure 5.1.11 Rugged fitness landscape introduces challenges to evolutionary economics (Kwasnicki, 85)
76
Image removed due to copyright reasons.

5.1.11 Evolutionary view - Dual level individuals with multiple modes (Fujimoto)
In refreshing contrast to the evolutionary economics approach, there is a small yet growing evolutionary viewpoint arising out of operations management and lean production. Fujimoto, Nishiguchi, and Sako are the first proponents of this view that I’ve come across.
Fujimoto developed a compelling taxonomy of the evolution of the Toyota Production System. He argued that Toyota developed its capability through the interaction of an internal evolutionary system with an external selection mechanism. The internal evolutionary system consisted of the three basic components of variation, selection, and retention. However, unlike evolutionary economics, variation did not occur through isotropic variation arising out of simple replication. Variation arose from a variety of modes, including environmental constraints, knowledge transfer, rational calculation, entrepreneurial vision, and random trials. Subsystems of Toyota’s manufacturing routines developed through these multiple paths.
Figure 5.1.12 Multiple evolutionary modes; Mutli-Path System Emergence(Fujimoto,9)
After this variability arose, these crude solutions were internally selected and refined through Toyota’s evolutionary learning capability. Next, these solutions were further developed through Toyota’s learning and operational capabilities, generally resulting in improved operational performance. Since these ingrained routines had inertia, however, it sometimes resulted in overshooting as the external environment changed and purification as the routines were transferred, particularly from Japan to the United States. The process was finally completed through internal and external selection due to the improved operational performance.
77
Image removed due to copyright reasons.

Figure 5.1.13 Mental model of capability building at Toyota (Fujimoto, 273)
5.2 Evolutionary view – Hierarchical individuals with multiple modes (White)
Two features of the previous evolutionary research were particularly intriguing. Most accounts relied solely on selection as the mode of evolution and upon the firm or product as the sole level for the unit of selection.
First, most accounts of evolutionary economics relied heavily upon the single mode of evolution – selection. This contrasted with Fujimoto’s multiple path system emergence. Since these paths created a large creative pool in high relative frequency for the forces of internal selection to work upon, these multiple paths defied the evolutionary economics’ view of variability creation through mutation during replication of the unit of evolution.
Second, all accounts of evolutionary economics used the firm or product as the only level for a unit of selection. In contrast, Fujimoto used both an internal and external selection process to describe the development of Toyota’s capabilities. Although firms are the business analogue of organisms, they do not come under such a harsh selection environment. In addition, there are multiple levels of selection that can occur both within firms – at the individual, workgroup, project, and business unit levels – as well as across firms – at the strategic alliance, strategic network, production network, industry, nation, and regional levels. Technologies can also be viewed across their multiple levels – at the basic science, applied science, system, and component levels.
78
Image removed due to copyright reasons.

Unfortunately, all the accounts I reviewed shared several of the following assumptions: 1. Evolutionary development is a process of variation�selection�inheritance 2. Selection is the only mode of evolution 3. Firms or products are the unit of selection, or evolutionary individual 4. Routines are the unit of variation and holder of inheritance 5. Firms deal with rugged fitness landscapes through saltation
The combination of these points, including mode of evolution and unit of selection, required more firm answers. A mammoth book by Stephen Jay Gould, entitled The Structure of Evolutionary Theory, became one of the key influences on my ideas.
Gould argued that evolutionary theory needed to be revised along three Darwinian axes: (1) agency, or organismal struggle as the appropriate (and nearly exclusive) level of operation for natural selection; (2) efficacy, or natural selection as the creative force of evolutionary change (with complexly coordinated sequelae of inferred principles about the nature of variation, and of commitments to gradualism and adaptationism as foci of evolutionary analysis); and (3) scope, or extrapolationism (inference of history from single objects based on quirks, oddities and imperfections that must denote pathways to prior change) (Gould, 59).
5.2.1 Revision of agency to hierarchical evolutionary “individuals”
On the first point of agency, Gould created the notion of an evolutionary “individual.” Evolutionary individuals were defined to have certain criteria, including:
1.) Production of new individuals 2.) Elimination of individuals 3.) Sources of cohesion through stability of the individual, boundaries against
invasion, and “glue” of subparts 4.) Inheritance 5.) Source of new variation in newborn individuals
Along these criteria, he argued that there was a “hierarchy” of evolutionary individuals: from the lowest level of genes through to the highest level of clades. Organisms were simply one of these evolving levels. However, the interesting construction of this hierarchy is the nesting character of relationships: each evolutionary “individual” consists of parts of lower evolutionary “individuals” and is itself part of the collectivity of a higher evolutionary “individual.”
Field of study Levels of Evolutionary “Individuals” Part Individual Collectivity
Biology Gene, cell Organism Deme, Species, Clade
Business Routine/relation/ resource
Firm Dyadic alliance, Production network
Table 5.2.1 Levels of Evolutionary “Individuals”
79

5.2.2 Revision of efficacy to include multiple modes of change
Although hierarchical levels of evolutionary “individuals” is theoretically feasible, it was interesting to see how evolution complemented this with multiple modes of change. Gould argued there were three basic modes of change:
1.) Drive, or directional variation within or between individuals 2.) Selection, or differential proliferation due to traits of interactors 3.) Drift, or random differential proliferation
Gould argued that each evolutionary “individual” in the hierarchy used these multiple modes in a unique way. For instance, although selection through differential death is the predominant mode of organism, species are generally most impacted by differential speciation and founder drift.
Modes of change Feature Organismal level Species level
Drives, or Directional Heritable ontogenetic change Lamarckism – powerful if it occurred Anagenesis (gradualism within Variation within or within the individual = species)
Between Individuals ontogenetic drive
Biased production of new Mutation pressure Directional speciation individuals = reproductive drive
Selection, or Differential Proliferation Due to Traits
of Interactors
Basis in birth Differential birth Differential speciation
Basis in death Differential death Differential extinction
Drift, or Random Differential Proliferation
Within the collectivity Genetic drift Species drift
In founding new collectivities Founder effect Founder drift
Table 5.2.2 Three modes of change exist for biological evolutionary “individuals”; effective mechanisms are highlighted (Gould, 717-718)
There are strong parallels between the traits of evolutionary “individuals” like organisms and firms. Both exhibit the characteristic of trading off control of lower level individuals for functional integration and performance. A parallel argument can be made for the “individuals” like species and production networks. Both exhibit the characteristic of much lower control over lower level individuals for access and leveraging of their unique evolutionary potentials.
A major difference between biological and organizational/technological evolution is the existence and power of Lamarckism at the firm level. Lamarckism is the theory that evolutionary individuals evolve by the inheritance of traits acquired or modified through the use or disuse of body parts. This theory has been rejected in biological evolution in favor of another functionalist approach: Darwinism. Although giraffes cannot inherit the genetic traits required for a longer neck simply by stretching for higher leaves on trees, organizations surely can act themselves to change their routines and technological ideas.
The resulting evolutionary implications for higher evolutionary individuals like production networks and technology architectures place a high emphasis on drift and differential or biased creation of networks.
80

Modes of change Feature Firm level Production network level
Drives, or Directional Heritable ontogenetic change Lamarckism – powerful Anagenesis (gradualism within Variation within or within the individual = alliance/network)
Between Individuals ontogenetic drive
Biased production of new Mutation pressure Directional network creation individuals = reproductive drive
Selection, or Differential
Basis in birth Differential birth Differential network creation
Proliferation Due to Basis in death Differential death Differential extinction Traits of Interactors
Drift, or Random Differential Proliferation
Within the collectivity Genetic drift Network drift
In founding new collectivities Founder effect Founder drift
Table 5.2.3 Three modes of change exist for organizational evolutionary “individuals”; effective mechanisms are highlighted (adapted from Gould, 717-718)
5.2.3 Revision of scope to include structural, historical, and functional factors
His previous revision to include the modes of natural selection as a counterweight to strict Darwinian functional adaptation still could not counter arguments of extrapolationism. Since Gould was a paleontologist, he recognized massive gaps in the fossil record followed by extremely short periods of intensive change. He called this process “punctuated equilibrium” because the fossil record generally laid in relative stasis until a new species was created. Strict Darwinian functional selectionists argued that the evolutionary process for individuals at levels higher than their level of analysis (typically the gene or organism) was predetermined through “upward causality.” As Gould’s analysis demonstrated, each level had unique irreducible evolutionary dynamics that could not be simply assumed away through extrapolation.
Therefore, Gould analyzed the three “schools” of evolutionary thought: functional, historical, and structural causality of form. The symbol he used was the aptive triangle.
e.g. Dyer, Sako, Nishiguchi; Schumpeter
Functional Structural Spandrels (other features)
“Physical” forces
Parallelism (positive enabling channels)
Exaptive Pool:
e.g. Fujimoto, Adner & Levinthal
*Saltation:
Stakeholder, Schumpeter, Evolutionary economics
*NOTE: reject saltationist theories
• Spandrels (architectural consequences)• Manumissions (historical unemployments) • Insinuations (invisible introductions)
e.g. Neoclassical, RBV, Principal-Agent,
Historical Deep homology (negative limitation)
e.g. *Christensen*NOTE: insinuation & functionalism e.g. Fine, Control Systems
Figure 5.2.1 The “Aptive Triangle” (modified from Gould, 1052)
81

Since functional arguments of form were the strongest, he looked first at historical arguments and then at structural arguments.
Historical causes of form
The historical school included two components: deep homology and parallelism. He used new finding from “evo-devo,” or evolutionary developmental biology, to develop many of these arguments around historical channeling causality of form. First, “deep homology” was the finding that distantly related animal phyla had conserved developmental genetic pathways. Underlying historical archetypes were found to have a large limiting influence on the directions of change. Cascading development “rules” were found in “evo-devo” in which controlling genes, like the maternal genes bicoid and nanos, activate controlled genes. This cascading control consisted of maternal genes, gap genes, pair-rule genes, segment-polarity genes, and Hox genes for certain animal phyla. As a result of the cascading rules and channeling effects, small genetic variation at different levels resulted in very different phenotypic effects. Most importantly, however, channeled genes acted like developmental “cassettes” that limited the directions of potential evolution. Second, “parallelism” was defined as a constraint in underlying generators. This was in opposition the concept of “convergence,” in which natural selection developed a homologous form through a malleable substrate lacking constraint. Several examples, including the development of the eye in several animal species, lent themselves to the explanation of parallelism over convergence to their current form. As a result, similar forms across distant phyla also channel future changes in preferred directions.
Given this negative limiting and positive channeling of evolutionary direction, the resulting morphospace of phenotypic characteristics was not homogenous. “Inhomogenous occupation of morphospace…must be explained largely by the limits and channels of historical constraint, and not by the traditional mapping of organisms upon the clumped and nonrandom distribution of adaptive peaks in our current ecological landscapes” (Gould, 1174). This was a refreshing argument since discussions of rugged fitness landscapes primarily discuss the implications on overt mechanisms of change.
Structural causes of form
The primary argument of the book, however, goes beyond historical positive channels and negative limits on evolution. The structural school considered two structural influences on form: physical forces and spandrels.
Proponents of physical forces argued that the evolution of form was driven primarily by external forces and not by historical or functional constraints. One of the main proponents in this school, D’Arcy Thompson, argued that form is determined by forces like gravity, surface tension, and fluid friction. Form, particularly geometric form, is established by the array of forces most prominent for the organism. For instance, small organisms are subject to forces primarily on their surface whereas medium size organisms are subject to forces that act on both its surface and on its volume. However,
82

the external forces argument fell apart when trying to deal with the complexity of larger organisms. Although appealing for small organisms, the concepts of historical channels became much more appealing for larger organisms.
Second, Gould argued that the primary structural constraints are “spandrels.” Before defining the term, it is important to understand the context out of which it arose. “Spandrels” came out of the “quirky functional shift” problem in Darwinism. Originally, Mivart, a structuralist opponent of Darwin, claimed to have trumped Darwinist selection with the following “5 percent of a wing.” To my astonishment, Darwin had grappled with this and developed a semi-working solution.
Five percent of a wing offers no conceivable aerodynamic benefit for an organism. As such, it would not be formed under a smooth regime of natural selection for flight. Thus, the incipient stages may have performed a different function, for which their five percent of a wing imparted benefits. Eventually, the enlarging protowing entered the domain of aerodynamic benefit, and the original function changed to the primary utility now exploited by most birds. Current function cannot be equated with reasons for historical origin. (Gould, 1223)
The resulting concept of “quirky functional shift” was Darwin’s brilliant response to Mivart. On the surface, this response allowed functional selection to remain unscathed. However, it required redundancy with two functions for one structure or two structures for one function. Since Darwin proposed a restrictive version of functional shifting, it remained fully adaptational. Unfortunately, even this restricted version is often either not originally known or underplayed in most applications of evolutionary theory. As a result, our understanding of evolutionary change is impaired. Many of the evolutionary economics texts and articles I read needed to rely on “saltation,” which is defined as “discontinuous movement, transition, or development; advancement by leaps.” Where authors even assumed rugged landscapes, saltation was the frequent response to moving between localized maxima. For instance, Kwasnicki relied on recrudescence, or the “search for original, radical innovations by employing daring, sometimes apparently insane, ideas” (Kwasnicki, 9). The more ingrained use of saltation was expressed by Perkins in his reliance upon substantial increases in underlying variability in order to navigate through valleys in “Klondike landscapes.” Both approaches could be improved through the application of “quirky functional shift.”
Spandrels developed as the structural foundation for “quirky functional shift.” A spandrel is an architectural term, meaning “the roughly triangular space between the left or right exterior curve of an arch and the rectangular framework surrounding it; the space between two arches and a horizontal molding or cornice above them.” Gould argued that “spandrels originated as a nonadaptive side-consequence of a prior architectural decision. These originally nonadaptive spaces were then coopted…as “canvasses” for wonderfully appropriate designs. In biological terms, the mosaic designs are secondary adaptations, and the spandrels themselves then become exaptations for the residence of those designs” (Gould 1253).
83

Figure 5.2.2 The spandrels of San Marco (denoted with ellipses)
Since spandrels are only one type of resource for “quirky functional shift,” Gould developed the concept of the “exaptive pool.” Since spandrels represent a structural, not functional, resource that is inherent in many evolutionary processes, it would be correct to view most available resources as “aptations” instead of “adaptations.” In addition, evolutionary individuals maintain this “fund” or “pool” of potential utilities as a source for future fitness or evolvability. Therefore, I shall refer to it as the individual’s “exaptive pool.”
Feature Nickname Origin Inherent potentials Franklins Available things Miltons
At-level spandrels by geometry
Spandrels Structural
Cross-level spandrels by injection As historical unemployments
Manumissions Historical
As invisible introductions
Insinuations Historical
Table 5.2.4 Taxonomy of the exaptive pool (Gould, 1280).
There is a wide variety of examples of exaptations in biology, including the redundancy and combinatorial flexibility within genomes arising from “junk DNA,” the flexibility derived from developmental channels in “evo-devo,” and the flexibility, persistence, and capacity for change in an evolving population.
5.2.4 Synthesis of revisions
A set of arguments were previously made: first, selection works simultaneously at several hierarchically ordered levels of evolutionary individuality. Second, cross-level spandrels originate automatic expressions levels other than the focus of application. These are introduced into the coopting level simultaneously as changes occur in the original separate evolutionary channel on a different focal level. Since cross-level sprandrels
84

propagate to various levels of the evolutionary hierarchy, they fundamentally enable the evolutionary individual’s evolvability.
Spandrels and historical constraints provide substantial power to contingency. Since historical origin cannot be equated with current utility, evolution’s process cannot simply be extrapolated from microevolutionary mechanics. Within biology, genes do not have total control of upward causality to higher evolutionary individuals. Likewise, within organizations, routines do not fully control the evolvability of the firm. Meanwhile, in technologies, component ideas do not control the long term success of a particular architecture or dominant design.
In addition, the exaptive pool provides crucial insights into the uniqueness and power of different evolutionary individuals. In this framework, species derive their capability not from functional integration and active adaptation. Instead, species’ evolvability comes from the species’ ability to leverage inwardly cascading exaptive effects from lower-level individuals.
“The species-individual, as a Darwinian interactor in selection at its own level, operates largely with cross-level exaptations arising from unsuppressed evolution of subparts (primarily organisms) at lower levels within itself. Such nonsuppression acts as a source of evolutionary potential by permitting species to draw upon a wider pool of features than organism can access…By not suppressing this evolutionary churning from within, the species-individual gains enormous flexibility in remaining open to help from below, expressed as exaptive effects that confer emergent fitness…we should interpret these allometrically driven properties as cardinal strengths, and recognize the species as a “rich-but-different” Darwinian individual. The species, in this view, acts as a shelter or arbor that holds itself fast by active utilization of the properties that build its well-defined individuality. By fostering internal change, and thereby gaining a large supply of inwardly cascading exaptive effects, species use the features of all contained lower-level individuals through the manifestation of their effects on the shelter itself (Gould, 1293).
5.3 Application to Business Models and Technologies
Technologies are another type of evolutionary individual that is increasingly being analyzed within evolutionary theory.
Unfortunately, due to the strict functionalism of most evolutionary camps, most have limited their analyses to areas like research idea variability.
Cohen and Malerba argued that variability of innovative activity within industries stimulates technological progress in three ways: selection effect, breadth effect, and complementarity effect. The selection effect described the process in which firms
85

compete on quality and cost for market selection. As more variants competed, the winning variant was expected to have an improved quality per unit cost. The breadth effect described the improved technological progress resulting from firms pursuing distinct, non-competing, and independent approaches to innovation. The complementarity effect enhanced technical progress through the application of information from one course of R&D to a different but related activity (Cohen & Malerba, 592, 594-595).
Unfortunately, this result is not very prescriptive for what firms need to do in order to improve the evolvability of their technologies. Christensen’s Innovator’s Dilemma has been a terrific catalyst to addressing the supply-side character of most technology strategy. I believe Christensen’s concept of disruptive technologies is a direct result of structural constraint, notably across-level spandrels. Christensen defines disruptive technologies as lower performance technologies that successfully invade the lower tier of the market due to incumbent’s highly profitable current customer base and the trajectory of sustaining technology.
The issue of sustaining versus disruptive technologies is fundamentally a question of the contours of fitness landscapes. As discussed previously, a few evolutionary economists refer to rugged landscapes. Perkins defined a “Klondike” landscape as one that includes:
• Large space, few solutions (wilderness gap) • No clues pointing direction (plateau gap) • Solution isolated from where search starts (canyon trap) • Area of high promise but not over solution threshold (oasis trap) (Perkins, 162)
Disruptive business models can be defined as a global performance optimum within a canyon trap. Conventional adaptive selection (trial-and-error with many variants) and Lamarckian drive (preferred design concept) both stay away from canyon traps because it would incrementally lead to lower interim fitness. This lower interim fitness is the analogy of upper segment customers supporting only sustaining improvements that gradually improve performance. Since lower end customers can accept lower performance, they fundamentally provide a different selection criterion. This shift in selection criterion is a form of “quirky functional shift.” Depending on the individual technology or business model, these shifts can frequently be in the exaptive pool, notably as cross-level spandrels. Exaptations in technology and business models is illustrated.
86

Application 2 for Application 1 for
Application 2 for spandrel Z1-C spandrel Z1-C,
Application 1 for
another firm/product
Application 1 for
Application 1 for
Application 1 for
other firm/product
Application 2 for
Application 1 for
other firm/product
another firm/product
spandrel Z1-A
Application 2 for spandrel Z1-A,
spandrel Z1-B
spandrel Z2-A
spandrel Z2-C,
spandrel Z2-B
spandrel Z2-B,
spandrel Z2-B
Figure 5.3.1 Spandrel evolution model (component technologies or organizational routines). Given feasible requirements for an application’s technology portfolio or organizational routine, the firm will exapt a spandrel to escape the evolutionary trap.
Adner and Levinthal came to a remarkably close conclusion. They argued that technologies develop along certain trajectories and go through a “speciation” event.
Figure 5.3.2 Technology speciation model (Adner & Levinthal, 25)
These authors made several interesting examples of the powerful role of exaptation in technology development. They described its impact on wireless communications, medical imaging, and video recording technology.
87

Figure 5.3.3 Technology speciation example in medical imaging (Adner & Levinthal, 25)
These arguments are similar in many ways. However, the argument for regarding these “quirky functional shifts” as exaptations rather than speciation is important. Exaptation allows a modular conception of technology development. It allows component technologies and even the architecture itself to remain the same, regardless of application. In contrast, speciation assumes selection has changed lower level evolutionary individuals within the technology. Although it is a subtle difference, it will be an important difference in understanding the strategic implications for development.
5.4 Application to Lean Extended Enterprises
The application of these ideas to organizations is an interesting task. I decided to start by analyzing key routines at Toyota. These were well documented by Fujimoto and provided the best opportunity to integrate concepts from the lean enterprise and evolutionary disciplines.
The following table connects each set of routines to the aptive source as well as the mechanism by which they emerged. The intriguing point is how little functional adaptive selection played upon the development of routines for the extended enterprise. At this level, the exaptive pool provided the majority of innovative resources from different levels upon which Toyota drew strength.
88

Aptive Mechanism Firm-Level Routines Production Network-Level Routines source Just-in-
Time Multi
Tasking Jidoka and
Flexible Kaizen
and Black Box
Heavyweight Product
Supplier association/
with Equipment TQC Parts Manager consulting/ Product-
Focus Supplier learning
Layout teams Functional Drive:
Lamarckism/Vision X X X
Selection: Adaptation Historical Drive: Deep
homology/channeling X X X X
Drive: Parallelism X X X Structural Drive: External /
“physical” forces X X X X
Drive: Internal X X X X X X Exaptive Sprandrel (Across) X X X X
Pool Sprandrel (Within) X X X Insinuations (Across) X X
Table 5.4.1 Mapping Toyota Production System subsystems to “Aptive Triangle”
Routines primarily developed at the level of the firm were generally exapted from within and driven through a combination of Lamarckian drive, historical deep homology, and structural internal channeling. Extended subsystems were generally exapted from across and driven through a combination of historical parallelism, structural external forces and structural internal channeling.
These results confirm Gould’s hypothesis that lower level evolutionary individuals rely more heavily upon functional integration while higher-level individuals rely upon the active usurpation upward potential. In this sense, Toyota began behaving more like a higher evolutionary individual, the extended enterprise, than an individual firm.
The foundation of Toyota’s competitive advantage lay in its’ ability to identify and utilize spandrels arising from within while subsequently building these within their positive historical channels. However, they extended this competitive advantage through further identifying spandrels beyond their immediate level and utilizing these to counteract external forces given their internal constraints. The combination of their ability to leverage the entire exaptive pool provided the basis for them first to establish a lean enterprise and to expand into a lean extended enterprise.
The firm’s ability to combine the exponentially increasing power of the exaptive pool for extended enterprise evolvability was buttressed by two other related processes:
1.) Development of a “package” of primary and secondary behaviors in order to “amplify altruism”
2.) Establishment as keystone ecological role to enable niche complementors
Sober and Wilson wrote an excellent book on group selection. Although I favored the logical coherence of Gould’s account, Wilson had a terrific insight on initiating change: how to “amplify altruism.”
“The use of secondary behaviors to promote altruistic primary behaviors can be called the amplification of altruism. The
89

population structure of many human groups may not be sufficient for altruistic primary behaviors to evolve by themselves, but may be sufficient for primary and secondary behaviors to evolve as a package. Since the secondary behaviors cause the primary behaviors, behaviors that evolve in human groups can be similar to those that evolve in species with more extreme population structures, such as clonal organisms and social insect colonies” (Sober and Wilson, 146).
Primary behaviors typically help the group substantially but come at a significant potential cost to the actor. A prime example of this within Toyota’s extended enterprise is suppliers’ agreement to target costing. This substantially helps the network since it provides the basis for long-term improvement. However, it potentially costs the supplier a great deal since they are liable to “hold-up” from Toyota during negotiations since Toyota attains process and financial information in the improvement process.
Secondary behaviors are reinforcing behaviors that come at a small cost to the actor. They can be positive or negative in design. Examples of positive behaviors include rewards, like suppliers keeping the majority of jishuken improvements and the ability to join the supplier association. Examples of negative behaviors include Toyota performing strong audits if suppliers do not meet the agreed target cost and the potential cultural ramifications from severing of relations.
The resulting combination of evolutionary mechanisms with lean extended enterprise values can be used to understand the evolutionary mechanisms behind product, process, and value chain dynamics.
Figure 5.4.1 Evolutionary mechanisms and dynamics of industry structure
90
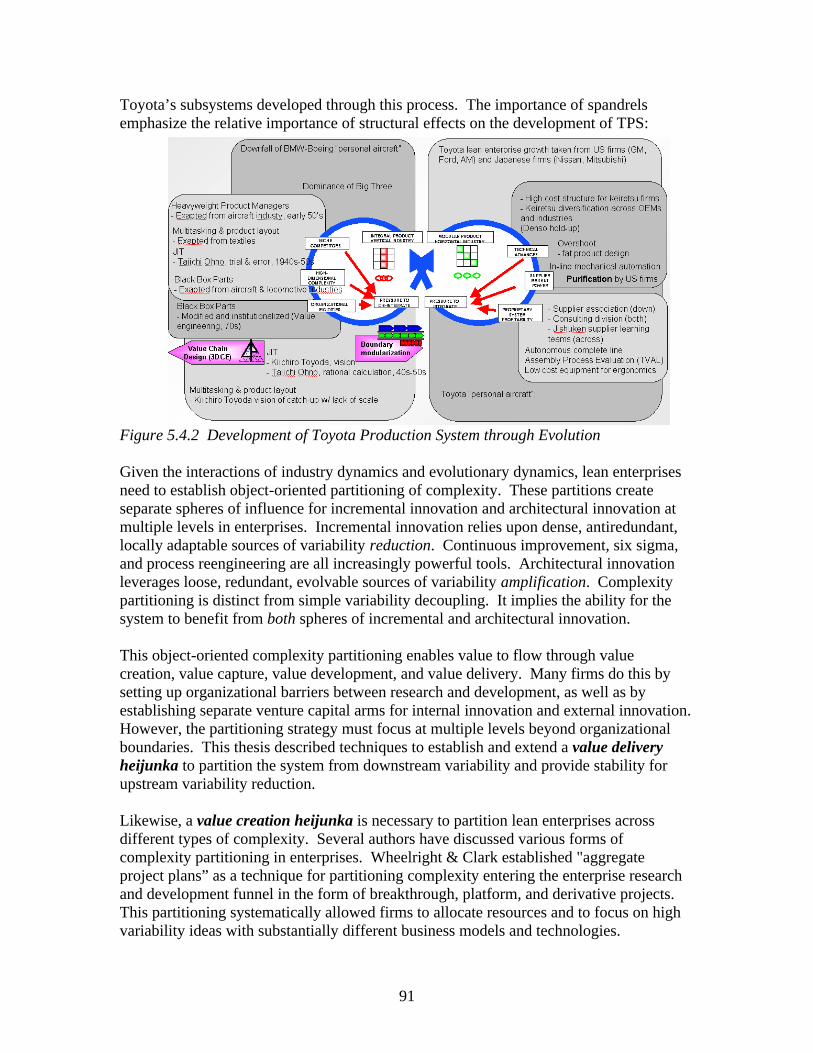
Toyota’s subsystems developed through this process. The importance of spandrels emphasize the relative importance of structural effects on the development of TPS:
Figure 5.4.2 Development of Toyota Production System through Evolution
Given the interactions of industry dynamics and evolutionary dynamics, lean enterprises need to establish object-oriented partitioning of complexity. These partitions create separate spheres of influence for incremental innovation and architectural innovation at multiple levels in enterprises. Incremental innovation relies upon dense, antiredundant, locally adaptable sources of variability reduction. Continuous improvement, six sigma, and process reengineering are all increasingly powerful tools. Architectural innovation leverages loose, redundant, evolvable sources of variability amplification. Complexity partitioning is distinct from simple variability decoupling. It implies the ability for the system to benefit from both spheres of incremental and architectural innovation.
This object-oriented complexity partitioning enables value to flow through value creation, value capture, value development, and value delivery. Many firms do this by setting up organizational barriers between research and development, as well as by establishing separate venture capital arms for internal innovation and external innovation. However, the partitioning strategy must focus at multiple levels beyond organizational boundaries. This thesis described techniques to establish and extend a value delivery heijunka to partition the system from downstream variability and provide stability for upstream variability reduction.
Likewise, a value creation heijunka is necessary to partition lean enterprises across different types of complexity. Several authors have discussed various forms of complexity partitioning in enterprises. Wheelright & Clark established "aggregate project plans” as a technique for partitioning complexity entering the enterprise research and development funnel in the form of breakthrough, platform, and derivative projects. This partitioning systematically allowed firms to allocate resources and to focus on high variability ideas with substantially different business models and technologies.
91

Sridhar Sadasivan’s notion of clockspeed boundary modularity established an example of complexity partitioning in the field of value development. Firms that employ this modularity benefit from the ability to control architectural innovation while hedging and leveraging sustaining incremental innovation rates of modules. Clockspeed boundary modularity acts as a form of value development heijunka.
In the realm of value capture, real options have enabled sensitivity to short term variability by providing access to actionable decision points. These decision points allow firms to “pay to play” in the midst of intense variability. Although real options are sensitive to short term variability, they also are insensitive to long term value capture variation. They decouple short term decisions from the requirement to respond to long term value capture variability. By partitioning this complexity, real options are an example of value capture heijunka.
These four examples of heijunka complexity partitioning are extremely effective techniques for evolving complex adaptive systems. They enable lean enterprises to learn about how to improve their business models, products, and production systems while minimizing the evolutionary costs. These evolutionary costs come in the form of reduced breakthrough or disruptive projects, abandoned projects in the face of financial variability, lost market segments due to the evolutionary pace of external component technologies, and worse cost structures from the inability to institute effective learning in production systems. As a result, enterprises that lack these skills are unable to evolve over time in the dynamics of government policy, business cycles, industry structures, corporate strategies, and technology development.
Thus, lean extended enterprises can institute heijunka to partition strategies of complexity reduction for different types of value.
Value capture heijunka
Real options
Value creation heijunka
Aggregate project planning
Value development heijunka
Value delivery heijunka
Demand leveling (mix & volume)
Clockspeed modularity
Figure 5.4.3 Heijunka partitions complexity in different domains along the flow of value
92

The recognition of simultaneous partitioning strategies along the value flow has been recognized by several peers in the LFM program as a critical component of competitive advantage for lean enterprises. This caused a group of us to develop a symbol for this phenomenon. We chose a symbol from the “Tortoise and the Hare” story. The group coined the symbol of the “Tortare” – a creature that is both fast and hypersensitive in the short term yet slow and insensitive in the long term.
Figure 5.4.4 The evolution of the “Tortare” (Bowers, Rassey, & White, 12)
The implications for the theory of the firm are important. Current theories recognize this seemingly divergent capability, albeit in different and isolated ways. The Transaction Cost view recognizes the importance of partitioning in value creation and value capture. The Schumpterian view argues for partitioning value creation. The Dynamic Capabilities and Single Mode Evolutionary view primarily acknowledge the importance of partitioning value creation. The Hierarchical Evolutionary view is the only view of the firm that appreciates the importance of partitioning value at every stage along its flow.
93
Image removed due to copyright reasons.

Chapter 6: Conclusion
The opportunity to work with the Kodak Operating System office was a terrific experience. Partner companies in the Leaders For Manufacturing program should learn from their gains as a first organizational step towards achieving and institutionalizing operational value delivery excellence.
I hope my insights into evolutionary development of business models, technologies, and lean enterprises will provide a first step for a more integrated research agenda. There are two areas of future research that should be pursued. The first area of future research is the extension of partitioning theory for lean enterprises. More partitioning mechanisms must be identified and integrated into an evolutionary theory of competitive advantage of the enterprise. Current techniques employed by lean enterprises, like Six Sigma, should be utilized to amplify or reduce variability depending upon the relationship of the application to the enterprise complexity partitions. The impact and influence of different stakeholders should also be explained.
The second domain of research is genetics. Since this work incorporated theoretical principles from biology, implications from the completion of the human genome will shed further light on complexity partitioning in natural complex adaptive systems. The Human Genome Project found the human genome to consist of 2.9 billion base pairs (International Human Genome Sequencing Consortium, 875). The research discovered base pairs, called “exons,” that code for proteins, effectively acting as “value adding” templates that maintain low variability. There are approximately 30,000 base pairs of “exons,” thus making up only 1.5% of the length of the human genome (Gregory, 18). The remainder of the genome consists of “junk DNA.” However, geneticists are discovering that this remaining DNA is not “junk” at all – organisms thrive simultaneously on the amplification of variability in these “non value-adding” non-coding regions through architectural recombination. However, they simultaneously rely upon simultaneously reducing variability in the “exon” regions. In addition to the complexity partitioning of an individual genome’s relative structure, the size of genomes across and within phyla are not correlated with complexity. For instance, salamanders, lungfishes, and certain types of protozoa all have larger genomes than humans (Gregory 17). These natural complex adaptive systems do not use strictly modular systems – otherwise increases in complexity would be correlated with expansion of the genome. Neither do they employ strictly integral systems due to the negative impacts of coupling base pair deletions on selection. Instead, these natural complex adaptive systems partition complexity at various levels and interact with higher-level dynamics like cell cycles and organism metabolism requirements. These dynamics may provide the key analogy to linking lean enterprise complexity partitioning with higher-level dynamics in technology, corporate strategy, industry structure, business cycle, and government policy.
94

Appendix A - Model
A.1 Item data
Known Values • n = item or product • x = number of items • Ln = Roll length {linear ft/roll} • Pn = Pallet configuration {rolls/pallet} • Tn = Trailer configuration {pallets/trailer} • WTn = Weight capacity of long-haul trailer » 40,000 lbs
Calculations • rn = Pallet density {ft/pallet} = Roll length * Pallet configuration • rTn = Trailer density {ft/trailer} = Pallet density* Trailer configuration • WPn = Pallet weight {lbs/pallet} = Trailer weight capacity / Trailer configuration
A.2 Time data
Known Values • t = Date • z = final date = 434
Calculations • Wt = Weekday1 to t {values 1 through 7, in which 1 and 7 are weekends}
A.3 Demand data
Known Values • Dt,n = Demand {ft} for t = 1 to z; for n = 1 to x
Calculations • DPt,n = Demand {pallets} = Dt,n / rn
• DPTt,n = Demand {partial trucks} = PDt,n / Tn
• CDPTt = Combined demand {partial trucks} = �DPTt,n for n=1 to x, t = i • ADPTt = Actual demand {partial trucks} = IF(and(Wt<>1,Wt<>7)=1,
IF(CDPTt>2,3, IF(CDPTt >1,2, IF(CDPTt>0,1,0))),0)• DFTt = Demand {full trucks} = IF(and(Wt<>1,Wt<>7)=1, IF(((�CDPTt for t=1
to i)-(�CDPTt for t=1 to i-1))>2,2, IF(((�CDPTt for t=1 to i)-(�CDPTt for t=1 to i-1))>1,1,0)),0)
• Dtst = Time since ship = IF(DFTt=0, Dtst +1,0) • DVTt = Leftover{partial trucks}=(�CDPTt for t=1 to i)-(�DFTt for t=1 to i) • DNSIt,n = Demand of not shipped items with full truckload {partial trucks} =
IF(Dtst>=1, (DPTt,n + DNSIt-1,n),0)
95

• DVITt,n = Leftover items from full truckload shipments {partial trucks} =IF(CSPTt=0,IF(DFTt>=1,(DVTt/ DVTt-1)*(DNSIt-1,n+DVITt-1,n), DVITt-1,n), IF(DFTt>=1,(DVTt /CDPTt)*DPTt,n,DVITt-1,n))
• DFITt,n = Item load for full truckload shipment {partial trucks} = IF(DVITt,n=0, IF(�DVITt,n for n=1 to x >=1, ((DVTt-1-DVTt)/(DVTt-1 +CDPTt+�DVITt,n for n=1 to x))*(DNSIt-1,n+DPTt,n) +DNSIt-1,n,0), IF(�SVITt,n for n=1 to x >=1, SNSIt-
1,n+SPTt,n -(DVTt/CDPTt)*DPTt,n+DVITt,n,0))
Note: DFTt = �DFITt,n for n=1 to x Note: demand data is replicated for Q individual customers and a combined milkrun; denoted c = 1 to q, m for milkrun
A.4 Supply data
Known Values • Dt,n = Demand {ft} for t = 1 to z; for n = 1 to x • LTu = Lead time from upstream operation {days}
Calculations • St,n = Supply {ft} ***Assuming 5 day workweek, “leveled” items based on
average future monthly item volumes, lead time effect on make-to-order items, capacity limitation effect from non-Canada export demand
• SPt,n = Supply {pallets} = St,n / rn
• SPTt,n = Supply {partial trucks} = PSt,n / Tn
• CSPTt = Combined supply {partial trucks} = �SPTt,n for n=1 to x, t = i • ASPTt = Actual supply {partial trucks} = IF(and(Wt<>1,Wt<>7)=1,
IF(CSPTt>2,3, IF(CSPTt >1,2, IF(CSPTt>0,1,0))),0)• SFTt = Supply {Full trucks} = IF(and(Wt<>1,Wt<>7)=1, IF(((�CSPTt for t=1 to
i)-(�CSPTt for t=1 to i-1))>2,2, IF(((�CSPTt for t=1 to i)-(�CSPTt for t=1 to i-1))>1,1,0)),0)
• Stst = Time since ship = IF(SFTt=0, Stst +1,0) • SVTt =Leftover{partial trucks}=(�CSPTt for t=1 to i)-(�SFTt for t=1 to i) • SNSIt,n = Supply of not shipped items with full truckload {partial trucks} =
IF(Stst>=1, (SPTt,n + SNSIt-1,n),0) • SVITt,n = Leftover items from full truckload shipments {partial trucks}
=IF(CSPTt=0,IF(SFTt>=1,(SVTt/ SVTt-1)*(SNSIt-1,n+SVITt-1,n), SVITt-1,n), IF(SFTt>=1,(SVTt /CSPTt)*SPTt,n,SVITt-1,n))
• SFITt,n = Item load for full truckload shipment {partial trucks} = IF(SVITt,n=0, IF(�SVITt,n for n=1 to x >=1, ((SVTt-1-SVTt)/(SVTt-1 +CSPTt+�SVITt,n for n=1 to x))*(SNSIt-1,n+SPTt,n) +SNSIt-1,n,0), IF(�SVITt,n for n=1 to x >=1, SNSIt-
1,n+SPTt,n -(SVTt/CSPTt)*SPTt,n+SVITt,n,0))
Note: SFTt = �SFITt,n for n=1 to x Note: demand data is replicated for Q individual customers and a combined milkrun; denoted c = 1 to q, m for milkrun
96
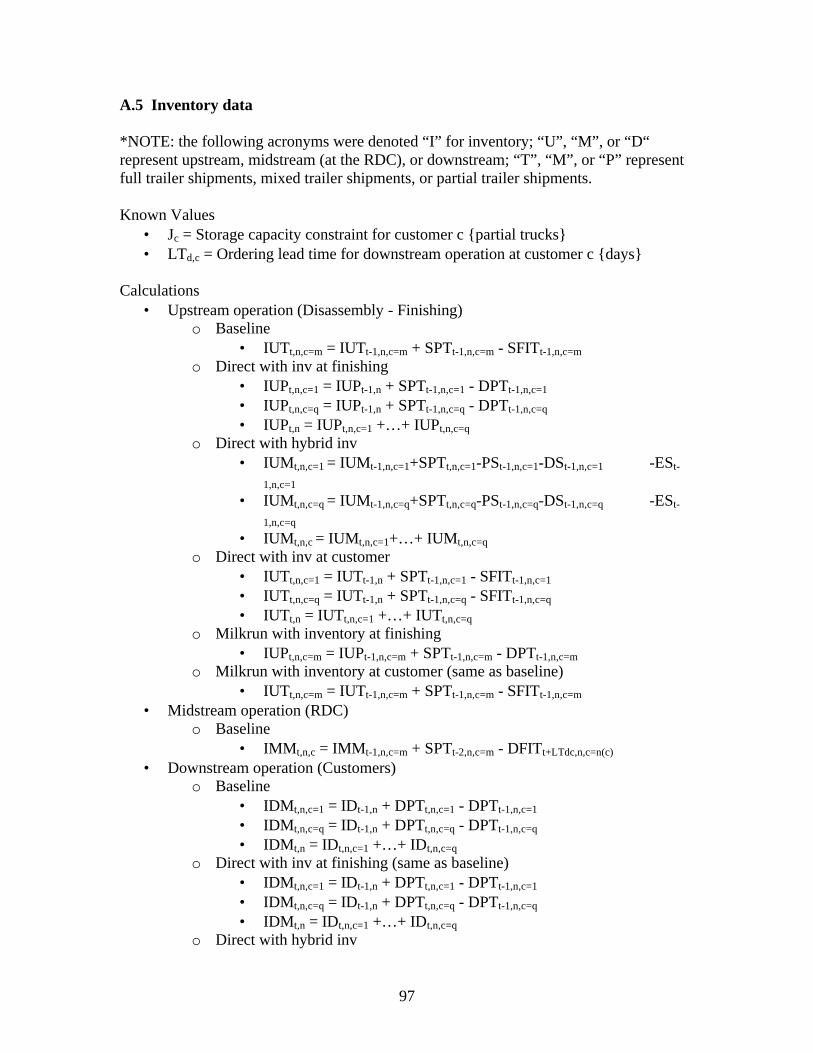
A.5 Inventory data
*NOTE: the following acronyms were denoted “I” for inventory; “U”, “M”, or “D“ represent upstream, midstream (at the RDC), or downstream; “T”, “M”, or “P” represent full trailer shipments, mixed trailer shipments, or partial trailer shipments.
Known Values • Jc = Storage capacity constraint for customer c {partial trucks} • LTd,c = Ordering lead time for downstream operation at customer c {days}
Calculations • Upstream operation (Disassembly - Finishing)
o Baseline • IUTt,n,c=m = IUTt-1,n,c=m + SPTt-1,n,c=m - SFITt-1,n,c=m
o Direct with inv at finishing • IUPt,n,c=1 = IUPt-1,n + SPTt-1,n,c=1 - DPTt-1,n,c=1
• IUPt,n,c=q = IUPt-1,n + SPTt-1,n,c=q - DPTt-1,n,c=q
• IUPt,n = IUPt,n,c=1 +…+ IUPt,n,c=q o Direct with hybrid inv
• IUMt,n,c=1 = IUMt-1,n,c=1+SPTt,n,c=1-PSt-1,n,c=1-DSt-1,n,c=1 -ESt-
1,n,c=1
• IUMt,n,c=q = IUMt-1,n,c=q+SPTt,n,c=q-PSt-1,n,c=q-DSt-1,n,c=q -ESt-
1,n,c=q
• IUMt,n,c = IUMt,n,c=1+…+ IUMt,n,c=q
o Direct with inv at customer • IUTt,n,c=1 = IUTt-1,n + SPTt-1,n,c=1 - SFITt-1,n,c=1
• IUTt,n,c=q = IUTt-1,n + SPTt-1,n,c=q - SFITt-1,n,c=q
• IUTt,n = IUTt,n,c=1 +…+ IUTt,n,c=q o Milkrun with inventory at finishing
• IUPt,n,c=m = IUPt-1,n,c=m + SPTt-1,n,c=m - DPTt-1,n,c=m o Milkrun with inventory at customer (same as baseline)
• IUTt,n,c=m = IUTt-1,n,c=m + SPTt-1,n,c=m - SFITt-1,n,c=m
• Midstream operation (RDC) o Baseline
• IMMt,n,c = IMMt-1,n,c=m + SPTt-2,n,c=m - DFITt+LTdc,n,c=n(c)
• Downstream operation (Customers) o Baseline
• IDMt,n,c=1 = IDt-1,n + DPTt,n,c=1 - DPTt-1,n,c=1
• IDMt,n,c=q = IDt-1,n + DPTt,n,c=q - DPTt-1,n,c=q
• IDMt,n = IDt,n,c=1 +…+ IDt,n,c=q o Direct with inv at finishing (same as baseline)
• IDMt,n,c=1 = IDt-1,n + DPTt,n,c=1 - DPTt-1,n,c=1
• IDMt,n,c=q = IDt-1,n + DPTt,n,c=q - DPTt-1,n,c=q
• IDMt,n = IDt,n,c=1 +…+ IDt,n,c=q o Direct with hybrid inv
97

• IDMt,n,c=1 = IDMt-1,n,c=1+PSt-1,n,c=1+DSt-1,n,c=1+ESt-1,n,c=1 -DPTt,n,c=1
• CCCt,c=1 = Customer capacity constraint = IF((�IDMt,n,c=1 for n=1 to x )<Jc=1,1,0)
• CVRt,n,c=1 = Customer inventory coverage (Advanced item orders over lead time net inventory) = MAX(IF(IDMt-1,n,c=1 < �DPTt,n for t=i-LTd,c to i, (�DPTt,n for t=i-LTd,c to i) - IDMt,n,c=1 - CVRt-
1,n,c=1,0),0) • HFTt,c=1 = Full trucks for hybrid model =
IF(and(Wt<>1,Wt<>7)=1, IF((�CVRt,n,c=1 for t=1 to i) -(�HFTt,c=1 for t=1 to i-1)>4,4, IF((�CVRt,n,c=1 for t=1 to i)-(�HFTt,c=1 for t=1 to i-1))>3,3, IF((�CVRt,n,c=1 for t=1 to i)-( �HFTt,c=1 for t=1 to i-1)>2,2, IF((�CVRt,n,c=1 for t=1 to i)-( �HFTt,c=1 for t=1 to i-1)>1,1, 0)))),0)
• CCVRt,c=1=�CVRt,n,c=1 for n=1 to x • Htst,c=1 = Time since ship = IF(HFTt,c=1=0, Htst,c=1 +1,0) • HVTt,c=1 = Leftover {partial trucks} = (�CCVRt,n,c=1 for t=1 to i)-
(�HFTt for t=1 to i) • HNSIt,n,c=1 = Not shipped items with full truckload {partial trucks}
= IF(Htst,c=1>=1, (CVRt,n,c=1 + HNSIt-1,n,c=1),0) • HVITt,n,c=1 = Leftover items from full truckload shipments {partial
trucks} =IF(CCVRt,c=1=0,IF(HFTt,c=1>=1, (HVTt,c=1/ HVTt-
1,c=1)*(HNSIt-1,n,c=1+HVITt-1,n,c=1), HVITt-1,n,c=1), IF(HFTt,c=1>=1,(HVTt,c=1/CCVRt,c=1)*CVRt,n,c=1, HVITt-1,n,c=1))
• HFITt,n,c=1 = Item load for full truckload shipment {partial trucks} = IF(HVITt,n,c=1=0, IF(�HVITt,n,c=1 for n=1 to x >=1, ((HVTt-1,c=1-HVTt,c=1)/(HVTt-1,c=1 +CCVRt,c=1+�HVITt,n,c=1 for n=1 to x))*(HNSIt-1,n,c=1+CVRt,n,c=1) +HNSIt-1,n,c=1,0), IF(�HVITt,n,c=1 for n=1 to x >=1, HNSIt-1,n,c=1+CVRt,n,c=1 -(HVTt,c=1/CCVRt,c=1)*CVRt,n,c=1+HVITt,n,c=1,0))
• RSt,c=1 = Remaining space at customer site = Jc=1-CCCt,c=1
• PSt,n,c=1 = Possible shipments =IF(AND(�HFITt,n,c=1 for n=1 to x>=1, RSt,c=1>=1), IF(RSt,c=1>=�HFITt,n,c=1 for n=1 to x, HFITt,n,c=1, HFITt,n,c=1*((�HFITt,n,c=1 for n=1 to x -ROUNDUP((�HFITt,n,c=1 for n=1 to x - RSt,c=1>=1),0))/ �HFITt,n,c=1 for n=1 to x)),0)
• DSt,n = Delayed shipments = =IF(and(Wt<>1,Wt<>7)=1,IF(�HFITt,n,c=1 for t=1 to i-1)>0,IF(�HFITt,n,c=1 for t=1 to i, for n=1 to x)-( (�PSt,n,c=1 for t=1 to i, for n=1 to x)>0, IF(RSt,c=1=0,((�HFITt,n,c=1 for t=1 to i)-(�PSt,n,c=1 for t=1 to i))/( �HFITt,n,c=1 for t=1 to i, for n=1 to x)-( �PSt,n,c=1 for t=1 to i, for n=1 to x)))*TRUNC(RSt,c=1,0),0),0),0),0)
• ESt,n = Expedited shipments = -MIN(IDMt+LTu,n,c=1,0) • *NOTE: these calculations must be completed for each customer: c = 1 to q
o Direct with inv at customer
98
• IDTt,n,c=1 = IDt-1,n + SFITt,n,c=1 - DPTt,n,c=1
• IDTt,n,c=q = IDt-1,n + SFITt,n,c=q - DPTt,n,c=q
• IDTt,n = IDt,n,c=1 +…+ IDt,n,c=q
o Milkrun with inventory at finishing (same as baseline) • IDPt,n,c=1 = IDt-1,n + DPTt,n,c=1 - DPTt-1,n,c=1
• IDPt,n,c=q = IDt-1,n + DPTt,n,c=q - DPTt-1,n,c=q
• IDPt,n = IDt,n,c=1 +…+ IDt,n,c=q o Milkrun with inventory at customer (same as Direct with inv at customer)
• IDTt,n,c=1 = IDt-1,n + SFITt,n,c=1 - DPTt,n,c=1
• IDTt,n,c=q = IDt-1,n + SFITt,n,c=q - DPTt,n,c=q
• IDTt,n = IDt,n,c=1 +…+ IDt,n,c=q
99

A.6 Cost data
*NOTE: the following acronyms are denoted “I” for inventory; “U”, “M”, or “D“ represent upstream, midstream (at the RDC), or downstream; “T”, “M”, or “P” represent full trailer shipments, mixed trailer shipments, or partial trailer shipments.
Known Values • Transportation
o W = number of warehouses at the interim echelon o CTa,b,d = Logistics lane cost for a = 1 to q+w, b = 1 to q+w, c = 1 to 2
where a = origin, b = destination, d = mode (1=direct, 2=milkrun) • Warehousing
o LI = Incoming logistics cost for any facility {$} o LO = Incoming logistics cost for any facility {$} o Additional storage capacity costs
• Expansion • BMC = Building marginal cost ($/ft^2) • TROC = Tax rate and building operating costs {%}
• Storage in trailers • Ju = Storage capacity constraint for upstream operation
{partial trucks} • Leasing fee ($/trailer/day) • Fuel costs for trailer refrigeration ($/trailer/day)
• High density storage • HDS = High density inventory storage system costs for
installation in finishing, like pallet flow racks {$/pallet} • Inventory
o Financial information • Pn = Original sales price for item n {$/ft} • V = Volume rebate {% of sales price} • NPn = Net sales price/ft • h = Inventory holding rate » 30% • K = Cost of capital rate » 9.1% • r = Inflation rate » 3.0%
Calculations • Transportation
o Baseline • Normal transportation cost = CTa=u,b=rdc,c=both*(�SFTt,c=m for t=1 to
z) + CTa=rdc,b=1,c=1*(�DFTt,c=1 for t=1 to z) +…+ CTa=rdc,b=q,c=q*(�DFTt,c=q for t=1 to z)
o Direct with inv at finishing
100

• Normal transportation cost = CTa=u,b=1,d=1*(�DFTt,c=1 for t=1 to z) +…+ CTa=u,b=q,d=1*(�DFTt,c=q for t=1 to z)
o Direct with hybrid inv • Normal transportation cost = CTa=u,b=1,d=1*[[(�PSt,n,,c=1 for t=1 to z)
+ (�DSt,n,c=1 for t=1 to z) + (�ESt,n,c=1 for t=1 to z)] +…+ CTa=u,b=q,d=1*[(�PSt,n,,c=q for t=1 to z) + (�DSt,n,c=q for t=1 to z) + (�ESt,n,c=q for t=1 to z)]]
o Direct with inv at customer • Normal transportation cost = CTa=u,b=1,d=1*(�SFTt,c=1 for t=1 to z)
+…+ CTa=u,b=q,d=1*(�SFTt,c=q for t=1 to z)] o Milkrun with inventory at finishing
• Normal transportation cost = CTa=u,b=1-->q,d=2*(�DFTt,c=m for t=1 to z)
o Milkrun with inventory at customer • Normal transportation cost = CTa=u,b=1-->q,d=2*(�SFTt,c=m for t=1 to
z) • Warehousing
o Normal costs • Baseline
• Normal warehousing cost = (LO+LI)*(�SFTt,c=m for t=1 to z) + LI*[(�DFTt,c=1 for t=1 to z) +…+ (�DFTt,c=q for t=1 to z)]
• Direct with inv at finishing • Normal warehousing cost = (LO+LI)*[(�DFTt,c=1 for t=1
to z) +…+ (�DFTt,c=q for t=1 to z)] • Direct with hybrid inv
• Normal warehousing cost = (LO+LI)*[[(�PSt,n,,c=1 for t=1 to z) + (�DSt,n,c=1 for t=1 to z) + (�ESt,n,c=1 for t=1 to z)] +…+ [(�PSt,n,,c=q for t=1 to z) + (�DSt,n,c=q for t=1 to z) + (�ESt,n,c=q for t=1 to z)]]
• Direct with inv at customer • Normal warehousing cost = (LO+LI)*(�SFTt,c=1 for t=1 to
z) +…+ (�SFTt,c=q for t=1 to z)] • Milkrun with inventory at finishing
• Normal warehousing cost = LO*(�DFTt,c=m for t=1 to z) + LI*[(�DFTt,c=1 for t=1 to z) +…+ (�DFTt,c=q for t=1 to z)]
• Milkrun with inventory at customer • Normal warehousing cost = LO*(�SFTt,c=m for t=1 to
z)+LI*[(�SFTt,c=1 for t=1 to z) +…+ (�SFTt,c=q for t=1 to z)]
o Additional storage capacity costs • Direct with inventory at finishing – DENSE STORAGE
• IRu = Inventory required at upstream operation {partial trucks} = max(�IUPt,n,c for t = 1 to z)
101

• AIRu = Additional inventory required at upstream operation{partial trucks} = IRu – Ju
• APRu = Additional pallet positions required {pallets} = AIRu*((�Tn for n=1 to x) / x)
• Additional storage capacity cost = APRu*HDS • Direct with hybrid inventory – DENSE STORAGE
• IRu = Inventory required at upstream operation {partial trucks} = max(�IUMt,n for t = 1 to z)
• IRu = Additional inventory required at upstream operation{partial trucks} = IRu – Ju
• APRu = Additional pallet positions required {pallets} = AIRu*((�Tn for n=1 to x) / x)
• Additional storage capacity cost {$} = APRu*HDS • Direct with inventory at customer - EXPANSION
• IRc = Inventory required at customer c {partial trucks} = max(�IDTt,n,c for t = 1 to z)
• AIRc = Additional inventory required at customer c {partial trucks} = IRc – Jc
• ASRc = Additional space required {ft^2} = AIRc*((�rTn for n=1 to x) / x)
• One-time building cost {$) = ASRc * BMC • Additional storage capacity cost = One-time building
cost*(1+ TROC) • Direct with inventory at customer – HOLD IN TRAILERS
• IRc = Inventory required at customer c {partial trucks} = max(�IDTt,n,c for t = 1 to z)
• AIRc = Additional inventory required at customer c {partial trucks} = IRc – Jc
• Additional trucking cost {$} = (Leasing fee+Fuel costs)*AIRc*360
• Milkrun with inventory at finishing – DENSE STORAGE • IRu = Inventory required at upstream operation {partial
trucks} = max(�IUPt,n,c=m for t = 1 to z) • IRu = Additional inventory required at upstream
operation{partial trucks} = IRu – Ju
• APRu = Additional pallet positions required {pallets} = AIRu*((�Tn for n=1 to x) / x)
• Additional storage capacity cost = APRu*HDS • Milkrun with inventory at customer - EXPANSION
• IRc = Inventory required at customer c {partial trucks} = max(�IDTt,n,c for t = 1 to z)
• AIRc = Additional inventory required at customer c {partial trucks} = IRc – Jc
102

• ASRc = Additional space required {ft^2} = AIRc*((�rTn
for n=1 to x) / x) • One-time building cost {$) = ASRc * BMC • Additional storage capacity cost = One-time building
cost*(1+ TROC) • Milkrun with inventory at customer – MORE TRUCKS
• IRc = Inventory required at customer c {partial trucks} = max(�IDTt,n,c for t = 1 to z)
• AIRc = Additional inventory required at customer c {partial trucks} = IRc – Jc
• Additional trucking cost {$} = (Leasing fee+Fuel costs)*AIRc*360
• Inventory o Financial information
• mP = Average sales price for all items {$/ft} = (�Pn for n=1 to x) /x • NPn = Net sales price {$/ft} = Pn - V
o Inventory calculation • Baseline
• Baseline Inventoryt = IUTt,n,c=m + IMMt,n,c + IDMt,n
• Avg Baseline Inventory = (�Baseline Inventoryt,n for n=1 to x; for t= 1 to z)/z
• Inventory cost = h*NPn*Avg Baseline Inventory • Direct with inventory at finishing
• Direct with finishing inventory = IUPt,n + IDMt,n
• Avg Direct with finishing inventory = (�Direct with inv at finishing t,n for n=1 to x; for t= 1 to z)/z
• Inventory cost = h*NPn* Avg Direct with finishing inventory
• Direct with hybrid inventory • Direct with hybrid inv = IUMt,n,c + IDMt,n,c=1
• Avg Direct with hybrid inventory = (�Direct with hybrid inventoryt,n for n=1 to x; for t= 1 to z)/z
• Inventory cost = h*NPn* Avg Direct with hybrid inventory • Direct with customer inventory
• Direct with inv at customer = IUTt,n + IDTt,n
• Avg Direct with customer inventory = (�Direct with customer inventoryt,n for n=1 to x; for t= 1 to z)/z
• Inventory cost = h*NPn* Avg Direct with customer inventory
• Milkrun with inventory upstream • Milkrun with finishing inventory = IUPt,n,c=m + IDPt,n
• Avg Milkrun with finishing inventory = (�Milkrun with finishing inventoryt,n for n=1 to x; for t= 1 to z)/z
103

• Inventory cost = h*NPn* Avg Milkrun with finishing inventory
• Milkrun with inventory downstream • Milkrun with customer inventory = IUTt,n,c=m + IDTt,n
• Avg Milkrun with customer inventory = (�Milkrun with customer inventoryt,n for n=1 to x; for t= 1 to z)/z
• Inventory cost = h*NPn* Avg Milkrun with customer inventory
A.7 Project valuation data
Known Values • K = Cost of capital rate » 9.1% (from Capital Asset Planning Model, or CAPM) • r = Inflation rate » 3.0%
Calculations • FCFproject,year = Free Cash Flows of project = [Transportation Costs + Warehousing
Costs + Inventory Costs]baseline,year - [Transportation Costs + Warehousing Costs + Inventory Costs]project,year
• FCFproject,year+1 = (FCFproject,year – One time costs)*(1+r) • NPVproject=Net Present Value of project =�(FCFproject,year=1 +…+ FCFproject,year=5)/K
104

Appendix B – Business Case
The business case for the hybrid scenario could not be revealed for confidentiality reasons. However, the process of getting to the final business case number is detailed. Symbols are substituted for real numbers and used consistently throughout the analysis.
Income Statement
1
2
3
Balance Sheet
Net Sales
COGS
Gross Profit
Operating Expense
System development & implementation
Transportation
Warehousing
Inventory holding, impact from Kodak VMI
Inventory holding, impact from customer
Systems Maintenance
EBITD
EBIT
Interest Expense
EBT
Taxes
Net Income
CAPX (scanners)
Depreciation
Current Assets
Change in A/R
Change in Inventory --> Kodak VMI
Change in Inventory --> customer
Current Liabilities
Change in A/P
Change in Net Working Capital =
Free Cash Flows (FCF)
NPV @ 9.0%
2004
-X
-.8X
-.2X
Y
-T
-W
-IK
+IC
+M
Y-T-W-IK+IC+M
Y-T-W-IK+IC+M-.2X
Y-T-W-IK+IC+M-.2X-D
Y-T-W-IK+IC+M-.2X-D
.38*( Y-T-W-IK+IC+M-.2X-
D) .62*( Y-T-W-
IK+IC+M-.2X-D)
-S
D
-CIK
+CIC
-CIK+CIC
.62*( Y-T-W-IK+IC+M-.2X-
D)+D-S-CIK+CIC
$NPV of above FCF
2005
-T
-W
-IK
+IC
+M
Y-T-W-IK+IC+M
Y-T-W-IK+IC+M
Y-T-W-IK+IC+M-D
Y-T-W-IK+IC+M-D
.38*( Y-T-W-IK+IC+M-D)
.62*( Y-T-W-IK+IC+M-D)
D
0
.62*( Y-T-W-IK+IC+M-D)+D
2006
-T
-W
-IK
+IC
+M
Y-T-W-IK+IC+M
Y-T-W-IK+IC+M
Y-T-W-IK+IC+M-D
Y-T-W-IK+IC+M-D
.38*( Y-T-W-IK+IC+M-D)
.62*( Y-T-W-IK+IC+M-D)
D
0
.62*( Y-T-W-IK+IC+M-D)+D
2007
-T
-W
-IK
+IC
+M
Y-T-W-IK+IC+M
Y-T-W-IK+IC+M
Y-T-W-IK+IC+M-D
Y-T-W-IK+IC+M-D
.38*( Y-T-W-IK+IC+M-D)
.62*( Y-T-W-IK+IC+M-D)
D
0
.62*( Y-T-W-IK+IC+M-D)+D
2008 Assumptions
One time reduction in sales = Purchasing customer inventory costs = -volume*price/volume*# days
Constant 80% of sales, calculated
Calculated
Benchmarked from prior implementation
-T From operational model, current logistics lane rates
-W From operational model, assumed pick and pull rate
-IK Inventory carrying rate = 30%
+IC
Purchasing customer inventory holding costs @ 30% rate = X*price/volume*#days*0.3
+M Benchmarked from prior implementation
Y-T-W-IK+IC+M Calculated
Y-T-W-IK+IC+M Calculated
Y-T-W-IK+IC+M-D
No effect
Y-T-W-IK+IC+M-D Calculated
.38*( Y-T-W-IK+IC+M-D) Tax rate = 38%, calculated
.62*( Y-T-W-IK+IC+M-D) Calculated
Scanner Costs = -S/N per customer for N customers
D Assume 5 year straight line depreciation
Revenue reduction by transferring customers from traditional distribution to direct VMI replenishment
Purchasing customer inventory costs = 4000000*0.07*1.5
0
Change in NWC = Change in Current Assets - Change in Current Liabilities = Change in A/R + Change in Inventory Change in A/P
.62*( Y-T-W-IK+IC+M-D)+D
FCF= Net Income + Depreciation - CAPX - Change in NWC
Cost of capital = 9%, nominal calculation
Sensitivity (NPV=0)
Z1
Z2
Z3
Z4
Cannot reduce NPV to 0
105

Bibliography
Adner, Ron and Daniel Levinthal. “The Emergence of Emerging Technologies.” California Management Review. Fall 2002, 45(1), pp. 50-66.
Adner, Ron and Daniel Levinthal. “Technology speciation and the path of emerging technologies” in Wharton on Emerging Technologies. G. Day and P. Schoemaker (eds.) John Wiley Press: New York, 2000.
Adner, Ron and Peter Zemsky. “Strategy Dynamics through a Demand-Based Lens: The evolution of market boundaries, resource rents, and competitive positions.” Working Paper. Dec. 2002.
Amit, R. and P.J. Schoemaker. “Strategic assets and organizational rent,” Strategic Management Journal, 14, 1993: pp. 33-46.
Aviv, Yossi. “The Effect of Collaborative Forecasting on Supply Chain Performance”. Management Science, Vol. 47, No. 10, October 2001, pp. 1326-1343.
Aviv, Yossi. “Gaining Benefits from Joint Forecasting and Replenishment Processes: The Case of Auto-Correlated Demand.” Manufacturing & Service Operations Management, Vol. 4, No. 1, Winter 2002, pp. 55-74.
Austin, James E.: The Collaboration Challenge: How Nonprofits and Businesses Succeed through Strategic Alliances. San Francisco: Jossey-Bass Publishers, c2000.
Barney, J. B. “Firm resources and sustained competitive advantage.” Journal of Management, 17(1), 1991, pp. 99-122.
Barney, J. B. “The resource-based theory of the firm.” Organization Science, 7(5), 1996, pp. 469.
Barney, J. B. “Is the resource-based "view" a useful perspective for strategic management research? Yes.” Academy of Management Review, 26(1) , 2001, pp. 41- 56.
Bergquist, William and Juli Betwee, David Meuel. Building Strategic Relationships: How to Extend your Organization’s Reach Through Partnerships, Alliances, and Joint Ventures. San Francisco: Jossey-Bass, 1995.
Beinhocker, Eric D. “On the origin of strategies.” McKinsey Quarterly, 1999 No. 4.
Beinhocker, Eric D. “Robust adaptive strategies.” Sloan Management Review, Spring 1999, pp. 95–106.
Beinhocker, Eric D. “Strategy at the edge of chaos.” McKinsey Quarterly, 1997 No. 1.
106

Bowers, Brian, Lou Rassey, and Eric White. Capstone presentation. Operations Strategy class. Massachusetts Institute of Technology, Spring 2003.
Bravo, Michael H. “Achieving Supplier Integration through Implementation of Supplier Managed Inventory Programs.” Thesis. Massachusetts Institute of Technology, 1999.
Burstein, Daniel. A Machiavellian Strategy for Dealing with Japan: Turning the Tables. New York: Simon & Schuster, 1993.
Cachon, Gerard P. and Marshall Fisher. “Supply Chain Inventory Management and the Value of Shared Information.” Management Science, Vol. 46, No. 8, August 2000, pp. 1032-1048.
Calenbuhr, Vera. “What can we learn from biological networks?” The Dynamics of Japanese Organizations. Ed. Frank-Jurgen Richter. New York: Routledge, 1996.
Campbell, Ann and Lloyd Clarke, Anton Kleywegt, Martin Savelsbergh. “An Inventory Routing Problem.” Atlanta, GA: Georgia Institute of Technology, 1999.
Cattani, Gino. “Technological change, internal speciation and dynamic capabilities. Evidence from Corning Inc.” Wharton Technology Mini-Conference, 2001.
Chen, Fangruo. “Information Sharing and Supply Chain Coordination.” New York: Columbia Business School. Decision, Risk & Operations Working Paper, January 2002.
Chen, Zrezner, Ryan, and Simchi-Levi. “Quantifying the Bullwhip Effect in a Simple Supply Chain: The Impact of Forecasting, Lead Times, and Information.” Management Science, Vol. 46, No. 3, March 2000, pp. 436-443.
Chapman, Earl. Lean Enterprise Simulation presentation. Rochester, NY: Eastman Kodak Co., 2003.
Chapman, Earl and Eric White. Logistics Simulation presentation. Rochester, NY: Eastman Kodak Co., 2003.
Child, John and David Faulkner. Strategies of Co-operation: Managing Alliances, Networks, and Joint Ventures. New York: Oxford University Press, 1998.
Christensen, Clayton M. The Innovator’s Dilemma: When New Technologies Cause Great Firms to Fail. Boston, MA: Harvard Business School, 1997.
Christensen, Clayton M. "The Past and Future of Competitive Advantage." Sloan Management Review, 42, no. 2 (Winter 2001).
Christensen, Clayton and Thomas Craig, Stuart Hart. "The Great Disruption." Foreign Affairs, Vol. 80, no. 2 (March/April 2001).
107

Clarkson, M. B. E. “A stakeholder framework for analyzing and evaluating corporate social performance.” Academy of Management Review, 20(1), 1995, pp. 92- 117.
Clippinger, John Henry III (ed). The Biology of Business: Decoding the Natural Laws of Enterprise. San Francisco: Jossey-Bass Publishers, 1999.
Coase, R. H. “The nature of the firm.” Economica, Vol. 4, 1937, pp. 386-403.
Cohen, Wesley M. and Franco Malerba. “Is the Tendency to Variation a Chief Cause of Progress?” Industrial and Corporate Change, 10(3), 2001, pp. 587-608.
Collis, D.J. and Montgomery, C.A. Competing on resources: Strategy in the 1990s. Harvard Business Review, Jul.-Aug. 1995: pp. 118-128.
Conner, K.R. and Prahalad, C.K. “A resource-based theory of the firm: Knowledge versus opportunism,” Organization Science, 7(5), 1995: pp. 477-501.
Dierickx, I. and K. Cool. “Asset st ock accumulation and sustainability of competitive advantage.” Management Science, 35(12), 1989, pp. 1504-1511.
Dodder, Rebecca and Joseph Sussman. “The Concept of a CLIOS Analysis Illustrated by the Mexico City Case.” Working Paper. Massachusetts Institute of Technology, Engineering Systems Division. ESD-WP-2003-01.07-ESD Internal Symposium. Feb. 2003.
Dodwell Marketing Consultants. Industrial Groupings in Japan: The Anatomy of the “Keiretsu”, 11th edition. Tokyo: Dodwell Marketing Consultants, 1994.
Dosi, G., and R.R. Nelson, S.G. Winter. “Introduction: the nature and dynamics of organizational capabilities.” In G. Dosi , R.R. Nelson, & S.G. Winter (Eds.), The Nature and Dynamics of Organizational Capabilities (pp. 1- 22). Oxford, NY: Oxford University Press, 2000.
Doz, Yves L. and Gary Hamel: Alliance Advantage: The Art of Creating Value through Partnering. Boston: Harvard Business School Press, 1998.
Dyer, Jeffrey. Collaborative Advantage: Winning Through Extended Enterprise Supplier Networks. Oxford, NY: Oxford University Press, 2000.
Dyer, Jeffrey H. and Harbir Singh. “The Relational View: Cooperative Strategy and Sources of Interorganizational Competitive Advantage.” Academy of Management Review, Vol. 23, no. 4, 2000, pp.660-679.
108
Dyer, Jeffrey H. and Kentaro Nobeoka. “Creating and Managing a High-Performance Knowledge-sharing Network: the Toyota Case.” Strategic Management Journal, Vol. 21, 2000, pp.345-367.
Dyer, Jeffrey, and Prashant Kale and Harbir Singh. “How To Make Strategic Alliances Work.” MIT Sloan Management Review, Summer 2001, p. 37-43.
Eisenhardt, K. M. “Agency Theory: An Assessment and Review.” Academy of Management Review, 14(1), 1989, pp. 57- 74.
Eisenhardt, K. M. and J.A. Martin. “Dynamic capabilities: what are they?” Strategic Management Journal, Vol. 21, pp. 1105- 1121.
Ertogral, Kadir and S. David Wu, Laura I. Burke. “Coordination Production and Transportation Scheduling in the Supply Chain.” Bethlehem, PA: Lehigh University, 1998.
Fine, Charles. Clockspeed: Winning Industry Control in the Age of Temporary Advantage. New York: Perseus Books, 1998.
Foster, Richard N. and Sarah Kaplan. Creative Destruction: Why Companies that are Built to Last Underperform the Market - and How to Successfully Transform Them. New York: Currency, 2001.
Frazelle, Edward H. World-Class Warehousing. Atlanta, GA: Logistics Resources International, Inc., 1996.
Fujimoto, Takahiro. The Evolution of a Manufacturing System at Toyota. New York: Oxford University Press, 1999.
Fujimoto, Takahiro and Daniel Arturo Heller. “Recent Trends In Alliance-Enabled Capability Building: Implications For Firm Performance In The Global Auto Indsutry A Dynamic View Of The Ford-Mazda, Renault-Nissan, & Daimlerchrysler-Mitsubishi Cases.” Working Paper. Tokyo University, Japan, 2001.
Gerlach, Michael L.: Alliance Capitalism: The Social Organization of Japanese Business. Berkeley, CA: University of California Press, c1992.
Geus, A. d. The living company. Boston, MA: Harvard Business School Press, 1997a.
Geus, A. d. “The living company.” Harvard Business Review, 75(2), 1997b, pp. 51- 59.
Gibbons, R. “Firms (and Other Relationships).” Working Paper. Cambridge, MA: Massachusetts Institute of Technology, 2000.
109
Gillio, Emanuele. “Lean Principles Applied to a Supply Chain with Demand Uncertainty” Thesis. Massachusetts Institute of Technology, 2001.
Gould, Stephen Jay. The Structure of Evolutionary Theory. Cambridge, MA: Belknap Press of Harvard University Press, 2002.
Gould, Stephen Jay. “Humbled by the Genome's Mysteries.” New York Times. February 19, 2001,
Graves, Stephen C. “A Single-Item Inventory Model for a Non-Stationary Demand Process.” Working Paper. Massachusetts Institute of Technology, 1998.
Gregory, T. Ryan. “The C-Value Enigma.” Thesis. University of Guelph. 2002.
Hammer, Michael. The Agenda: What Every Business Must Do to Dominate the Decade. New York: Random House, 2001.
Hammer, Michael. The Reengineering Revolution. New York: HarperCollins Publishers, Inc., 1995.
Harbison, John R. and Peter Pekar Jr. Smart Alliances: A Practical Guide to Repeatable Success. San Francisco: Jossey-Bass, 1998.
Harbison, John R. and Peter Pekar Jr. “A Practical Guide to Alliance: Leapfrogging the Learning Curve.” Viewpoints; Series on Alliances. Los Angeles: Booz-Allen & Hamilton, Vol. 1.
Harbison, John R. and Peter Pekar Jr, David Moloney, Albert Viscio. “The Allianced Enterprise: Breakout Strategy for the New Millenium.” Viewpoints; Series on Alliances. Los Angeles: Booz-Allen & Hamilton, Vol. 5.
Helling, Jan. “The Philosophy of a Winner: The Toyota Production System and Lean Enterprise Institute Sweden.”
Iansiti, Marco and Roy Levien. “The New Operational Dynamics of Business Ecosystems: Implications for Policy, Operations and Technology Strategy.” Cambridge, MA: Harvard Business School Working Paper, 2002.
International Human Genome Sequencing Consortium. “Initial sequencing and analysis of the human genome.” Nature. Vol. 409, 15 Feb. 2001, p. 860-921.
Jones, Dan and Jim Womack. Seeing the Whole: Mapping the Extended Value Stream. Brookline, Massachusetts, USA: Lean Enterprise Institute, 2002.
Joshi, Yogesh. “Information Visibility and Its Effect on Supply Chain Dynamics.” Thesis. Massachusetts Institute of Technology, 2000.
110

Kelly, Kevin: New Rules for the New Economy: 10 Radical Strategies for a Connected World. New York: Viking, 1998.
Kochan, T. A. Lecture, Organizational Processes class. Massachusetts Institute of Technology. Fall 2001.
Kochan, T. A. and S. A. Rubinstein. “Toward a stakeholder theory of the firm: the Saturn partnership.” Organization Science, 11(4), 2000, pp. 367-386.
Kleywegt, Anton and Vijay Nori, Martin Savelsbergh. “A Computational Approach for the Inventory Routing Problem.” Atlanta, GA: Georgia Institute of Technology, 1998.
Kwasnicki, Witold. Knowledge, Innovation and Economy: An Evolutionary Exploration. 2nd Ed. Cheltenham, UK: Edward Elgar Publishing Ltd., 1996.
Kwasnicki, Witold. “Evolutionary models’ comparative analysis: Methodology proposition based on selected neo-schumpeterian models of industrial dynamics.” Working Paper. Wroclaw University, Poland.
Kwasnicki, Witold. “Leaping across the mountains, bounding over the hills: punctualism and gradualism in economic development.” Paper presented at European Meeting on Applied Evolutionary Economics (EMAEE), 7-9 June, 1999, Grenoble, FR.
Laseter, Timothy M.: Balanced Sourcing: Cooperation and Competition in Supplier Relationships. San Francisco: Jossey-Bass Publishers, c1998.
Lee, Taesik. “Complexity Theory in Axiomatic Design.” Thesis defense presentation. Massachusetts Institute of Technology, 2003.
Luehrman, Timothy. “Investment Opportunities as Real Options: Getting Started on the Numbers.” Harvard Business Review, July-August 1998, p.3-14.
Levinthal, D. A. “Surviving Schumpeterian environments: an evolutionary perspective.” Industrial and Corporate Change, Vol. 1, No. 3, 1992, pp. 427-443.
Levinthal, D. A. “Adaptation on rugged landscapes.” Management Science, 43(7), 1997, pp. 934-950.
Levinthal, D. A. “The slow pace of rapid technological change: gradualism and punctuation in technological change.” Industrial and Corporate Change, Vol. 7, No. 2, 1998, pp. 217-247.
Lewis, Jordan D.: The Connected Corporation: How Leading Companies Win through Customer-Supplier Alliances. New York: Free Press, 1995.
111

Li, Jingquan, Michael J. Shaw, Riyaz T. Sikora, Gek Woo Tan, Rachel Yang. “The Effects of Information Sharing Strategies on Supply Chain Performance.” Working Ppaer. Champaign, IL: University of Illinois at Urban-Champaign, 2001.
Makadok, R. “Toward a synthesis of the resource-based and dynamic-capability views of rent creation.” Strategic Journal, 22(5), 2001, pp. 387-401.
Mathews, John A. “Resources, Routines, and Interfirm Relations: Entrepreneurial and Evolutionary Dynamics within an Industrial Market System.” Paper to be presented at DRUID Nelson & Winter conference. Aalborg, Denmark, June 2001.
Mathews, John A. “Competitive dynamics and economic learning: An extended resource-based view.” Industrial and Corporate Change, 12:115-145, 2003.
Miller, William. “Innovation for Business Growth.” Research & Technology Management, Sept./Oct. 2001.
Miller, William and Langdon Morris. 4th Generation R&D: Managing Knowledge, Technology, and Innovation. John Wiley & Sons, 1999.
Mishra, Birendra K. “Demand Forecast Sharing in Supply Chains.” University of Texas at Dallas, May 2001.
Miyashita, Kenichi and David W. Russell. Keiretsu: Inside the Hidden Japanese Conglomerates. New York: McGraw-Hill, Inc., 1994.
Mokyr, J. “Evolutionary phenomena in technological change.” In J. Ziman (ed), Technological Innovation as an Evolutionary Process. New York: Cambridge University Press, 2000.
Monden, Yasuhiro. Toyota Production System: An Integrated Approach To Just-In-Time. 2nd Ed. Norcross, Ga.: Industrial Engineering and Management Press.
Mooney, T. “Worldwide Kodak Operating System Heijunka Standards.” Presentation, Jan. 2003.
Murman et al. Lean Enterprise Value: Insights from MIT’s Lean Aerospace Initiative. New York: Palgrave, 2002.
Nelson, Richard R. and Sidney G. Winter. An Evolutionary Theory of Economic Change. Cambridge, MA: Belknap Press of Harvard University Press, 1982.
Nelson, Richard R. and Sidney G. Winter. “Evolutionary Theorizing in Economics.” Journal of Economic Perspectives, Vol. 16, No. 2, Spring 2002, pp. 23-46.
112
Nicholas, Tom. Lecture for Massachusetts Institute of Technology, 15.912 Technology Strategy class, Spring 2003.
Nishiguchi. Strategic Industrial Sourcing: the Japanese Advantage. New York: Oxford University Press, 1994.
Nishiguchi, Toshihiro and Alexandre Beaudet. “The Toyota Group and the Aisin Fire.” Sloan Management Review, Fall 1998, p. 49-59.
Nonaka, Ikujiro and Hirotaka Takeuchi: The Knowledge-Creating Company: How Japanese Companies Create the Dynamics of Innovation. New York: Oxford University Press, 1995.
Nonaka, Ikujiro and Ryoko Toyama. “A firm as a dialectical being: towards a dynamic theory of a firm.” Industrial and Corporate Change, 11(5), pp. 995-1009.
Numagami, Tsuyoshi, Toshizumi Ohta and Ikujiro Nonaka. “Self-renewal of corporate organizations: Equilibrium, self-sustaining, and self-renewing models” The Dynamics of Japanese Organizations. Ed. Frank-Jurgen Richter. New York: Routledge, 1996.
Ohno, Taiichi. Toyota Production System, Beyond Large-Scale Production. Portland, Oregon: Productivity Press, 1988.
Penrose, E. T. “Biological analogies in the theory of the firm.” The American Economic Review, 42(5), 1952, pp. 804-819.
Penrose, E. T. “The theory of the growth of the firm.” New York: Wiley, 1959.
Penrose, E. T. “The theory of the growth of the firm (3rd ed.)” Oxford, New York: Oxford University Press, 1995.
Perkins, David. “The evolution of adaptive form.” In J. Ziman (ed), Technological Innovation as an Evolutionary Process. Cambridge: Cambridge University Press.
Piepenbrock, Ted. Presentation for Massachusetts Institute of Technology “Leaders For Manufacturing” program Knowledge Review, 2003.
Piepenbrock, Ted and Brian Bowers. Presentation for Massachusetts Institute of Technology “Technology Roadmapping” class, 2002.
Rackham, Neil and Lawrence Friedman, Richard Ruff: Getting Partnering Right: How Market Leaders are Creating Long-Term Competitive Advantage. New York: McGraw-Hill, 1996.
113
Richter, Frank-Jurgen and Yoshiya Teramoto. “Population ecology versus network dynamics: From evolution to co-evolution” The Dynamics of Japanese Organizations. Ed. Frank-Jurgen Richter. New York: Routledge, 1996.
Richter, Frank-Jurgen: Strategic Networks: The Art of Japanese Interfirm Cooperation. New York : International Business Press, 2000.
Sako, Mari. “Supplier Development at Honda, Nissan and Toyota: Comparative Case Studies of Organizational Capability Enhancement.” Cambridge, MA: MIT IMVP Program, 2002.
Sarmiento, Ana Maria and Rakesh Nagi. “A Review of Integrated Analysis of Production-Distribution Systems.” Buffalo, NY: State University of New York at Bufflo, 1999.
Savelsbergh, M.W.P. and M. Sol. “The General Pickup and Delivery Problem.” Atlanta, GA: Georgia Institute of Technology, 1999.
Scholl, Hans J. “Firm Survival: A Theory-Integration Study.” Dissertation: University at Albany / State University of New York. School of Information Science and Policy. April 2002.
Scholl, Hans J. “Firm Survival.” Presentation: 3rd MIT-UAlbany SD Groups Meeting. Oct. 2001.
Segil, Larraine: Intelligent Business Alliances: How to Profit Using Today’s Most Important Strategic Tool. New York: Times Business, 1996.
Simon, Herbert. “Rational decision making in business organizations.” The American Economic Review, 69(4), 1979, pp. 493-513.
Simon, Herbert. “The Architecture of Complexity.” Sciences of the Artificial. Cambridge, MIT Press, pp. 183-216.
Smith, Kevin M. “Implementation Issues of a Supplier-Managed Inventory Program.” Thesis. Massachusetts Institute of Technology, 1993.
Spear, Steven and Kent Bowen. “Decoding the DNA of the Toyota Production System.” Harvard Business Review. Sept.-Oct. 1999, pp. 96-106.
Spear, Steven J. (A) “Building process improvement capacity: Structuring problem solving as skill-building exercises.” Harvard Business School. Working Paper: 02-006. Feb. 2003.
114

Spear, Steven J. (B) “The Essence of Just-in-Time: Imbedding diagnostic tests in work-systems to achieve operational excellence.” Harvard Business School. Working paper: 02-020. July 2002.
Spear, Steven J. (C) “Just-in-Time in practice at Toyota: Rules-in-Use for building self-diagnostic, adaptive work-systems.” Harvard Business School. Working paper: 02-043. Nov. 2002.
Street, Matthew W. “Quick Response Inventory Replenishment for a Photographic Material Supplier.” Thesis. Massachusetts Institute of Technology, 2001.
Sussman, Joseph. “Collected Views On Complexity In Systems.” Working Paper. Massachusetts Institute of Technology, Engineering Systems Division. ESD-WP-2003-01.06-ESD Internal Symposium. May 2002.
Teece, D. J. and G. Pisano, A. Shuen. Dynamic capabilities and strategic management. In G. Dosi , R. R. Nelson, & S. G. Winter (Eds.), The nature and dynamics of organizational capabilities (pp. 334- 362). New York: Oxford University Press, 2000.
Utterback, James M. Mastering the Dynamics of Innovation. Boston: Harvard Business School Press, 1996.
Vincenti, W.G. “Real-world variation-selection in the evolution of technological form: historical examples.” In J. Ziman (ed), Technological Innovation as an Evolutionary Process. Cambridge: Cambridge University Press, 2000.
Voluntary Interindustry Commerce Standards (VICS) Association, Collaborative Planning Forecasting and Replenishment Committee. “Collaborative Planning Forecasting and Replenishment Voluntary Guidelines.” www.cpfr.org
Wernerfelt , B. “A resource-based view of the firm.” Strategic Management Journal, 5(2), 1984, pp. 171-180.
Wheelwright, Steven C. and Kim B. Clark. “Creating Project Plans to Focus Product Development.” Harvard Business Review, March-April 1992, p. 70-82.
Williamson, O. E. “Managerial Discretion and Business Behavior.” The American Economic Review, 53(5), 1963, pp. 1032-1057.
Williamson, O. E. Markets and hierarchies, analysis and antitrust implications: a study in the economics of internal organization. New York: Free Press, 1975.
Womack, James and Daniel Jones, Daniel Roos. The Machine That Changed the World. New York: Harper Perennial, 1991
115

Wong, Esther W. “Reducing Demand Variability by Improving Information and Material Flows.” Thesis. Massachusetts Institute of Technology, 2001.
Ziman, J. (ed) “Evolutionary models for technological change.” Technological Innovation as an Evolutionary Process. Cambridge: Cambridge University Press, 2000.
Zollo, Maurizio and Sidney G. Winter. “Deliberate Learning and the Evolution of Dynamic Capabilities.” Organization Science. Vol. 13, No. 3, May–June 2002, pp. 339– 351.
116