Lean, decision making, metrics, and YOU Colorado MGMA September 12, 2014 Owen J. Dahl, MBA, FACHE,...
89
Lean, decision making, metrics, and YOU Colorado MGMA September 12, 2014 Owen J. Dahl, MBA, FACHE, LSSMBB 1
-
Upload
vincent-hood -
Category
Documents
-
view
214 -
download
0
Transcript of Lean, decision making, metrics, and YOU Colorado MGMA September 12, 2014 Owen J. Dahl, MBA, FACHE,...

1
Lean, decision making, metrics,
and YOUColorado MGMA
September 12, 2014
Owen J. Dahl, MBA, FACHE, LSSMBB
2
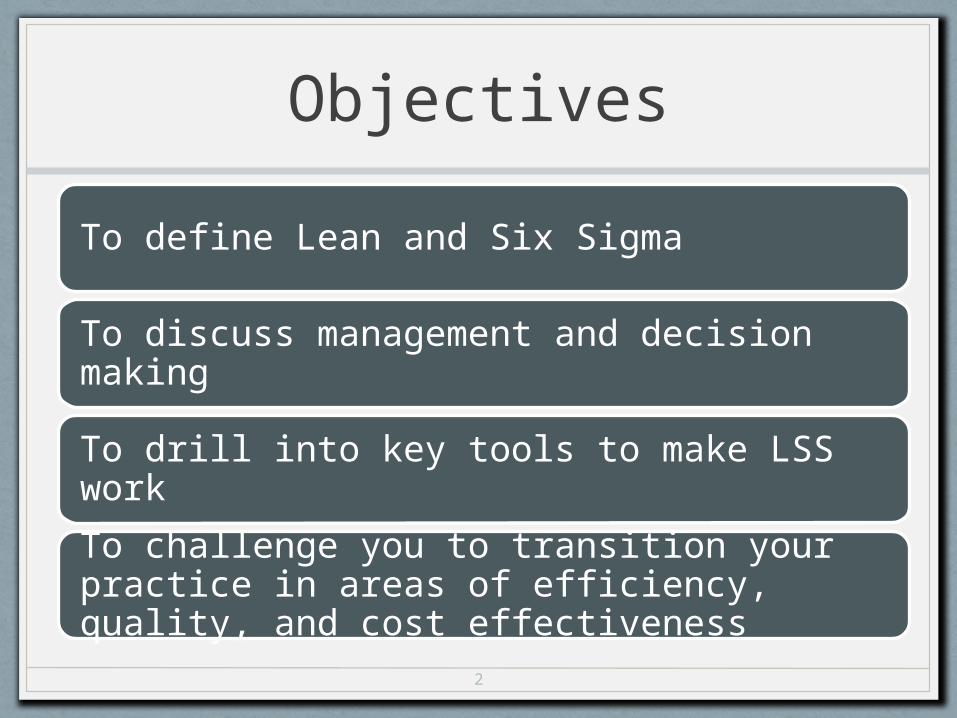
Objectives
To define Lean and Six Sigma
To discuss management and decision making
To drill into key tools to make LSS work
To challenge you to transition your practice in areas of efficiency, quality, and cost effectiveness

3
Management
• Management is the creative and systematic pursuit of practical results, (including the result of more knowledge), by identifying and using available human and knowledge resources in a concerted and reinforcing way.
http://www.pacrimcross.com/kmguidelines/defman.html

4
Leadership
• The organization • Expects the leader to define and express both in writing
and, especially, through behavior the beliefs and values• Needs from a leader a clear statement of its vision and its
strategy• Needs a leader accountable for the design of the business• Needs a leader that sets priorities that are steadfastly
communicated and adhered to in practice• Needs a leader that ensures that the planning at all levels
receives the necessary support• Needs a leader that is accountable for continuous renewal• Needs a leader that never embarrasses followers
— Source: Leadership Jazz by Max DePree
5
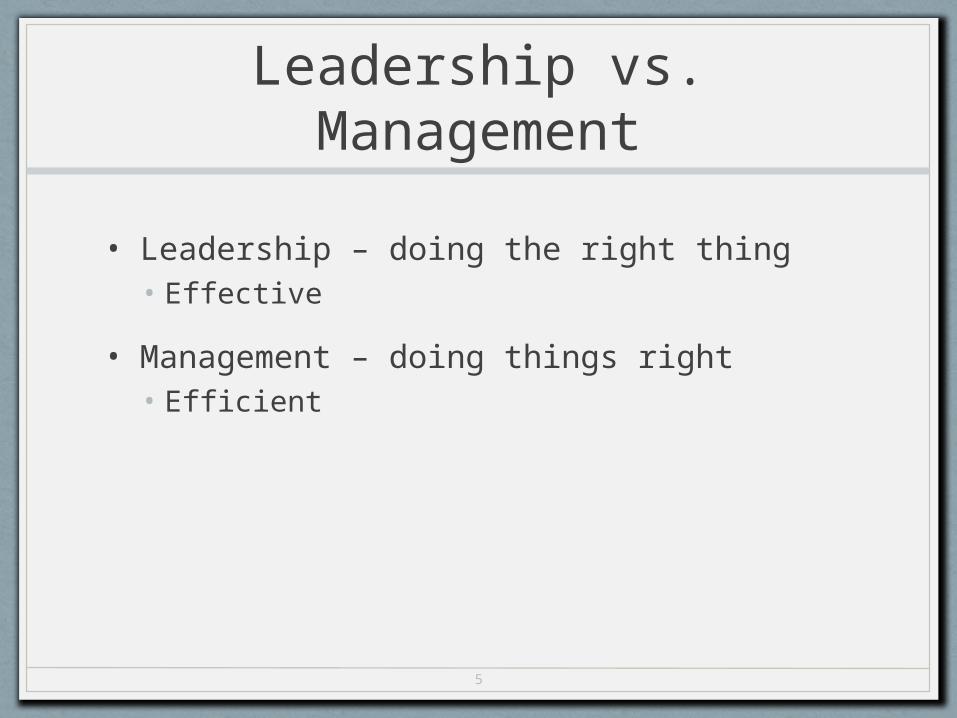
Leadership vs. Management
• Leadership – doing the right thing• Effective
• Management – doing things right• Efficient

6
Decision making - defined
• “describes a process by which a course of action is selected as the way to deal with a specific problem”
Source: Management by Stoner and Wankel

7
As a decision leader
• What are the decisions I need to make?
• What data do I need to make those decisions?
• How are my decisions connected to other people’s decisions?
• What new models are required to make better decisions?
8
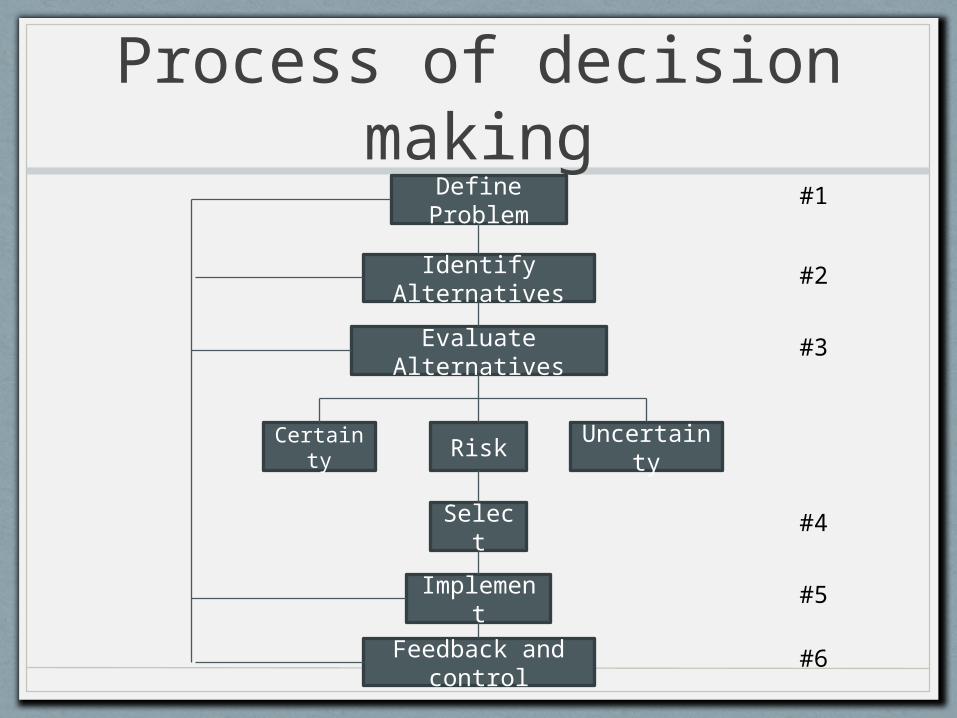
Process of decision making
Define Problem
Identify Alternatives
Evaluate Alternatives
Uncertainty
RiskCertainty
Select
Implement
Feedback and control
#1
#2
#3
#4
#5
#6

9
Types of decisions
Decision Problem Procedures ExamplesProgrammed Repetitive,
routineRules, standard operating procedure (SOP), policies
Processing payroll, preparing patient for surgery
Non-programmed Complex, novel Create problem solving
Introducing a new product or service, reacting to a regional disease epidemic
10
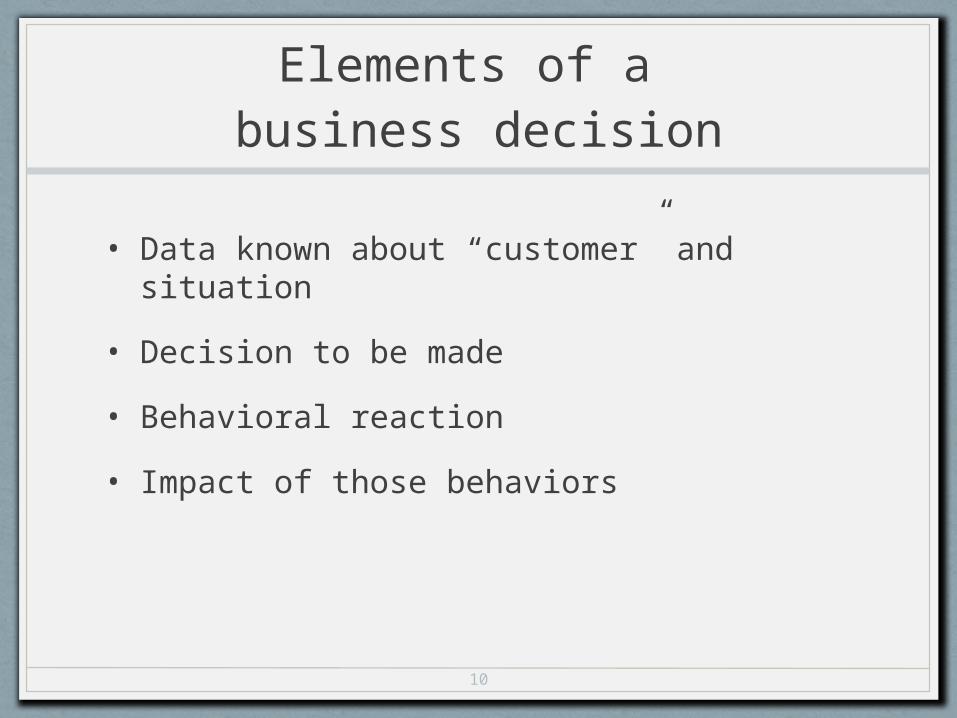
Elements of a business decision
• Data known about “customer” and situation
• Decision to be made
• Behavioral reaction
• Impact of those behaviors

11
For example
Patient
• Test results which point to diagnosis
• The treatment plan
• Patient compliance
• If compliant = “well”
• If non-compliant = readmit, “dinged” for their response
Employee
• Late for work X# times
• Write up
• Arrival times over next days/weeks
• If on time, remove “threat”
• If not, take the next step
12
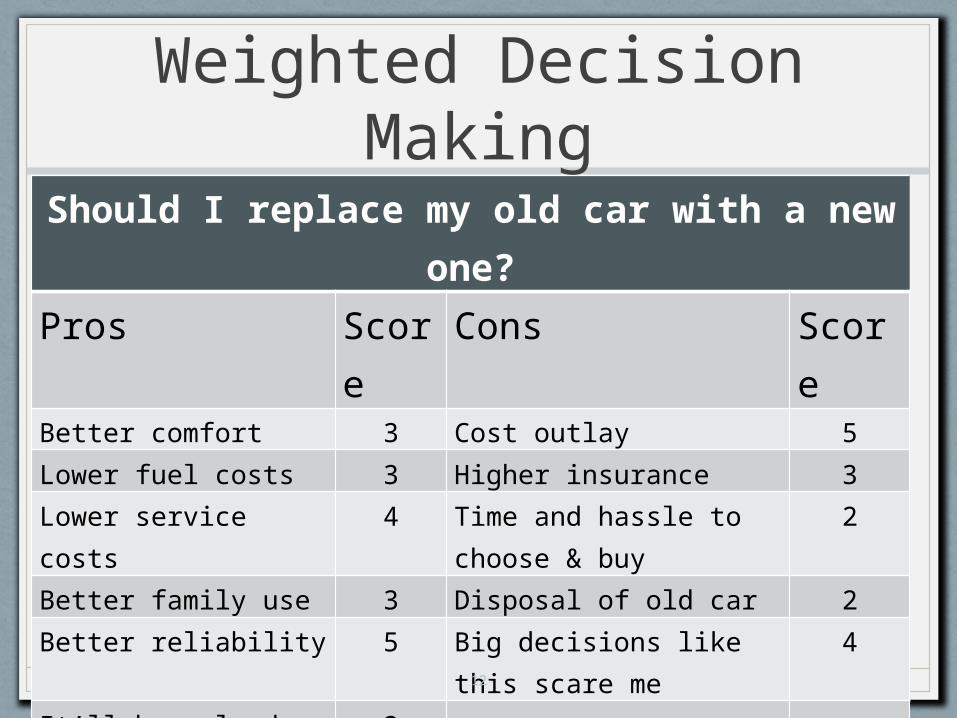
Weighted Decision Making
Should I replace my old car with a new one?Pros Score Cons ScoreBetter comfort 3 Cost outlay 5Lower fuel costs 3 Higher insurance 3Lower service costs 4 Time and hassle to choose &
buy2
Better family use 3 Disposal of old car 2Better reliability 5 Big decisions like this scare
me4
It’ll be a load off my mind 2
Total 6 pros 20 Total 5 cons 16

13
Culture defined . . .
• Culture in its broadest sense is cultivated behavior; that is the totality of a person's learned, accumulated experience which is socially transmitted, or more briefly, behavior through social learning.
• A culture is a way of life of a group of people--the behaviors, beliefs, values, and symbols that they accept, generally without thinking about them, and that are passed along by communication and imitation from one generation to the next.
Source: https://www.tamu.edu/faculty/choudhury/culture.html

14
Culture – 6 components
• Built on the vision – mission of the practice
• Built on the values
• Built on the “practices”
• Built on the people
• Built on the language used
• Built on the placeSource: http://blogs.hbr.org/2013/05/six-components-of-culture/

15
Changing culture occurs first
AT THE TOP
16
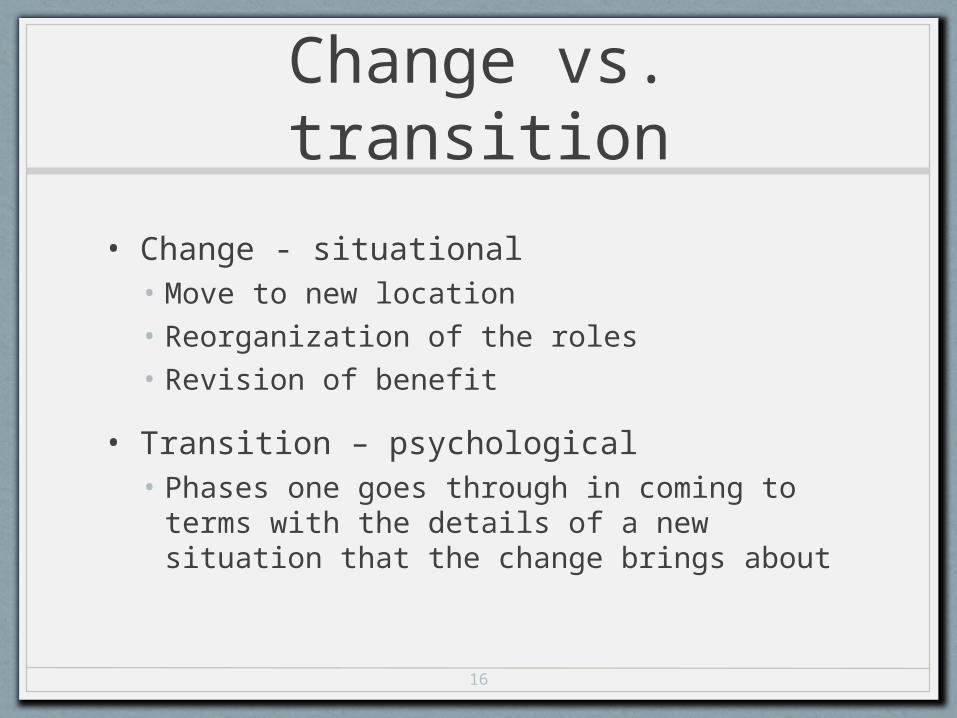
Change vs. transition
• Change - situational• Move to new location• Reorganization of the roles• Revision of benefit
• Transition – psychological• Phases one goes through in coming to terms
with the details of a new situation that the change brings about

17
Basics of Lean
• Definition
“…Practice that considers the expenditure of resources for any goal other than the creation of value for the end customer to be wasteful and thus a target for elimination. In a more basic term, more value with less work.”Source: Wikipedia, 2010

18
What is Six Sigma
• An improvement model designed to reduce the variability that exists within any given process• Eliminate errors and mistakes
• Six Sigma is a metric measured in unacceptable events per million
• 6 σ = 3.4 per million• 5 σ = 233 per million• 4 σ = 6,210 per million• 3 σ = 66,810 per million
• Sigma measures variation rather than averages
• Six Sigma is counter-intuitive in that the process is within control up to a variation of six standard deviations

19
Principles of Lean
• Value – • as defined by the customer & delivered by the producer
• Value Stream – • identify set of actions required to bring the product or service
to the customer
• Flow – • smooth movement
• Pull – • the downstream customer triggers the need
• Perfection – • no defects

20
DOWNTIME ExamplesWaste Observation
Defects Medication error. Wrong patient. Wrong procedure. Missing information. Redraws. Poor clinical outcomes
Overproduction Drawing too many samples. Extra tests.
Waiting Waiting for doctor, procedure, room, test results, lab results
Not using employees abilities
No empowerment. “Check your brains at the door” mentality. Unenlightened management. Poor hiring practices. Low or no investment in training. High turnover
Transportation Moving samples, specimens, patients for testing, patients for treatment or equipment
Inventory Pharmacy stock. Lab supplies. Samples. Specimens waiting analysis. Paperwork in process.
Motion Searching for patients, medications, or charts. Gathering tools. Gathering supplies. Handling paperwork.
Excess processing
Multiple testing. Multiple bed moves. Excessive paperwork. Unnecessary procedures.Source: “A pathway for patients”, Mark L. Dean
QP, February 2014
21
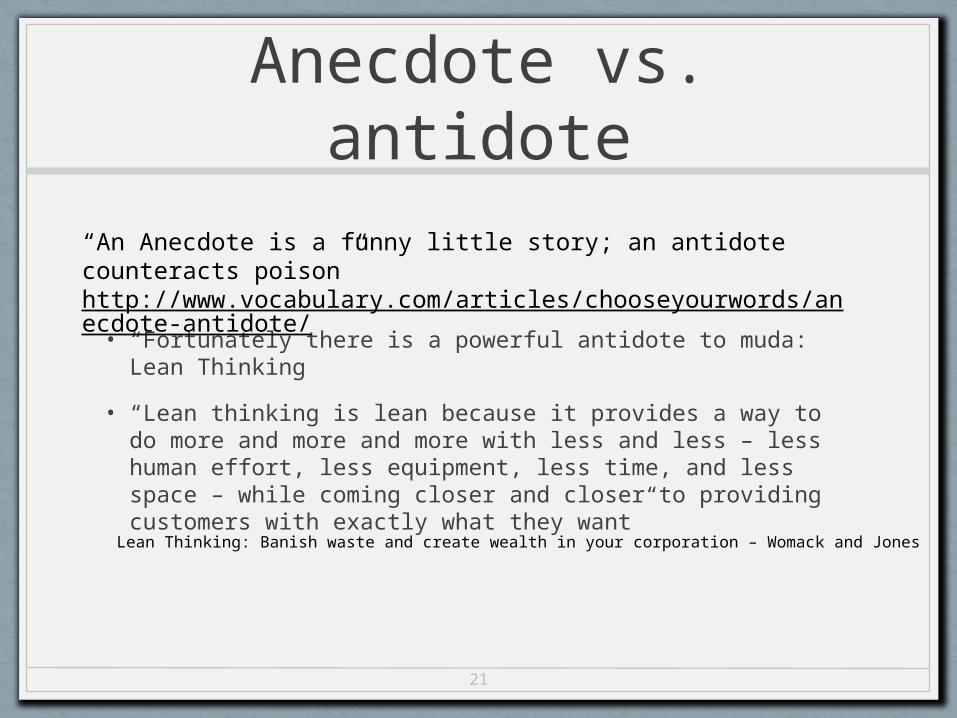
Anecdote vs. antidote
• “Fortunately there is a powerful antidote to muda: Lean Thinking
• “Lean thinking is lean because it provides a way to do more and more and more with less and less – less human effort, less equipment, less time, and less space – while coming closer and closer to providing customers with exactly what they want”
Lean Thinking: Banish waste and create wealth in your corporation – Womack and Jones
“An Anecdote is a funny little story; an antidote counteracts poison”http://www.vocabulary.com/articles/chooseyourwords/anecdote-antidote/
22
Deployment Platforms
Define – Measure – Analyze – Improve – Control
Plan – Do – Study – Act

23
DMAIC
DMAIC
Document, communicate and check for replication and
sustainability
Long-term implementatio
n
Verify results
Develop action plans, implement
improvements
Develop solutions
Determine cause
Define condition
Identify problems Define
Analyze
Measure
Improve
Control

24
Define the Process
Determine to whom the process is focused
• Patients• Payers• Staff
Who are the customers?
• Quality• Speed• Value
List the customers’ requirements
• Map the first and last steps first
Define the process boundaries

25
Measure - Collect the Data
Know ahead of time what data you need vs. what data you can collect
• This is particularly prevalent with cycle time studies
For primary research, create a design for the experiment
• IT support• PMS support
Look for existing studies
• Includes the ‘what’ and ‘where’ and ‘who’
Identify specialists within (and outside of) your organization that may be necessary to assist you
Have a written data collection plan

26
Analyze the Data
Separate useful from fun-to-know data
• Someone within the organization should be able to explain, in understandable language, the reason for every significant variation.
Use analytical tools and statistical methods to conduct the analysis
Look for variability and conduct root-cause analyses to understand the underlying conditions
The key is accountability

27
Approaches to decision making
• Authoritative• Manager makes the decision• Time: to make 5 minutes; explain 30; gain acceptance
30
• Group• Share ideas, agrees on the decision to implement• Time: to make 30 minutes; explain 0; gain acceptance
0
28
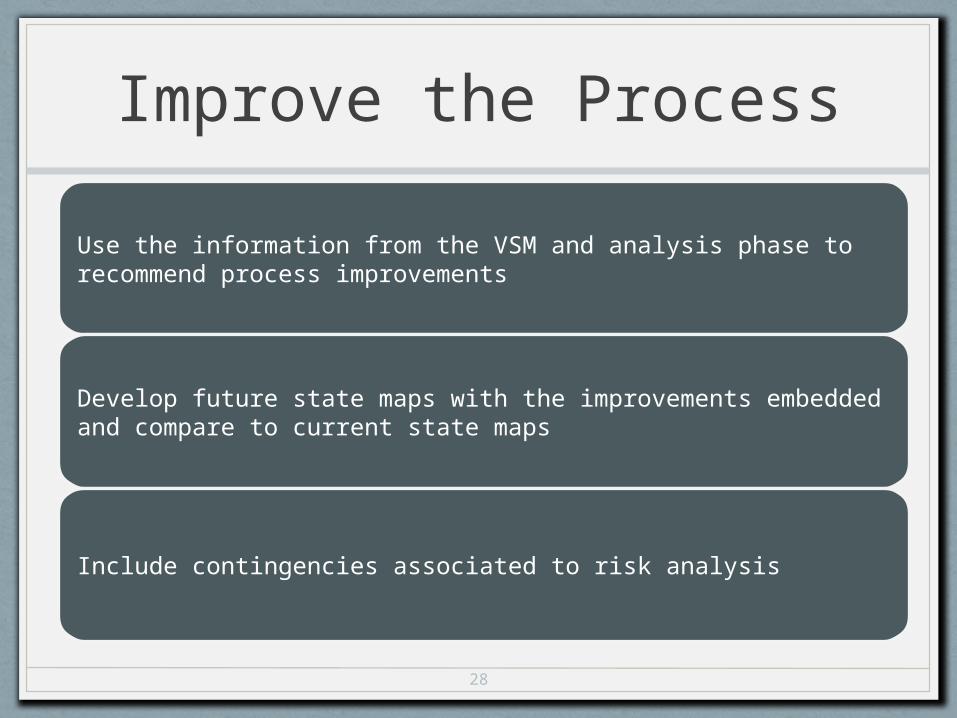
Improve the Process
Use the information from the VSM and analysis phase to recommend process improvements
Develop future state maps with the improvements embedded and compare to current state maps
Include contingencies associated to risk analysis
29
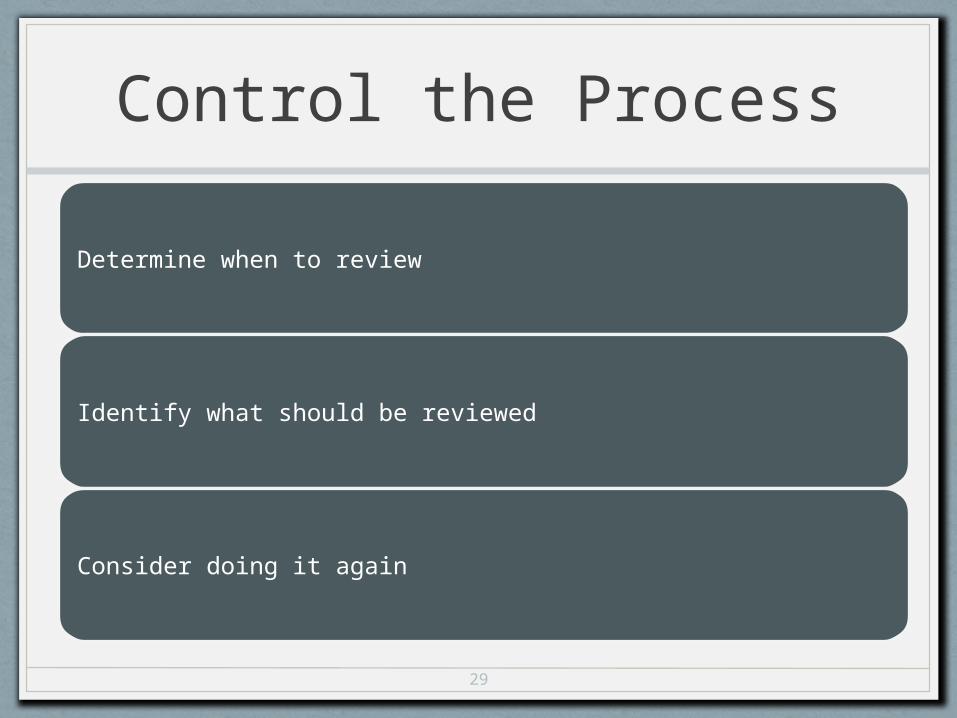
Control the Process
Determine when to review
Identify what should be reviewed
Consider doing it again
30
PDS(C)A – a “lean” deployment platform
• Plan
• Do
• Study (Check)
• Act

31
Plan
• Purpose of the test?
• What change idea are you trying?
• Indicators of success?
• How will data be collected?
• How many subjects tested?
• What is the time frame?
• What do we hypothesize will happen?

32
Do
• Conduct the test
• Document any problems with unintended consequences

33
Study (Check)
• Analyze the data
• Study the results
• Compare the data to your predictions
• Summarize and reflect on what was learned
34
Act
• Refine the change, based on lessons learned from the test
• Prepare a Plan for the next PDSA cycle
35
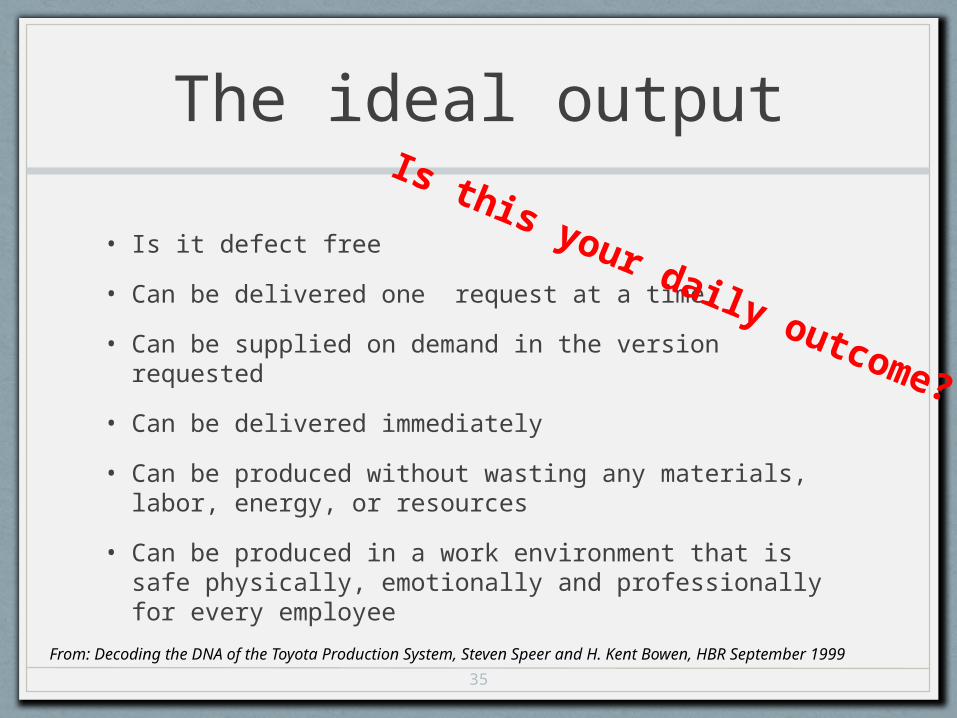
The ideal output
• Is it defect free
• Can be delivered one request at a time
• Can be supplied on demand in the version requested
• Can be delivered immediately
• Can be produced without wasting any materials, labor, energy, or resources
• Can be produced in a work environment that is safe physically, emotionally and professionally for every employee
From: Decoding the DNA of the Toyota Production System, Steven Speer and H. Kent Bowen, HBR September 1999
Is this your daily outcome?

36
What is a project? (Beginning & End)
Any temporary, organized effort that creates a unique product, service, process or plan
Projects bring together people from a wide range of jobs and provides them with the opportunity to collaborate in a unique way

37
Project Management
• Application of specific knowledge, skills, tools, and techniques to project activities
• A discipline that balances• Time, cost, and quality• Expectations• Identified needs• Unidentified needs

38
Project Life Cycle
• Sequential project phases identified to assist in accomplishment of the desired objectives• Phase – logically related activities
• Sequential or overlapping
• Tracked through Project log or Gantt chart

39
Voice of the Customer
• Process used to obtain feedback/requirements from the customer to provide them with the best service quality possible
• Proactive
• Captured through• Interviews• Surveys• Focus groups• Observations• Complaint logs

40
Meet customer expectations
• Service MUST meet customer expectation requirements
• Must understand the customer expectation
V = R - EV = Value (quality)R = ResultsE - Expectations
41
Business Case
• Market demand
• Organizational need
• Customer request
• Technology advance
• Legal requirements
• Ecological need
• Social need

42
Define
• The problem or what are we improving• Scope• Business case• The customer• The sponsor• Current state
• Customer value• What matters• What priorities
• The vision • Future state• Strategy

43
Project selectionStrategic
Plan3 – 5 years
CurrentI year
objectives
VoicesRegulations
Market
Voice of Business
Voice of Customer
Voice of Process
Performing financialanalysis identifies gapsin performance
Identifying gaps in meeting customer needs(critical expectations)
Process analysis linksthe business byprocess v. function and gives perspective
LIST
OF
PROJECTS

44
VA vs. BVA vs. NVA
• Value Add• Any step or activity that transforms the form,
fit, or function of the product or service for which the “customer” is willing to pay
• Business value add• Necessary to support but not directly related
to the customer
• Non-value Add• Waste in the process

45
Define - deliverables
• Completed project charter
• Document – customers affected by the project either current or future
• High level process map
• Completed project plan
• Consensus of team related to the outcomes expected from the project (hypotheses)
46
JUMPING TO CONCLUSIONS
DUCK TAPEBAND-AID FIXES
47
Measure
• Develop a thorough understanding of the current state and collect reliable data on the process itself – time, quality and cost that identify the problem current state
• Need benchmark – baseline (current state)
• Need hypothesis (targeted future state)

Measure – key steps
• Create or validate the current state of the VALUE stream from the initial process map
• Identify outputs, inputs, and process variables relevant to the project
• Create a data collection plan
• Create a data analysis plan
• Use measurement system analysis
• Collect data – establish baseline
• Update value stream map with the data
• Perform process capability evaluation
• Make readily identifiable improvements
48
49
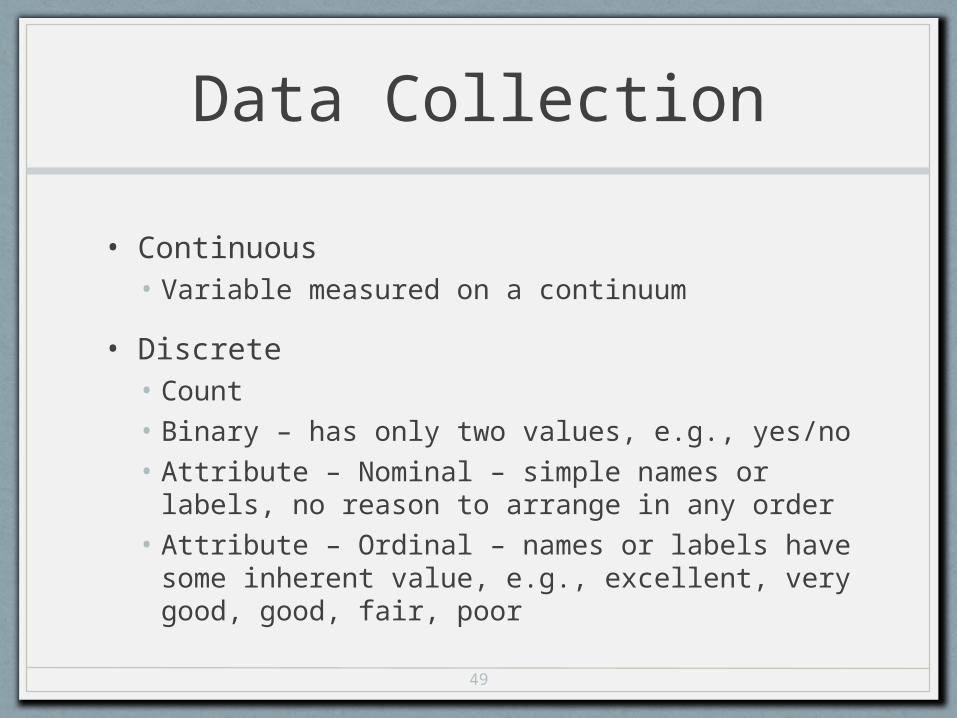
Data Collection
• Continuous• Variable measured on a continuum
• Discrete• Count• Binary – has only two values, e.g., yes/no• Attribute – Nominal – simple names or labels, no
reason to arrange in any order• Attribute – Ordinal – names or labels have some
inherent value, e.g., excellent, very good, good, fair, poor

50
X and Y
• X = process or input measures • Quality, speed, cost of information coming into
the process
• Y =output measures• How well customer needs were met
• GOAL – find the Xs that are leading indicators of the critical output the Ys

Metrics
• Informational• Average number of patients seen per month
• Actionable• Average number of patients seen per month per provider
51

Sampling
• Data from one or more subsets to make decisions about the entire group
• Population – fixed group with definable boundaries, e.g., customers
• Process – sampling from a changing flow of items moving through the business, time factor
52
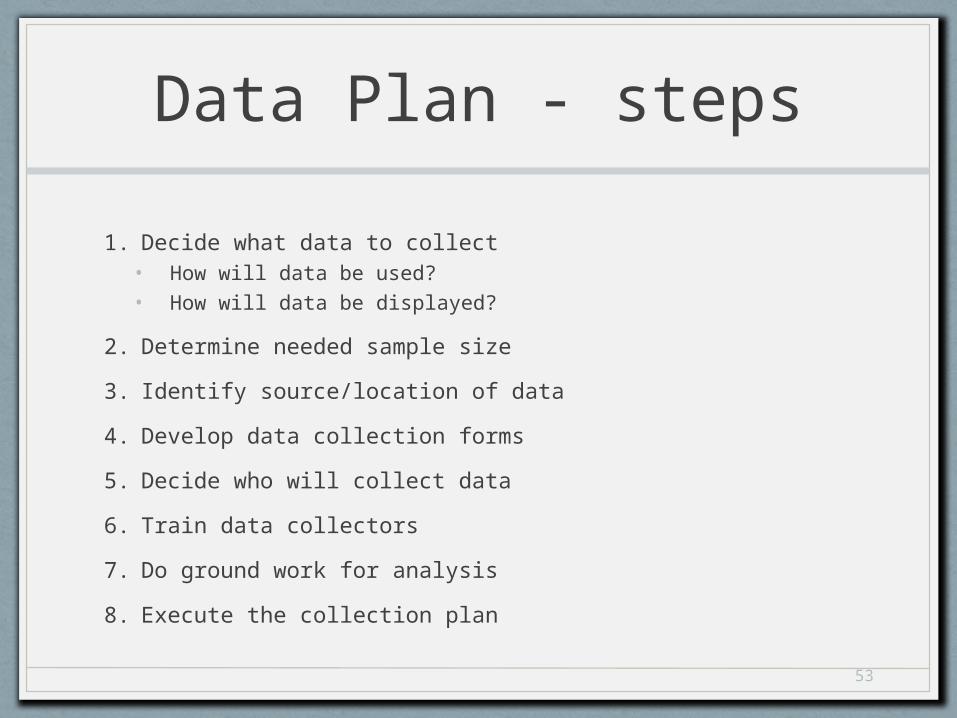
Data Plan - steps
1. Decide what data to collect• How will data be used?• How will data be displayed?
2. Determine needed sample size
3. Identify source/location of data
4. Develop data collection forms
5. Decide who will collect data
6. Train data collectors
7. Do ground work for analysis
8. Execute the collection plan
53

Process map with sub process identified
54
PatientArrives
Pull Chart
Find Chart
Collect Payment
See Provider
Patient Calls
Chart Pulled
Collect Payment
See Provider
Check In
Check In
YesNO
With Provider
Lab or other area
to be filed
Nurses Station
Verify Insurance
TriageTriage Ancillary
Check OutCheck Out
55
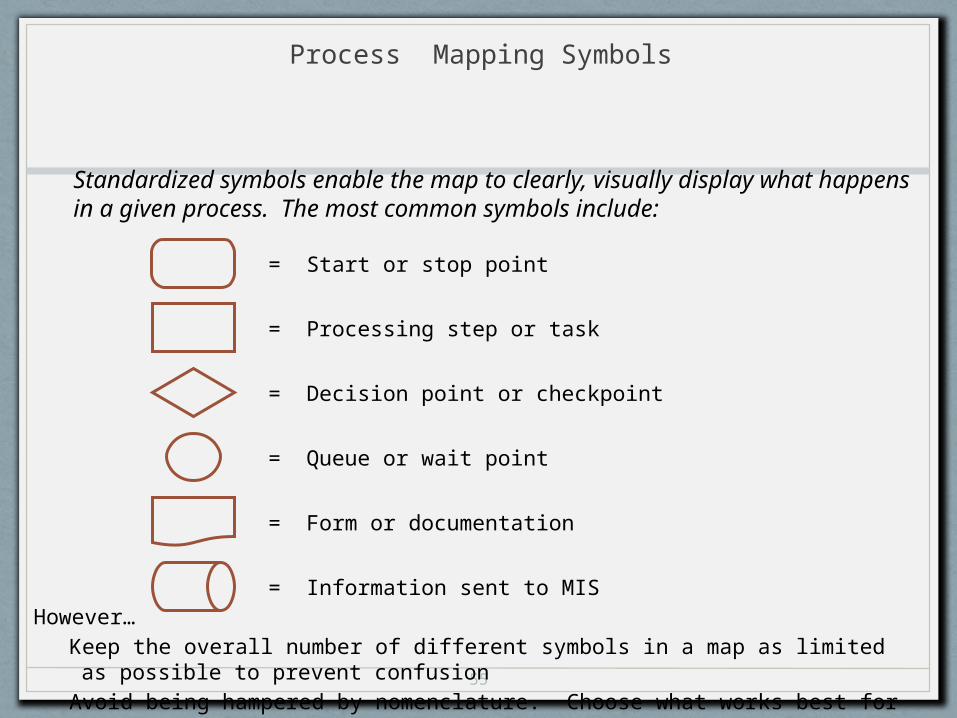
Process Mapping Symbols
Standardized symbols enable the map to clearly, visually display what happens in a given process. The most common symbols include:
However…Keep the overall number of different symbols in a map as limited as possible to prevent confusion
Avoid being hampered by nomenclature. Choose what works best for your institution.
= Processing step or task
= Decision point or checkpoint
= Queue or wait point
= Form or documentation
= Information sent to MIS
= Start or stop point

56
Don’t need high tech approach
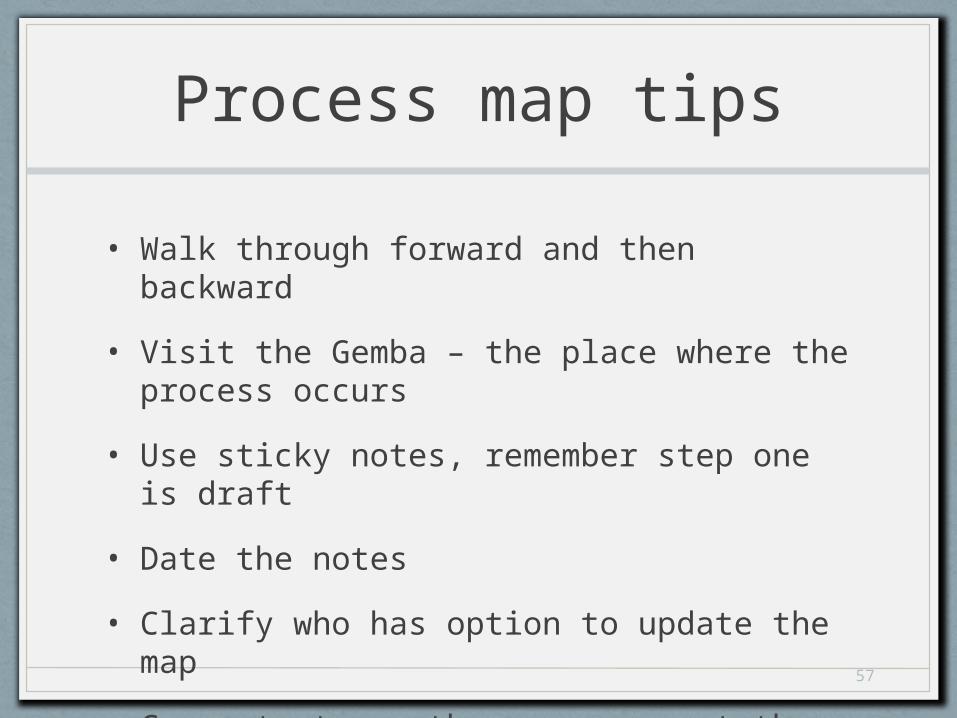
Process map tips
• Walk through forward and then backward
• Visit the Gemba – the place where the process occurs
• Use sticky notes, remember step one is draft
• Date the notes
• Clarify who has option to update the map
• Concentrate on the process, not the tools, metrics 57
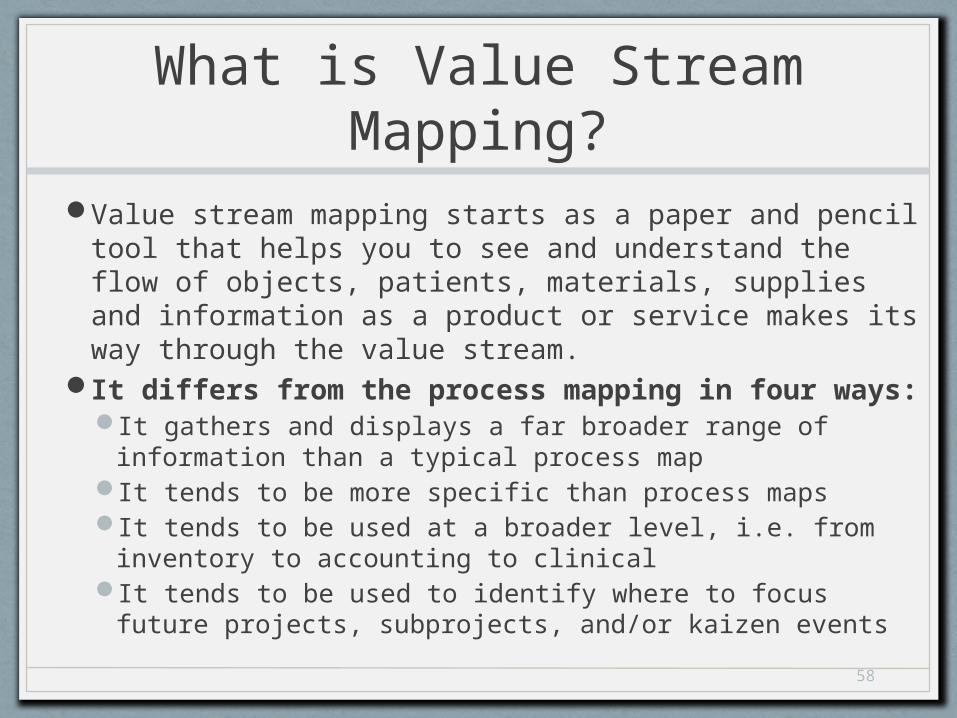
What is Value Stream Mapping?
Value stream mapping starts as a paper and pencil tool that helps you to see and understand the flow of objects, patients, materials, supplies and information as a product or service makes its way through the value stream.
It differs from the process mapping in four ways:It gathers and displays a far broader range of information
than a typical process mapIt tends to be more specific than process mapsIt tends to be used at a broader level, i.e. from inventory
to accounting to clinicalIt tends to be used to identify where to focus future
projects, subprojects, and/or kaizen events58
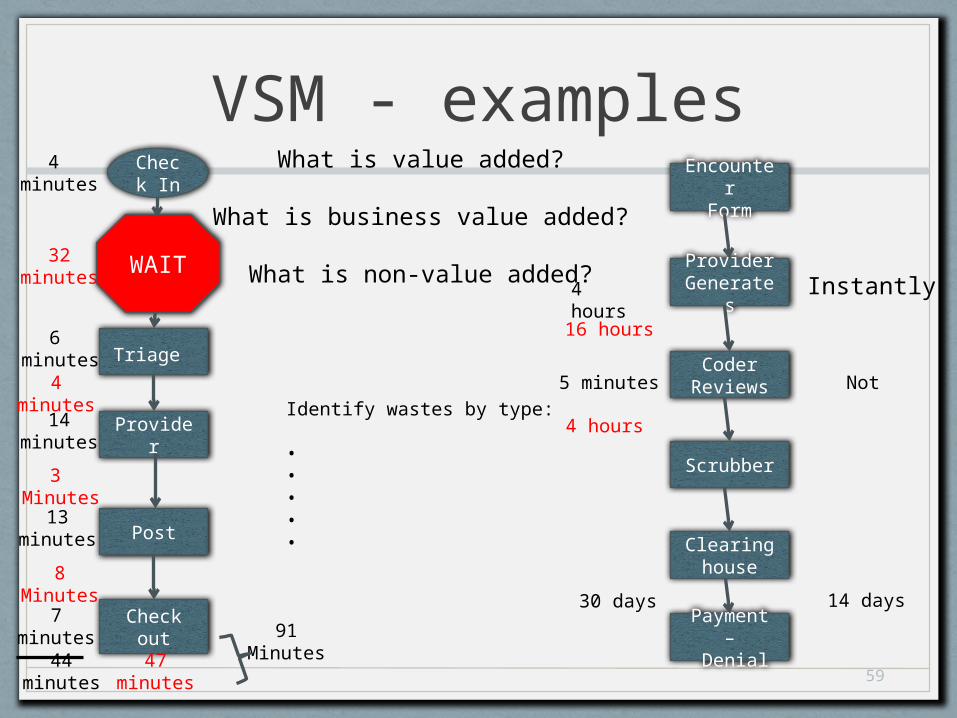
VSM - examples
59
Check out
Post
Provider
Triage
Payment – Denial
Check In
Clearinghouse
Scrubber
Coder Reviews
Provider Generates
EncounterForm
WAIT4 hours Instantly
5 minutes
30 days
Not
14 days
4 minutes
6 minutes
14minutes
13minutes
7minutes
44minutes
4minutes
3 Minutes
8Minutes
32minutes
47minutes
91Minutes
16 hours
4 hours
What is value added?
What is business value added?
What is non-value added?
Identify wastes by type:
• • • • •

Process Cycle Efficiency
• Value Add to total time
Patient in office 60 minutes, sees MA 5 minutes, sees provider 5 minutes
PCE = 10/60 = 16.7%
60

Measure - deliverables
• Fully developed current state value stream map
• Reliable data on inputs (X) and outputs (Y) for analysis of defects, variation, process flow, and speed
• Baseline measures of process capability
• Refined definition of improvement goals
• Capable measurement system
• Revised project charter, if change warranted61

Analyze“Seek to understand”
• Pinpoint and verify causes affecting the key input (X) and output (Y) variables – finding the key (X)
• Understand – common picture• Cause & effect relationships• Optional solutions
• Prioritize – • Issues and opportunities• Plan improvements
62
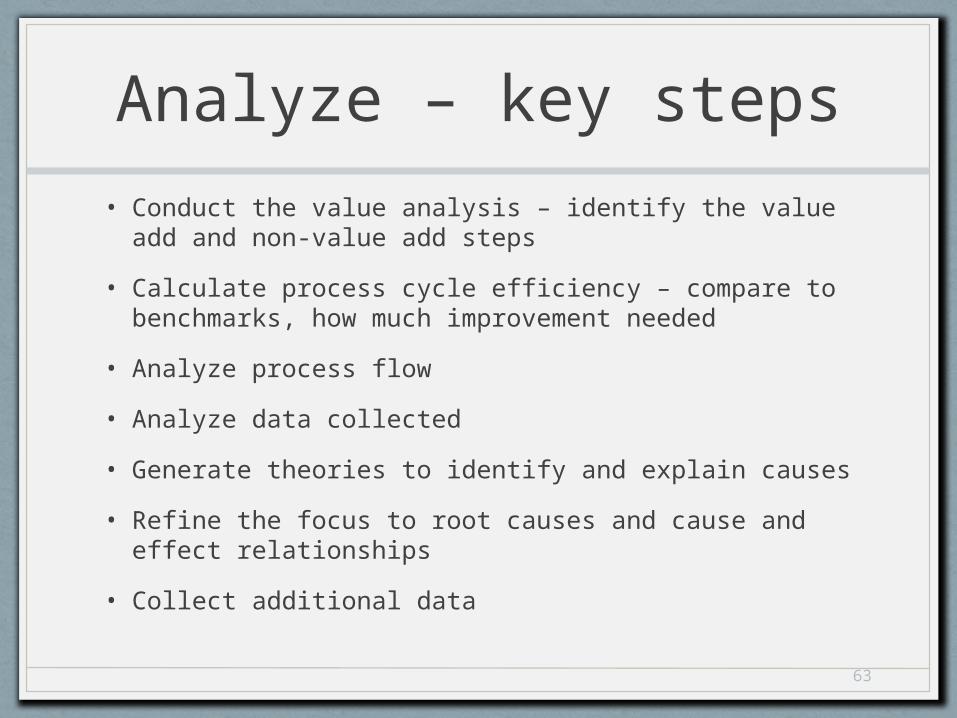
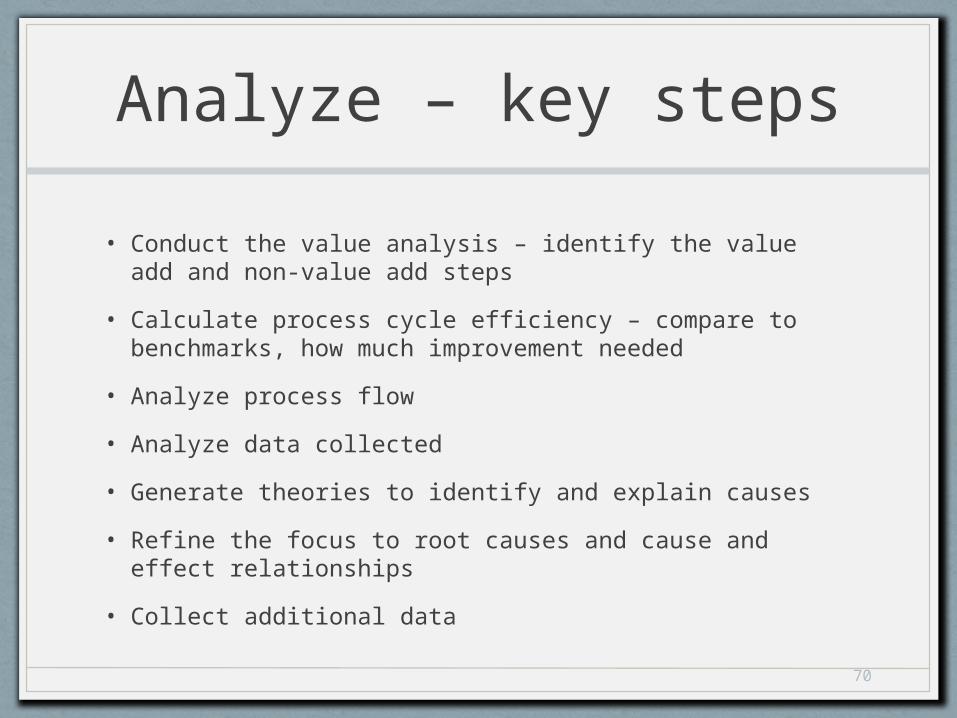
Analyze – key steps
• Conduct the value analysis – identify the value add and non-value add steps
• Calculate process cycle efficiency – compare to benchmarks, how much improvement needed
• Analyze process flow
• Analyze data collected
• Generate theories to identify and explain causes
• Refine the focus to root causes and cause and effect relationships
• Collect additional data
63
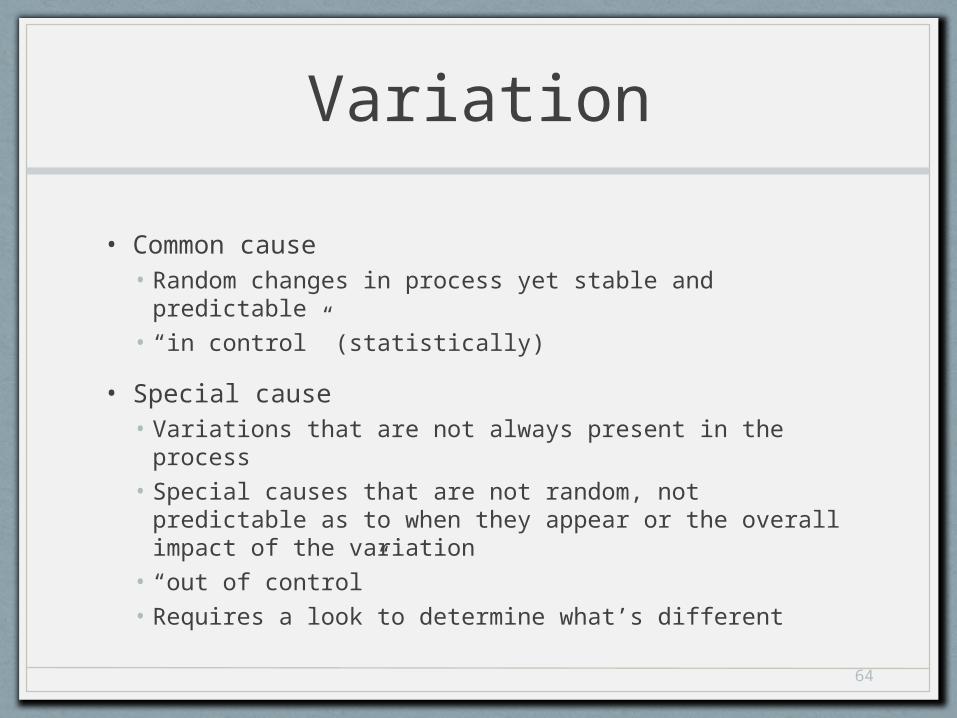
Variation
• Common cause• Random changes in process yet stable and
predictable• “in control” (statistically)
• Special cause• Variations that are not always present in the process• Special causes that are not random, not predictable
as to when they appear or the overall impact of the variation
• “out of control”• Requires a look to determine what’s different
64
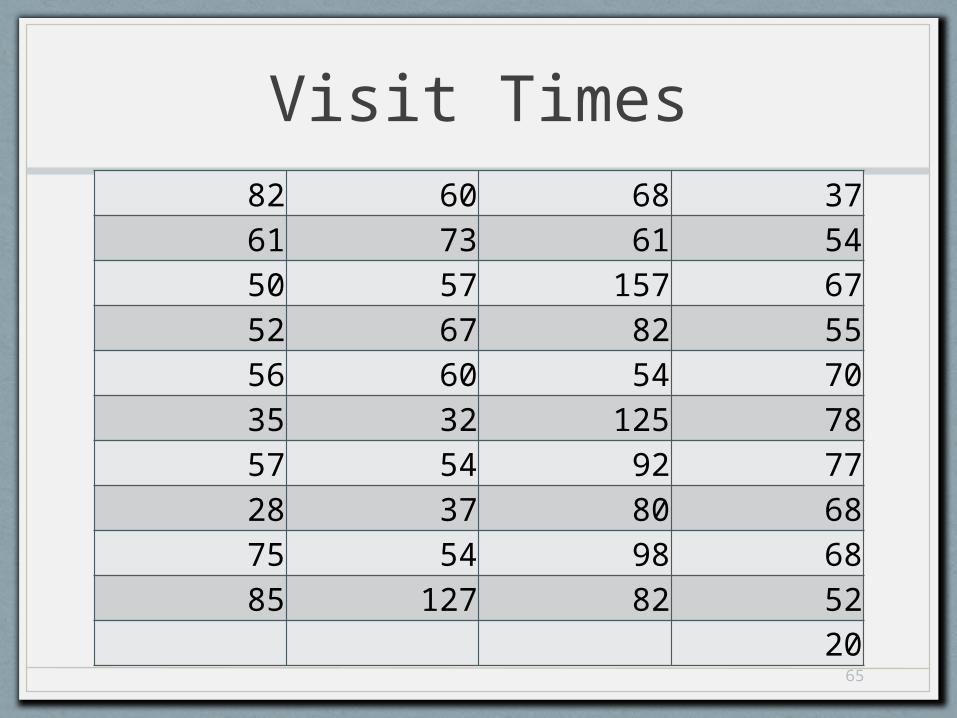
Visit Times82 60 68 3761 73 61 5450 57 157 6752 67 82 5556 60 54 7035 32 125 7857 54 92 7728 37 80 6875 54 98 6885 127 82 52
20
65

Which Measure to Choose?
• Average = 67• Average minus top and bottom 3 = 64.51
• Median = 61
• Mode = 54
• Range = 20 – 157
66

Column Chart
1 2 3 4 5 6 7 8 9 10111213141516171819202122232425262728293031323334353637383940410
20
40
60
80
100
120
140
160
180
Visits
67

Run/Control Chart
A - ne
w C E G I K M O Q S U
W -
new Y A C E G I K M
0
20
40
60
80
100
120
140
160
180
82
61
505256
35
57
75
28
85
6057
73
6067
32
54
37
68
127
61
157
82
54
92
125
80
98
82
54
37
67
55
707877
6868
52
20
Actual timeMedianUCLLCLTarget
Monitor and Set Control Limits3 Sigma above and below mean
10 above12 below45% in range

Takt Time
• Time available
• Services performed
69
Eight hour day 48025 patients to be seen Minutes per patient 19.2 30 minute break -30Time Available 450No break 18.0 Six hour day 360Minutes per patient 14.4
Includes:Prep
In RoomDocumentation
Analyze – key steps
• Conduct the value analysis – identify the value add and non-value add steps
• Calculate process cycle efficiency – compare to benchmarks, how much improvement needed
• Analyze process flow
• Analyze data collected
• Generate theories to identify and explain causes
• Refine the focus to root causes and cause and effect relationships
• Collect additional data
70

Where to get benchmarks
• Externally• Sources available• Ask• Research
• Internally• What is important today?• What was important yesterday?• What are your trends?
71

What are your goals in any benchmarking project?
• Increase• Patient satisfaction• Efficiency• Revenue• Productivity
• Decrease• Cost of doing business• Overhead• Overall cost of care for each patient
• Optimize• As opposed to maximize = seeking quality outcomes
72
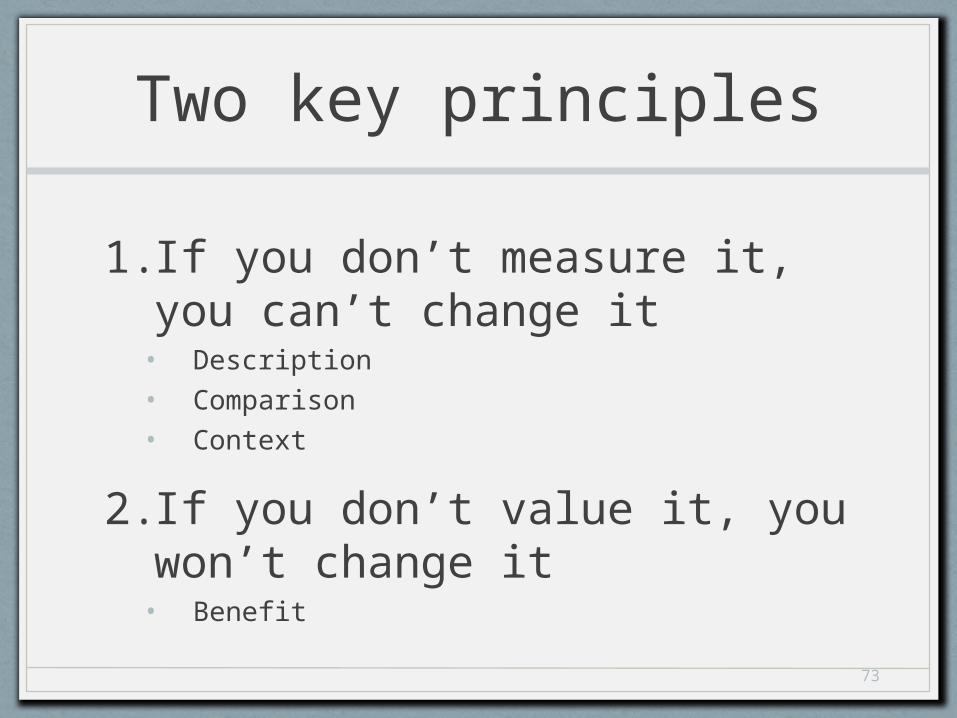
Two key principles
1. If you don’t measure it, you can’t change it
• Description• Comparison• Context
2. If you don’t value it, you won’t change it
• Benefit
73

Cause and Effect
• Purpose• For teams – to push beyond symptoms to
uncover potential root causes• To provide structure to cause identification efforts• To obtain a balanced list of ideas and to insure
major possible causes are not missed
• Use• Cause identification• Cause prevention – surfaces during brainstorming
and may help address future problems
74

Long Wait Time
for New Patient
s
Practice Process
Payers Patients
Patient late (early!)
Elderly
Patients
Unnecessary formsABN
Duplicate
HIPAASchedulingPhone
Triage
Insurance verification
Time of Visit
Pre-authorization
Example – Long Wait Time for New Patients
75

CE Categories
• Manpower (personnel)
• Machines
• Materials
• Methods
• Measurements
• Mother nature (environment)
76
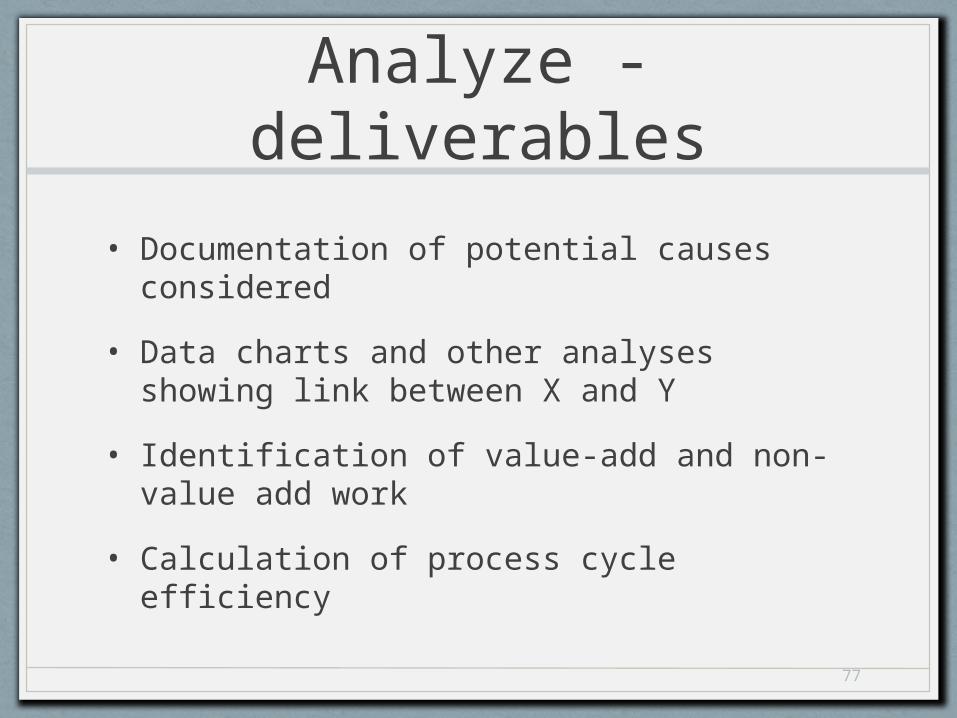
Analyze - deliverables
• Documentation of potential causes considered
• Data charts and other analyses showing link between X and Y
• Identification of value-add and non-value add work
• Calculation of process cycle efficiency
77
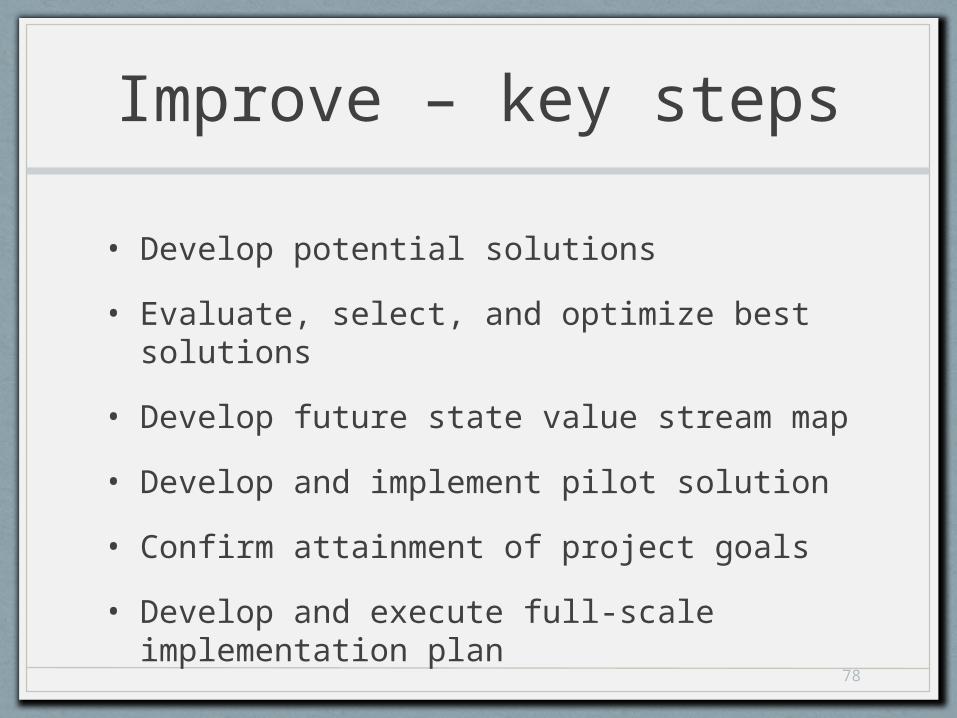
Improve – key steps
• Develop potential solutions
• Evaluate, select, and optimize best solutions
• Develop future state value stream map
• Develop and implement pilot solution
• Confirm attainment of project goals
• Develop and execute full-scale implementation plan
78

Pilot Testing
• To identify practical problems and failures in a chosen solution so those can be addressed before full scale implementation
• Keys• Small scale• Evaluate the solution and the implementation• Step to make full scale implementation more
effective
79

How to pilot
• Plan• What needs to be piloted• Where, who, when, how long
• Review design• Elements complete• All pieces and parts fit together• Identify possible failure points and vulnerability• Review plans
• Finalize design and implement• Do it
• Evaluate the test and verify• Statistical tools for evaluation• Celebrate success• Improve the design
80
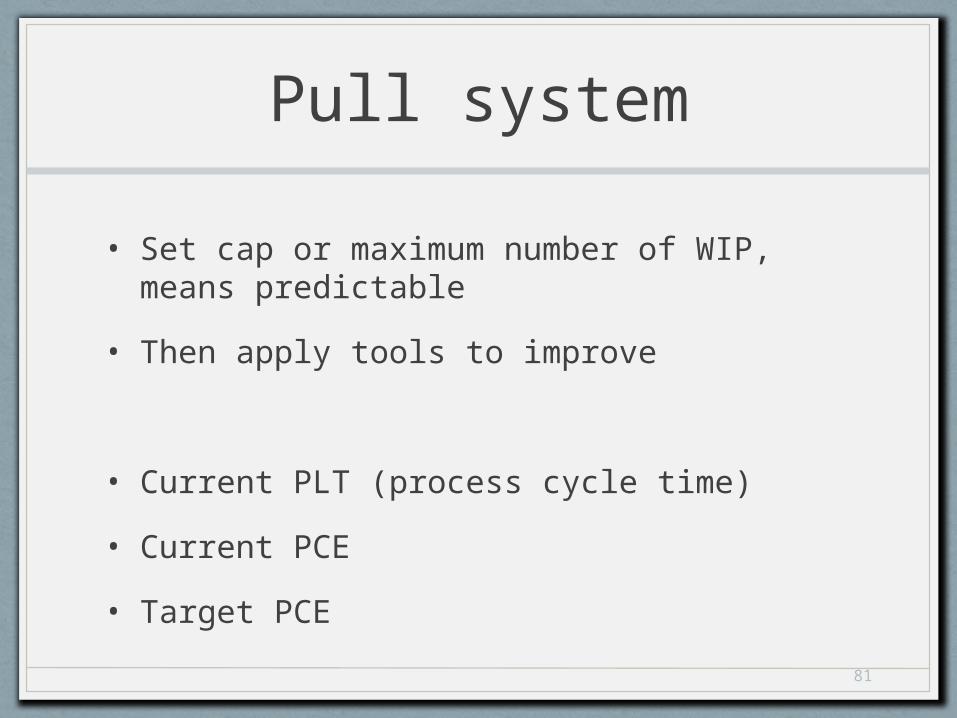
Pull system
• Set cap or maximum number of WIP, means predictable
• Then apply tools to improve
• Current PLT (process cycle time)
• Current PCE
• Target PCE
81

Improve - deliverables
• For Quality Improvement (QI) project – tested, robust solutions that affect the causes of X that impact the critical Y
• For lean project – document the proven best practice or solution applied
• An improved process – stable, predictable AND meets customer expectations!
82
Control
• Complete project work and train, support to the operational team the procedures identified to maintain the gain
83

Control – key steps
• Develop supporting steps of documentation
• Launch company wide implementation
• Secure performance gains
• Monitor implementation
• Develop the process control plans and pass on to those operationally responsible
• Audit the results
• Finalize the project
• Review the process, memorialize for others and the next improvement project
84
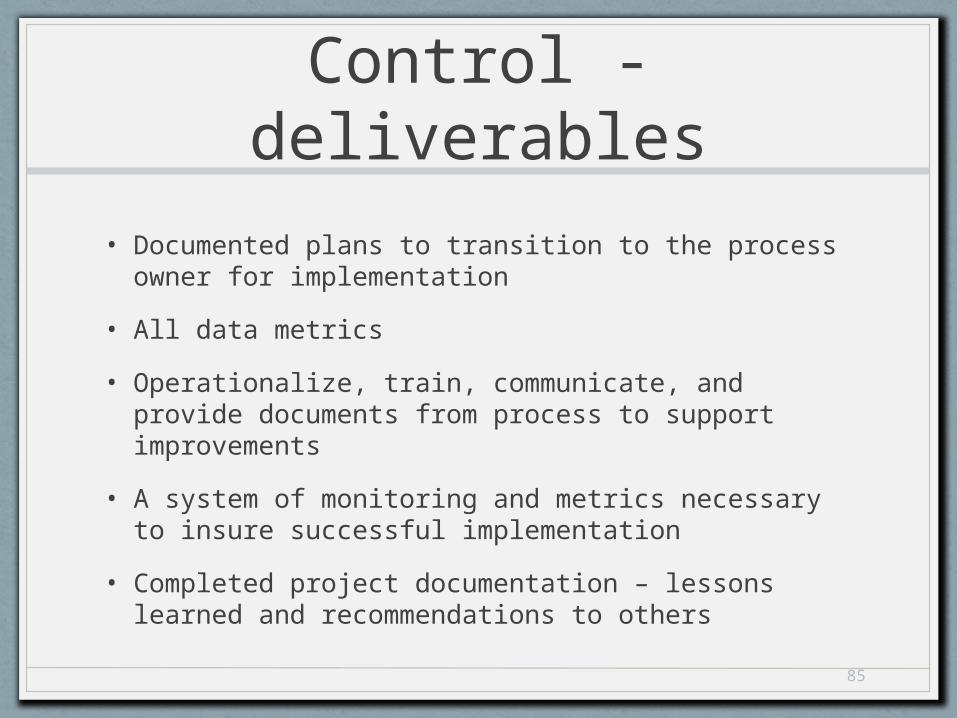
Control - deliverables
• Documented plans to transition to the process owner for implementation
• All data metrics
• Operationalize, train, communicate, and provide documents from process to support improvements
• A system of monitoring and metrics necessary to insure successful implementation
• Completed project documentation – lessons learned and recommendations to others
85
86
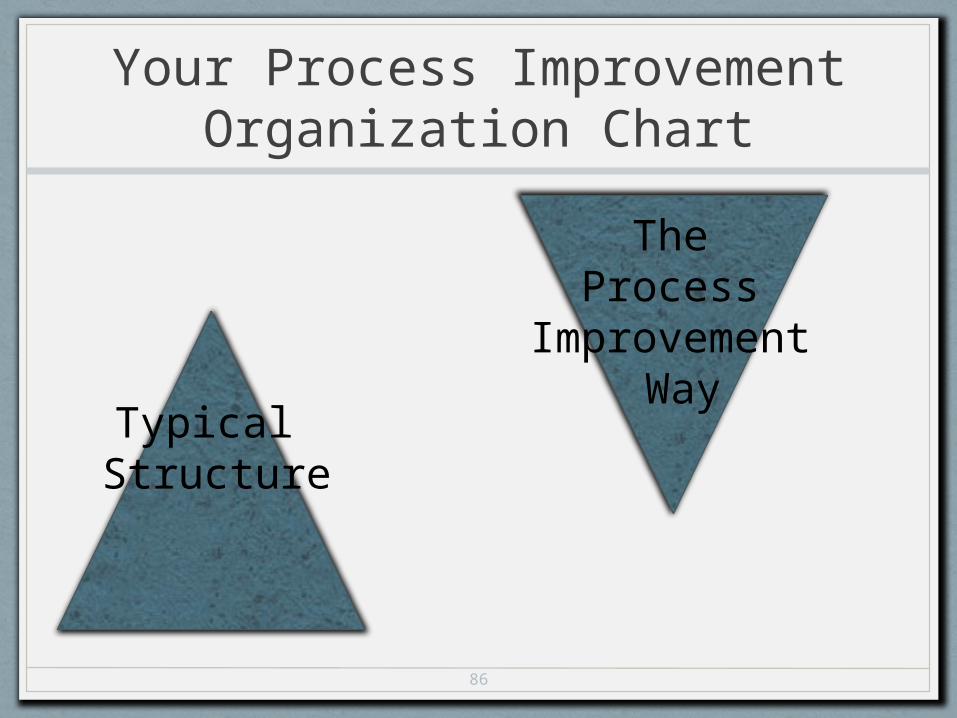
Your Process Improvement Organization Chart
Typical Structure
The Process
Improvement Way

87
SummaryAs Managers/Leaders
• Structure• Decision making• Project and process management
• Metrics• Cycle times• Cost• Care plan compliance
• Transition to a successful future

88

89
Contact Information
Owen J. [email protected]
Check out my new blog:http://blog.owendahlconsulting.com