LDL transports cholesterol to cells HDL transports cholesterol to liver.
10.1161/CIRCULATIONAHA.118.034076
1
LDL-Reactive T Cells Regulate Plasma Cholesterol Levels and Development
of Atherosclerosis in Humanized Hypercholesterolemic Mice
Running Title: Gisterå et al.; LDL-Reactive T Cells in Atherosclerosis
Anton Gisterå, MD, PhD1; Maria L. Klement, PhD1, 2; Konstantinos A. Polyzos, MD1;
Reiner K. Mailer, PhD1,3; Amanda Duhlin, PhD4; Mikael C.I. Karlsson, PhD4;
Daniel F.J. Ketelhuth, PhD1; Göran K. Hansson, MD, PhD1
1Center for Molecular Medicine, Department of Medicine, Karolinska University Hospital,
Karolinska Institutet, Stockholm, Sweden; 2Department of Immunotechnology, Lund University,
Lund, Sweden; 3Institute of Clinical Chemistry and Laboratory Medicine, University Medical
Center Hamburg-Eppendorf, Hamburg, Germany; 4Department of Microbiology, Tumor and Cell
Biology, Karolinska Institutet, Stockholm, Sweden
Address for Correspondence:
Göran K. Hansson, MD, PhD
Center for Molecular Medicine L8:03
Karolinska University Hospital
SE-17176 Stockholm, Sweden
Tel: +46708788738
Fax: +468313147. [email protected]
D
ownloaded from
http://ahajournals.org by on October 19, 2018
10.1161/CIRCULATIONAHA.118.034076
2
Abstract
Background—Atherosclerotic cardiovascular disease is a chronic inflammatory process initiated
when cholesterol-carrying low-density lipoprotein (LDL) is retained in the arterial wall. CD4+ T
cells, some of which recognize peptide components of LDL as antigen, are recruited to the
forming lesion, resulting in T-cell activation. Although these T cells are thought to be
proatherogenic, LDL immunization reduces disease in experimental animals. These seemingly
contradictory findings have hampered the development of immune-based cardiovascular therapy.
The present study was designed to clarify how activation of LDL-reactive T cells impacts on
metabolism and vascular pathobiology.
Methods—We have developed a T-cell receptor(TCR)-transgenic mouse model to characterize
the effects of immune reactions against LDL. Through adoptive cell transfers and cross-breeding
to hypercholesterolemic mice expressing the antigenic human LDL protein ApoB100, we
evaluate the effects on atherosclerosis.
Results—A subpopulation of LDL-reactive T cells survived clonal selection in the thymus,
developed into T follicular helper cells in lympoid tissues upon antigen recognition, and
promoted B-cell activation. This led to production of anti-LDL immunoglobulin G (IgG)
antibodies that enhanced LDL clearance through immune complex formation. Furthermore, the
cellular immune response to LDL was associated with increased cholesterol excretion in faeces
and with reduced vascular inflammation.
Conclusions—These data show that anti-LDL immunoreactivity evokes three atheroprotective
mechanisms, namely antibody-dependent LDL clearance, increased cholesterol excretion, and
reduced vascular inflammation.
Key Words: Atherosclerosis; T-lymphocytes; Apolipoprotein B-100; Vaccination;
Hypercholesterolemia
Dow
nloaded from http://ahajournals.org by on O
ctober 19, 2018
10.1161/CIRCULATIONAHA.118.034076
3
Clinical Perspective
What is new?
• Immune responses toward LDL are important for atherosclerosis development, but a lack
of specific experimental models has limited mechanistic understanding and translation of
findings into clinical therapies.
• We developed T-cell receptor transgenic mice to study LDL autoimmunity in a
humanized hypercholesterolemic mouse model of atherosclerosis.
• A strong T-cell dependent B-cell response was induced by LDL, leading to production of
anti-LDL IgG antibodies that enhanced LDL clearance and ameliorated atherosclerosis.
What are the clinical implications?
• This study sheds light on the pathophysiological role of LDL-reactive T cells and anti-
LDL IgG antibodies, both of which are known to be present in patients with
atherosclerotic cardiovascular disease.
• We show that targeting LDL-reactive T cells can enhance atheroprotective immunity and
that vaccination against LDL components may be an attractive way to prevent
atherosclerosis.
Dow
nloaded from http://ahajournals.org by on O
ctober 19, 2018
10.1161/CIRCULATIONAHA.118.034076
4
Introduction
Atherosclerotic cardiovascular disease is the main cause of death in the world today1. It is a
chronic inflammatory process initiated when cholesterol-carrying low-density lipoprotein (LDL)
particles are retained in the arterial wall2, 3. LDL retention elicits a local inflammation with influx
of monocytes that differentiate into macrophages, accumulate intracellular cholesterol, and
produce inflammatory mediators4, 5. In parallel with macrophages, T cells are also recruited to
the forming lesion6, 7. Many of them are CD4+ cells that recognize LDL as antigen, resulting in
T-cell activation8, 9. T cells accumulating in atherosclerotic lesions are largely of the
proinflammatory Th1 subtype and produce inflammatory cytokines such as interferon-γ (IFN-γ)
and tumor necrosis factor (TNF)8, 10, which can activate other cells to secrete additional
mediators including interleukins, chemokines, and eicosanoids. Local production of
inflammatory mediators in the atherosclerotic artery wall eventually leads to activation of acute
phase responses and elevated levels of inflammatory markers such as interleukin(IL)-6 and C-
reactive protein (CRP) in the systemic circulation. Ongoing inflammatory and hemodynamic
assault on the atherosclerotic lesion may eventually cause a local dysfunction or breakdown of
endothelial integrity. This, in turn, can trigger thrombus formation, local ischemia, and infarction
of the end organ, as is the case in myocardial infarction and ischemic stroke2. This scenario can
be prevented by anti-inflammatory therapy, as recently shown in a large secondary prevention
clinical trial11.
The development of disease models in gene-targeted mice has permitted a dissection of
the role of immunity and inflammation in atherosclerosis. By targeting key genes in cholesterol
metabolism, it was possible to make mice severely hypercholesterolemic. This leads to
development of atherosclerosis in this species, although it is normally resistant to this disease.
Dow
nloaded from http://ahajournals.org by on O
ctober 19, 2018
10.1161/CIRCULATIONAHA.118.034076
5
Th1 cells and their signature cytokine, IFN-γ, were found to exert proatherogenic effects
in hypercholesterolemic, gene-targeted mice6, 12, 13. Such effects were also seen when CD4+ T
cells were introduced into immunodeficient Apoe-/-xscid/scid mice14, 15. Manipulation of
regulatory T (Treg) cells revealed an “atheroprotective” role of this subset16-18, whereas Th17
cells may promote collagen formation and plaque stabilization19. All these studies involve
genetic perturbation that affects global differentiation of T cells and the impact of antigen
specific T-cell responses has remained unclear.
Immunization with LDL can elicit an atheroprotective response that inhibits lesion
development20-22. This is the case irrespective of whether antigen is administered through the
parenteral or mucosal route23. The atheroprotective effect appears to involve T cells, since it is
associated with formation of high-titer IgG-anti-LDL22. It has been ascribed to the generation of
immunosuppressive Tregs producing anti-inflammatory cytokines, or to formation of anti-LDL
antibodies7.
During atherogenesis, periarterial and systemic B-cell responses also occur, with
production of antibodies to epitopes on native and oxidized LDL particles24. Both pro- and anti-
atherosclerotic effects have been linked to B cells25-28. Thus, splenectomy increases disease in
hypercholesterolemic mice, whereas transfer of spleen B cells reduces it25. Similarly, enhanced
production of antibodies to epitopes on oxidized LDL particles attenuates disease development29.
Paradoxically, administration of anti-CD20 antibodies also ameliorates it28.
Limited insights into the nature of the disease-associated immune response to LDL have
made our understanding of the atherosclerotic process incomplete and hampered the possibilities
to develop immunoprotective prevention and therapy. In other chronic inflammatory diseases,
such as rheumatoid arthritis and multiple sclerosis, transgenic (tg) models in which a large
Dow
nloaded from http://ahajournals.org by on O
ctober 19, 2018
10.1161/CIRCULATIONAHA.118.034076
6
proportion of T cells recognize the purported autoantigens, have turned out to be useful for
studies of pathogenetic mechanisms and therapeutic principles30, 31. We therefore constructed a tg
mouse model in which the majority of CD4+ T cells recognize human LDL, and determined its
effects on LDL turnover and atherosclerosis.
Methods
Mouse strains
Three different T-cell receptors (TCRs) were cloned from hybridomas described previously9.
The constructs were inserted into a hCD2-VA expression vector containing the promoter and
locus control region of the human CD2 gene32. The TCR α and β constructs were microinjected
into C57BL/6J embryos at the Karolinska Center for Transgene Technologies, yielding a
coisogenic C57BL/6J offspring that was screened for transgene expression by PCR. The three
strains were named BT1 (TRAV12, TRBV31), BT2 (TRAV4, TRBV31), and BT3 (TRAV14,
TRBV31). In subsequent experiments, C57BL/6J mice (B6) were used as controls. For LDL
injections the BT strains were crossed with a Nur77-GFP reporter mouse (C57BL/6-Tg(Nr4a1-
EGFP/cre)820Khog/J, stock 016617, Jackson laboratory). For cell transfers and crosses, we used
C57BL/6J-Human APOB100-tg Ldlrtm1Her (HuBL) mice backcrossed to C57BL/6J for 10
generations3. These mice carry the full-length human APOB100 gene, in which codon 2153 has
been converted from glutamine to leucine to prevent the formation of ApoB48, thus generating
only ApoB100. Mice were fed a Western diet (R638, Lantmännen) for 10 weeks9. All
experiments were performed according to institutional guidelines and were approved by the
Stockholm Regional Board for Animal Ethics.
Dow
nloaded from http://ahajournals.org by on O
ctober 19, 2018
10.1161/CIRCULATIONAHA.118.034076
7
Mouse experiments
To measure T-cell activation in vivo, 10-week-old mice were injected with 100 µg LDL
intraperitoneally. Sixteen hours later, spleens were harvested and T cells analyzed by flow
cytometry. For adoptive T-cell transfer, 10-week-old male donors were sacrificed and spleen and
lymph nodes harvested. Single cell suspensions were prepared and untouched CD4+ cells
isolated by negative selection with antibodies to CD8, CD11b, CD16/32, CD45R, and Ter-119
(Dynabeads untouched mouse CD4 cells kit, Invitrogen). Cells were labeled with
CellTraceViolet (Invitrogen) or directly resuspended in phosphate-buffered saline (PBS) for
intravenous injection of 3*106 cells in the tail vein. For cell trace experiments, recipients were
sacrificed 1-4 days after cell transfer. In other experiments, the recipients received the first
injection at 10 weeks of age and a second injection at 15 weeks of age. They were sacrificed at
20 weeks of age, after totally 10 weeks on Western diet. All male HuBL progeny from the in-
house breeding colony was included in the study and randomly assigned to receive B6, BT1,
BT2, or BT3 cell transfer depending on available donors. The included mice were given a serial
number to blind the following analyzes. Two mice were excluded from the study, one died
before the first injection, and the second died 25 days after the first BT2 cell injection. The study
was closed when the number reached a predetermined power to detect a 10 percentage points
difference in lesion size (aortic arches from untreated male HuBL mice were used for the power
calculation; α=0.05, β=0.2). BT1xHuBL and BT3xHuBL mice were developed through
crossbreeding. Hemizygous BT1xHuBL mice (homozygous for human APOB100 and Ldlrtm1Her)
were then bred to HuBL mice to generate a BT1+xHuBL study group and BT1-xHuBL littermate
Dow
nloaded from http://ahajournals.org by on O
ctober 19, 2018
10.1161/CIRCULATIONAHA.118.034076
8
controls (HuBL). Ten-week-old male mice were either fed Western diet for 10 weeks or
sacrificed for baseline analyzes.
For the vaccination study, 25-week-old male HuBL mice received subcutaneous
immunizations with ApoB100 emulsified in complete Freund’s adjuvant. The immune response
was boosted four weeks later with ApoB100 emulsified in incomplete Freund’s adjuvant. All
mice received 100 μg protein. Control mice were immunized with PBS and adjuvant following
the same protocol. All mice were sacrificed 10 weeks after the first immunization.
Flow cytometry analysis
Flow cytometry was performed on leukocytes isolated as single cell suspensions from spleen,
thymus, or lymph nodes. Fixable Aqua Live/Dead staining was used according to manufacturer’s
protocol (Invitrogen). After Fc-block (anti-CD16/32, BD Biosciences), fluorophore labeled
primary IgG antibodies were employed for extracellular staining. Streptavidin Dylight 649
(Vector) was used for biotinylated primary antibodies. Intracellular staining was performed using
the anti-mouse/rat Foxp3 staining set (eBioscience). All antibodies are listed in the Supplemental
Methods section. Samples were acquired on a CyAn ADP flow cytometer (Beckman Coulter)
and data were analyzed using FlowJo software (Tree Star).
Tissue processing, immunohistochemistry, and lesion analysis
Blood from sacrificed mice was collected by cardiac puncture and the vasculature perfused with
sterile ribonuclease-free PBS. The aortic arch was fixed in PBS-buffered 4% formaldehyde
solution for later pinning and staining with Sudan IV (Sigma-Aldrich). The rest of the aorta,
para-aortic lymph nodes, and a liver lobe were dissected and snap-frozen for later RNA isolation.
The heart, spleen, liver, kidney, and duodenum were dissected and preserved in OCT compound
for immunohistochemistry. Lesion analysis was performed as previously described9. Briefly,
Dow
nloaded from http://ahajournals.org by on O
ctober 19, 2018
10.1161/CIRCULATIONAHA.118.034076
9
hearts were serially sectioned on a cryostat, starting from the proximal part of the aortic root, and
stained with hematoxylin and Oil Red O. Kidney and liver sections were stained in the same
way. Lesion size was determined on eight sections, collected at every 100 μm of the aortic root.
For each section, images were captured in a Leica photomicroscope, and the surface areas of the
lesions and of the entire vessel were measured using Image J software (NIH). For fluorescent
staining of spleen, liver, kidney, and duodenum sections, peanut agglutinin (PNA, Vector), Nile
Red (Sigma-Aldrich), or antibodies listed in Supplemental Methods were used. Nuclei were
stained with DAPI (Sigma-Aldrich). Fluorescent micrographs were acquired with an SP2
Acusto-Optical Beam Splitter confocal laser-scanning microscope (Leica).
Blood and plasma analyses
Blood was collected by cardiac puncture or through tail vein bleeding in EDTA-coated tubes.
Whole blood and splenocyte single cell suspensions were analyzed on a Vet abc hemocounter
(Scil). Plasma cholesterol and triglycerides were analyzed using enzymatic colorimetric kits
(Randox) according to the manufacturer’s protocol. For lipoprotein profiling, plasma was
fractionated using a Superose 6 10/300 GL column (GE Healthcare) coupled to a Prominence
UFLC system (Shimadzu) and equilibrated with Tris-buffered saline (TBS), pH 7.4. Fractions of
200 µl were collected using a Foxy Jr fraction collector (Teldyne Isco) for subsequent detection
of cholesterol and triglycerides with abovementioned enzymatic kits.
Titers of specific antibodies to LDL, oxidized (ox)LDL, and ApoB100 were measured
with enzyme-linked immunosorbent assay (ELISA). In brief, 50 μl of the different antigens (10
μg/ml) were added to 96-well ELISA plates and incubated overnight at 4°C. Coated plates were
washed with PBS and blocked with 1% gelatin (Invitrogen) in PBS for one hour at room
temperature. Next, plates were washed and incubated for two additional hours with plasma from
Dow
nloaded from http://ahajournals.org by on O
ctober 19, 2018
10.1161/CIRCULATIONAHA.118.034076
10
individual animals, diluted in TBS with 0.1% gelatin. After washing, total IgM (Immunkemi),
IgG (Vector), IgG1 (Southern Biotech), and IgG2c (BD Biosciences) levels were revealed by
using biotinylated anti-mouse antibodies and HRP-streptavidin. The plates were washed,
colorimetric reactions developed using tetramethylbenzidine (BD Biosciences), and absorbance
measured on a microplate reader (Molecular Devices). For immune complex analysis, ELISA
plates were coated with anti-ApoB100 antibodies and then incubated with mouse plasma to
allow binding of LDL particles in the samples. After washing, any IgM and IgG bound to the
LDL particles were detected by using biotinylated antibodies, HRP-streptavidin, and
tetramethylbenzidine as described above.
For the competition ELISA, IgG antibodies (10 μg/ml) obtained from plasma of HuBL
and BT3xHuBL mice were pre-incubated with increasing amounts of native LDL, oxLDL, and
ApoB overnight at 4°C in glass tubes. The mixtures were then used in ELISA assays detecting
IgG antibodies to LDL and oxLDL as described above.
Statistical analysis
Data were analyzed using Prism version 5.03 for Windows (GraphPad). Student’s t-test, 1-way
analysis of variance (ANOVA) with Dunnett’s multiple comparison test, or 2-way ANOVA with
Bonferroni’s post test was used for comparisons when the Shapiro-Wilk test indicated normality.
The Mann-Whitney test or Kruskal-Wallis test with Dunn’s multiple comparison test was used
when Gaussian distribution could not be assumed. Pearson correlation coefficient was used to
assess correlations. Differences between groups were considered significant at p-values below
.05 (* p≤.05, ** p≤.01, *** p≤.001). All experiments were repeated at least twice. The data,
analytic methods, and study materials will be made available to other researchers for purposes of
reproducing the results or replicating the procedure (available at the authors’ laboratories).
Dow
nloaded from http://ahajournals.org by on O
ctober 19, 2018
10.1161/CIRCULATIONAHA.118.034076
11
Results
LDL-reactive TCR-transgenic mice
A panel of CD4+ T-cell hybridomas was established from mice immunized with human LDL
particles. These cells recognized epitopes in the ApoB100 protein of LDL9. TCR cDNA from
these cells was cloned under the CD2 promoter and used for production of tg mice. Three tg
strains with strong anti-LDL reactivity, termed BT1, BT2, and BT3 were used for experiments
(Figure 1A, S1A-C). They all expressed tg TCR with β-chain TRBV31 together with β-chain
TRAV12, 4, or 14, respectively. TRBV31 was found on >90% of all CD4+ T cells in the tg
strains but only on 8% of CD4+ T cells in wild-type (wt) mice (Figure 1B, S1D-E). Nearly all
these cells were naïve in the tg mice (Figure 1B, S1F-H), but exposure to human native LDL in
vitro evoked a strong T-cell response (Figure 1A, S1B). The proliferative response to oxLDL
was less pronounced (Figure 1A, S1C), in line with previous findings9.
T-cell activation by injection of LDL
To characterize the response to LDL antigen in vivo, we crossed the tg BT strains with a reporter
mouse expressing green fluorescent protein (GFP) under Nur77, a promoter transcribed during
T-cell activation33. Injection of human LDL led to vivid T-cell activation responses of the same
magnitude as those achieved after polyclonal stimulation (Figure 1C, S1I-L).
Injection of BT1 T cells to HuBL mice
T-cell activation in vivo was further studied by injecting BT1 T cells labeled with cell trace
violet into HuBL mice (Figure S2A). These mice carry the human LDL protein, ApoB100 as a
transgene3, therefore they produce humanized LDL particles similar to those used as antigen for
donor mouse immunization and TCR cloning. High plasma concentrations of humanized LDL
particles are found in the HuBL cross that lacks the LDL receptor. After intravenous infusion,
Dow
nloaded from http://ahajournals.org by on O
ctober 19, 2018
10.1161/CIRCULATIONAHA.118.034076
12
BT1 T cells were rapidly activated and underwent several rounds of proliferation in the HuBL
hosts (Figure 1D, S2B-D). Induction of Foxp3+ T regulatory cells could not be observed (Figure
S2E). Most BT1 cells homed to the spleen, with significant populations also in para-aortic,
inguinal, and mesenteric lymph nodes (Figure 1D, S2C). No signs of proliferation or homing
were observed when wt C57BL/6J (B6) T cells were injected into HuBL mice (Figure 1D, S2B-
C). BT2 cell injections led to similar rapid proliferative responses in HuBL mice, whereas no
proliferation occurred in Ldlr-/- mice that lacked transgenic production of human LDL antigen
(Figure S2F). These data show that tg BT cells maintained their reactivity to human LDL and
normal homing capacity after transfer into HuBL mice.
Injected BT T cells promote T- and B-cell activation
The long-term effects of a strong cellular immune response to LDL were studied in HuBL mice
receiving BT cells twice over a 5-week period (Figure 2A, Table S1). BT cells remained
detectable in the spleen five weeks after the last injection (Figure 2B). Spleens were enlarged,
with an increased proportion of tg TRBV31+ effector T cells and an expanded population of T
follicular helper (Tfh) cells (Figure 2C-D, S3A-J). This was accompanied by an expansion of the
Th cell pool and an increased conversion of Th cells from naïve to effector/memory phenotype
(Figure S3C-E). In transcript analysis of aortas, elevated levels of Foxp3, the master regulator of
Treg, and to a lesser extent Tbx21, encoding the Th1-transcription factor Tbet, were found in the
HuBL/BT3 group (Table S2). This was accompanied by elevated mRNA levels of their signature
cytokines, Ifng and Il10, but also the Tfh-related cytokine Il21 was found to be markedly
increased (Table S2). In draining lymph nodes, the increase in Il21 mRNA was particularly
striking (Table S2). In spleens, we also observed formation of germinal centers, expansion of the
plasma cell pool, and production of IgG antibodies to LDL (Figure 2E-H, S3K-O). These
Dow
nloaded from http://ahajournals.org by on O
ctober 19, 2018
10.1161/CIRCULATIONAHA.118.034076
13
antibodies recognized native and oxidized forms of LDL as well as ApoB100 protein (Figure
2H-I, S4A-F). Anti-ApoB100 antibodies were of both IgG1 and IgG2c isotypes (Figure 2J-K,
S4G-H). The concomitant induction of Tfh cells, formation of germinal centers, expansion of
plasma cells, and increase in anti-LDL IgG demonstrates that T cells reactive to LDL protein
provide help for B-cell activation, leading to anti-LDL antibody production.
Lower plasma cholesterol levels in BT injected mice
At the age of 15 weeks, five weeks after the first injection, strikingly lower plasma cholesterol
was seen in HuBL mice injected with BT1 or BT3 cells (Figure 3A, Table S1). This was due to
reduced levels of LDL and the very low-density lipoprotein (VLDL)/chylomicron remnant
fraction (Figure 3B). The effects on plasma triglycerides were similar to those on cholesterol
(Figure 3C-D). We speculated that the reduction in plasma lipids could be due to antibody-
dependent elimination of lipoprotein particles from circulation. In support of this notion, LDL
particles in mice injected with BT3 cells were found to be covered with antibodies, forming
LDL-IgG immune complexes (Figure 3E, S4I-J). Plasma from HuBL/BT3 chimeras enhanced
FITC-oxLDL uptake into cultured macrophages, providing further support for this notion (Figure
3F-G).
Anti-LDL IgG promotes LDL clearance
To test whether anti-IgG antibodies promoted LDL clearance, FITC-labeled human LDL
particles were mixed with anti-LDL IgG containing plasma from HuBL/BT3 mice, or with
plasma from control HuBL/B6 mice, and injected into HuBL mice. FITC-LDL treated with
HuBL/BT3 plasma displayed enhanced clearance compared with FITC-LDL treated with control
plasma (Figure 3H). Lipid and IgG could be detected in kidney glomeruli of HuBL/BT3 animals,
but creatinine levels remained normal (Figure S4K-M, Table S1). No increase of lipid-laden
Dow
nloaded from http://ahajournals.org by on O
ctober 19, 2018
10.1161/CIRCULATIONAHA.118.034076
14
macrophages was observed in the spleen (Figure S4N). Since the liver is a major site for
clearance of IgG immune complexes34-36, we analyzed liver extracts but could not detect any
accumulation of cholesterol (Figure S4O). Therefore, further cholesterol clearance to feces is
likely to occur if liver uptake of plasma lipoproteins is of importance for the cholesterol lowering
effect of the LDL immune response.
LDL-reactive T cells protect from atherosclerosis
Atherosclerotic lesion burden was reduced by 30% in the HuBL/BT3 and HuBL/BT1 animals,
with a similar trend also for HuBL/BT2 mice (Figure 3I-J). The different outcomes between the
strains could be explained by different affinities and binding capacities to MHC class II-peptide
complexes. A substantial downregulation of the BT2 TCR was observed in mediastinal lymph
nodes (Figure 3K-L). Such a response is observed in high affinity T-cell clones and can reduce
their effector functions37. Consequently, BT1 and BT3 cells may have lower affinities but more
vigorous effector functions, including B-cell help and activation of cell-mediated immunity. Our
findings are in line with this notion and also suggest that B-cell activation and production of
antibodies capable of clearing the antigen contributed to the lipid-lowering effect of the anti-
LDL immune response.
Thymic selection of LDL-reactive T cells
BT1 mice were crossed with HuBL mice in order to study the development of the cellular
immune response to LDL in a humanized model that produces the antigen from birth and
onwards, i.e. a situation resembling that in man. In both HuBL and BT1xHuBL mice, human
APOB100 was mainly expressed in the gut and liver but mRNA could be detected also in the
thymus, where it may aid negative selection against self-reactive T-cell clones (Figure 4A-B). A
publically available dataset shows that Apob mRNA is expressed in medullary thymic epithelial
Dow
nloaded from http://ahajournals.org by on O
ctober 19, 2018
10.1161/CIRCULATIONAHA.118.034076
15
cells, i.e. the cells mainly responsible for negative thymic selection38. Most of the human
ApoB100 reactive, TRBV31bright BT1 cells were eliminated in the thymus during early life,
indicating that negative selection did take place against ApoB100 (Figure 4C-G, S5A). However,
approximately 20% of CD4+ T cells in the periphery were TRBV31dim in BT1xHuBL mice versus
<1% in B6xHuBL animals (Figure 4H, S5B-C, Table S3). TRBV31 could therefore be used as a
marker for tg cells. Detection of the tg α-chain was not possible with available antibodies, but its
mRNA was overexpressed to a similar extent as that for the β-chain and the levels of the two
transcripts showed a strong positive correlation (Figure S5D-E, Table S4). Among the
TRBV31dim cells, 10-15% were Tfh and Th1 effector cells (versus 2-6% in B6xHuBL mice), with
a modest contribution of Foxp3+ regulatory T cells (Figure 5A-C, S5F-H, Table S4). Transcript
analysis of draining lymph nodes also showed a significant, 36% reduction in IL-6 mRNA in the
BT1xHuBL cross, implying reduced inflammatory activation (Table S4).
Anti-LDL immunity protects against atherosclerosis
BT1xHuBL mice had increased plasma levels of anti-LDL IgG, including antibodies to oxLDL,
native LDL, and ApoB100, mainly of the IgG1 isotype (Figure 5D-G, S5I-P). Similar to the cell
transfer experiments, immune complex formation with LDL-[anti-LDL IgG] complexes was
detected also in these animals (Figure 5H, S5Q-R). It was associated with significantly reduced
plasma cholesterol, VLDL, and LDL (Figure 5I-J, S5S-U). ApoB expression was not different in
liver or gut (Figure S6A-B, Table S4), and cholesterol levels were decreased in liver extracts
(Figure S6C-D).
Atherosclerotic lesions were substantially reduced, by approximately 50%, in BT1xHuBL
mice (Figure 5K-N, S6E-F). This was accompanied by reduced expression of VCAM-1, a
marker of vascular NF-κB activation, without any other significant effects on lesion composition
Dow
nloaded from http://ahajournals.org by on O
ctober 19, 2018

10.1161/CIRCULATIONAHA.118.034076
16
(S6G-M). The disease burden was proportional to cholesterol levels (Figure S6N) and showed a
significant, negative correlation to immune complex concentration (Figure S6O).
A similar, atheroprotective effect was achieved when HuBL mice were immunized with
ApoB preparations. This treatment also led to induction of IgG-anti-LDL antibodies, reduced
plasma cholesterol and reduced atherosclerosis (Figure 6A-D, S7A-E).
Clearance of lipoproteins by a humoral response in BT3xHuBL mice
Since BT3 cells induced the highest titers of anti-LDL antibodies, we crossed the BT3 line with
HuBL mice and investigated the phenotype of the offspring. The thymus of BT3xHuBL mice
showed more pronounced signs of negative selection compared to BT1xHuBL mice (Figure S8A-
B). In the periphery, a reduction of T-helper cells was observed, but most of them were
TRBV31+ effector/memory cells (Figure 7A, S8C-G). A significant proportion of the
TRBV31dim cells had differentiated into Tfh cells (Figure 7B). The enlarged spleen showed signs
of ongoing inflammation and had increased germinal center B cells and plasma cells that
produced high titer anti-LDL IgG (Figure 7C-D, S8H-O, Table S5). The B-cell response was
further characterized by a competition assay in which purified IgG antibody binding to
immobilized antigens was competed with soluble LDL, oxLDL, or ApoB100. This assay showed
overlapping specificities between anti-LDL and anti-oxLDL antibodies (Figure 7E-F). LDL,
oxLDL, and ApoB100 protein could all compete for binding. OxLDL was the most efficient
competitor, indicating the presence of oxidation specific epitopes. The pattern was similar to
HuBL IgG (Figure S8P-Q).
In the circulation of BT3xHuBL mice, anti-LDL IgG formed immune complexes that
were accompanied by lower plasma cholesterol and triglycerides and a significant protection
from atherosclerosis (Figure 7G-J, S8R-S). Injection of IgG from these mice reduced plasma
Dow
nloaded from http://ahajournals.org by on O
ctober 19, 2018
10.1161/CIRCULATIONAHA.118.034076
17
ApoB concentrations in recipients (Figure 7K, S8C). These mice also displayed increased
accumulation of lipids and IgG1 in the liver (Figure 7L-M, S8T-U). Further clearance of
cholesterol to feces was also detected (Figure 7N). Lipoprotein production remained unaltered,
as judged by ApoB expression in liver and gut (Figure S8V-X).
Discussion
Our data provide insights into mechanisms of atheroprotective immunity. They show that a
subpopulation of LDL-reactive T cells survives clonal selection and is able to elicit adaptive
immune reactions to LDL. Such reactions were mounted both to injected, autologous LDL and as
a response to endogenously produced LDL in the humanized mouse. Therefore, LDL reactive T
cells can mount autoimmune reactions to lipoprotein particles.
When naïve LDL reactive T cells were injected into mice producing human LDL,
immune activation occurred in secondary lymphoid organs including spleen and draining lymph
nodes. Although direct evidence is not available in mouse models, it is likely that recall
activation of effector/memory T cells occurs in the diseased artery, as is the case in man39.
The cellular immune response to LDL had important functional consequences, the net
effect of which was a reduction of atherosclerosis. By providing B-cell help, it triggered
formation of a set of anti-LDL antibodies that can enhance LDL clearance from the circulation.
Furthermore, the immune response to LDL was associated with increased cholesterol excretion
and with signs of reduced vascular inflammation. It is likely that all these effects synergized to
inhibit disease development. These findings should be helpful in the development of
immunotherapy against atherosclerotic cardiovascular disease.
Dow
nloaded from http://ahajournals.org by on O
ctober 19, 2018
10.1161/CIRCULATIONAHA.118.034076
18
The LDL-reactive T cells provided help for activation of LDL-reactive B cells. This
process initiated germinal center reactions, with plasma cell formation and production of anti-
LDL antibodies. Anti-LDL antibodies formed immune complexes with LDL that were detected
in peripheral blood. Formation of immune complexes significantly increased clearance of LDL
particles from the circulation, thus reducing plasma cholesterol levels, which is in line with
findings made by Klimov et al. in the 1980s40. Statistical analysis showed that LDL-[anti-LDL
IgG] immune complexes, plasma cholesterol, and atherosclerotic lesion size were correlated,
suggesting that these factors were dependent on each other. Our data point to the liver as the
major site of elimination of lipoprotein-derived lipid, however, the detection of antibodies and
lipid in kidneys in one of the strains warrants further investigation.
Previous experiments to functionally assess the role of LDL-reactive T cells in
atherogenesis have pointed to major roles for Th1 and Treg cells. We were not able to detect a
decisive shift of these cell types but the finding of reduced IL-6 expression in para-aortic lymph
nodes of mice carrying strong LDL immunoreactivity suggests that local anti-inflammatory
effects contributed to atheroprotection.
The most striking finding in our study was the induction of atheroprotective humoral
immunity to LDL. The notion that LDL-reactive B cells mount atheroprotective immunity is in
line with previous findings that B cells carry atheroprotective immunity25, 26, that
atheroprotection is associated with formation of IgG antibodies22, and that disease is increased in
mice lacking inhibitory and decreased in animals lacking activating Fc receptors41, 42. Our current
data extend these findings by demonstrating that humoral immunity to LDL is induced by Tfh
effector cells that trigger B-cell activation, germinal center formation, and production of high-
Dow
nloaded from http://ahajournals.org by on O
ctober 19, 2018
10.1161/CIRCULATIONAHA.118.034076
19
affinity antibodies to LDL. Furthermore, our data show that antibody-mediated clearance of LDL
antigen contributed to the atheroprotective effect of LDL immunity.
The observed, incomplete tolerance to LDL and ApoB did not involve any substantial
induction of natural Tregs but was due to clonal elimination in the thymus and peripheral anergy
of cells escaping positive selection. This finding does not rule out that peripheral tolerance
mechanisms involving Treg may be important in atherosclerosis and it should be kept in mind
that the present experimental design involves transgenic TCR with high affinity to antigen. It is
possible that T cells with lower affinity to antigen may play a significant role under “normal”
conditions that do not involve genetically modified immune responses.
We have previously shown that induction of antibodies that block the immunological
synapse of ApoB100-reactive T cells can reduce atherosclerosis9. It was, therefore, surprising
that the net effect of a strong cellular immune response against the same antigen is
atheroprotective. The two experiments are, however, not directly comparable since synapse
blockade likely inhibits all downstream effects of an immune response, whereas antigen
activation of an antigen-specific T cell triggers a specific effector response that depends on the
precise conditions at the time of activation, including the presence of specific metabolites,
cytokines, and costimulatory factors. Furthermore, blockade of the immunological synapse with
an antibody to the pertinent TCR may in itself exert immunomodulatory effects. Further studies
are needed to elucidate the mechanisms leading to these results.
Our data clarify observations of antibody induction and plasma lipoprotein reduction in
several experiments employing immunization or anti-LDL IgG administration to control
atherosclerosis27, 29, 43-46. The finding that T-cell reactions to LDL involve development of Tfh
cells, germinal center formation, and antibody-dependent LDL clearance support and extend the
Dow
nloaded from http://ahajournals.org by on O
ctober 19, 2018
10.1161/CIRCULATIONAHA.118.034076
20
recent report that formation of tertiary lymphoid structures protects against atherosclerosis47.
They also shed light on the observation that disturbed T-cell migration leads to
hypercholesterolemia, reduced anti-oxLDL antibodies, and increased atherosclerosis in mice48
and that antibodies to oxLDL are inversely correlated with particle concentration in humans49.
They are, however, seemingly at odds with studies showing proatherosclerotic effects of Tfh
cells50 and B2 cells28. In these reports, disease development was studied under conditions when
global immunoregulatory networks were disrupted by mutations in the major histocompatibility
complex and by administration of cytolytic antibodies, respectively. In contrast, our current data
address the disease-associated autoimmunity to LDL and identify an atheroprotective mechanism
elicited by expansion of LDL-reactive T cells. Such T cells have been cloned from human
atherosclerotic lesions8 and are, therefore, active in clinical disease.
In humans, anti-LDL titers are generally low and studies have shown weak or no
associations between them and clinical cardiovascular events. It is, therefore, of interest to
enhance immune responses in models in order to assess their pathophysiological consequences.
It will also be important to develop and apply high-resolution imaging to measure lesion size in
man and determine its association with anti-LDL antibodies.
The models used in this study exaggerate hyperlipidemia as well as cellular immune
reactivity and made it possible to study effects of a strong immune response in a hyperlipidemic
host within a reasonable time frame. They allowed us to analyze immune responses that may not
be detectable in models with less profound immune reactivity towards LDL. It will now be
important to follow these aspects of anti-LDL immunity in other models, expand the vaccination
studies to characterize LDL-specific T-cell responses, and eventually translate the findings into
human disease.
Dow
nloaded from http://ahajournals.org by on O
ctober 19, 2018
10.1161/CIRCULATIONAHA.118.034076
21
In conclusion, this study shows that T cells reactive to LDL survive clonal selection and
can mount atheroprotective immune responses that involve humoral immunity, reduction of
plasma cholesterol and reduced lesion formation. By targeting LDL-reactive T cells,
immunization with LDL protein can enhance such atheroprotective immunity. This may be an
attractive way of inhibiting or preventing atherosclerotic cardiovascular disease.
Acknowledgments
We thank I. Törnberg, L. Haglund, A. Olsson, and A. Strodthoff for technical assistance.
Sources of Funding
This work was supported by project grant 06816 and Linnaeus support 349-2007-8703 from the
Swedish Research Council, and by grants from the Swedish Heart-Lung Foundation, the
Foundation for Strategic Research (SSF), Vinnova Foundation, Stockholm County Council, King
Gustav V and Queen Victoria Foundation, Prof Nanna Svartz foundation, and the European
Union’s Seventh Framework Programme [FP7/2007-2013] under grant agreement Athero-Flux
(n° 602222) and VIA (n° 603131).
Disclosures
A.G., M.L.K., D.F.J.K., and G.K.H. have filed patents on immunoprevention of atherosclerosis.
References
1. Global, regional, and national age-sex specific mortality for 264 causes of death, 1980-
2016: a systematic analysis for the Global Burden of Disease Study 2016. Lancet.
2017;390:1151-1210.
Dow
nloaded from http://ahajournals.org by on O
ctober 19, 2018
10.1161/CIRCULATIONAHA.118.034076
22
2. Hansson GK. Inflammation, atherosclerosis, and coronary artery disease. N Engl J Med.
2005;352:1685-1695.
3. Skalen K, Gustafsson M, Rydberg EK, Hulten LM, Wiklund O, Innerarity TL and Boren
J. Subendothelial retention of atherogenic lipoproteins in early atherosclerosis. Nature.
2002;417:750-754.
4. Moore KJ and Tabas I. Macrophages in the pathogenesis of atherosclerosis. Cell.
2011;145:341-355.
5. Koenen RR and Weber C. Chemokines: established and novel targets in atherosclerosis.
EMBO Mol Med. 2011;3:713-725.
6. Libby P, Lichtman AH and Hansson GK. Immune effector mechanisms implicated in
atherosclerosis: from mice to humans. Immunity. 2013;38:1092-1104.
7. Gistera A and Hansson GK. The immunology of atherosclerosis. Nat Rev Nephrol.
2017;13:368-380.
8. Stemme S, Faber B, Holm J, Wiklund O, Witztum JL and Hansson GK. T lymphocytes
from human atherosclerotic plaques recognize oxidized low density lipoprotein. Proc Natl Acad
Sci U S A. 1995;92:3893-3897.
9. Hermansson A, Ketelhuth DF, Strodthoff D, Wurm M, Hansson EM, Nicoletti A,
Paulsson-Berne G and Hansson GK. Inhibition of T cell response to native low-density
lipoprotein reduces atherosclerosis. J Exp Med. 2010;207:1081-1093.
10. Frostegard J, Ulfgren AK, Nyberg P, Hedin U, Swedenborg J, Andersson U and Hansson
GK. Cytokine expression in advanced human atherosclerotic plaques: dominance of pro-
inflammatory (Th1) and macrophage-stimulating cytokines. Atherosclerosis. 1999;145:33-43.
11. Ridker PM, Everett BM, Thuren T, MacFadyen JG, Chang WH, Ballantyne C, Fonseca
F, Nicolau J, Koenig W, Anker SD, Kastelein JJP, Cornel JH, Pais P, Pella D, Genest J, Cifkova
R, Lorenzatti A, Forster T, Kobalava Z, Vida-Simiti L, Flather M, Shimokawa H, Ogawa H,
Dellborg M, Rossi PRF, Troquay RPT, Libby P and Glynn RJ. Antiinflammatory Therapy with
Canakinumab for Atherosclerotic Disease. N Engl J Med. 2017;377:1119-1131.
12. Gupta S, Pablo AM, Jiang X, Wang N, Tall AR and Schindler C. IFN-gamma potentiates
atherosclerosis in ApoE knock-out mice. J Clin Invest. 1997;99:2752-2761.
13. Buono C, Binder CJ, Stavrakis G, Witztum JL, Glimcher LH and Lichtman AH. T-bet
deficiency reduces atherosclerosis and alters plaque antigen-specific immune responses. Proc
Natl Acad Sci U S A. 2005;102:1596-1601.
14. Zhou XH, Nicoletti A, Elhage R and Hansson GK. Transfer of CD4(+) T cells aggravates
atherosclerosis in immunodeficient apolipoprotein E knockout mice. Circulation.
2000;102:2919-2922.
15. Zhou X, Robertson AK, Hjerpe C and Hansson GK. Adoptive transfer of CD4+ T cells
reactive to modified low-density lipoprotein aggravates atherosclerosis. Arterioscler Thromb
Vasc Biol. 2006;26:864-870.
16. Mallat Z, Besnard S, Duriez M, Deleuze V, Emmanuel F, Bureau MF, Soubrier F,
Esposito B, Duez H, Fievet C, Staels B, Duverger N, Scherman D and Tedgui A. Protective role
of interleukin-10 in atherosclerosis. Circ Res. 1999;85:e17-24.
17. Robertson AK, Rudling M, Zhou X, Gorelik L, Flavell RA and Hansson GK. Disruption
of TGF-beta signaling in T cells accelerates atherosclerosis. J Clin Invest. 2003;112:1342-1350.
18. Ait-Oufella H, Salomon BL, Potteaux S, Robertson AK, Gourdy P, Zoll J, Merval R,
Esposito B, Cohen JL, Fisson S, Flavell RA, Hansson GK, Klatzmann D, Tedgui A and Mallat
Dow
nloaded from http://ahajournals.org by on O
ctober 19, 2018
10.1161/CIRCULATIONAHA.118.034076
23
Z. Natural regulatory T cells control the development of atherosclerosis in mice. Nat Med.
2006;12:178-180.
19. Gistera A, Robertson AK, Andersson J, Ketelhuth DF, Ovchinnikova O, Nilsson SK,
Lundberg AM, Li MO, Flavell RA and Hansson GK. Transforming growth factor-beta signaling
in T cells promotes stabilization of atherosclerotic plaques through an interleukin-17-dependent
pathway. Sci Transl Med. 2013;5:196ra100.
20. Palinski W, Miller E and Witztum JL. Immunization of low density lipoprotein (LDL)
receptor-deficient rabbits with homologous malondialdehyde-modified LDL reduces
atherogenesis. Proc Natl Acad Sci U S A. 1995;92:821-825.
21. Ameli S, Hultgardh-Nilsson A, Regnstrom J, Calara F, Yano J, Cercek B, Shah PK and
Nilsson J. Effect of immunization with homologous LDL and oxidized LDL on early
atherosclerosis in hypercholesterolemic rabbits. Arterioscler Thromb Vasc Biol. 1996;16:1074-
1079.
22. Zhou X, Caligiuri G, Hamsten A, Lefvert AK and Hansson GK. LDL immunization
induces T-cell-dependent antibody formation and protection against atherosclerosis. Arterioscler
Thromb Vasc Biol. 2001;21:108-114.
23. Klingenberg R, Lebens M, Hermansson A, Fredrikson GN, Strodthoff D, Rudling M,
Ketelhuth DF, Gerdes N, Holmgren J, Nilsson J and Hansson GK. Intranasal immunization with
an apolipoprotein B-100 fusion protein induces antigen-specific regulatory T cells and reduces
atherosclerosis. Arterioscler Thromb Vasc Biol. 2010;30:946-952.
24. Palinski W, Rosenfeld ME, Yla-Herttuala S, Gurtner GC, Socher SS, Butler SW,
Parthasarathy S, Carew TE, Steinberg D and Witztum JL. Low density lipoprotein undergoes
oxidative modification in vivo. Proc Natl Acad Sci U S A. 1989;86:1372-1376.
25. Caligiuri G, Nicoletti A, Poirier B and Hansson GK. Protective immunity against
atherosclerosis carried by B cells of hypercholesterolemic mice. J Clin Invest. 2002;109:745-
753.
26. Major AS, Fazio S and Linton MF. B-lymphocyte deficiency increases atherosclerosis in
LDL receptor-null mice. Arterioscler Thromb Vasc Biol. 2002;22:1892-1898.
27. Binder CJ, Horkko S, Dewan A, Chang MK, Kieu EP, Goodyear CS, Shaw PX, Palinski
W, Witztum JL and Silverman GJ. Pneumococcal vaccination decreases atherosclerotic lesion
formation: molecular mimicry between Streptococcus pneumoniae and oxidized LDL. Nat Med.
2003;9:736-743.
28. Ait-Oufella H, Herbin O, Bouaziz JD, Binder CJ, Uyttenhove C, Laurans L, Taleb S, Van
Vre E, Esposito B, Vilar J, Sirvent J, Van Snick J, Tedgui A, Tedder TF and Mallat Z. B cell
depletion reduces the development of atherosclerosis in mice. J Exp Med. 2010;207:1579-1587.
29. Grasset EK, Duhlin A, Agardh HE, Ovchinnikova O, Hagglof T, Forsell MN, Paulsson-
Berne G, Hansson GK, Ketelhuth DF and Karlsson MC. Sterile inflammation in the spleen
during atherosclerosis provides oxidation-specific epitopes that induce a protective B-cell
response. Proc Natl Acad Sci U S A. 2015;112:E2030-E2038.
30. Kouskoff V, Korganow AS, Duchatelle V, Degott C, Benoist C and Mathis D. Organ-
specific disease provoked by systemic autoimmunity. Cell. 1996;87:811-822.
31. Goverman J, Woods A, Larson L, Weiner LP, Hood L and Zaller DM. Transgenic mice
that express a myelin basic protein-specific T cell receptor develop spontaneous autoimmunity.
Cell. 1993;72:551-560.
Dow
nloaded from http://ahajournals.org by on O
ctober 19, 2018
10.1161/CIRCULATIONAHA.118.034076
24
32. Zhumabekov T, Corbella P, Tolaini M and Kioussis D. Improved version of a human
CD2 minigene based vector for T cell-specific expression in transgenic mice. J Immunol
Methods. 1995;185:133-140.
33. Moran AE, Holzapfel KL, Xing Y, Cunningham NR, Maltzman JS, Punt J and Hogquist
KA. T cell receptor signal strength in Treg and iNKT cell development demonstrated by a novel
fluorescent reporter mouse. J Exp Med. 2011;208:1279-1289.
34. Thornburg RW, Day JF, Baynes JW and Thorpe SR. Carbohydrate-mediated clearance of
immune complexes from the circulation. A role for galactose residues in the hepatic uptake of
IgG-antigen complexes. J Biol Chem. 1980;255:6820-6825.
35. Clarkson SB, Kimberly RP, Valinsky JE, Witmer MD, Bussel JB, Nachman RL and
Unkeless JC. Blockade of clearance of immune complexes by an anti-Fc gamma receptor
monoclonal antibody. J Exp Med. 1986;164:474-489.
36. Anderson CL, Ganesan LP and Robinson JM. The biology of the classical Fcgamma
receptors in non-hematopoietic cells. Immunol Rev. 2015;268:236-240.
37. Gallegos AM, Xiong H, Leiner IM, Susac B, Glickman MS, Pamer EG and van Heijst
JW. Control of T cell antigen reactivity via programmed TCR downregulation. Nat Immunol.
2016;17:379-386.
38. Ki S, Park D, Selden HJ, Seita J, Chung H, Kim J, Iyer VR and Ehrlich LI. Global
transcriptional profiling reveals distinct functions of thymic stromal subsets and age-related
changes during thymic involution. Cell Rep. 2014;9:402-415.
39. Stemme S, Holm J and Hansson GK. T lymphocytes in human atherosclerotic plaques are
memory cells expressing CD45RO and the integrin VLA-1. Arterioscler Thromb. 1992;12:206-
211.
40. Klimov AN, Denisenko AD, Popov AV, Nagornev VA, Pleskov VM, Vinogradov AG,
Denisenko TV, Magracheva E, Kheifes GM and Kuznetzov AS. Lipoprotein-antibody immune
complexes. Their catabolism and role in foam cell formation. Atherosclerosis. 1985;58:1-15.
41. Zhao M, Wigren M, Duner P, Kolbus D, Olofsson KE, Bjorkbacka H, Nilsson J and
Fredrikson GN. FcgammaRIIB inhibits the development of atherosclerosis in low-density
lipoprotein receptor-deficient mice. J Immunol. 2010;184:2253-2260.
42. Hernandez-Vargas P, Ortiz-Munoz G, Lopez-Franco O, Suzuki Y, Gallego-Delgado J,
Sanjuan G, Lazaro A, Lopez-Parra V, Ortega L, Egido J and Gomez-Guerrero C. Fcgamma
receptor deficiency confers protection against atherosclerosis in apolipoprotein E knockout mice.
Circ Res. 2006;99:1188-1196.
43. Freigang S, Horkko S, Miller E, Witztum JL and Palinski W. Immunization of LDL
receptor-deficient mice with homologous malondialdehyde-modified and native LDL reduces
progression of atherosclerosis by mechanisms other than induction of high titers of antibodies to
oxidative neoepitopes. Arterioscler Thromb Vasc Biol. 1998;18:1972-1982.
44. Schiopu A, Bengtsson J, Soderberg I, Janciauskiene S, Lindgren S, Ares MP, Shah PK,
Carlsson R, Nilsson J and Fredrikson GN. Recombinant human antibodies against aldehyde-
modified apolipoprotein B-100 peptide sequences inhibit atherosclerosis. Circulation.
2004;110:2047-2052.
45. Chyu KY, Zhao X, Reyes OS, Babbidge SM, Dimayuga PC, Yano J, Cercek B,
Fredrikson GN, Nilsson J and Shah PK. Immunization using an Apo B-100 related epitope
reduces atherosclerosis and plaque inflammation in hypercholesterolemic apo E (-/-) mice.
Biochem Biophys Res Commun. 2005;338:1982-1989.
Dow
nloaded from http://ahajournals.org by on O
ctober 19, 2018
10.1161/CIRCULATIONAHA.118.034076
25
46. Habets KL, van Puijvelde GH, van Duivenvoorde LM, van Wanrooij EJ, de Vos P,
Tervaert JW, van Berkel TJ, Toes RE and Kuiper J. Vaccination using oxidized low-density
lipoprotein-pulsed dendritic cells reduces atherosclerosis in LDL receptor-deficient mice.
Cardiovasc Res. 2010;85:622-630.
47. Hu D, Mohanta SK, Yin C, Peng L, Ma Z, Srikakulapu P, Grassia G, MacRitchie N,
Dever G, Gordon P, Burton FL, Ialenti A, Sabir SR, McInnes IB, Brewer JM, Garside P, Weber
C, Lehmann T, Teupser D, Habenicht L, Beer M, Grabner R, Maffia P, Weih F and Habenicht
AJ. Artery Tertiary Lymphoid Organs Control Aorta Immunity and Protect against
Atherosclerosis via Vascular Smooth Muscle Cell Lymphotoxin beta Receptors. Immunity.
2015;42:1100-1115.
48. Klingenberg R, Nofer JR, Rudling M, Bea F, Blessing E, Preusch M, Grone HJ, Katus
HA, Hansson GK and Dengler TJ. Sphingosine-1-phosphate analogue FTY720 causes
lymphocyte redistribution and hypercholesterolemia in ApoE-deficient mice. Arterioscler
Thromb Vasc Biol. 2007;27:2392-2399.
49. Shoji T, Nishizawa Y, Fukumoto M, Shimamura K, Kimura J, Kanda H, Emoto M,
Kawagishi T and Morii H. Inverse relationship between circulating oxidized low density
lipoprotein (oxLDL) and anti-oxLDL antibody levels in healthy subjects. Atherosclerosis.
2000;148:171-177.
50. Clement M, Guedj K, Andreata F, Morvan M, Bey L, Khallou-Laschet J, Gaston AT,
Delbosc S, Alsac JM, Bruneval P, Deschildre C, Le Borgne M, Castier Y, Kim HJ, Cantor H,
Michel JB, Caligiuri G and Nicoletti A. Control of the T follicular helper-germinal center B-cell
axis by CD8(+) regulatory T cells limits atherosclerosis and tertiary lymphoid organ
development. Circulation. 2015;131:560-570.
Dow
nloaded from http://ahajournals.org by on O
ctober 19, 2018
10.1161/CIRCULATIONAHA.118.034076
26
Figure Legends
Figure 1. T-cell phenotype in BT transgenic mice.
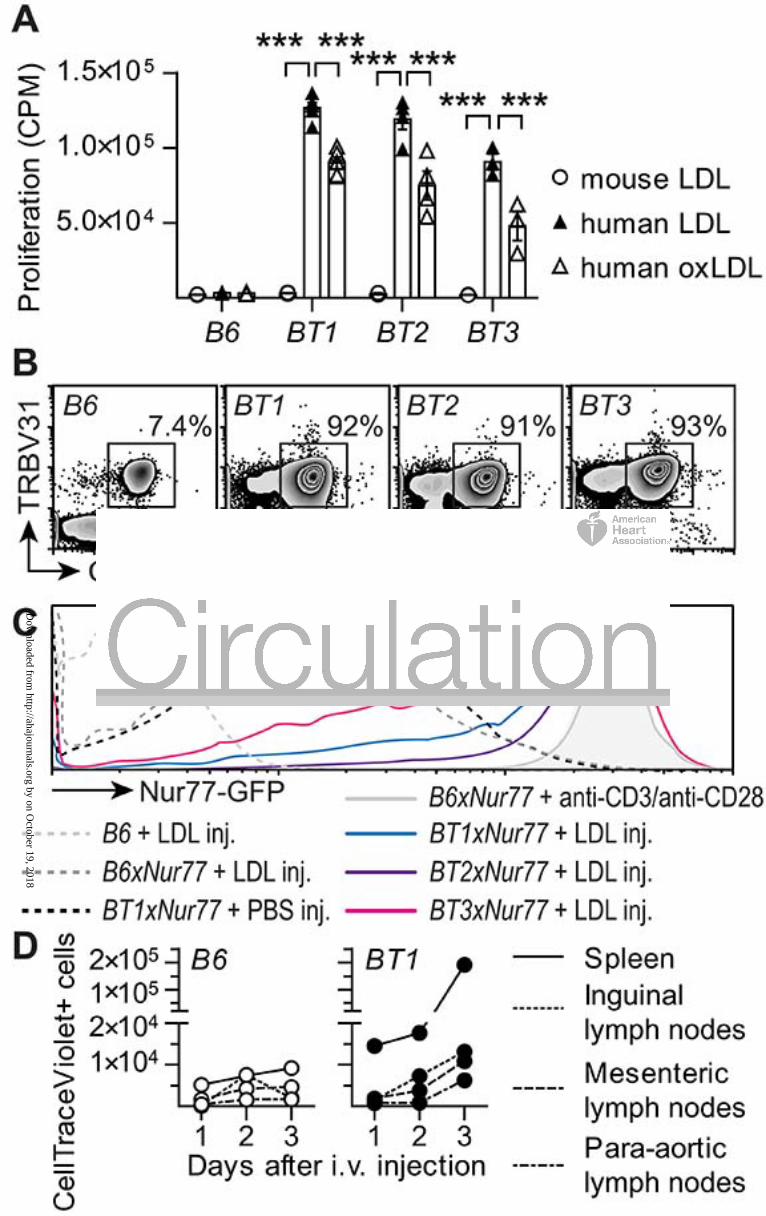
(A) Splenocytes incubated in triplicates with different stimuli for 60 hours in vitro. The mean
proliferation is expressed as counts per minute (CPM) for unstimulated cells and cells stimulated
with 10 µg/ml mouse LDL, human LDL, or oxidized human LDL (B6 n=2-3, BT1 n=3-4, BT2
n=2-4, BT3 n=2-4, 2-way ANOVA with Bonferroni’s post test, dots represent individual mice,
bars show mean ± SEM).
(B) Representative flow cytometry plots of expression of TRBV31 and CD62L in CD4+ T-helper
cells.
(C) Flow cytometry histogram of Nur77-GFP expression in splenic TRBV31+CD3+CD4+
T-helper cells 16 hours after injection (inj) of 100 µg LDL intraperitoneally, showing one
representative experiment of three.
(D) CD4+ T-cell proliferation in HuBL mice. Proliferation of CD4+ T-helper cells labeled with
CellTraceViolet transferred to HuBL recipients that express the antigen for BT1 cells. (HuBL/B6
n=3, HuBL/BT1 n=3, each dot represents a separate organ).
See also Figures S1 and S2.
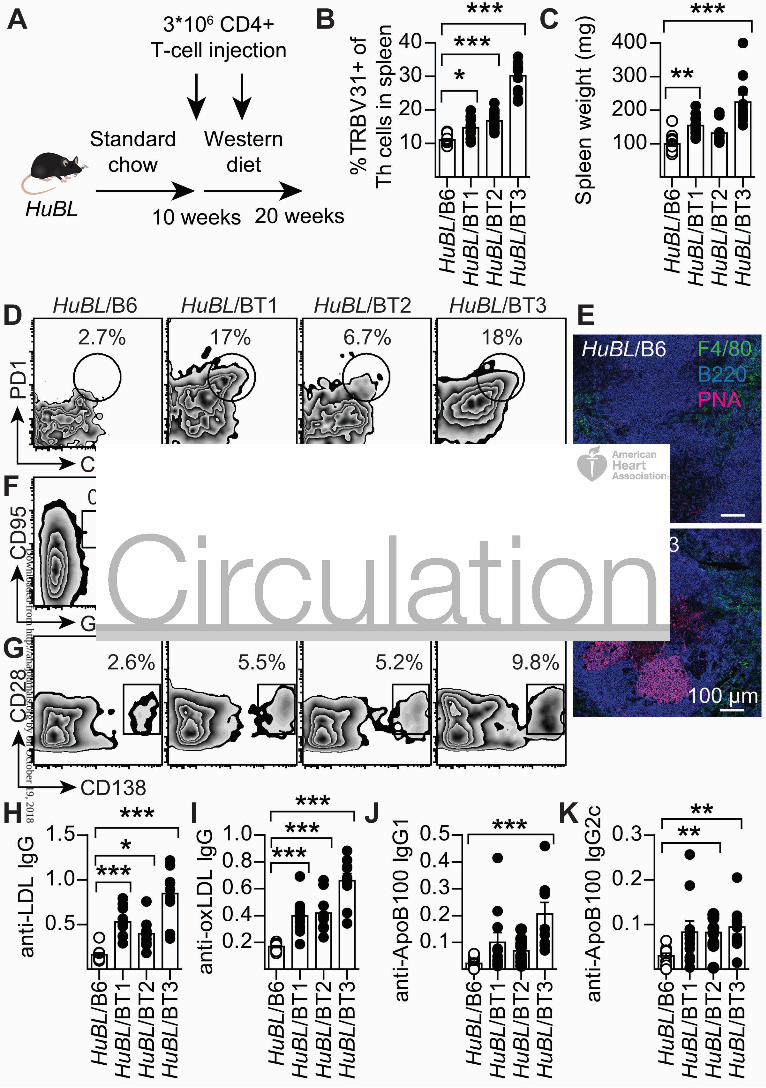
Figure 2. BT cells recognize LDL, develop into Tfh cells, and promote anti-LDL antibody
production.
(A) Experimental design of T-cell transfer experiment.
(B) Proportion TRBV31+ of T-helper cells in spleen (HuBL/B6 n=14, HuBL/BT1 n=11,
HuBL/BT2 n=10, HuBL/BT3 n=11, 1-way ANOVA with Dunnett’s post test)
Dow
nloaded from http://ahajournals.org by on O
ctober 19, 2018
10.1161/CIRCULATIONAHA.118.034076
27
(C) Spleen weight (Kruskal-Wallis test with Dunn’s post test).
(D) Flow cytometry plots of Tfh cell staining showing percentage of PD1+CXCR5+ Tfh cells in
the CD44+CD62L-TRBV31+ Th population.
(E) Immunofluorescence micrographs showing B cells (B220+, blue), germinal centers (PNA+,
pink), and macrophages (F4/80+, green) in spleen, with a 100 µm scale bar.
(F) Flow cytometry plots showing GL7+CD95+ germinal center B cells in the IgDlowCD19+B220+
B-cell population.
(G) Flow cytometry plots of CD138+ plasma cells in the B220low lymphocyte population.
(H) Anti-native LDL IgG antibodies (1:150 dilution, Kruskal-Wallis test with Dunn’s post test).
(H-K) Optical density at 450 nm is shown on y-axis (HuBL/B6 n=12, HuBL/BT1 n=11,
HuBL/BT2 n=10, HuBL/BT3 n=10).
(I) Anti-oxLDL IgG (1:150 dilution, 1-way ANOVA with Dunnett’s post test).
(J-K) Anti-ApoB100 IgG1 and IgG2c (1:15 dilution, Kruskal-Wallis test with Dunn’s post test).
Dots represent individual mice, bars show mean ± SEM. See also Figures S3 and S4.
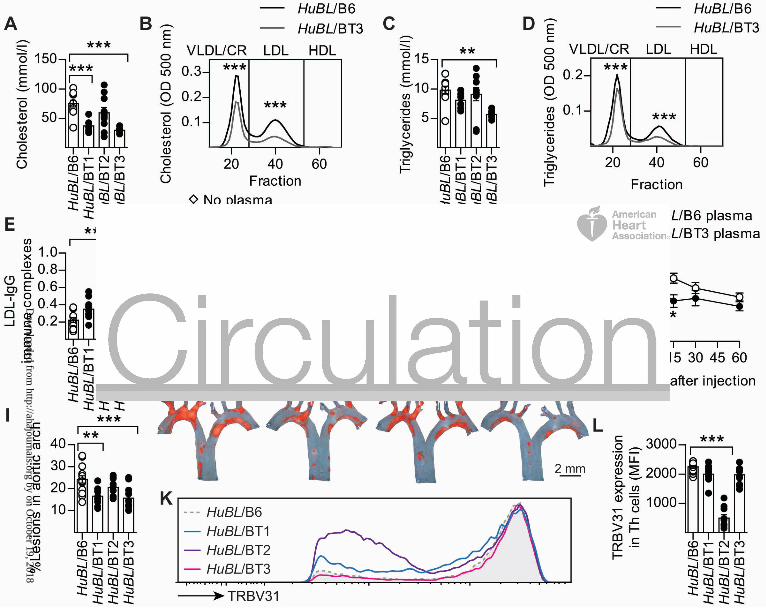
Figure 3. T cell reactivity to LDL leads to reduced plasma lipids, formation of immune
complexes, and reduced atherosclerosis.
(A) Plasma cholesterol at 15 weeks of age, after 5 weeks on Western diet (HuBL/B6 n=11,
HuBL/BT1 n=7, HuBL/BT2 n=10, HuBL/BT3 n=7, 1-way ANOVA with Dunnett’s post test).
(B) Lipoprotein cholesterol profile (CR=Chylomicron remnants, HDL=High-density lipoprotein,
HuBL/B6 n=5, HuBL/BT3 n=5, 2-way ANOVA with Bonferroni’s post test, curve shows mean
values).
(C) Plasma triglycerides (same statistics as in A).
Dow
nloaded from http://ahajournals.org by on O
ctober 19, 2018
10.1161/CIRCULATIONAHA.118.034076
28
(D) Lipoprotein triglyceride profile (same statistics as in B).
(E) Circulating immune complexes with LDL and anti-LDL IgG (optical density 450 nm,
HuBL/B6 n=12, HuBL/BT1 n=11, HuBL/BT2 n=10, HuBL/BT3 n=10, 1:100 dilution, 1-way
ANOVA with Dunnett’s post test).
(F) Uptake of oxLDL measured in RAW264.7 macrophages after 24 hours incubation with 25
µg/ml FITC-labeled oxLDL (No plasma n=6, HuBL/B6 plasma n=6, HuBL/BT3 plasma n=6,
1:100 plasma dilution, Kruskal-Wallis test with Dunn’s post test).
(G) Representative micrographs of hemtoxylin and Oil Red O stained RAW264.7 macrophages
after 24 hours incubation with 25 µg/ml oxLDL.
(H) Clearance of injected FITC-LDL particles pre-treated with either HuBL/B6 or HuBL/BT3
plasma (HuBL/B6 plasma n=9, HuBL/BT3 plasma n=8, 2-way ANOVA with Bonferroni’s post
test, graph shows mean ± SEM).
(I) Atherosclerotic lesion burden in the aortic arch (HuBL/B6 n=14, HuBL/BT1 n=10,
HuBL/BT2 n=10, HuBL/BT3 n=11, 1-way ANOVA with Dunnett’s post test).
(J) En face preparations of aortic arches with lipid-laden plaques stained with Sudan IV (orange
color).
(K) Flow cytometry histogram of TRBV31 expression in CD3+CD4+TRBV31+ lymphocytes to
detect TCR downregulation in mediastinal lymph nodes.
(L) Mean fluorescence intensity (MFI) in T-helper cells (HuBL/B6 n=14, HuBL/BT1 n=12,
HuBL/BT2 n=10, HuBL/BT3 n=12, 1-way ANOVA with Dunnett’s post test).
Dots represent individual mice, bars show mean ± SEM. See also Figure S4.
Dow
nloaded from http://ahajournals.org by on O
ctober 19, 2018
10.1161/CIRCULATIONAHA.118.034076
29
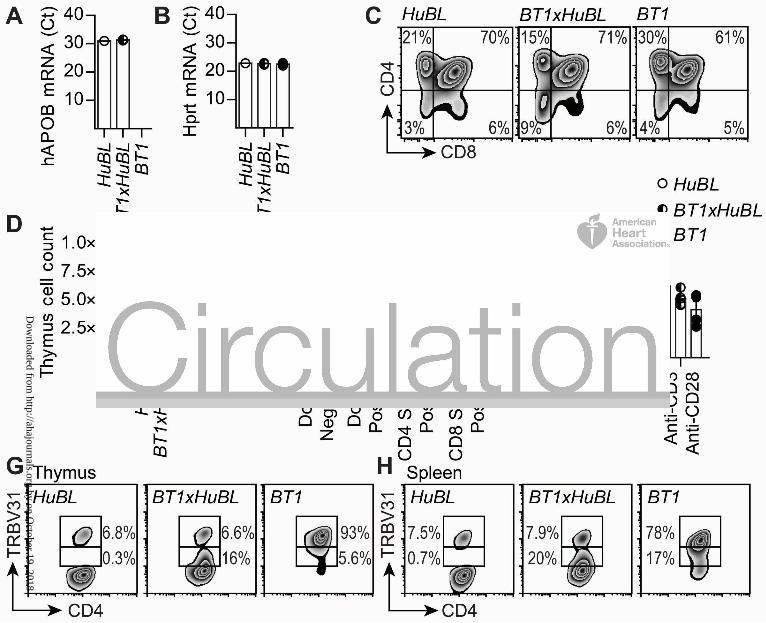
Figure 4. Survival of TRBV31dim T cells in the BT1xHuBL cross.
(A) Human APOB mRNA expression in thymus, expression was not detected in the BT1 strain
lacking the human APOB transgene (Ct values, HuBL n=1, BT1xHuBL n=3, BT1 n=4).
(B) Hprt mRNA levels in thymus, used as house-keeping gene.
(C) Flow cytometry plots showing expression of CD4 and CD8 in thymocytes.
(D) Number of cells in single-cell suspensions of thymus (HuBL n=8, BT1xHuBL n=4, BT1 n=4).
(E) CD4-CD8- double negative, CD4+CD8+ double positive, CD4 single positive, and CD8 single
positive TRBV31+ thymocytes (HuBL n=3, BT1xHuBL n=3, BT1 n=3, 2-way ANOVA with
Bonferroni’s post test).
(F) Proliferation of splenocytes from the indicated strains, stimulated with 10 µg/ml human LDL
or anti-CD3/anti-CD28 (HuBL n=7, BT1xHuBL n=5, BT1 n=4). Stimulation index is calculated
as fold change of CPM over unstimulated cells.
(G) Flow cytometry plots showing TRBV31 expression by CD4-single positive thymocytes in
10-week-old animals.
(H) Flow cytometry plots of TRBV31 expression in spleen CD4+ T cells, 10-week-old animals.
Dots represent individual mice, bars show mean ± SEM. See also Figure S5.
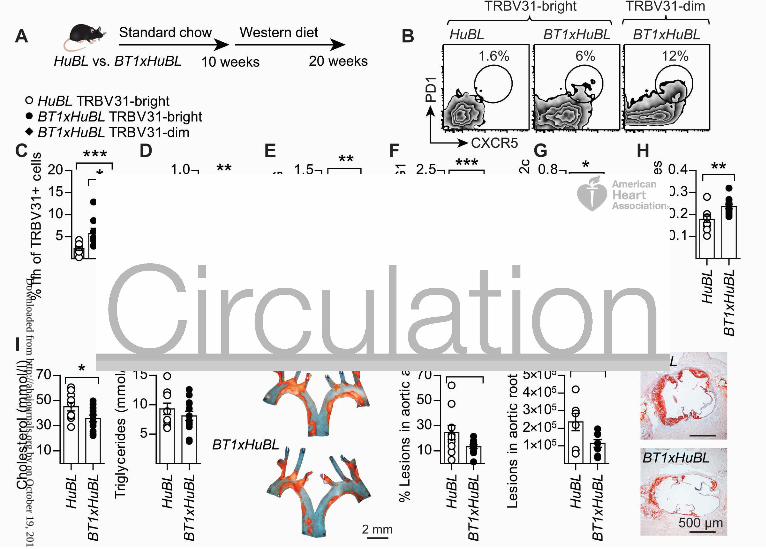
Figure 5. Induction of anti-LDL antibodies and protection against atherosclerosis in the
BT1xHuBL cross.
(A) Design of diet experiment with compound mutant mice.
(B) Representative flow cytometry plots of Tfh cell staining in the TRBV31bright and TRBV31dim
populations.
(C) PD1+CXCR5+ Tfh cells in the CD44+CD62L-TRBV31+ Th population. (HuBL n=7,
Dow
nloaded from http://ahajournals.org by on O
ctober 19, 2018
10.1161/CIRCULATIONAHA.118.034076
30
BT1xHuBL n=8, 1-way ANOVA with Bonferroni’s post test).
(D) Plasma anti-LDL IgG (HuBL n=9, BT1xHuBL n=12, 1:15 dilution, Student’s t-test,).
(D-H) Optical density at 450 nm is shown on y-axis.
(E) Anti-oxLDL IgG (HuBL n=10, BT1xHuBL n=12, 1:15 dilution, Student’s t-test)
(F-G) Anti-ApoB100 IgG1 and IgG2c (HuBL n=10, BT1xHuBL n=12, 1:15 dilution, Mann-
Whitney test).
(H) Circulating immune complexes with LDL and anti-LDL IgG (HuBL n=10, BT1xHuBL n=12,
1:100 dilution, Student’s t-test).
(I-J) Plasma cholesterol and triglycerides at 20 weeks of age (HuBL n=10, BT1xHuBL n=12,
Student’s t-test).
(K) En face preparations of aortic arches with lipid-laden plaques stained with Sudan IV (orange
color).
(L) Atherosclerotic burden in in aortic arch (HuBL n=10, BT1xHuBL n=12, Student’s t-test).
(M) Mean lesion area in the aortic root (HuBL n=7, BT1xHuBL n=8, Student’s t-test).
(N) Micrographs show Oil Red O staining of neutral lipids (red color) in cross-sections of the
aortic root.
Dots represent individual mice, bars show mean ± SEM. See also Figures S5 and S6.
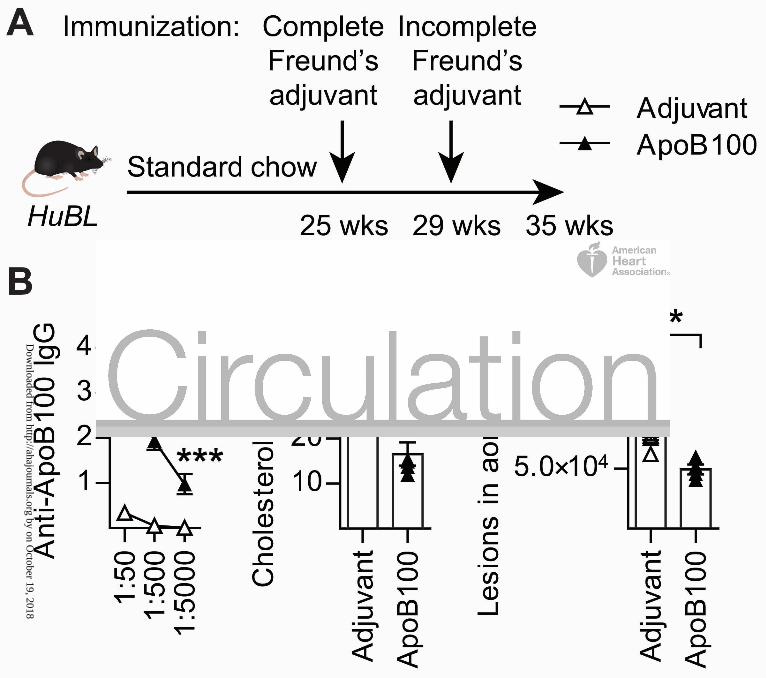
Figure 6. Lipid-lowering and atheroprotective ApoB100 vaccination.
(A) Experimental design of ApoB100 vaccination in HuBL mice.
(B) Anti-ApoB100 IgG titers, optical density at 450 nm on y-axis (HuBL mice; PBS-adjuvant
n=6, ApoB100-adjuvant n=5, 2-way ANOVA with Bonferroni’s multiple comparison test).
(C) Plasma cholesterol levels at 35 weeks of age (HuBL mice; PBS-adjuvant n=6, ApoB100-
Dow
nloaded from http://ahajournals.org by on O
ctober 19, 2018
10.1161/CIRCULATIONAHA.118.034076
31
adjuvant n=5; Mann-Whitney test).
(C-D) Triangles represent individual mice and bars show mean ± SEM.
(D) Mean atherosclerotic lesion area in the aortic root (HuBL mice; PBS-adjuvant n=5,
ApoB100-adjuvant n=4; Mann-Whitney test). See also Figure S7.
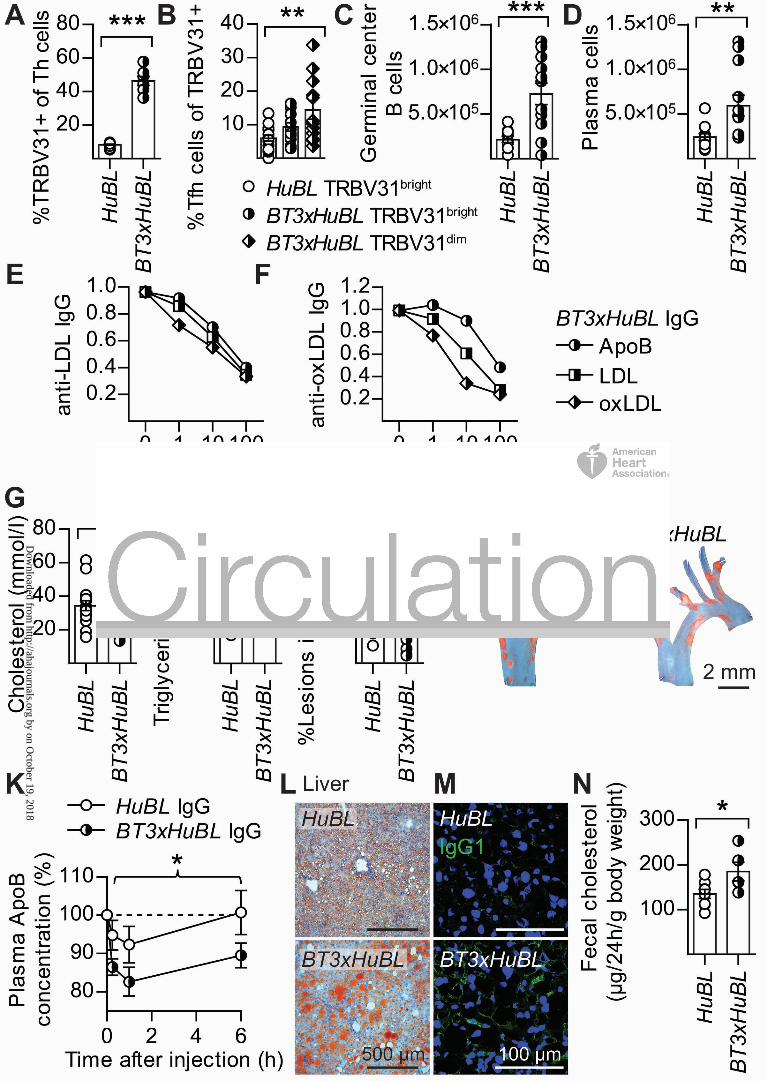
Figure 7. Lipid-lowering antibodies and reduced atherosclerosis in BT3xHuBL mice.
(A) TRBV31+ T-helper cells in spleen (HuBL n=16, BT3xHuBL n=7, Mann-Whitney test).
(B) PD1+CXCR5+ Tfh cells in the CD44+CD62L-TRBV31+ Th population (HuBL n=7,
BT3xHuBL n=8, 1-way ANOVA with Bonferroni’s post test).
(C) GL7+CD95+IgDlow germinal center B cells (HuBL n=11, BT3xHuBL n=12, Student’s t-test).
(D) CD138+ plasma cells (HuBL n=11, BT3xHuBL n=12, Mann-Whitney test).
(E) Competition assay for evaluation of anti-LDL IgG specificity in total IgG isolated from
BT3xHuBL mice (n=4, 2-way ANOVA with Bonferroni’s post test, significant competition by all
three competitors).
(F) Competition assay for evaluation of anti-oxLDL IgG specificity in total IgG isolated from
BT3xHuBL mice (n=4, 2-way ANOVA with Bonferroni’s post test, significant competition by all
three competitors).
(G) Plasma cholesterol (HuBL n=16, BT3xHuBL n=12, Student’s t-test).
(H) Plasma triglycerides (HuBL n=16, BT3xHuBL n=12, Mann-Whitney test).
(I) Atherosclerotic burden in in aortic arch (HuBL n=16, BT3xHuBL n=12, Student’s t-test).
(J) En face preparations of the aortic arch with lipid-laden plaques stained with Sudan IV (orange
color).
(K) ApoB measured in plasma at different time points after infusion of 200 μg IgG antibodies
Dow
nloaded from http://ahajournals.org by on O
ctober 19, 2018
10.1161/CIRCULATIONAHA.118.034076
32
(HuBL mice; HuBL IgG n=4, BT3xHuBL IgG n=6, 2-way ANOVA, braces indicate significance
level for treatment comparison, graph shows mean ± SEM).
(L) Micrographs of Oil Red O-stained liver sections with a 500 µm scale bar.
(M) Immunofluorescence micrographs showing IgG1 (green) and cell nuclei (DAPI+, blue) in
liver, with a 100 µm scale bar.
(N) Cholesterol measured in lipid extracts from feces (HuBL n=8, BT3xHuBL n=5, Student’s t-
test, each dot represent one cage).
(A-D) and (G-I) Dots represent individual mice, bars show mean ± SEM. See also Figure S8.
Dow
nloaded from http://ahajournals.org by on O
ctober 19, 2018
Dow
nloaded from http://ahajournals.org by on O
ctober 19, 2018
Dow
nloaded from http://ahajournals.org by on O
ctober 19, 2018
Dow
nloaded from http://ahajournals.org by on O
ctober 19, 2018
Dow
nloaded from http://ahajournals.org by on O
ctober 19, 2018
Dow
nloaded from http://ahajournals.org by on O
ctober 19, 2018
Dow
nloaded from http://ahajournals.org by on O
ctober 19, 2018
Dow
nloaded from http://ahajournals.org by on O
ctober 19, 2018
SUPPLEMENTAL MATERIAL
LDL-reactive T cells regulate plasma cholesterol levels and development of
atherosclerosis in humanized hypercholesterolemic mice
Anton Gisterå, MD, PhD, Maria L. Klement, PhD, Konstantinos A. Polyzos, MD, Reiner K.
Mailer, PhD, Amanda Duhlin, PhD, Mikael C.I. Karlsson, PhD, Daniel F.J. Ketelhuth, PhD,
Göran K. Hansson, MD, PhD
The PDF file includes:
Supplemental Figures
Figure S1. Phenotype of BT transgenic mice.
Figure S2. CD4+ BT-cell proliferation in HuBL mice.
Figure S3. Cell populations in spleens of HuBL mice injected with CD4+ BT cells.
Figure S4. Antibodies and lipid distribution in HuBL mice injected with CD4+ BT cells.
Figure S5. T-helper cell phenotype and antibodies in BT1xHuBL mice.
Figure S6. Lipid distribution and atherosclerotic plaque composition in BT1xHuBL mice.
Figure S7. Phenotype of ApoB100-vaccinated HuBL mice.
Figure S8. Characterization of BT3xHuBL mice.
Supplemental Tables
Table S1. Phenotype of HuBL mice injected with CD4+ BT cells.
Table S2. mRNA levels in organs of HuBL mice injected with CD4+ BT cells.
Table S3. Phenotype of HuBL vs. BT1xHuBL mice.
Table S4. mRNA levels in organs of HuBL vs. BT1xHuBL mice.
Table S5. Phenotype of HuBL vs. BT3xHuBL mice.
Supplemental Methods
List of antibodies used for flow cytometry analysis.
Gisterå et al.
2
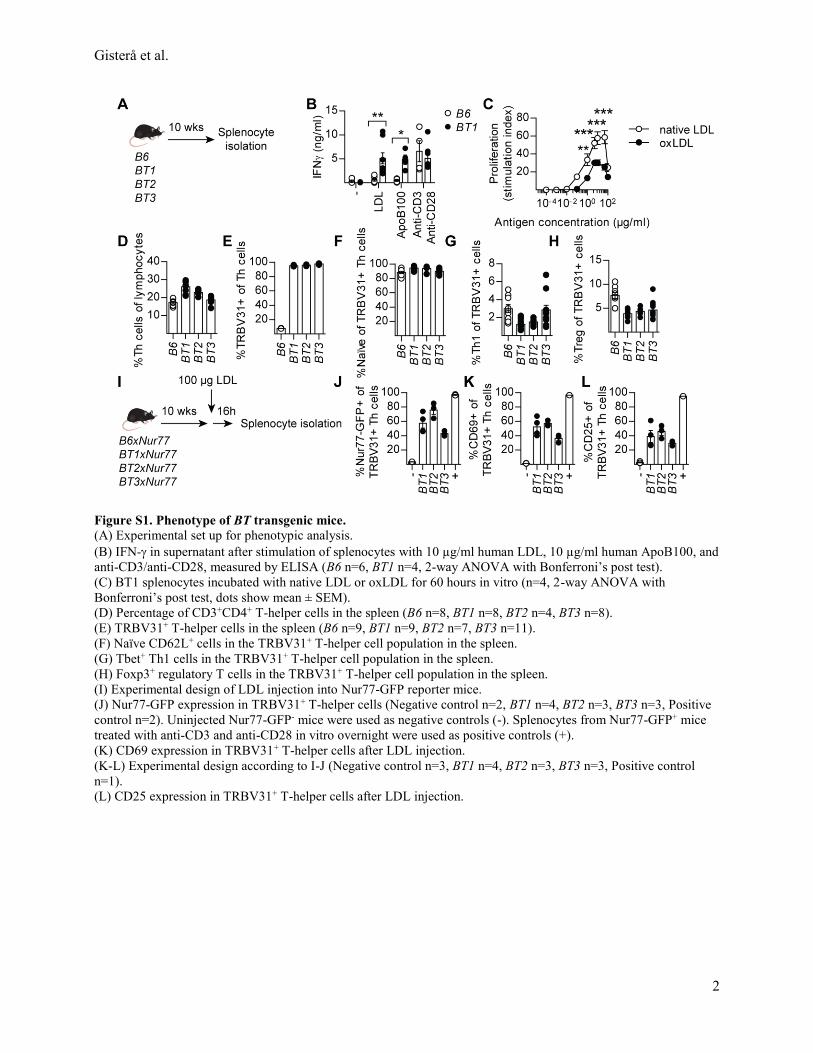
Figure S1. Phenotype of BT transgenic mice. (A) Experimental set up for phenotypic analysis.
(B) IFN- in supernatant after stimulation of splenocytes with 10 µg/ml human LDL, 10 µg/ml human ApoB100, and
anti-CD3/anti-CD28, measured by ELISA (B6 n=6, BT1 n=4, 2-way ANOVA with Bonferroni’s post test).
(C) BT1 splenocytes incubated with native LDL or oxLDL for 60 hours in vitro (n=4, 2-way ANOVA with
Bonferroni’s post test, dots show mean ± SEM).
(D) Percentage of CD3+CD4+ T-helper cells in the spleen (B6 n=8, BT1 n=8, BT2 n=4, BT3 n=8).
(E) TRBV31+ T-helper cells in the spleen (B6 n=9, BT1 n=9, BT2 n=7, BT3 n=11).
(F) Naïve CD62L+ cells in the TRBV31+ T-helper cell population in the spleen.
(G) Tbet+ Th1 cells in the TRBV31+ T-helper cell population in the spleen.
(H) Foxp3+ regulatory T cells in the TRBV31+ T-helper cell population in the spleen.
(I) Experimental design of LDL injection into Nur77-GFP reporter mice.
(J) Nur77-GFP expression in TRBV31+ T-helper cells (Negative control n=2, BT1 n=4, BT2 n=3, BT3 n=3, Positive
control n=2). Uninjected Nur77-GFP- mice were used as negative controls (-). Splenocytes from Nur77-GFP+ mice
treated with anti-CD3 and anti-CD28 in vitro overnight were used as positive controls (+).
(K) CD69 expression in TRBV31+ T-helper cells after LDL injection.
(K-L) Experimental design according to I-J (Negative control n=3, BT1 n=4, BT2 n=3, BT3 n=3, Positive control
n=1).
(L) CD25 expression in TRBV31+ T-helper cells after LDL injection.
Gisterå et al.
3
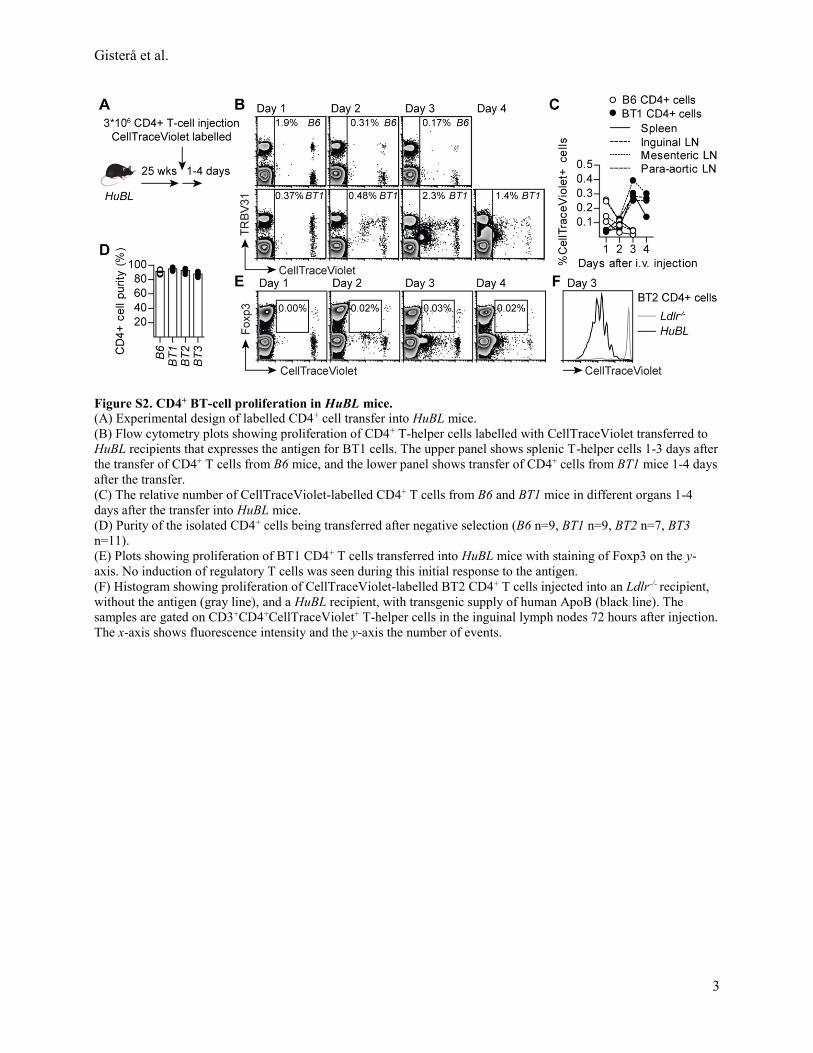
Figure S2. CD4+ BT-cell proliferation in HuBL mice. (A) Experimental design of labelled CD4+ cell transfer into HuBL mice.
(B) Flow cytometry plots showing proliferation of CD4+ T-helper cells labelled with CellTraceViolet transferred to
HuBL recipients that expresses the antigen for BT1 cells. The upper panel shows splenic T-helper cells 1-3 days after
the transfer of CD4+ T cells from B6 mice, and the lower panel shows transfer of CD4+ cells from BT1 mice 1-4 days
after the transfer.
(C) The relative number of CellTraceViolet-labelled CD4+ T cells from B6 and BT1 mice in different organs 1-4
days after the transfer into HuBL mice.
(D) Purity of the isolated CD4+ cells being transferred after negative selection (B6 n=9, BT1 n=9, BT2 n=7, BT3
n=11).
(E) Plots showing proliferation of BT1 CD4+ T cells transferred into HuBL mice with staining of Foxp3 on the y-
axis. No induction of regulatory T cells was seen during this initial response to the antigen.
(F) Histogram showing proliferation of CellTraceViolet-labelled BT2 CD4+ T cells injected into an Ldlr-/- recipient,
without the antigen (gray line), and a HuBL recipient, with transgenic supply of human ApoB (black line). The
samples are gated on CD3+CD4+CellTraceViolet+ T-helper cells in the inguinal lymph nodes 72 hours after injection.
The x-axis shows fluorescence intensity and the y-axis the number of events.
Gisterå et al.
4
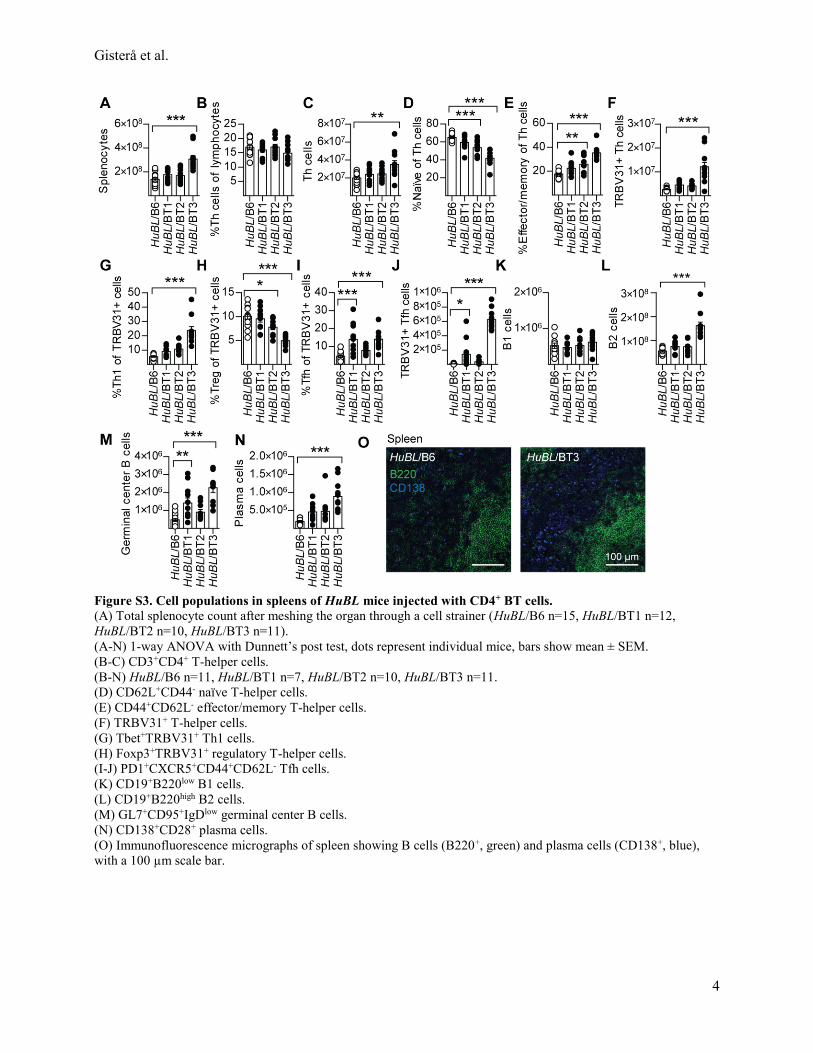
Figure S3. Cell populations in spleens of HuBL mice injected with CD4+ BT cells.
(A) Total splenocyte count after meshing the organ through a cell strainer (HuBL/B6 n=15, HuBL/BT1 n=12,
HuBL/BT2 n=10, HuBL/BT3 n=11).
(A-N) 1-way ANOVA with Dunnett’s post test, dots represent individual mice, bars show mean ± SEM.
(B-C) CD3+CD4+ T-helper cells.
(B-N) HuBL/B6 n=11, HuBL/BT1 n=7, HuBL/BT2 n=10, HuBL/BT3 n=11.
(D) CD62L+CD44- naïve T-helper cells.
(E) CD44+CD62L- effector/memory T-helper cells.
(F) TRBV31+ T-helper cells.
(G) Tbet+TRBV31+ Th1 cells.
(H) Foxp3+TRBV31+ regulatory T-helper cells.
(I-J) PD1+CXCR5+CD44+CD62L- Tfh cells.
(K) CD19+B220low B1 cells.
(L) CD19+B220high B2 cells.
(M) GL7+CD95+IgDlow germinal center B cells.
(N) CD138+CD28+ plasma cells.
(O) Immunofluorescence micrographs of spleen showing B cells (B220+, green) and plasma cells (CD138+, blue),
with a 100 µm scale bar.
Gisterå et al.
5
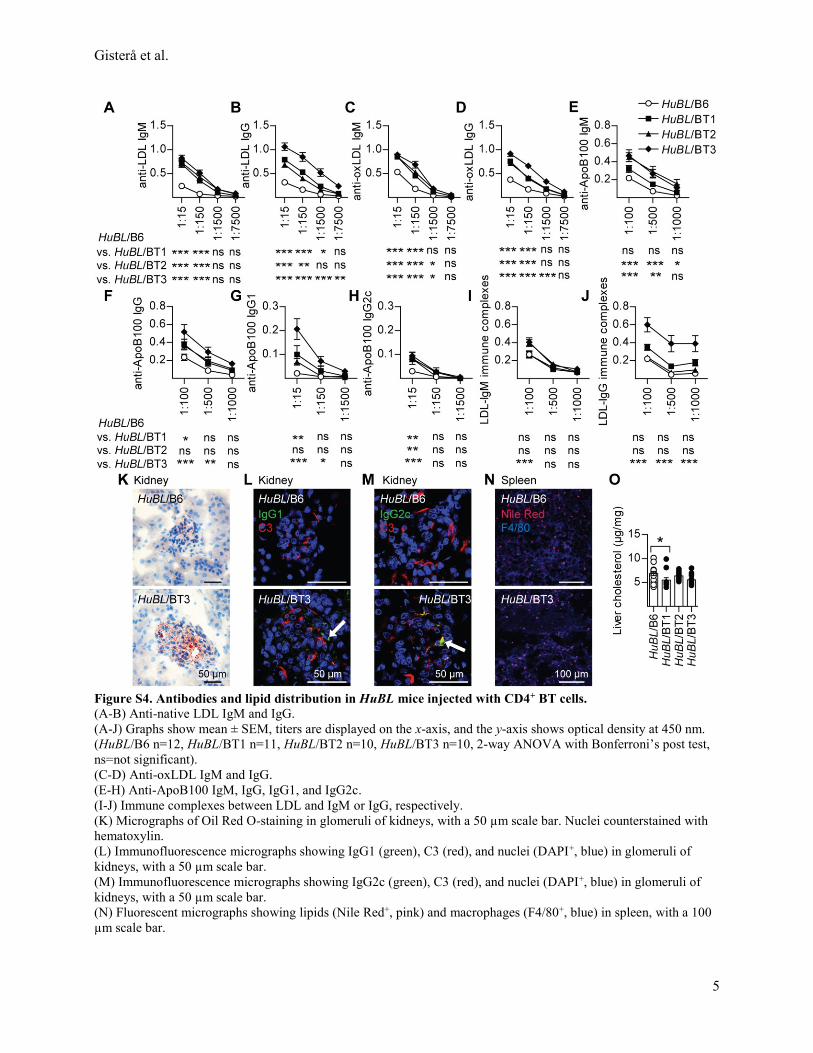
Figure S4. Antibodies and lipid distribution in HuBL mice injected with CD4+ BT cells. (A-B) Anti-native LDL IgM and IgG.
(A-J) Graphs show mean ± SEM, titers are displayed on the x-axis, and the y-axis shows optical density at 450 nm.
(HuBL/B6 n=12, HuBL/BT1 n=11, HuBL/BT2 n=10, HuBL/BT3 n=10, 2-way ANOVA with Bonferroni’s post test,
ns=not significant).
(C-D) Anti-oxLDL IgM and IgG.
(E-H) Anti-ApoB100 IgM, IgG, IgG1, and IgG2c.
(I-J) Immune complexes between LDL and IgM or IgG, respectively.
(K) Micrographs of Oil Red O-staining in glomeruli of kidneys, with a 50 µm scale bar. Nuclei counterstained with
hematoxylin.
(L) Immunofluorescence micrographs showing IgG1 (green), C3 (red), and nuclei (DAPI+, blue) in glomeruli of
kidneys, with a 50 µm scale bar.
(M) Immunofluorescence micrographs showing IgG2c (green), C3 (red), and nuclei (DAPI+, blue) in glomeruli of
kidneys, with a 50 µm scale bar.
(N) Fluorescent micrographs showing lipids (Nile Red+, pink) and macrophages (F4/80+, blue) in spleen, with a 100
µm scale bar.

Gisterå et al.
6
(O) Cholesterol content in liver tissue extracts (HuBL/B6 n=14, HuBL/BT1 n=12, HuBL/BT2 n=9, HuBL/BT3 n=12,
Kruskal-Wallis test with Dunn’s post test).
Gisterå et al.
7
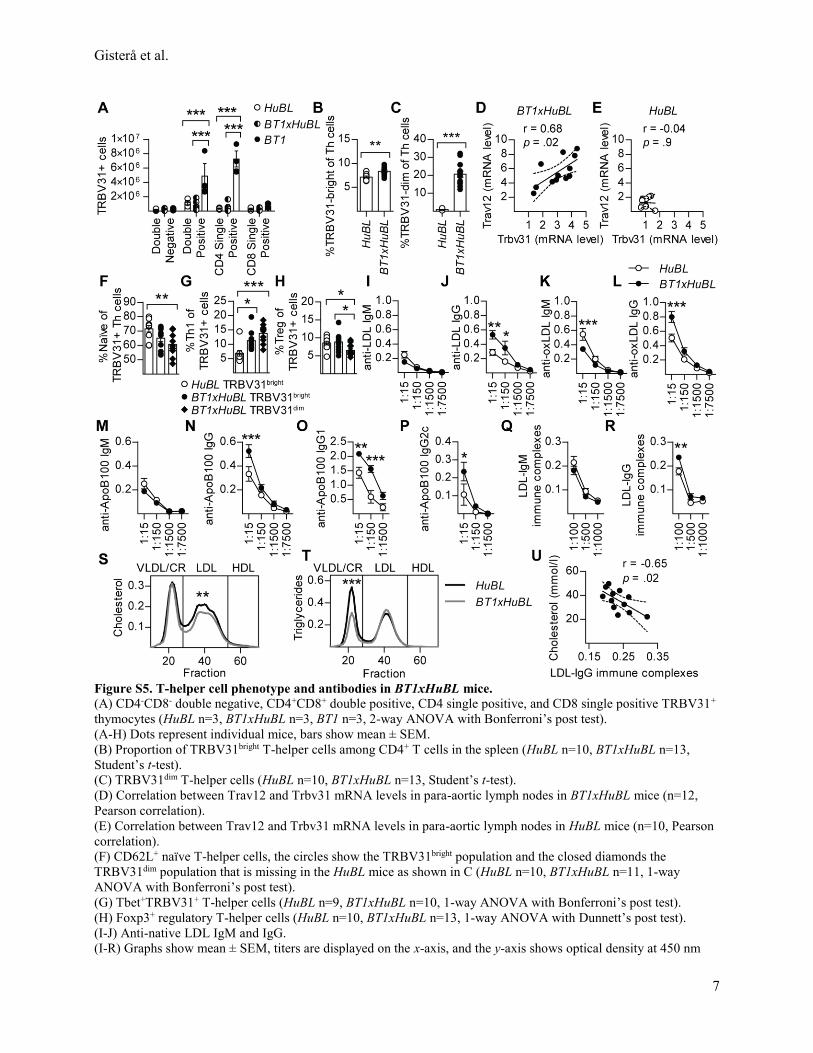
Figure S5. T-helper cell phenotype and antibodies in BT1xHuBL mice.
(A) CD4-CD8- double negative, CD4+CD8+ double positive, CD4 single positive, and CD8 single positive TRBV31+
thymocytes (HuBL n=3, BT1xHuBL n=3, BT1 n=3, 2-way ANOVA with Bonferroni’s post test).
(A-H) Dots represent individual mice, bars show mean ± SEM.
(B) Proportion of TRBV31bright T-helper cells among CD4+ T cells in the spleen (HuBL n=10, BT1xHuBL n=13,
Student’s t-test).
(C) TRBV31dim T-helper cells (HuBL n=10, BT1xHuBL n=13, Student’s t-test).
(D) Correlation between Trav12 and Trbv31 mRNA levels in para-aortic lymph nodes in BT1xHuBL mice (n=12,
Pearson correlation).
(E) Correlation between Trav12 and Trbv31 mRNA levels in para-aortic lymph nodes in HuBL mice (n=10, Pearson
correlation).
(F) CD62L+ naïve T-helper cells, the circles show the TRBV31bright population and the closed diamonds the
TRBV31dim population that is missing in the HuBL mice as shown in C (HuBL n=10, BT1xHuBL n=11, 1-way
ANOVA with Bonferroni’s post test).
(G) Tbet+TRBV31+ T-helper cells (HuBL n=9, BT1xHuBL n=10, 1-way ANOVA with Bonferroni’s post test).
(H) Foxp3+ regulatory T-helper cells (HuBL n=10, BT1xHuBL n=13, 1-way ANOVA with Dunnett’s post test).
(I-J) Anti-native LDL IgM and IgG.
(I-R) Graphs show mean ± SEM, titers are displayed on the x-axis, and the y-axis shows optical density at 450 nm

Gisterå et al.
8
(HuBL n=10, BT1xHuBL n=12, 2-way ANOVA with Bonferroni’s post test).
(K-L) Anti-oxLDL IgM and IgG.
(M-P) Anti-ApoB100 IgM, IgG, IgG1, and IgG2c.
(Q-R) Immune complexes between LDL and IgM or IgG, respectively.
(S-T) Lipoprotein cholesterol and triglyceride profiles (HuBL n=5, HuBLxBT1 n=5, 2-way ANOVA with
Bonferroni’s post test, curve shows mean values).
(U) Correlation between plasma cholesterol and LDL-IgG immune complexes in BT1xHuBL mice (n=12, Pearson
correlation).
Gisterå et al.
9
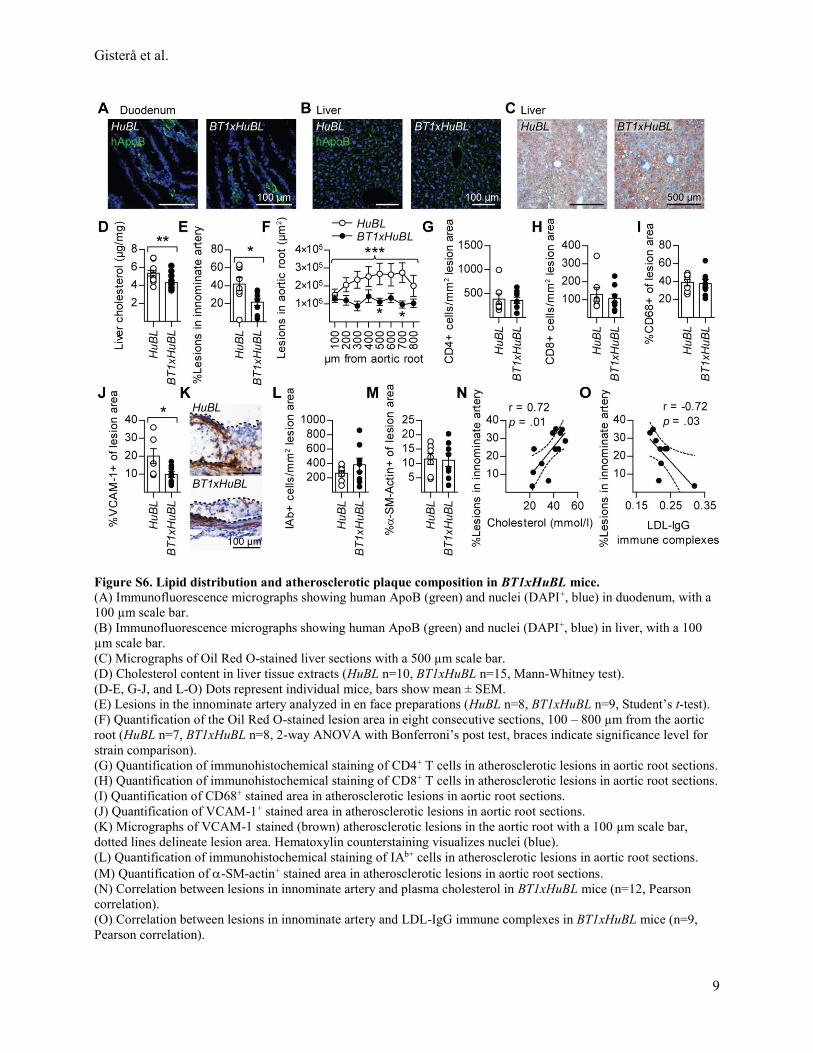
Figure S6. Lipid distribution and atherosclerotic plaque composition in BT1xHuBL mice. (A) Immunofluorescence micrographs showing human ApoB (green) and nuclei (DAPI+, blue) in duodenum, with a
100 µm scale bar.
(B) Immunofluorescence micrographs showing human ApoB (green) and nuclei (DAPI+, blue) in liver, with a 100
µm scale bar.
(C) Micrographs of Oil Red O-stained liver sections with a 500 µm scale bar.
(D) Cholesterol content in liver tissue extracts (HuBL n=10, BT1xHuBL n=15, Mann-Whitney test).
(D-E, G-J, and L-O) Dots represent individual mice, bars show mean ± SEM.
(E) Lesions in the innominate artery analyzed in en face preparations (HuBL n=8, BT1xHuBL n=9, Student’s t-test).
(F) Quantification of the Oil Red O-stained lesion area in eight consecutive sections, 100 – 800 µm from the aortic
root (HuBL n=7, BT1xHuBL n=8, 2-way ANOVA with Bonferroni’s post test, braces indicate significance level for
strain comparison).
(G) Quantification of immunohistochemical staining of CD4+ T cells in atherosclerotic lesions in aortic root sections.
(H) Quantification of immunohistochemical staining of CD8+ T cells in atherosclerotic lesions in aortic root sections.
(I) Quantification of CD68+ stained area in atherosclerotic lesions in aortic root sections.
(J) Quantification of VCAM-1+ stained area in atherosclerotic lesions in aortic root sections.
(K) Micrographs of VCAM-1 stained (brown) atherosclerotic lesions in the aortic root with a 100 µm scale bar,
dotted lines delineate lesion area. Hematoxylin counterstaining visualizes nuclei (blue).
(L) Quantification of immunohistochemical staining of IAb+ cells in atherosclerotic lesions in aortic root sections.
(M) Quantification of -SM-actin+ stained area in atherosclerotic lesions in aortic root sections.
(N) Correlation between lesions in innominate artery and plasma cholesterol in BT1xHuBL mice (n=12, Pearson
correlation).
(O) Correlation between lesions in innominate artery and LDL-IgG immune complexes in BT1xHuBL mice (n=9,
Pearson correlation).
Gisterå et al.
10
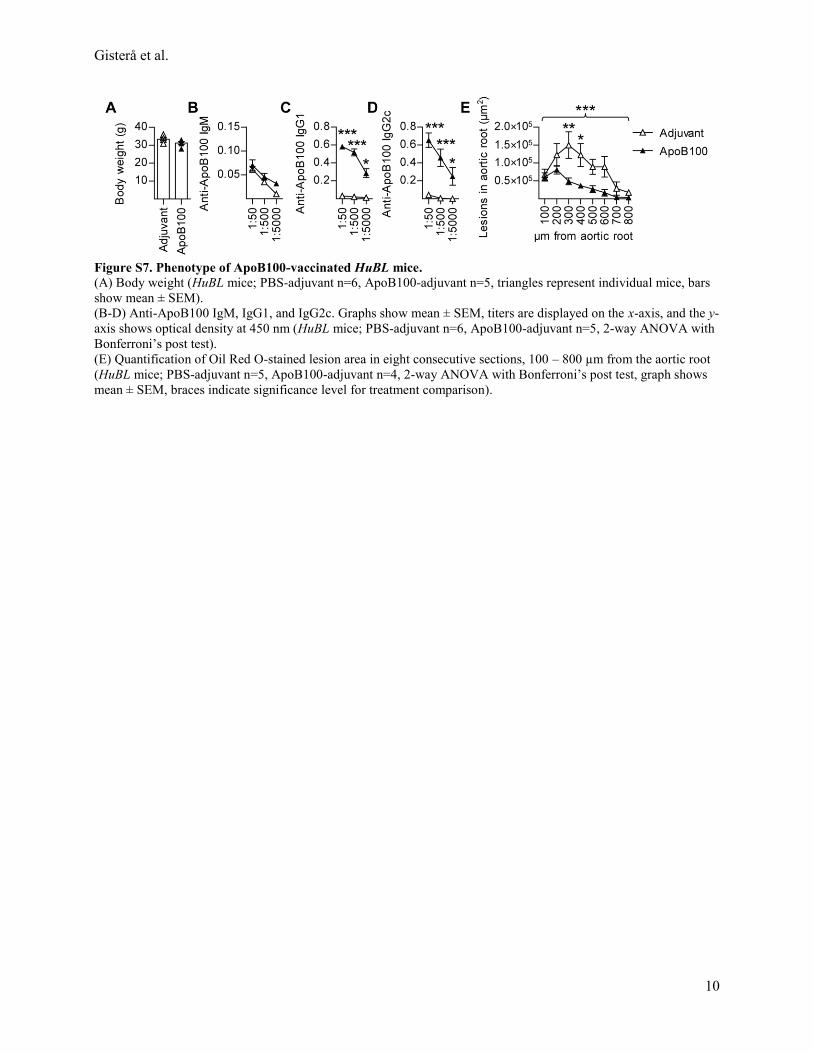
Figure S7. Phenotype of ApoB100-vaccinated HuBL mice.
(A) Body weight (HuBL mice; PBS-adjuvant n=6, ApoB100-adjuvant n=5, triangles represent individual mice, bars
show mean ± SEM).
(B-D) Anti-ApoB100 IgM, IgG1, and IgG2c. Graphs show mean ± SEM, titers are displayed on the x-axis, and the y-
axis shows optical density at 450 nm (HuBL mice; PBS-adjuvant n=6, ApoB100-adjuvant n=5, 2-way ANOVA with
Bonferroni’s post test).
(E) Quantification of Oil Red O-stained lesion area in eight consecutive sections, 100 – 800 µm from the aortic root
(HuBL mice; PBS-adjuvant n=5, ApoB100-adjuvant n=4, 2-way ANOVA with Bonferroni’s post test, graph shows
mean ± SEM, braces indicate significance level for treatment comparison).
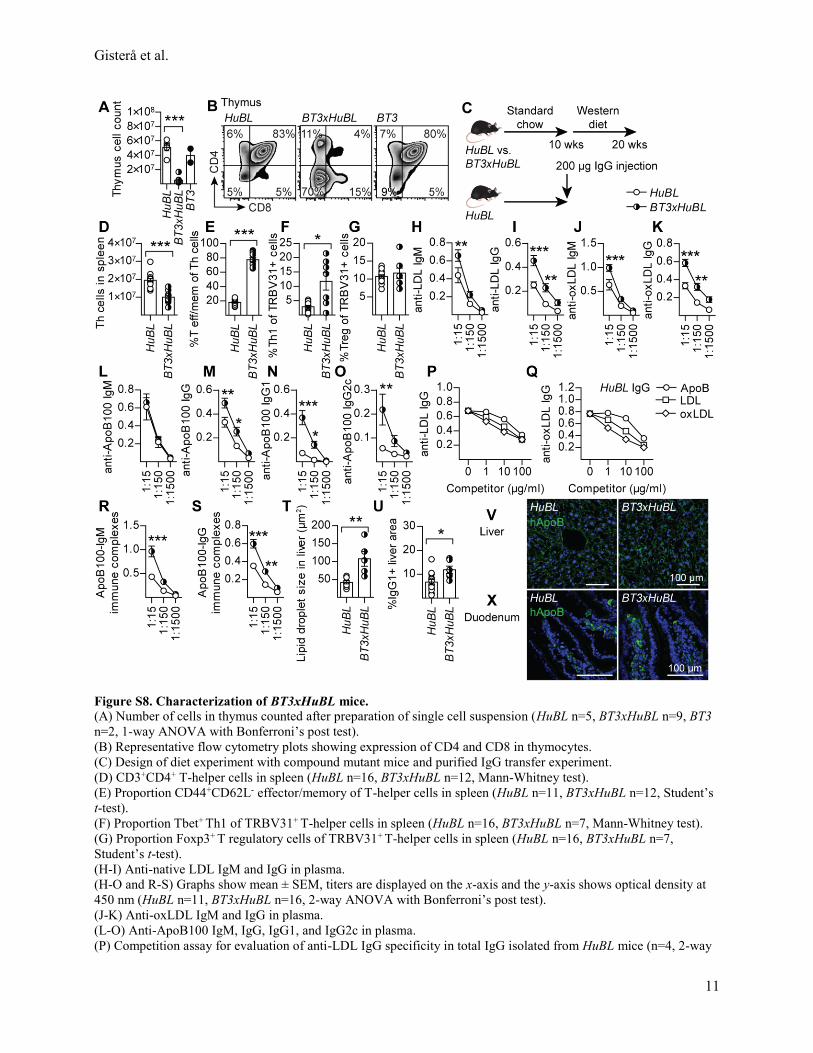
Gisterå et al.
11
Figure S8. Characterization of BT3xHuBL mice.
(A) Number of cells in thymus counted after preparation of single cell suspension (HuBL n=5, BT3xHuBL n=9, BT3
n=2, 1-way ANOVA with Bonferroni’s post test).
(B) Representative flow cytometry plots showing expression of CD4 and CD8 in thymocytes.
(C) Design of diet experiment with compound mutant mice and purified IgG transfer experiment.
(D) CD3+CD4+ T-helper cells in spleen (HuBL n=16, BT3xHuBL n=12, Mann-Whitney test).
(E) Proportion CD44+CD62L- effector/memory of T-helper cells in spleen (HuBL n=11, BT3xHuBL n=12, Student’s
t-test).
(F) Proportion Tbet+ Th1 of TRBV31+ T-helper cells in spleen (HuBL n=16, BT3xHuBL n=7, Mann-Whitney test).
(G) Proportion Foxp3+ T regulatory cells of TRBV31+ T-helper cells in spleen (HuBL n=16, BT3xHuBL n=7,
Student’s t-test).
(H-I) Anti-native LDL IgM and IgG in plasma.
(H-O and R-S) Graphs show mean ± SEM, titers are displayed on the x-axis and the y-axis shows optical density at
450 nm (HuBL n=11, BT3xHuBL n=16, 2-way ANOVA with Bonferroni’s post test).
(J-K) Anti-oxLDL IgM and IgG in plasma.
(L-O) Anti-ApoB100 IgM, IgG, IgG1, and IgG2c in plasma.
(P) Competition assay for evaluation of anti-LDL IgG specificity in total IgG isolated from HuBL mice (n=4, 2-way
Gisterå et al.
12
ANOVA with Bonferroni’s post test, significant competition by all three competitors).
(Q) Competition assay for evaluation of anti-oxLDL IgG specificity in total IgG isolated from HuBL mice (n=4, 2-
way ANOVA with Bonferroni’s post test, significant competition by all three competitors).
(R-S) Immune complexes between LDL and IgM or IgG, respectively.
(T) Quantification of average Oil Red O+ lipid droplet size in liver sections (HuBL n=9, BT3xHuBL n=5, Mann-
Whitney test).
(U) Quantification of IgG1+ stained area in liver sections (HuBL n=13, BT3xHuBL n=6, Student’s t-test).
(V) Immunofluorescence micrographs showing human ApoB (green) and nuclei (DAPI+, blue) in liver, with a 100
µm scale bar.
(X) Immunofluorescence micrographs showing human ApoB (green) and nuclei (DAPI+, blue) in duodenum, with a
100 µm scale bar.
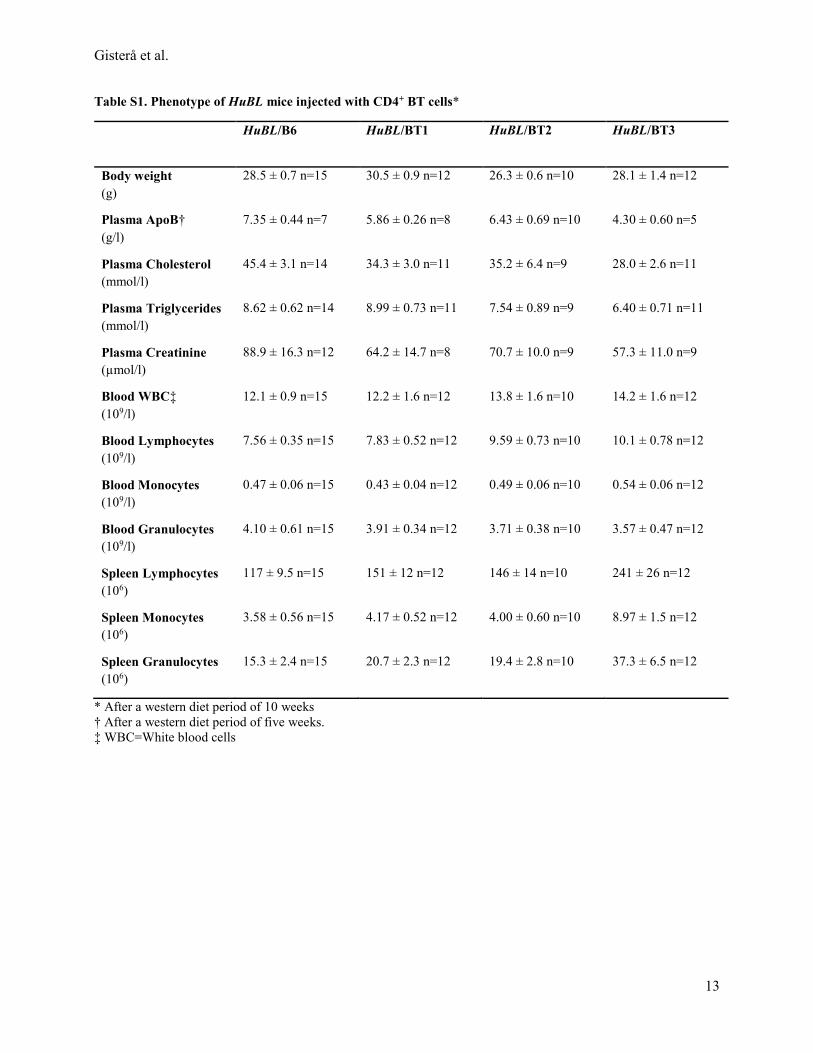
Gisterå et al.
13
Table S1. Phenotype of HuBL mice injected with CD4+ BT cells*
HuBL/B6 HuBL/BT1 HuBL/BT2 HuBL/BT3
Body weight
(g)
28.5 ± 0.7 n=15 30.5 ± 0.9 n=12 26.3 ± 0.6 n=10 28.1 ± 1.4 n=12
Plasma ApoB†
(g/l)
7.35 ± 0.44 n=7 5.86 ± 0.26 n=8 6.43 ± 0.69 n=10 4.30 ± 0.60 n=5
Plasma Cholesterol
(mmol/l)
45.4 ± 3.1 n=14 34.3 ± 3.0 n=11 35.2 ± 6.4 n=9 28.0 ± 2.6 n=11
Plasma Triglycerides
(mmol/l)
8.62 ± 0.62 n=14 8.99 ± 0.73 n=11 7.54 ± 0.89 n=9 6.40 ± 0.71 n=11
Plasma Creatinine
(µmol/l)
88.9 ± 16.3 n=12 64.2 ± 14.7 n=8 70.7 ± 10.0 n=9 57.3 ± 11.0 n=9
Blood WBC‡
(109/l)
12.1 ± 0.9 n=15 12.2 ± 1.6 n=12 13.8 ± 1.6 n=10 14.2 ± 1.6 n=12
Blood Lymphocytes
(109/l)
7.56 ± 0.35 n=15 7.83 ± 0.52 n=12 9.59 ± 0.73 n=10 10.1 ± 0.78 n=12
Blood Monocytes
(109/l)
0.47 ± 0.06 n=15 0.43 ± 0.04 n=12 0.49 ± 0.06 n=10 0.54 ± 0.06 n=12
Blood Granulocytes
(109/l)
4.10 ± 0.61 n=15 3.91 ± 0.34 n=12 3.71 ± 0.38 n=10 3.57 ± 0.47 n=12
Spleen Lymphocytes
(106)
117 ± 9.5 n=15 151 ± 12 n=12 146 ± 14 n=10 241 ± 26 n=12
Spleen Monocytes
(106)
3.58 ± 0.56 n=15 4.17 ± 0.52 n=12 4.00 ± 0.60 n=10 8.97 ± 1.5 n=12
Spleen Granulocytes
(106)
15.3 ± 2.4 n=15 20.7 ± 2.3 n=12 19.4 ± 2.8 n=10 37.3 ± 6.5 n=12
* After a western diet period of 10 weeks
† After a western diet period of five weeks.
‡ WBC=White blood cells
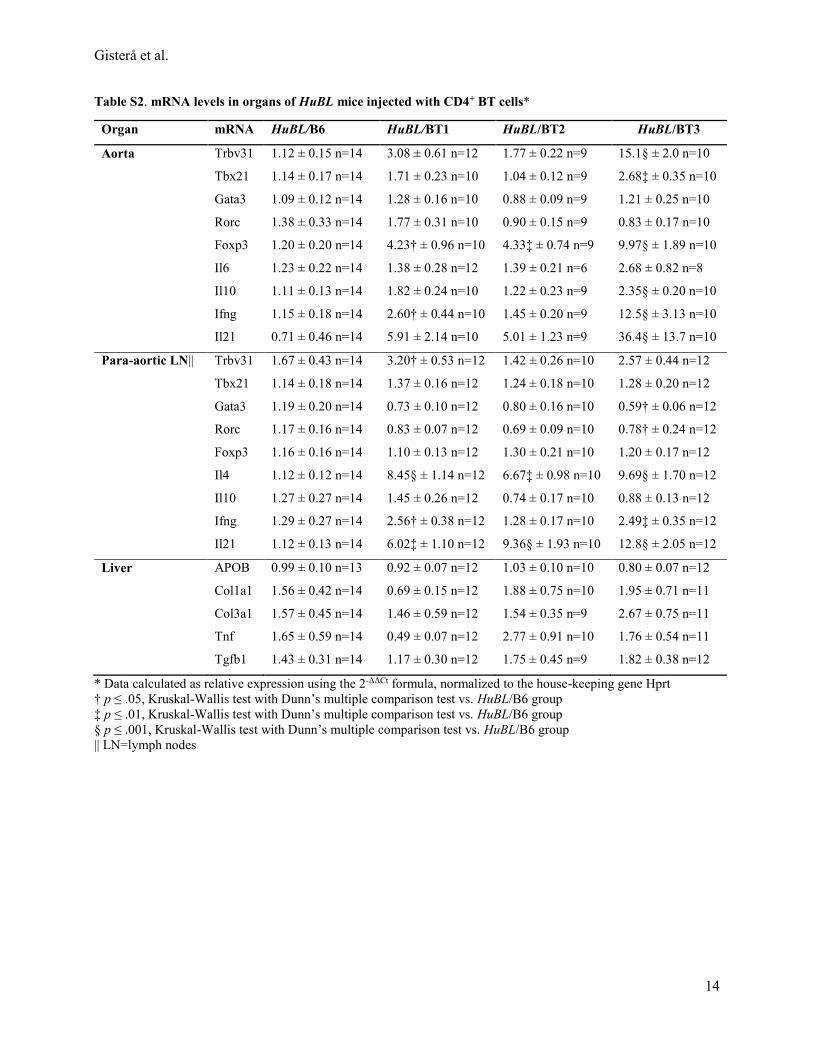
Gisterå et al.
14
Table S2. mRNA levels in organs of HuBL mice injected with CD4+ BT cells*
Organ mRNA HuBL/B6 HuBL/BT1 HuBL/BT2 HuBL/BT3
Aorta Trbv31 1.12 ± 0.15 n=14 3.08 ± 0.61 n=12 1.77 ± 0.22 n=9 15.1§ ± 2.0 n=10
Tbx21 1.14 ± 0.17 n=14 1.71 ± 0.23 n=10 1.04 ± 0.12 n=9 2.68‡ ± 0.35 n=10
Gata3 1.09 ± 0.12 n=14 1.28 ± 0.16 n=10 0.88 ± 0.09 n=9 1.21 ± 0.25 n=10
Rorc 1.38 ± 0.33 n=14 1.77 ± 0.31 n=10 0.90 ± 0.15 n=9 0.83 ± 0.17 n=10
Foxp3 1.20 ± 0.20 n=14 4.23† ± 0.96 n=10 4.33‡ ± 0.74 n=9 9.97§ ± 1.89 n=10
Il6 1.23 ± 0.22 n=14 1.38 ± 0.28 n=12 1.39 ± 0.21 n=6 2.68 ± 0.82 n=8
Il10 1.11 ± 0.13 n=14 1.82 ± 0.24 n=10 1.22 ± 0.23 n=9 2.35§ ± 0.20 n=10
Ifng 1.15 ± 0.18 n=14 2.60† ± 0.44 n=10 1.45 ± 0.20 n=9 12.5§ ± 3.13 n=10
Il21 0.71 ± 0.46 n=14 5.91 ± 2.14 n=10 5.01 ± 1.23 n=9 36.4§ ± 13.7 n=10
Para-aortic LN|| Trbv31 1.67 ± 0.43 n=14 3.20† ± 0.53 n=12 1.42 ± 0.26 n=10 2.57 ± 0.44 n=12
Tbx21 1.14 ± 0.18 n=14 1.37 ± 0.16 n=12 1.24 ± 0.18 n=10 1.28 ± 0.20 n=12
Gata3 1.19 ± 0.20 n=14 0.73 ± 0.10 n=12 0.80 ± 0.16 n=10 0.59† ± 0.06 n=12
Rorc 1.17 ± 0.16 n=14 0.83 ± 0.07 n=12 0.69 ± 0.09 n=10 0.78† ± 0.24 n=12
Foxp3 1.16 ± 0.16 n=14 1.10 ± 0.13 n=12 1.30 ± 0.21 n=10 1.20 ± 0.17 n=12
Il4 1.12 ± 0.12 n=14 8.45§ ± 1.14 n=12 6.67‡ ± 0.98 n=10 9.69§ ± 1.70 n=12
Il10 1.27 ± 0.27 n=14 1.45 ± 0.26 n=12 0.74 ± 0.17 n=10 0.88 ± 0.13 n=12
Ifng 1.29 ± 0.27 n=14 2.56† ± 0.38 n=12 1.28 ± 0.17 n=10 2.49‡ ± 0.35 n=12
Il21 1.12 ± 0.13 n=14 6.02‡ ± 1.10 n=12 9.36§ ± 1.93 n=10 12.8§ ± 2.05 n=12
Liver APOB 0.99 ± 0.10 n=13 0.92 ± 0.07 n=12 1.03 ± 0.10 n=10 0.80 ± 0.07 n=12
Col1a1 1.56 ± 0.42 n=14 0.69 ± 0.15 n=12 1.88 ± 0.75 n=10 1.95 ± 0.71 n=11
Col3a1 1.57 ± 0.45 n=14 1.46 ± 0.59 n=12 1.54 ± 0.35 n=9 2.67 ± 0.75 n=11
Tnf 1.65 ± 0.59 n=14 0.49 ± 0.07 n=12 2.77 ± 0.91 n=10 1.76 ± 0.54 n=11
Tgfb1 1.43 ± 0.31 n=14 1.17 ± 0.30 n=12 1.75 ± 0.45 n=9 1.82 ± 0.38 n=12
* Data calculated as relative expression using the 2-ΔΔCt formula, normalized to the house-keeping gene Hprt
† p ≤ .05, Kruskal-Wallis test with Dunn’s multiple comparison test vs. HuBL/B6 group
‡ p ≤ .01, Kruskal-Wallis test with Dunn’s multiple comparison test vs. HuBL/B6 group
§ p ≤ .001, Kruskal-Wallis test with Dunn’s multiple comparison test vs. HuBL/B6 group
|| LN=lymph nodes
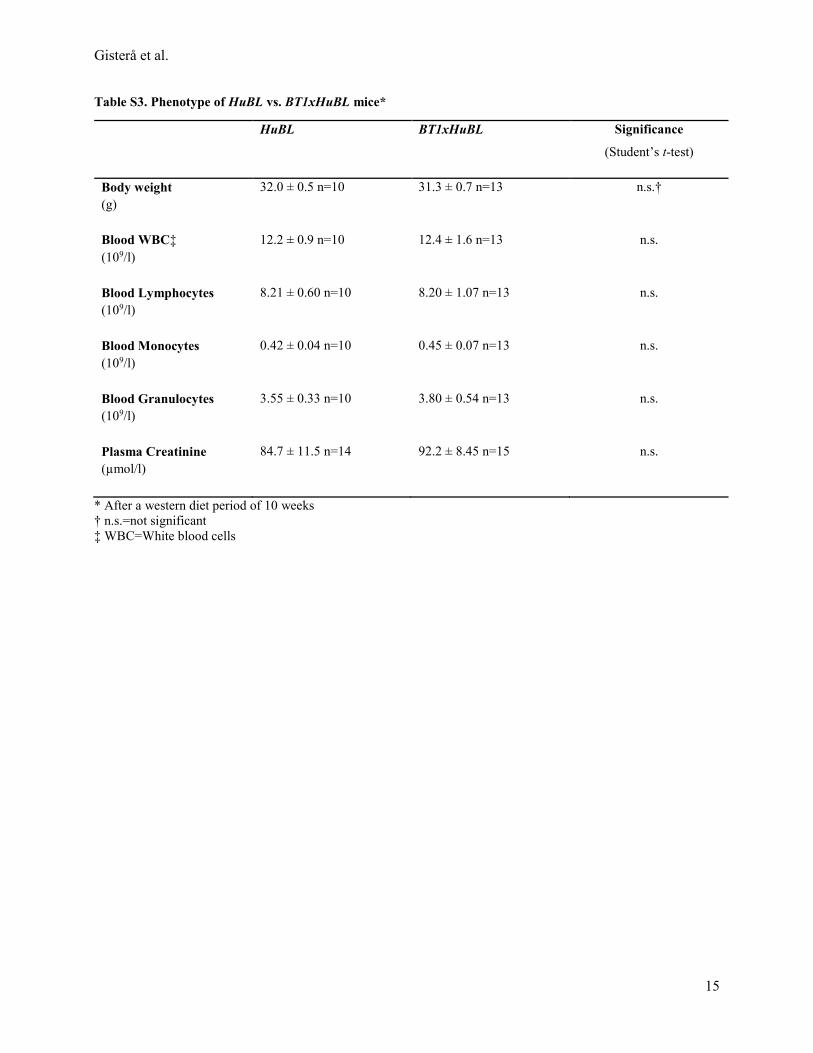
Gisterå et al.
15
Table S3. Phenotype of HuBL vs. BT1xHuBL mice*
HuBL BT1xHuBL Significance
(Student’s t-test)
Body weight
(g)
32.0 ± 0.5 n=10 31.3 ± 0.7 n=13 n.s.†
Blood WBC‡
(109/l)
12.2 ± 0.9 n=10 12.4 ± 1.6 n=13 n.s.
Blood Lymphocytes
(109/l)
8.21 ± 0.60 n=10 8.20 ± 1.07 n=13 n.s.
Blood Monocytes
(109/l)
0.42 ± 0.04 n=10 0.45 ± 0.07 n=13 n.s.
Blood Granulocytes
(109/l)
3.55 ± 0.33 n=10 3.80 ± 0.54 n=13 n.s.
Plasma Creatinine
(µmol/l)
84.7 ± 11.5 n=14 92.2 ± 8.45 n=15 n.s.
* After a western diet period of 10 weeks
† n.s.=not significant
‡ WBC=White blood cells
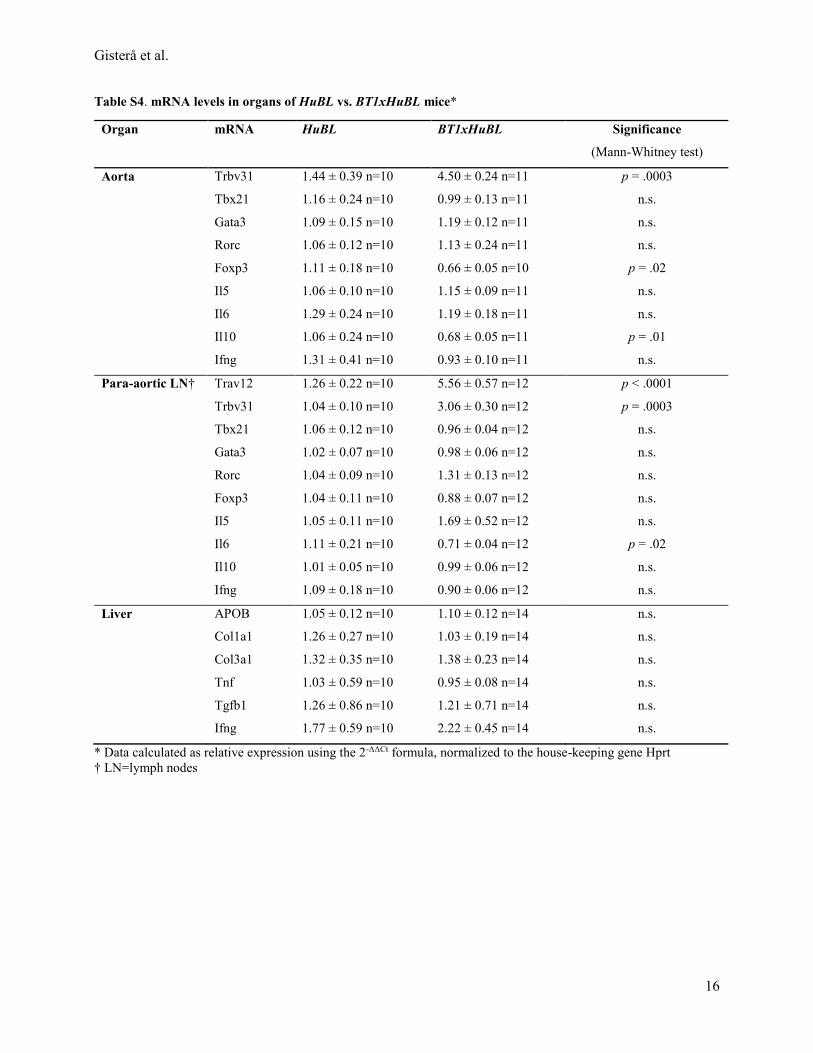
Gisterå et al.
16
Table S4. mRNA levels in organs of HuBL vs. BT1xHuBL mice*
Organ mRNA HuBL BT1xHuBL Significance
(Mann-Whitney test)
Aorta Trbv31 1.44 ± 0.39 n=10 4.50 ± 0.24 n=11 p = .0003
Tbx21 1.16 ± 0.24 n=10 0.99 ± 0.13 n=11 n.s.
Gata3 1.09 ± 0.15 n=10 1.19 ± 0.12 n=11 n.s.
Rorc 1.06 ± 0.12 n=10 1.13 ± 0.24 n=11 n.s.
Foxp3 1.11 ± 0.18 n=10 0.66 ± 0.05 n=10 p = .02
Il5 1.06 ± 0.10 n=10 1.15 ± 0.09 n=11 n.s.
Il6 1.29 ± 0.24 n=10 1.19 ± 0.18 n=11 n.s.
Il10 1.06 ± 0.24 n=10 0.68 ± 0.05 n=11 p = .01
Ifng 1.31 ± 0.41 n=10 0.93 ± 0.10 n=11 n.s.
Para-aortic LN† Trav12 1.26 ± 0.22 n=10 5.56 ± 0.57 n=12 p < .0001
Trbv31 1.04 ± 0.10 n=10 3.06 ± 0.30 n=12 p = .0003
Tbx21 1.06 ± 0.12 n=10 0.96 ± 0.04 n=12 n.s.
Gata3 1.02 ± 0.07 n=10 0.98 ± 0.06 n=12 n.s.
Rorc 1.04 ± 0.09 n=10 1.31 ± 0.13 n=12 n.s.
Foxp3 1.04 ± 0.11 n=10 0.88 ± 0.07 n=12 n.s.
Il5 1.05 ± 0.11 n=10 1.69 ± 0.52 n=12 n.s.
Il6 1.11 ± 0.21 n=10 0.71 ± 0.04 n=12 p = .02
Il10 1.01 ± 0.05 n=10 0.99 ± 0.06 n=12 n.s.
Ifng 1.09 ± 0.18 n=10 0.90 ± 0.06 n=12 n.s.
Liver APOB 1.05 ± 0.12 n=10 1.10 ± 0.12 n=14 n.s.
Col1a1 1.26 ± 0.27 n=10 1.03 ± 0.19 n=14 n.s.
Col3a1 1.32 ± 0.35 n=10 1.38 ± 0.23 n=14 n.s.
Tnf 1.03 ± 0.59 n=10 0.95 ± 0.08 n=14 n.s.
Tgfb1 1.26 ± 0.86 n=10 1.21 ± 0.71 n=14 n.s.
Ifng 1.77 ± 0.59 n=10 2.22 ± 0.45 n=14 n.s.
* Data calculated as relative expression using the 2-ΔΔCt formula, normalized to the house-keeping gene Hprt
† LN=lymph nodes
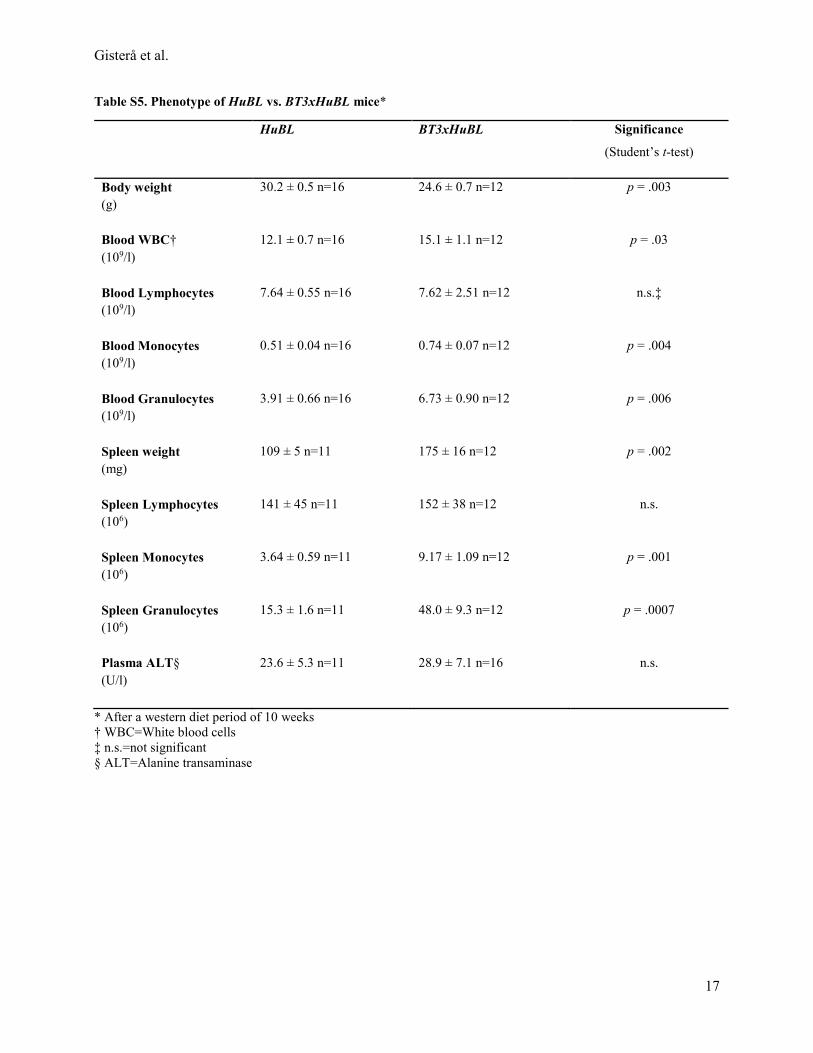
Gisterå et al.
17
Table S5. Phenotype of HuBL vs. BT3xHuBL mice*
HuBL BT3xHuBL Significance
(Student’s t-test)
Body weight
(g)
30.2 ± 0.5 n=16 24.6 ± 0.7 n=12 p = .003
Blood WBC†
(109/l)
12.1 ± 0.7 n=16 15.1 ± 1.1 n=12 p = .03
Blood Lymphocytes
(109/l)
7.64 ± 0.55 n=16 7.62 ± 2.51 n=12 n.s.‡
Blood Monocytes
(109/l)
0.51 ± 0.04 n=16 0.74 ± 0.07 n=12 p = .004
Blood Granulocytes
(109/l)
3.91 ± 0.66 n=16 6.73 ± 0.90 n=12 p = .006
Spleen weight
(mg)
109 ± 5 n=11 175 ± 16 n=12 p = .002
Spleen Lymphocytes
(106)
141 ± 45 n=11 152 ± 38 n=12 n.s.
Spleen Monocytes
(106)
3.64 ± 0.59 n=11 9.17 ± 1.09 n=12 p = .001
Spleen Granulocytes
(106)
15.3 ± 1.6 n=11 48.0 ± 9.3 n=12 p = .0007
Plasma ALT§
(U/l)
23.6 ± 5.3 n=11 28.9 ± 7.1 n=16 n.s.
* After a western diet period of 10 weeks
† WBC=White blood cells
‡ n.s.=not significant
§ ALT=Alanine transaminase
Gisterå et al.
18
Supplemental Methods
Lipoprotein preparations
LDL (density 1.019 – 1.063 g/ml) was isolated by ultracentrifugation from pooled plasma of healthy donors
and dialyzed extensively against PBS1. One mM EDTA was added to prevent oxidation. Using the same procedure,
mouse LDL was prepared from plasma of Ldlr-/- mice. Highly oxidized LDL was obtained by incubating LDL (1
mg/ml protein content) with 20 μM CuSO4 for 18 hours at 37°C. Soluble ApoB100 was isolated as previously
described2. Briefly, protein was precipitated from LDL, resuspended in sodium dodecyl sulfate, filtered on a PD-10
column (GE Healthcare), and further purified on a Superdex-200 size exclusion column (0.5 ml/min, in Tris-HCl
buffer, pH 7.4). FITC-LDL and FITC-oxLDL was prepared as previously described3.
Macrophage oxLDL uptake assay
RAW264.7 mouse macrophage-like cells (ATCC) were used to evaluate uptake of oxLDL. Two-hundred
thousand cells per well were seeded into 48-well cell culture plates (Corning) in 1% FBS RPMI 1640 medium
(Thermo Fisher Scientific) with 25 µg/ml FITC-labeled oxLDL. Plasma was dialyzed against PBS and added at a
dilution of 1:100. Cellular FITC signals were recorded with an IncuCyte ZOOM live-cell imaging and analysis
platform (Essen Bioscience). After 24 hours incubation at 37°C in a humid 5% CO2 atmosphere, four images per
well from six replicates were taken using a 20x objective and subsequently analyzed using the IncuCyte Basic
Software. The cells were then washed, fixed in PBS-buffered 4% formaldehyde solution, and stained with
hematoxylin and Oil Red O. Photomicrographs were acquired using a 40x objective and a Leica DMIL inverted
microscope.
Lipoprotein clearance studies
For lipoprotein clearance studies, 100 μg FITC-LDL was mixed with 70% mouse plasma from HuBL mice
injected with either B6 or BT3 CD4+ T cells, and injected into the tail vein of male HuBL mice. Blood samples were
collected in EDTA-coated tubes 1, 5, 15, 30, and 60 minutes after the injection. IgG purification was performed
using Protein G resin (GE Healthcare). After dialysis against PBS, the protein concentration was determined with a
Nanodrop 1000 spectrophotometer (Thermo Fisher Scientific). Two-hundred μg of the isolated IgGs were infused
into 10-week-old male HuBL recipients and blood samples were collected before and at 15, 60, and 360 minutes after
the infusion.
RNA isolation, cDNA synthesis, and real-time PCR
RNA was isolated from aorta, para-aortic lymph nodes, liver, and thymus using RNeasy kit (Qiagen). Total
RNA quality was analyzed on a BioAnalyzer instrument (Agilent Technologies) and was quantified by 260 nm
absorbance measurement using a Nanodrop 1000 spectrophotometer (Thermo Fisher Scientific). Reverse
transcription was performed with high-capacity cDNA reverse transcription kit and amplification was performed by
real time-PCR using TaqMan Universal Master Mix and pre-manufactured primers and probes for the genes of
interest and for hypoxanthine guanine phosphoribosyl transferase (Hprt, assay-on-demand), in an ABI 7900HT Fast
Real-Time PCR System (all Applied Biosystems). For Trav12 and Trbv31 mRNA, specific primers and probe were
used as previously described2. Data were analyzed using relative expression with the formula 2-ΔΔCt, where ΔΔCt =
ΔCt (sample) – ΔCt (mean Ct values of the controls), and ΔCt is the Ct of the housekeeping gene (Hprt) subtracted
from the Ct of the target gene.
Immunohistochemistry and immunofluorescent analysis
Primary antibodies to CD4 (clone H129.19), CD8 (clone 53-6.7), VCAM-1 (clone 429; all from BD
Biosciences), -SM-actin (ab5694, Abcam), and CD68 (clone FA-11, AbD Serotec) were applied to acetone-fixed
cryosections, followed by biotinylated rabbit anti-rat IgG. The primary antibody for IAb (clone KH74, BD
Biosciences) was a biotin-conjugated IgG. Staining was visualized with Vectastain ABC kit and diaminobenzidine
(Vector). Quantification of immunohistochemical staining was documented as the ratio of thresholded chromogen
Gisterå et al.
19
area using QWin Standard Y 2.8 computerized analysis (Leica) or calculated as the number of stained cells divided
by the intimal lesion area. For fluorescent staining of spleen, liver, kidney, and duodenum sections, antibodies
against B220 (clone RA3-6B2), F4/80 (clone BM8; both from BioLegend), IgG1 (1070, Southern Biotech), IgG2c
(clone 5.7), CD138 (clone 281-1; both from BD Biosciences), C3 (A0062, Dako), and ApoB (20-AG40, Fitzgerald)
were used. Horse anti-goat IgG (Dylight 488, Vector) was used as secondary antibody for ApoB staining.
Plasma analysis
Plasma was separated through centrifugation of whole blood, 1500g for 15 minutes. Plasma creatinine
levels were analyzed using a colorimetric assay (Cayman Chemical Company) relying on the Jaffe’ reaction. Plasma
alanine transaminase activity was measured using a colorimetric assay kit (Abcam). Plasma ApoB levels were
measured with a human ApoB ELISA development kit (Mabtech). For FITC-LDL detection, plasma was diluted
1:25 in PBS and FITC fluorescence was analyzed using a Wallac 1420 Victor2 reader (Perkin Elmer).
Cholesterol extraction from liver and feces
Feces was collected during eight hours the day before sacrifice of the mice. Upon sacrifice, a piece of the
liver were snap-frozen. One-hundred mg tissue was homogenized in methanol, and lipids were extracted by
chloroform separation. After drying the extracts, they were redissolved and cholesterol content were measured with a
colorimetric kit (Randox).
Proliferation assay
Splenocytes were isolated by meshing spleens from individual mice through a 100 µm cell strainer followed
by osmotic lysis of red blood cells (EL buffer; Qiagen). Five-hundred thousand splenocytes were incubated in 96-
well plates with 200 μl serum-free RPMI 1640 medium containing ITS Premix (Corning), 0.1% bovine serum
albumin, nonessential amino acids, L-glutamine, 1 mM sodium pyruvate, and 50 µM β-Mercaptoethanol for 60 hours
at 37°C in a humid 5% CO2 atmosphere. Triplicates were used for all samples. The splenocytes were stimulated with
10 µg/ml human LDL, 10 µg/ml mouse LDL, 0.6 µg/ml Concanavalin A (Con A), or 1 µg/ml rat-anti mouse CD3
antibody (clone C363.29B, Southern Biotech) together with 2 µg/ml rat-anti mouse CD28 antibody (clone 37.51,
eBioscience). One µCi 3H-thymidine (Perkin Elmer) was added after 48 hours and DNA replication was measured in
a scintillation counter (Wallac). Results are expressed as counts per minute (CPM) or stimulation index, calculated as
CPM of the stimulated cells subtracted with the CPM of unstimulated cells from the same animal, and then divided
with the CPM of unstimulated cells. IFN-γ levels in supernatants were measured by a commercial ELISA kit
(Mabtech).
Supplemental References
1. Havel RJ, Eder HA and Bragdon JH. The distribution and chemical composition of ultracentrifugally
separated lipoproteins in human serum. J Clin Invest. 1955;34:1345-53.
2. Hermansson A, Ketelhuth DF, Strodthoff D, Wurm M, Hansson EM, Nicoletti A, Paulsson-Berne G and
Hansson GK. Inhibition of T cell response to native low-density lipoprotein reduces atherosclerosis. J Exp Med.
2010;207:1081-93.
3. Klingenberg R, Gerdes N, Badeau RM, Gistera A, Strodthoff D, Ketelhuth DF, Lundberg AM, Rudling M,
Nilsson SK, Olivecrona G, Zoller S, Lohmann C, Luscher TF, Jauhiainen M, Sparwasser T and Hansson GK.
Depletion of FOXP3+ regulatory T cells promotes hypercholesterolemia and atherosclerosis. J Clin Invest.
2013;123:1323-34.
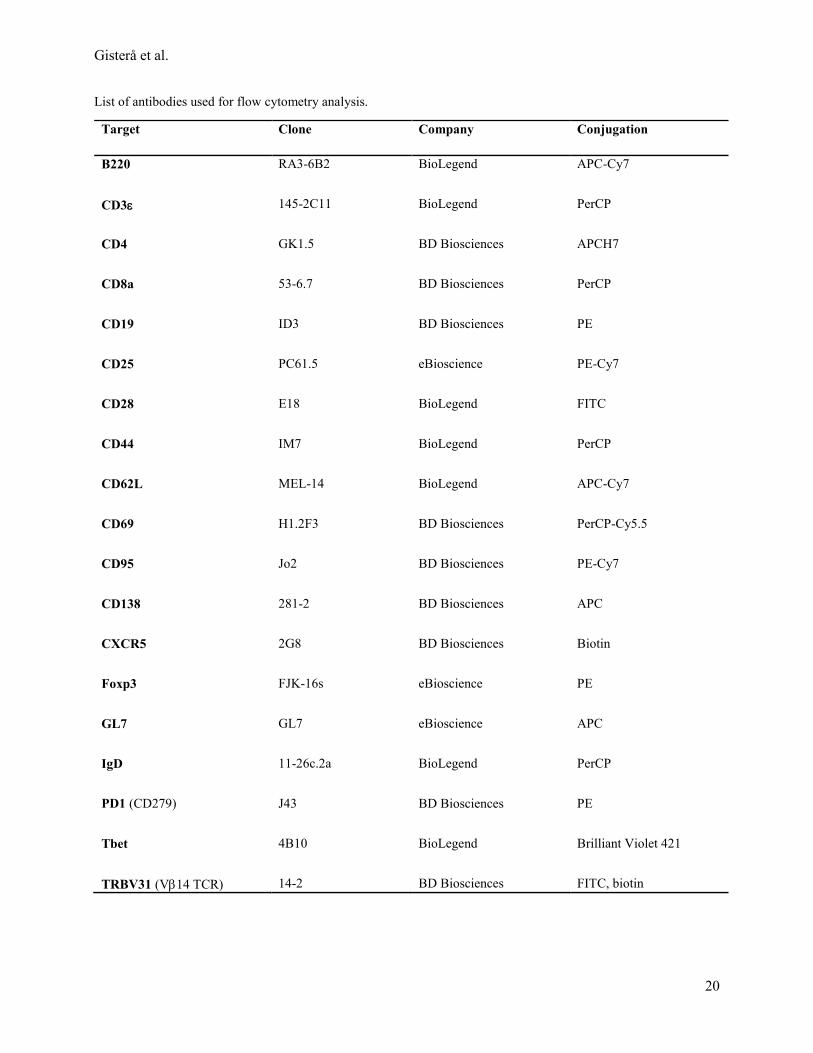
Gisterå et al.
20
List of antibodies used for flow cytometry analysis.
Target Clone Company Conjugation
B220 RA3-6B2 BioLegend APC-Cy7
CD3 145-2C11 BioLegend PerCP
CD4 GK1.5 BD Biosciences APCH7
CD8a 53-6.7 BD Biosciences PerCP
CD19 ID3 BD Biosciences PE
CD25 PC61.5 eBioscience PE-Cy7
CD28 E18 BioLegend FITC
CD44 IM7 BioLegend PerCP
CD62L MEL-14 BioLegend APC-Cy7
CD69 H1.2F3 BD Biosciences PerCP-Cy5.5
CD95 Jo2 BD Biosciences PE-Cy7
CD138 281-2 BD Biosciences APC
CXCR5 2G8 BD Biosciences Biotin
Foxp3 FJK-16s eBioscience PE
GL7 GL7 eBioscience APC
IgD 11-26c.2a BioLegend PerCP
PD1 (CD279) J43 BD Biosciences PE
Tbet 4B10 BioLegend Brilliant Violet 421
TRBV31 (V14 TCR) 14-2 BD Biosciences FITC, biotin