Laterality, intensity, and frequency of electrical intracochlear stimulation are differentially...
13
Laterality, intensity, and frequency of electrical intracochlear stimulation are differentially mapped into specific patterns of gene expression in the rat auditory brainstem TILL JAKOB & ROBERT-BENJAMIN ILLING Neurobiological Research Laboratory, Department of Otorhinolaryngology, University of Freiburg, Freiburg, Germany Abstract Specific patterns of sensory activity may invoke neuroplastic remodelling in the young and adult mammalian brain. Among the indicators for the initiation of neuronal remodelling is the expression of immediate early genes (IEGs). The IEG c-Fos encodes a monomer of the transcription factor dimer AP-1 that triggers cascades of activity-dependent protein synthesis. In order to investigate activity-dependent neuroplasticity in the central auditory system, we applied unilateral electrical intracochlear stimulation (EIS), adjusted to evoke amplitudes of the auditory brainstem response corresponding to about 40 dB acoustic stimulation in adult urethane-anaesthetized rats for 2 h. The intracochlear electrode was baso-dorsally located and the stimulation was specified with respect to intensity (100 or 1500 impulses per min) and frequency (1.6, 50, 100 or 400 Hz). Following EIS, we detected and counted neurons in cochlear nucleus, superior olive, inferior colliculus, and medial geniculate body that initiate stimulation-dependent expression of the protein c-Fos. Unique patterns of gene expression emerged across the major auditory brainstem regions with respect to laterality, intensity, and frequency of EIS. These data suggest a potential of neuroplastic construction to be exploited by running a cochlear implant in humans one way rather than another. Key words: c-Fos, cochlear implant, immediate early genes, plasticity Introduction Sensory stimulation of the ears triggers a cascade of events affecting several major and minor brain- stem nuclei that are interconnected by a complex network of ascending, descending, and commissural pathways. This network is designed to serve auditory processing with respect to stimulus intensity, spectral composition, and binaural balance. It is a funda- mental result obtained by neuroscience research over the past decades that processing and integration of sensory stimuli by neuronal networks takes place not only at the electrophysiological level of fast and transient currents, but also on slower and, under specific circumstances, lasting molecular and morphological changes in specific populations of neurons affecting their response properties to subsequent input. Such molecular changes consist in the modifica- tion of enzymes, in the translocation of structural elements, or in the activation of genes to supply the affected neuron with functions it did not exert in the time before the change took place. Stimulation- dependent gene activation entails, in most cases studied, the expression of immediate early gene (IEG) products, many of which are known to act as transcription factors. The emergence of the IEG transcription factors (c-Fos (1) and Egr-1 (2) (Zif-268 (3); NGFI-A (4); Krox 24(5)) is indicative of synaptic plasticity in the adult mammalian brain (6,7). In the auditory brainstem, c-Fos expression is massively increased in many types of neurons following stimulation with specific sounds (810) or after electrical stimulation of cochlea or eighth cranial nerve (1114). It is a monomer of the activator protein 1 dimer (AP-1; (15,16)). Among many potential consequences, emergence of AP-1 should contribute to transcription and translation of the protein GAP-43 (17) and to the activation of matrix metalloproteinases (18) via the AP-1 re- sponse element in the promoter region of their genes. Both molecules are involved in axonal growth and synaptic plasticity (1921). The protein c-Fos, together with other IEGs coding for transcription factors, is part of signalling cascades crucial for the induction and/or the Correspondence: R.-B. Illing, Neurobiological Research Laboratory, Universita ¨ts-HNO-Klinik, Killianstr. 5, D-79106 Freiburg, Germany. Tel: 49 761 270 4273. Fax: 49 761 270 4075. E-mail: [email protected] Audiological Medicine. 2008; 6: 215227 ISSN 1651-386X print/ISSN 1651-3835 online # 2008 Informa UK Ltd. (Informa Healthcare, Taylor & Francis As) DOI: 10.1080/16513860701875521 Audiol Med Downloaded from informahealthcare.com by University of California Irvine on 10/27/14 For personal use only.
-
Upload
robert-benjamin -
Category
Documents
-
view
214 -
download
0
Transcript of Laterality, intensity, and frequency of electrical intracochlear stimulation are differentially...

Laterality, intensity, and frequency of electrical intracochlearstimulation are differentially mapped into specific patterns of geneexpression in the rat auditory brainstem
TILL JAKOB & ROBERT-BENJAMIN ILLING
Neurobiological Research Laboratory, Department of Otorhinolaryngology, University of Freiburg, Freiburg, Germany
AbstractSpecific patterns of sensory activity may invoke neuroplastic remodelling in the young and adult mammalian brain. Amongthe indicators for the initiation of neuronal remodelling is the expression of immediate early genes (IEGs). The IEG c-Fosencodes a monomer of the transcription factor dimer AP-1 that triggers cascades of activity-dependent protein synthesis. Inorder to investigate activity-dependent neuroplasticity in the central auditory system, we applied unilateral electricalintracochlear stimulation (EIS), adjusted to evoke amplitudes of the auditory brainstem response corresponding to about40 dB acoustic stimulation in adult urethane-anaesthetized rats for 2 h. The intracochlear electrode was baso-dorsallylocated and the stimulation was specified with respect to intensity (100 or 1500 impulses per min) and frequency (1.6, 50,100 or 400 Hz). Following EIS, we detected and counted neurons in cochlear nucleus, superior olive, inferior colliculus, andmedial geniculate body that initiate stimulation-dependent expression of the protein c-Fos. Unique patterns of geneexpression emerged across the major auditory brainstem regions with respect to laterality, intensity, and frequency of EIS.These data suggest a potential of neuroplastic construction to be exploited by running a cochlear implant in humans oneway rather than another.
Key words: c-Fos, cochlear implant, immediate early genes, plasticity
Introduction
Sensory stimulation of the ears triggers a cascade
of events affecting several major and minor brain-
stem nuclei that are interconnected by a complex
network of ascending, descending, and commissural
pathways. This network is designed to serve auditory
processing with respect to stimulus intensity, spectral
composition, and binaural balance. It is a funda-
mental result obtained by neuroscience research
over the past decades that processing and integration
of sensory stimuli by neuronal networks takes
place not only at the electrophysiological level of
fast and transient currents, but also on slower and,
under specific circumstances, lasting molecular and
morphological changes in specific populations
of neurons affecting their response properties to
subsequent input.
Such molecular changes consist in the modifica-
tion of enzymes, in the translocation of structural
elements, or in the activation of genes to supply the
affected neuron with functions it did not exert in the
time before the change took place. Stimulation-
dependent gene activation entails, in most cases
studied, the expression of immediate early gene
(IEG) products, many of which are known to act
as transcription factors. The emergence of the
IEG transcription factors (c-Fos (1) and Egr-1 (2)
(Zif-268 (3); NGFI-A (4); Krox 24(5)) is indicative
of synaptic plasticity in the adult mammalian brain
(6,7).
In the auditory brainstem, c-Fos expression is
massively increased in many types of neurons
following stimulation with specific sounds (8�10)
or after electrical stimulation of cochlea or eighth
cranial nerve (11�14). It is a monomer of the
activator protein 1 dimer (AP-1; (15,16)). Among
many potential consequences, emergence of AP-1
should contribute to transcription and translation of
the protein GAP-43 (17) and to the activation of
matrix metalloproteinases (18) via the AP-1 re-
sponse element in the promoter region of their
genes. Both molecules are involved in axonal growth
and synaptic plasticity (19�21).
The protein c-Fos, together with other IEGs
coding for transcription factors, is part of signalling
cascades crucial for the induction and/or the
Correspondence: R.-B. Illing, Neurobiological Research Laboratory, Universitats-HNO-Klinik, Killianstr. 5, D-79106 Freiburg, Germany. Tel: �49 761 270
4273. Fax: �49 761 270 4075. E-mail: [email protected]
Audiological Medicine. 2008; 6: 215�227
ISSN 1651-386X print/ISSN 1651-3835 online # 2008 Informa UK Ltd. (Informa Healthcare, Taylor & Francis As)
DOI: 10.1080/16513860701875521
Aud
iol M
ed D
ownl
oade
d fr
om in
form
ahea
lthca
re.c
om b
y U
nive
rsity
of
Cal
ifor
nia
Irvi
ne o
n 10
/27/
14Fo
r pe
rson
al u
se o
nly.

maintenance of long-term potentiation of synapses
effectively induced at stimulation frequencies around
100 Hz (22,23). In particular, up-regulation of
c-fos and egr-1 mRNA is related to stimulation-
dependent synaptic enhancement (6). Transcription
of c-fos mRNA requires a stronger stimulation to
be recruited in the processes of synaptic remodelling
(24). There is evidence that strong neuronal activity
triggers not only stronger responses, but also differ-
ent signalling cascades, than weak activity (25�28).
In contrast to what was originally thought, the rise
of c-Fos is not an indicator for electrophysiological
activity. The local and cellular mismatch between
stimulation dependence of c-Fos expression and
2-deoxyglucose uptake (29�32) indicates that these
markers monitor neuronal activity on different levels.
Instead of reflecting spiking intensity, the emergence
of c-Fos is suggestive of molecular, structural, and
eventually functional changes that are imposed onto
neurons by specific patterns of afferent activity
rather than by activity per se.
Based on these studies, we here attempted
to identify characteristic distributions of c-Fos
expression in the auditory brainstem as a function
of stimulus laterality, stimulus intensity, and stimu-
lus frequency. We chose to employ EIS rather than
acoustic stimulation to take advantage of a full
control of the spectral and temporal pattern of
electrophysiological activity in the system, an aspect
of central importance in auditory processing that
we seek to exploit in the future, ultimately to help
optimize the use of cochlear implants in human
patients.
Materials and methods
Animals
This study is based on the brains from 23 adult
Wistar rats aged 7 to 12 weeks (Table I). Care and
use of the animals as reported here was approved
by the appropriate agency. The rats were anaesthe-
tized with an intraperitoneally injected mixture
of ketamine (50 mg/kg, Ketanest, Parke-Davis,
Ann Arbor, MI) and xylazine (5 mg/kg, Rompun,
Bayer-Leverkusen, Germany) for ear bone removal.
Table I.
Raw number of sections and cellular nuclei (ipsilateral, contralateral) analysed for:
Exp. no.
Stim.
frequency AVCN DCN LSO CIC MGB
M1070 1Hz 7 (7, 12) 3 (177, 24) 4 (89, 117) 4 (326, 341) 2 (28, 42)
M1082 1Hz 11 (11, 15) 5 (429, 11) 3 (106, 118) 4 (1265, 672) 3 (34, 44)
M1086 1Hz 20 (9, 10) 6 (227, 14) 5 (187, 223) 4 (452, 259) 1 (3, 4)
M1106 1Hz 10 (2, 12) 4 (65, 26) 5 (129, 181) 4 (287, 550) 5 (38, 28)
M1114 1,6Hz 13 (3, 16) 5 (430, 129) 5 (70, 117) 4 (168, 225) 3 (22, 30)
M1131 1,6Hz 12 (4, 11) 7 (356, 35) 3 (91, 96) 4 (791, 819) 3 (78, 102)
M820 50Hz 20 (888, 36) 6 (411, 222) 5 (152, 211) 4 (1639, 2004) 3 (284, 245)
M986 50Hz 14 (57, 103) 3 (168, 87) 3 (169, 110) 4 (2183, 2529) �M1065 50Hz 11 (23, 18) 5 (340, 101) 5 (209, 144) 4 (2325, 1746) 3 (116, 198)
M1104 50Hz 18 (1148, 16) 6 (254, 134) 5 (128, 129) 4 (670, 1744) 3 (21, 24)
M1113 100Hz 15 (7, 26) 7 (975, 200) 6 (142, 147) 4 (891, 887) 5 (28, 30)
M1124 100Hz 11 (17, 27) 5 (228, 83) 3 (79, 97) 4 (250, 201) 3 (61, 81)
M1127 100Hz 9 (8, 3) 5 (158, 34) 2 (41, 92) 4 (795, 651) 5 (31, 28)
M1128 100Hz 18 (8, 39) 3 (380, 112) 4 (92, 78) 4 (494, 763) 3 (13, 13)
X14 100Hz 7 (29, 21) 4 (214, 92) 2 (146, 145) 4 (627, 607) 2 (22, 73)
M1056 400Hz 10 (20, 33) 3 (160, 63) 4 (142, 164) 4 (919, 825) 3 (105, 173)
M1061 400Hz 13 (44, 26) 4 (131, 46) 3 (121, 125) 4 (1771, 1645) 3 (194, 265)
M1062 400Hz 15 (308, 32) 4 (71, 24) 4 (154, 129) 4 (1322, 1243) 3 (176, 174)
M1091 400Hz 9 (10, 69) 5 (382, 77) 3 (169, 148) 4 (803, 883) 3 (19, 12)
M1085 Control 19 (1, 1) 8 (0, 6) 4 (0, 2) 4 (664, 882) �M1097 Control 10 (0, 1) 5 (0, 1) 4 (6, 3) 4 (1311, 888) 3 (15, 27)
M1098 Control 8 (0, 1) 4 (0, 1) 2 (0, 0) 4 (378, 365) 3 (10, 14)
M1090 acoustic
stim.
� � � � �
Experimental animals, type of stimulation, and number of quantitatively evaluated specimens.
216 T. Jakob & R.-B. Illing
Aud
iol M
ed D
ownl
oade
d fr
om in
form
ahea
lthca
re.c
om b
y U
nive
rsity
of
Cal
ifor
nia
Irvi
ne o
n 10
/27/
14Fo
r pe
rson
al u
se o
nly.

For EIS, anaesthesia was achieved with urethane
(1.5 g/kg i.p.; Fluka AG, Buchs, Switzerland).
Electrical intracochlear stimulation (EIS)
To reduce the level of hearing-dependent spiking
activity in the auditory system, the tympanic mem-
brane was disrupted and the malleus was removed
bilaterally three days before EIS. Judging from the
auditory brainstem response (ABR), loss of middle
ear transmission led to an immediate and sustained
rise of hearing threshold by 50dB (13). The cochlea
was exposed using a retroauricular surgical ap-
proach. A hole was made into the bony wall of the
basal cochlea, the site of high-frequency transduc-
tion, to insert the electrode carrier (33). In this series
of experiments, the position of the stimulation
electrode was strictly dorsal to the modiolus. For
stimulation, we applied bipolar stimuli, using a
cochlear implant (Model CI24M) run by the Nu-
cleus Implant Communicator, both kindly provided
by Cochlear AG (Basel, Switzerland, and Hannover,
Germany).
The electrically evoked brainstem potentials
(EABR) were recorded at the onset of stimulation
by placing steel needle electrodes subcutaneously at
vertex and mastoids to corroborate the correct
placement of the stimulation electrodes and to
determine an appropriate current level for stimula-
tion. The EABR was visualized using an averager
(Multiliner E; Evolution 1.70c; Toennies, Wurzburg,
Germany), calculating mean amplitudes over 100
sweeps. We aimed to obtain amplitudes in the range
of 3 to 6 mV, corresponding to acoustically evoked
amplitudes of 30 to 50dB (Figure 1). In conjunction
with the baso-dorsal position of the stimulation
electrode, the moderate current level served to
induce a local, or tonotopic, rather than a total, or
generalized, intracochlear stimulation.
We applied EIS unilaterally (left side) in acute
experiments for 2 h (Table I). Biphasic pulses with
50-ms phase width each and 20-ms phase gap
were applied with frequencies of either 1.6 Hz,
50 Hz, 100 Hz, or 400 Hz. Four experiments with
1 Hz stimulation frequency were performed in the
early stages of our study. Based on observations of
the frequency-dependency of synaptic plasticity in
brain slice preparations we consider results from
1 Hz experiments as indistinguishable from those of
1.6 Hz experiments and pooled both for statistical
analysis. The duty cycle was set to arrive at either
100 (1.6 and 100 Hz) or 1500 (50 and 400 Hz)
biphasic pulses per min. The current level was varied
between 260 and 950 mA between experiments to
compensate for unavoidable variations in the dis-
tance of the electrodes to the modiolus. The EABR
was recorded again at the end of the session to verify
unchanged electrode position and sustained effective
stimulation of the central auditory system.
Immunohistochemistry
Preceding transcardial perfusion, rats were given a
lethal dose of pentabarbital (0.6 ml/kg of Narco-
dorm-n, Alvetra GmbH, Neumunster, Germany,
i.p.). The fixative was the same as we used in previous
studies (34). Brains were cryo-cut into frontal
sections of 30-mm thickness. Immunocytochemistry
was performed using antibodies raised in rabbit
against c-Fos (0.5 mg/ml, Santa Cruz Biotechnology,
Santa Cruz, CA, No. Sc-253, lot no. A0603). After
incubation for 48 h, matching biotinylated secon-
dary antibodies and the avidin-biotin-technique
(Vector Laboratories, Burlingame, USA) were em-
ployed to visualize the binding sites of the primary
Figure 1. Auditory brainstem response following acoustic (upper lane) or electrical intracochlear (EIS, lower two lanes) stimulation. Arrows
point to time of stimulus onset (click or current). The two lanes labelled ‘EIS’ show two extremes of potential differentiation under
supposedly identical stimulation conditions. Time scale: 1 ms per unit.
Activity-induced gene expression in auditory brainstem 217
Aud
iol M
ed D
ownl
oade
d fr
om in
form
ahea
lthca
re.c
om b
y U
nive
rsity
of
Cal
ifor
nia
Irvi
ne o
n 10
/27/
14Fo
r pe
rson
al u
se o
nly.

antibodies with diaminobenzidine (DAB, 0.05 %,
Sigma-Aldrich, Germany), H2O2 (0.0015%) and
ammonium nickel sulphate (0.3%) for 2 min under
visual control. Stained cellular nuclei in the parabra-
chial region served as positive controls (13).
Counting and statistics
For the quantitative evaluation of our results,
photographs were taken from auditory regions on
both sides of the brainstem with a�10 objective
and a digital camera (Axicam, Zeiss, Germany) at an
8-bit grey tone scale. Whenever necessary, a mosaic
of photographs was taken and assembled to cover the
whole cross-sectional profile of the respective region
of the brain section. Photographs were then im-
ported into an image analysis program (analySIS,
Soft Imaging Systems GmbH, Germany). Detection
threshold of grey tone values was set between 115
and 125 to compensate for minor variations in
staining intensity of sections from various animals.
Following the definition of the region of interest
excluding large blood vessels, detection of stained
nuclei (Figure 2A, inset) was performed under
the optimized settings for aspect ratio (1�4), mean
diameter (2�15), elongation (1�5), area (2�90), grey
value minimum (140), and roundness (0.1�1).
Statistical analysis was performed with Prism
(GraphPad Software, Inc.). The number of c-Fos
positive nuclei was determined for each brainstem
region and each setting of stimulation parameters
across animals. These numbers were given as counts
per square millimetre. Mean and standard error of
mean were determined and used for statistical
testing. Significant differences of counts were sought
by applying the two-sided unpaired Students t-test,
with significance level set to pB0.05. Stereological
corrections for counting particles in the sectioned
material were not made as our conclusions are based
on numerical relationships rather than absolute
densities.
Results
Controls
As a consequence of the binding of antibodies
directed against c-Fos, nuclei turn black in perox-
idase-DAB-nickel-based immunocytochemistry in
cells that contain this protein (Figure 2A, upper
panel of inset). In normal hearing but not specifically
stimulated rats, c-Fos expression occurs in cells of all
auditory brainstem regions at a low level. While
some neuronal nuclei were moderately rich in c-Fos,
very few of them showed intense black staining. As a
consequence of a bilateral perforation of the tympa-
nic membrane and removal of the malleus, c-Fos
expression fell within two days below detection level
in ventral cochlear nucleus (VCN), lateral superior
olive (LSO), and medial geniculate body (MGB),
whereas some intensely c-Fos positive nuclei per-
sisted in dorsal cochlear nucleus (DCN) and central
nucleus of the inferior colliculus (CIC). Control
animals with unilateral or bilateral middle ear bone
dislocation did not show an increase of the number
of c-Fos positive cells anywhere in the auditory
brainstem. Even after two weeks of sensory depriva-
tion by bilateral middle ear bone dislocation, c-Fos
staining in the auditory brainstem remained de-
pressed. Animals with this kind of hearing loss
inflicted three days before analysis served as controls
in our study, against which a stimulation-dependent
rise of c-Fos positive nuclei after middle ear bone
removal could be readily detected.
VCN
We observed cases with a large number of stained
nuclei on the side of stimulation (Figure 2A) and
very few such nuclei contralaterally (Figure 2B).
However, substantial variations in c-Fos expression
even under supposedly identical set-up and stimula-
tion parameters occurred in VCN. The form of the
EABR appeared to have some predictive value for
this difference. Whenever we recorded an EABR
with three or more clearly distinguishable troughs
(Figure 1, lower lane), a strong c-Fos expression
occurred in the ipsilateral VCN. With fewer troughs,
c-Fos expression was sparser ipsilaterally, even to
the extent of being statistically indistinguishable
from the unstimulated side. A dependence of
EABR morphology on preoperative cochlear func-
tioning or malfunctioning was not noticed. Remark-
ably, variations in the number of stained nuclei in
VCN appeared to have few consequences for
amount and pattern of c-Fos expression beyond
VCN (see below). In cases with notable c-Fos
expression, stained nuclei were found dorsally in
VCN at a location corresponding tonotopically to
the intracochlear position of the stimulation elec-
trode (Figure 2A). The cross-sectional area of c-Fos
positive nuclei in VCN was on average 10.54 mm2.
Any kind of stimulation resulted in a significant
increase of c-Fos positive nuclei in the ipsilateral
VCN compared to the control, except at 400 Hz
(1.6 Hz: i: p�0.0118*; 50 Hz: i: p�0.0451*; 100
Hz: i: p�0.0474*; 400 Hz: i: p�0.1039; cp. Figure
2). Variations in stimulation frequency failed to result
in significant differences of c-Fos positive nuclei.
When the same number of impulses per minute
were given at 1.6 and 100 Hz (1.6 vs. 100 Hz: i:
p�0.1699; c: p�0.1179; Figure 2E), or at 50 and
400 Hz (50 vs. 400 Hz: i: p�0.2176; c: p�0.6918;
218 T. Jakob & R.-B. Illing
Aud
iol M
ed D
ownl
oade
d fr
om in
form
ahea
lthca
re.c
om b
y U
nive
rsity
of
Cal
ifor
nia
Irvi
ne o
n 10
/27/
14Fo
r pe
rson
al u
se o
nly.
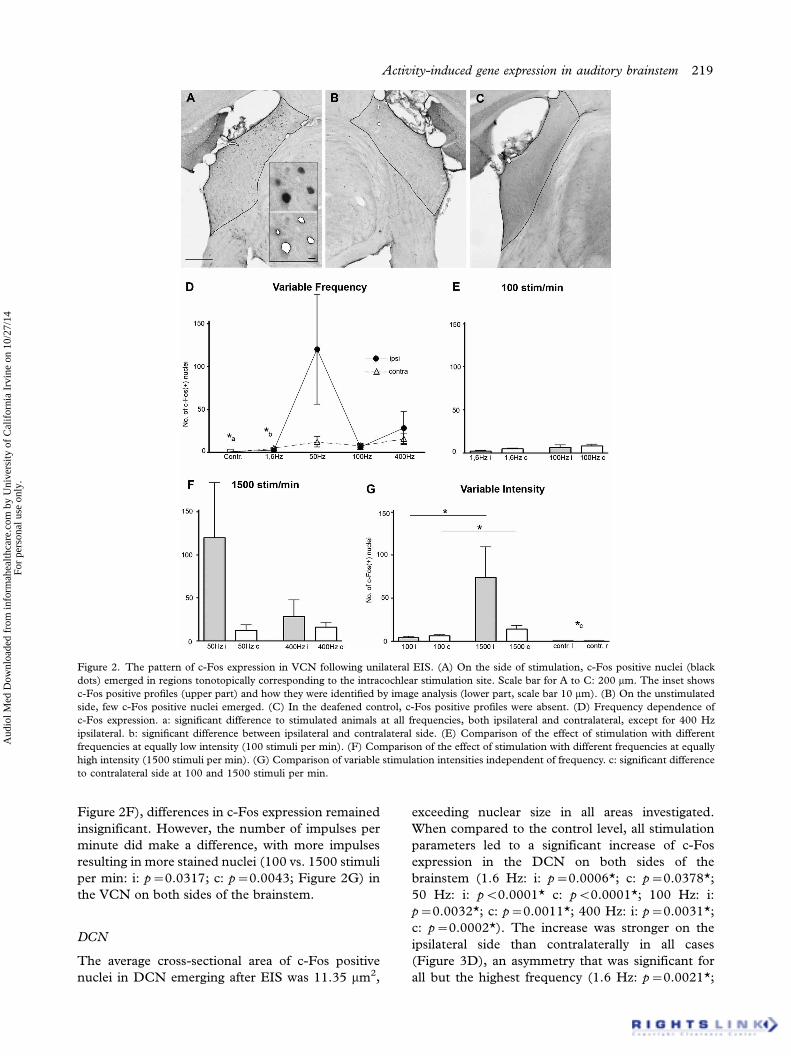
Figure 2F), differences in c-Fos expression remained
insignificant. However, the number of impulses per
minute did make a difference, with more impulses
resulting in more stained nuclei (100 vs. 1500 stimuli
per min: i: p�0.0317; c: p�0.0043; Figure 2G) in
the VCN on both sides of the brainstem.
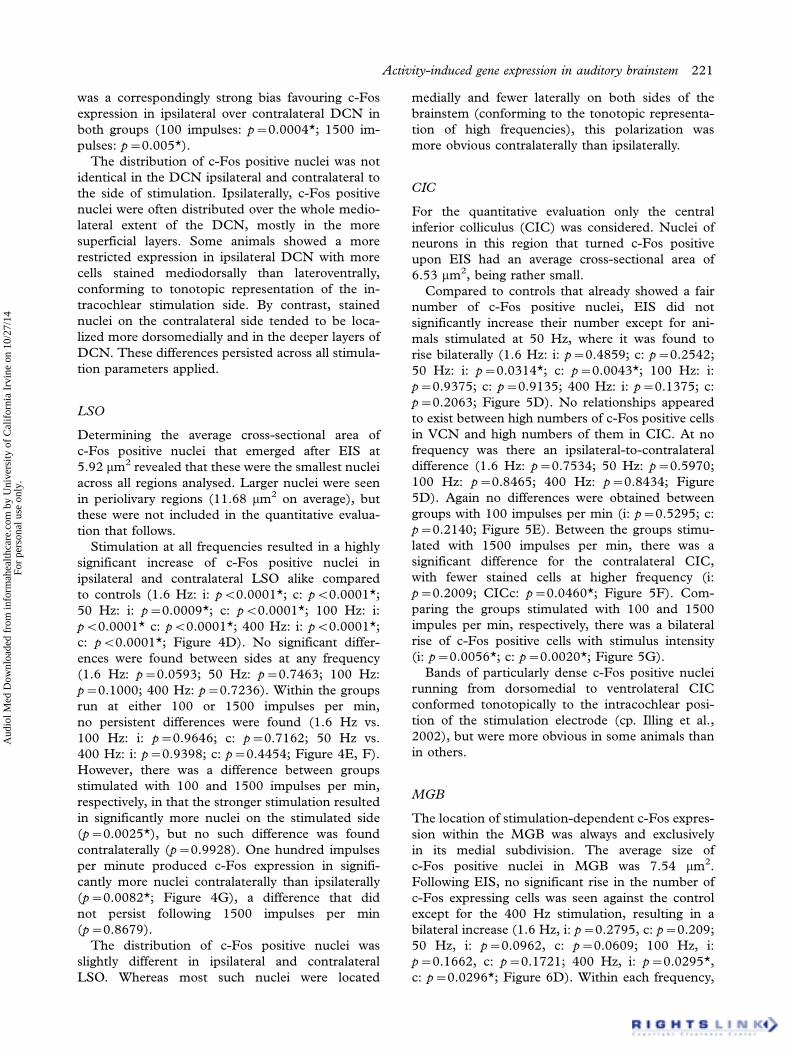
DCN
The average cross-sectional area of c-Fos positive
nuclei in DCN emerging after EIS was 11.35 mm2,
exceeding nuclear size in all areas investigated.
When compared to the control level, all stimulation
parameters led to a significant increase of c-Fos
expression in the DCN on both sides of the
brainstem (1.6 Hz: i: p�0.0006*; c: p�0.0378*;
50 Hz: i: pB0.0001* c: pB0.0001*; 100 Hz: i:
p�0.0032*; c: p�0.0011*; 400 Hz: i: p�0.0031*;
c: p�0.0002*). The increase was stronger on the
ipsilateral side than contralaterally in all cases
(Figure 3D), an asymmetry that was significant for
all but the highest frequency (1.6 Hz: p�0.0021*;
Figure 2. The pattern of c-Fos expression in VCN following unilateral EIS. (A) On the side of stimulation, c-Fos positive nuclei (black
dots) emerged in regions tonotopically corresponding to the intracochlear stimulation site. Scale bar for A to C: 200 mm. The inset shows
c-Fos positive profiles (upper part) and how they were identified by image analysis (lower part, scale bar 10 mm). (B) On the unstimulated
side, few c-Fos positive nuclei emerged. (C) In the deafened control, c-Fos positive profiles were absent. (D) Frequency dependence of
c-Fos expression. a: significant difference to stimulated animals at all frequencies, both ipsilateral and contralateral, except for 400 Hz
ipsilateral. b: significant difference between ipsilateral and contralateral side. (E) Comparison of the effect of stimulation with different
frequencies at equally low intensity (100 stimuli per min). (F) Comparison of the effect of stimulation with different frequencies at equally
high intensity (1500 stimuli per min). (G) Comparison of variable stimulation intensities independent of frequency. c: significant difference
to contralateral side at 100 and 1500 stimuli per min.
Activity-induced gene expression in auditory brainstem 219
Aud
iol M
ed D
ownl
oade
d fr
om in
form
ahea
lthca
re.c
om b
y U
nive
rsity
of
Cal
ifor
nia
Irvi
ne o
n 10
/27/
14Fo
r pe
rson
al u
se o
nly.

50 Hz: p�0.0174*; 100 Hz: p�0.0415*; 400 Hz.
p�0.0616).
In the ipsilateral DCN, the number of c-Fos
positive nuclei rose with stimulation frequency
(Figure 3D) from 1.6 Hz (234.7 cells per mm2)
over 50 Hz (236.9) to 100 Hz (316.1), but fell off at
400 Hz (152.7). Contralaterally, there was a gradual
rise in number at 1.6 Hz (33.4) to 50 Hz (114.1),
but a subsequent decrease at 100 Hz (96.4) and
400 Hz (45.5).
When stimulating with 100 impulses per min,
100 Hz produced more positive nuclei in the
ipsilateral DCN than 1.6 Hz, but the difference
was not significant (p�0.4128). However, the
contralateral DCN showed a significant increase
of c-Fos expression with frequency (p�0.0343*;
Figure 3E). Stimulation with 1500 impulses per
min resulted in a frequency-dependent decrease of
c-Fos expression that was again insignificant ipsilat-
erally (p�0.1873) but significant contralaterally
(p�0.015*; Figure 3F).
Comparing animals stimulated with 100 impulses
per min with those stimulated with 1500 impulses
per min (Figure 3G), both showed indistinguishable
levels of c-Fos expression ipsilaterally (p�0.2231)
and contralaterally (p�0.4462), respectively. There
Figure 3. The pattern of c-Fos expression in DCN following unilateral EIS. (A) On the side of stimulation, c-Fos positive nuclei (black
dots) emerged throughout DCN. Scale bar for A to C: 200 mm. (B) On the unstimulated side, fewer cells expressed c-Fos, but most of these
corresponded tonotopically to the intracochlear stimulation site. (C) In the deafened control, c-Fos positive profiles were essentially absent.
(D) Frequency dependence of c-Fos expression. a: significant difference to all frequencies and both sides of the brainstem. b: significant
difference between ipsilateral and contralateral side. (E) Comparison of the effect of stimulation with different frequencies at equally low
intensity (100 stimuli per min). (F) Comparison of the effect of stimulation with different frequencies at equally high intensity (1500 stimuli
per min). (G) Comparison of variable stimulation intensities independent of frequency. c: significant difference to ipsilateral and
contralateral side at 100 and 1500 stimuli per min.
220 T. Jakob & R.-B. Illing
Aud
iol M
ed D
ownl
oade
d fr
om in
form
ahea
lthca
re.c
om b
y U
nive
rsity
of
Cal
ifor
nia
Irvi
ne o
n 10
/27/
14Fo
r pe
rson
al u
se o
nly.
was a correspondingly strong bias favouring c-Fos
expression in ipsilateral over contralateral DCN in
both groups (100 impulses: p�0.0004*; 1500 im-
pulses: p�0.005*).
The distribution of c-Fos positive nuclei was not
identical in the DCN ipsilateral and contralateral to
the side of stimulation. Ipsilaterally, c-Fos positive
nuclei were often distributed over the whole medio-
lateral extent of the DCN, mostly in the more
superficial layers. Some animals showed a more
restricted expression in ipsilateral DCN with more
cells stained mediodorsally than lateroventrally,
conforming to tonotopic representation of the in-
tracochlear stimulation side. By contrast, stained
nuclei on the contralateral side tended to be loca-
lized more dorsomedially and in the deeper layers of
DCN. These differences persisted across all stimula-
tion parameters applied.
LSO
Determining the average cross-sectional area of
c-Fos positive nuclei that emerged after EIS at
5.92 mm2 revealed that these were the smallest nuclei
across all regions analysed. Larger nuclei were seen
in periolivary regions (11.68 mm2 on average), but
these were not included in the quantitative evalua-
tion that follows.
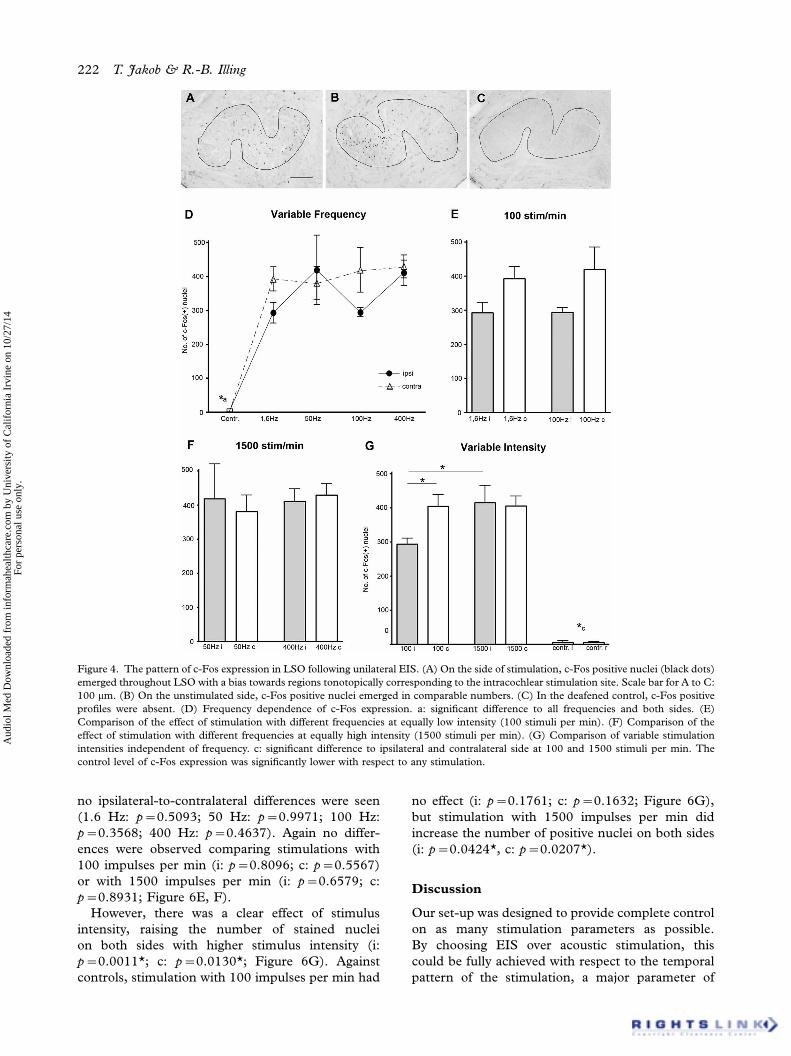
Stimulation at all frequencies resulted in a highly
significant increase of c-Fos positive nuclei in
ipsilateral and contralateral LSO alike compared
to controls (1.6 Hz: i: pB0.0001*; c: pB0.0001*;
50 Hz: i: p�0.0009*; c: pB0.0001*; 100 Hz: i:
pB0.0001* c: pB0.0001*; 400 Hz: i: pB0.0001*;
c: pB0.0001*; Figure 4D). No significant differ-
ences were found between sides at any frequency
(1.6 Hz: p�0.0593; 50 Hz: p�0.7463; 100 Hz:
p�0.1000; 400 Hz: p�0.7236). Within the groups
run at either 100 or 1500 impulses per min,
no persistent differences were found (1.6 Hz vs.
100 Hz: i: p�0.9646; c: p�0.7162; 50 Hz vs.
400 Hz: i: p�0.9398; c: p�0.4454; Figure 4E, F).
However, there was a difference between groups
stimulated with 100 and 1500 impulses per min,
respectively, in that the stronger stimulation resulted
in significantly more nuclei on the stimulated side
(p�0.0025*), but no such difference was found
contralaterally (p�0.9928). One hundred impulses
per minute produced c-Fos expression in signifi-
cantly more nuclei contralaterally than ipsilaterally
(p�0.0082*; Figure 4G), a difference that did
not persist following 1500 impulses per min
(p�0.8679).
The distribution of c-Fos positive nuclei was
slightly different in ipsilateral and contralateral
LSO. Whereas most such nuclei were located
medially and fewer laterally on both sides of the
brainstem (conforming to the tonotopic representa-
tion of high frequencies), this polarization was
more obvious contralaterally than ipsilaterally.
CIC
For the quantitative evaluation only the central
inferior colliculus (CIC) was considered. Nuclei of
neurons in this region that turned c-Fos positive
upon EIS had an average cross-sectional area of
6.53 mm2, being rather small.
Compared to controls that already showed a fair
number of c-Fos positive nuclei, EIS did not
significantly increase their number except for ani-
mals stimulated at 50 Hz, where it was found to
rise bilaterally (1.6 Hz: i: p�0.4859; c: p�0.2542;
50 Hz: i: p�0.0314*; c: p�0.0043*; 100 Hz: i:
p�0.9375; c: p�0.9135; 400 Hz: i: p�0.1375; c:
p�0.2063; Figure 5D). No relationships appeared
to exist between high numbers of c-Fos positive cells
in VCN and high numbers of them in CIC. At no
frequency was there an ipsilateral-to-contralateral
difference (1.6 Hz: p�0.7534; 50 Hz: p�0.5970;
100 Hz: p�0.8465; 400 Hz: p�0.8434; Figure
5D). Again no differences were obtained between
groups with 100 impulses per min (i: p�0.5295; c:
p�0.2140; Figure 5E). Between the groups stimu-
lated with 1500 impulses per min, there was a
significant difference for the contralateral CIC,
with fewer stained cells at higher frequency (i:
p�0.2009; CICc: p�0.0460*; Figure 5F). Com-
paring the groups stimulated with 100 and 1500
impules per min, respectively, there was a bilateral
rise of c-Fos positive cells with stimulus intensity
(i: p�0.0056*; c: p�0.0020*; Figure 5G).
Bands of particularly dense c-Fos positive nuclei
running from dorsomedial to ventrolateral CIC
conformed tonotopically to the intracochlear posi-
tion of the stimulation electrode (cp. Illing et al.,
2002), but were more obvious in some animals than
in others.
MGB
The location of stimulation-dependent c-Fos expres-
sion within the MGB was always and exclusively
in its medial subdivision. The average size of
c-Fos positive nuclei in MGB was 7.54 mm2.
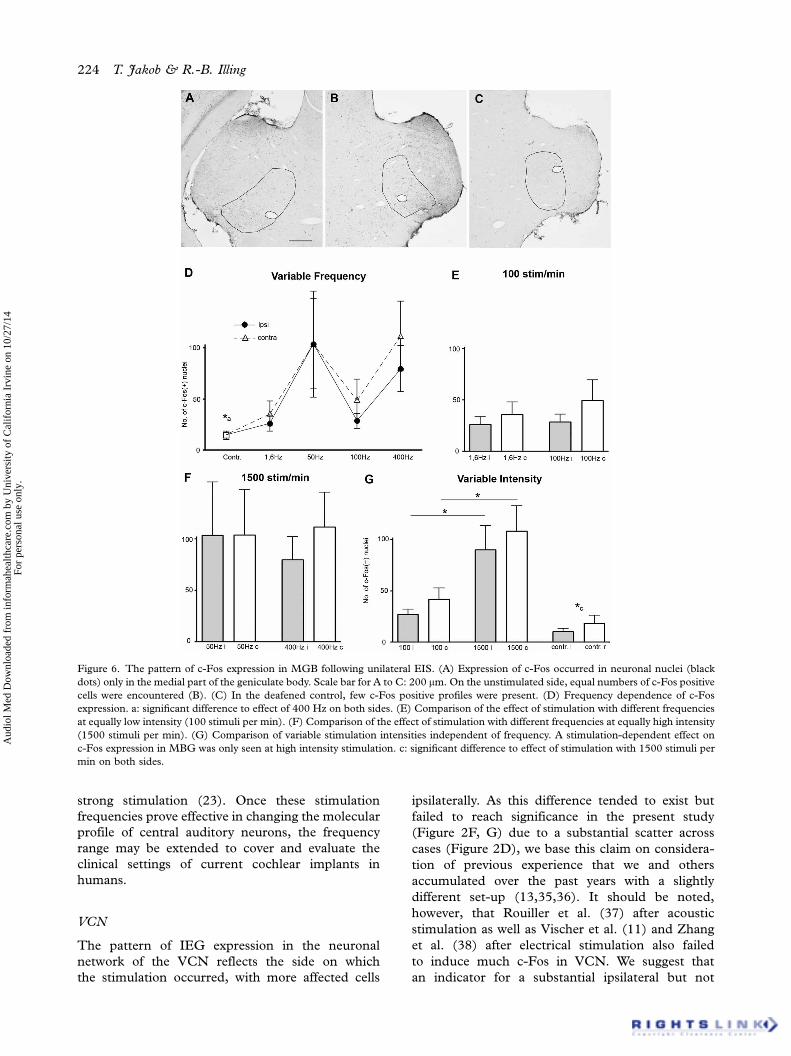
Following EIS, no significant rise in the number of
c-Fos expressing cells was seen against the control
except for the 400 Hz stimulation, resulting in a
bilateral increase (1.6 Hz, i: p�0.2795, c: p�0.209;
50 Hz, i: p�0.0962, c: p�0.0609; 100 Hz, i:
p�0.1662, c: p�0.1721; 400 Hz, i: p�0.0295*,
c: p�0.0296*; Figure 6D). Within each frequency,
Activity-induced gene expression in auditory brainstem 221
Aud
iol M
ed D
ownl
oade
d fr
om in
form
ahea
lthca
re.c
om b
y U
nive
rsity
of
Cal
ifor
nia
Irvi
ne o
n 10
/27/
14Fo
r pe
rson
al u
se o
nly.
no ipsilateral-to-contralateral differences were seen
(1.6 Hz: p�0.5093; 50 Hz: p�0.9971; 100 Hz:
p�0.3568; 400 Hz: p�0.4637). Again no differ-
ences were observed comparing stimulations with
100 impulses per min (i: p�0.8096; c: p�0.5567)
or with 1500 impulses per min (i: p�0.6579; c:
p�0.8931; Figure 6E, F).
However, there was a clear effect of stimulus
intensity, raising the number of stained nuclei
on both sides with higher stimulus intensity (i:
p�0.0011*; c: p�0.0130*; Figure 6G). Against
controls, stimulation with 100 impulses per min had
no effect (i: p�0.1761; c: p�0.1632; Figure 6G),
but stimulation with 1500 impulses per min did
increase the number of positive nuclei on both sides
(i: p�0.0424*, c: p�0.0207*).
Discussion
Our set-up was designed to provide complete control
on as many stimulation parameters as possible.
By choosing EIS over acoustic stimulation, this
could be fully achieved with respect to the temporal
pattern of the stimulation, a major parameter of
Figure 4. The pattern of c-Fos expression in LSO following unilateral EIS. (A) On the side of stimulation, c-Fos positive nuclei (black dots)
emerged throughout LSO with a bias towards regions tonotopically corresponding to the intracochlear stimulation site. Scale bar for A to C:
100 mm. (B) On the unstimulated side, c-Fos positive nuclei emerged in comparable numbers. (C) In the deafened control, c-Fos positive
profiles were absent. (D) Frequency dependence of c-Fos expression. a: significant difference to all frequencies and both sides. (E)
Comparison of the effect of stimulation with different frequencies at equally low intensity (100 stimuli per min). (F) Comparison of the
effect of stimulation with different frequencies at equally high intensity (1500 stimuli per min). (G) Comparison of variable stimulation
intensities independent of frequency. c: significant difference to ipsilateral and contralateral side at 100 and 1500 stimuli per min. The
control level of c-Fos expression was significantly lower with respect to any stimulation.
222 T. Jakob & R.-B. Illing
Aud
iol M
ed D
ownl
oade
d fr
om in
form
ahea
lthca
re.c
om b
y U
nive
rsity
of
Cal
ifor
nia
Irvi
ne o
n 10
/27/
14Fo
r pe
rson
al u
se o
nly.

central auditory signal processing. By working on
anaesthetized animals, potential differences in arou-
sal states were largely levelled out. However, despite
reproducing electrode position with the greatest
possible precision, the EABR already indicated that
the effect of EIS varied considerably across animals.
A full control of stimulation patterns but limited
control in stimulation effectiveness reflects the
situation faced with human cochlear implant recei-
vers.
Unlike Saito et al. (35), we did not use the current
level of the stimulation as a variable. Instead, we
varied stimulation frequency and number of impulses
per time window. Performing statistical analysis on
the results obtained from three to six animals in each
group (Table I), we expected to invoke differences in
the pattern of stimulation-dependent gene expression
for laterality, frequency, and intensity of the stimula-
tion, but we were surprised to find a specific
fingerprint for each parameter across the major
auditory brainstem regions (Table II).
The choice of frequencies between 1 and 400 Hz
was motivated by experiments on stimulation-
dependent molecular and functional plasticity of
synapses in brain slice preparations, in which a
100 Hz burst of depolarizing pulses is considered a
Figure 5. The pattern of c-Fos expression in CIC following unilateral EIS. (A) On the side of stimulation, c-Fos positive nuclei (black dots)
were widely scattered. Scale bar for A to C: 200 mm. (B) On the unstimulated side, equal numbers of c-Fos positive nuclei were seen. (C)
Even in the deafened control, c-Fos positive profiles were numerous. (D) Frequency dependence of c-Fos expression. a: significant
difference to 50 Hz stimulation on both sides. (E) Comparison of the effect of stimulation with different frequencies at equally low intensity
(100 stimuli per min). (F) Comparison of the effect of stimulation with different frequencies at equally high intensity (1500 stimuli
per min). (G) Comparison of variable stimulation intensities independent of frequency. c: significant difference to contralateral staining
following 1500 stimuli per min.
Activity-induced gene expression in auditory brainstem 223
Aud
iol M
ed D
ownl
oade
d fr
om in
form
ahea
lthca
re.c
om b
y U
nive
rsity
of
Cal
ifor
nia
Irvi
ne o
n 10
/27/
14Fo
r pe
rson
al u
se o
nly.
strong stimulation (23). Once these stimulation
frequencies prove effective in changing the molecular
profile of central auditory neurons, the frequency
range may be extended to cover and evaluate the
clinical settings of current cochlear implants in
humans.
VCN
The pattern of IEG expression in the neuronal
network of the VCN reflects the side on which
the stimulation occurred, with more affected cells
ipsilaterally. As this difference tended to exist but
failed to reach significance in the present study
(Figure 2F, G) due to a substantial scatter across
cases (Figure 2D), we base this claim on considera-
tion of previous experience that we and others
accumulated over the past years with a slightly
different set-up (13,35,36). It should be noted,
however, that Rouiller et al. (37) after acoustic
stimulation as well as Vischer et al. (11) and Zhang
et al. (38) after electrical stimulation also failed
to induce much c-Fos in VCN. We suggest that
an indicator for a substantial ipsilateral but not
Figure 6. The pattern of c-Fos expression in MGB following unilateral EIS. (A) Expression of c-Fos occurred in neuronal nuclei (black
dots) only in the medial part of the geniculate body. Scale bar for A to C: 200 mm. On the unstimulated side, equal numbers of c-Fos positive
cells were encountered (B). (C) In the deafened control, few c-Fos positive profiles were present. (D) Frequency dependence of c-Fos
expression. a: significant difference to effect of 400 Hz on both sides. (E) Comparison of the effect of stimulation with different frequencies
at equally low intensity (100 stimuli per min). (F) Comparison of the effect of stimulation with different frequencies at equally high intensity
(1500 stimuli per min). (G) Comparison of variable stimulation intensities independent of frequency. A stimulation-dependent effect on
c-Fos expression in MBG was only seen at high intensity stimulation. c: significant difference to effect of stimulation with 1500 stimuli per
min on both sides.
224 T. Jakob & R.-B. Illing
Aud
iol M
ed D
ownl
oade
d fr
om in
form
ahea
lthca
re.c
om b
y U
nive
rsity
of
Cal
ifor
nia
Irvi
ne o
n 10
/27/
14Fo
r pe
rson
al u
se o
nly.
contralateral induction of c-Fos expression in VCN
of adult rats is an intraoperative EABR that includes
at least three clearly identifiable troughs (Figure 1).
Apart from laterality, increasing intensity was
mapped onto the pattern of c-Fos expression in
VCN with an increasing number of c-Fos positive
neurons (Figure 2G). By contrast, a constant num-
ber of impulses presented at different frequencies
did not appear to matter for the network in VCN
with respect to the induction of c-Fos expression
(Figure 2E, F).
The fact that in some experiments very few
neurons in VCN but still numerous cells in other
auditory brainstem regions turned c-Fos positive
provides further evidence that c-Fos cannot be
mistaken as a marker for electrophysiological activ-
ity, as neurons in VCN must have been brought to
spiking in order to drive subordinated neuronal
populations and trigger stimulation-dependent mo-
lecular processes in them.
DCN
Expression of c-Fos has been induced in DCN with
acoustic (8,37) or electrical (11,39) stimulation. The
results obtained here largely conform to previous
findings. The tonotopic organization of DCN was
apparent following unilateral cochleotomy and sub-
sequent acoustic stimulation (40). Our results reflect
tonotopy in the contralateral but not in the ipsilateral
DCN, where c-Fos positive cells were often scattered
across the entire nucleus. An excitatory connection
between the DCN on both sides has been described
by several authors (Brown and Liu, 1995; Vischer
et al., 1994; Luo et al., 1999). The data presented
here point to an elaborated use of this connection
with respect to bilateral processing upon unilateral
stimulation.
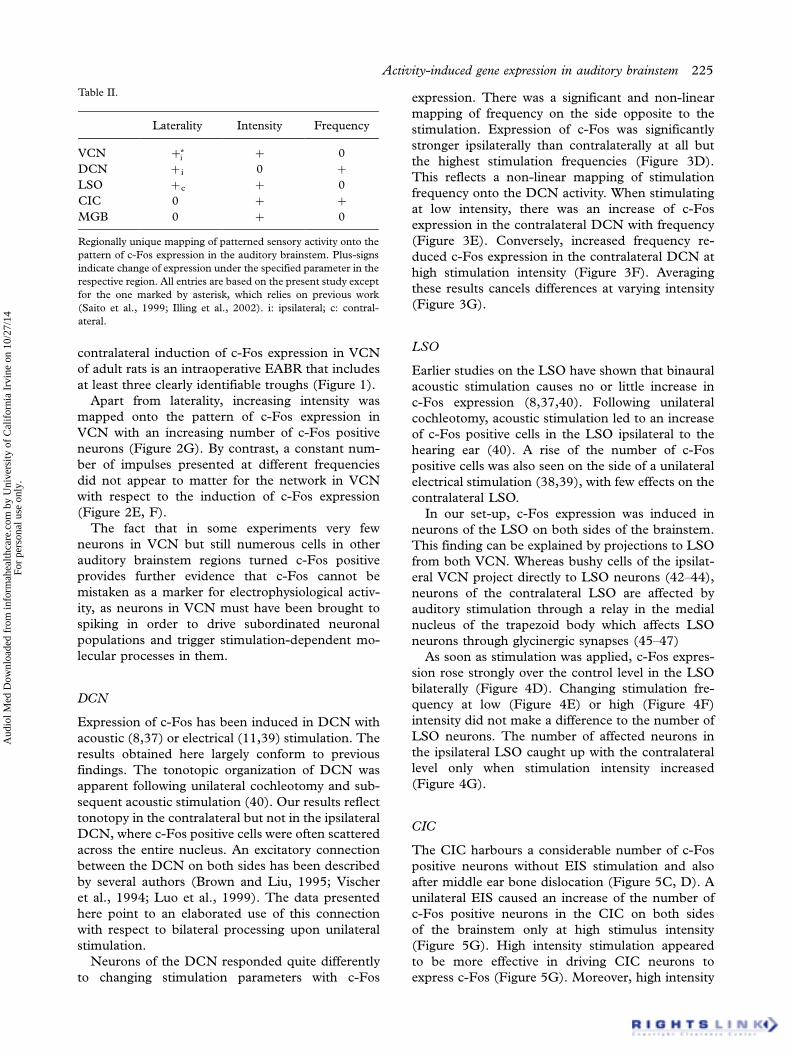
Neurons of the DCN responded quite differently
to changing stimulation parameters with c-Fos
expression. There was a significant and non-linear
mapping of frequency on the side opposite to the
stimulation. Expression of c-Fos was significantly
stronger ipsilaterally than contralaterally at all but
the highest stimulation frequencies (Figure 3D).
This reflects a non-linear mapping of stimulation
frequency onto the DCN activity. When stimulating
at low intensity, there was an increase of c-Fos
expression in the contralateral DCN with frequency
(Figure 3E). Conversely, increased frequency re-
duced c-Fos expression in the contralateral DCN at
high stimulation intensity (Figure 3F). Averaging
these results cancels differences at varying intensity
(Figure 3G).
LSO
Earlier studies on the LSO have shown that binaural
acoustic stimulation causes no or little increase in
c-Fos expression (8,37,40). Following unilateral
cochleotomy, acoustic stimulation led to an increase
of c-Fos positive cells in the LSO ipsilateral to the
hearing ear (40). A rise of the number of c-Fos
positive cells was also seen on the side of a unilateral
electrical stimulation (38,39), with few effects on the
contralateral LSO.
In our set-up, c-Fos expression was induced in
neurons of the LSO on both sides of the brainstem.
This finding can be explained by projections to LSO
from both VCN. Whereas bushy cells of the ipsilat-
eral VCN project directly to LSO neurons (42�44),
neurons of the contralateral LSO are affected by
auditory stimulation through a relay in the medial
nucleus of the trapezoid body which affects LSO
neurons through glycinergic synapses (45�47)
As soon as stimulation was applied, c-Fos expres-
sion rose strongly over the control level in the LSO
bilaterally (Figure 4D). Changing stimulation fre-
quency at low (Figure 4E) or high (Figure 4F)
intensity did not make a difference to the number of
LSO neurons. The number of affected neurons in
the ipsilateral LSO caught up with the contralateral
level only when stimulation intensity increased
(Figure 4G).
CIC
The CIC harbours a considerable number of c-Fos
positive neurons without EIS stimulation and also
after middle ear bone dislocation (Figure 5C, D). A
unilateral EIS caused an increase of the number of
c-Fos positive neurons in the CIC on both sides
of the brainstem only at high stimulus intensity
(Figure 5G). High intensity stimulation appeared
to be more effective in driving CIC neurons to
express c-Fos (Figure 5G). Moreover, high intensity
Table II.
Laterality Intensity Frequency
VCN /�+i � 0
DCN �i 0 �LSO �c � 0
CIC 0 � �MGB 0 � 0
Regionally unique mapping of patterned sensory activity onto the
pattern of c-Fos expression in the auditory brainstem. Plus-signs
indicate change of expression under the specified parameter in the
respective region. All entries are based on the present study except
for the one marked by asterisk, which relies on previous work
(Saito et al., 1999; Illing et al., 2002). i: ipsilateral; c: contral-
ateral.
Activity-induced gene expression in auditory brainstem 225
Aud
iol M
ed D
ownl
oade
d fr
om in
form
ahea
lthca
re.c
om b
y U
nive
rsity
of
Cal
ifor
nia
Irvi
ne o
n 10
/27/
14Fo
r pe
rson
al u
se o
nly.

(i.e. number of impulses per minute) was more
effective in driving gene expression at lower than at
high frequencies (Figure 5F).
With the stimulation parameters used here, few
c-Fos positive cells were encountered in the dorsal
inferior colliculus and almost none was seen in the
external inferior colliculus. Neither of these mid-
brain regions belongs to the lemniscal pathway,
and both of them appear to be involved, at least in
part, in non-auditory functions (48,49). In experi-
ments by other researchers using different set-ups
for unilateral electrical stimulation, plenty of c-Fos
positive cells emerged in dorsal and external inferior
colliculus, whereas few cells turned c-Fos positive in
CIC (11,39). The major difference from our experi-
mental set-up was that their stimulation affected the
entire cochlea or the entire cochlear nerve. Vischer
et al. (11) suspect that under generalized activation
distinctly tonotopic auditory brainstem regions such
as VCN, CIC, and ventral MGB failed to initiate a
stimulation-dependent gene expression.
MGB
Yet another pattern of stimulation-dependent gene
expression was encountered in the auditory thala-
mus (Table II). The MGB responded to EIS with
increased c-Fos expression only in its medial, non-
lemniscal subdivision (Figure 6A�C). As in CIC,
neurons of the medial MGB did not respond to
lower stimulation intensity with c-Fos expression as
the number of c-Fos positive nuclei did not differ at
100 impulses per min compared to the control.
There was no indication for a differential expression
pattern with changing frequency (Figure 6E, F).
However, there was a clear reflection of stimulus
intensity on both sides (Figure 6G).
Conclusions
Specific conditions of afferent activity prompted
specific populations of neurons in specific regions
of the auditory brainstem to prepare for a molecular,
structural, and functional remodelling within hours.
Laterality, frequency, and intensity of the stimulus
each affect different neurons in different regions.
Coding of laterality takes place below the midbrain,
but appears to be lost from the inferior colliculus
upwards. Each major brainstem region involved in
the analysis of auditory stimuli responded to the
stimulation parameters by a unique dynamic pattern
of c-Fos expression (Table II). Having chosen to
start our studies by reference to experiments on the
activity/molecular connection in synaptic plasticity,
we have made a first step. There is reason to consider
these data transferable to man. However, our study
is not comprehensive in the sense that it already
provides binding recommendations to CI program-
mers or users. Instead, it provides data showing for
the first time that the parameters of running a CI
bear a very real potential for neuroplastic remodel-
ling of the central auditory system.
Acknowledgements
We thank I. Hirschmuller-Ohmes, P. Pedersen, A.
Reisch, M. Fredrich, M. Meidinger, and H. Hildeb-
randt-Schoenfeld for valuable help, and R. Laszig
for continuous support. We gratefully received sup-
port from the Research Commission of Universi-
tatsklinikum Freiburg i. Br. and Cochlear GmbH,
Hannover.
References
1. Morgan JI, Curran T. Stimulus-transcription coupling in
neurons: role of cellular immediate-early genes. Trends
Neurosci. 1989;/12:/459�62.
2. Sukhatme VP, Cao XM, Chang LC, Tsai-Morris CH,
Stamenkovich D, Ferreira PC, et al. A zinc finger-encoding
gene coregulated with c-Fos during growth and differentia-
tion, and after cellular depolarization. Cell. 1988;/53:/37�43.
3. Christy BA, Lau LF, Nathans D. A gene activated in mouse
3T3 cells by serum growth factors encodes a protein with
‘zinc finger’ sequences. Proc Natl Acad Sci USA. 1988;/85:/
7857�61.
4. Milbrandt J. A nerve growth factor-induced gene encodes a
possible transcriptional regulatory factor. Science. 1987;/238:/
797�9.
5. Lemaire P, Revelant O, Bravo R, Charnay P. Two mouse
genes encoding potential transcription factors with identical
DNA-binding domains are activated by growth factors in
cultured cells. Proc Natl Acad Sci USA. 1988;/85:/4691�5.
6. Cole AJ, Saffen DW, Baraban JM, Worley PF. Rapid increase
of an immediate early gene messenger RNA in hippocampal
neurons by synaptic NMDA receptor activation. Nature.
1989;/340:/474�6.
7. Rampon C, Jiang CH, Don H, Tan YP, Lockhart D, Schultz
P, et al. Effects of environmental enrichment on gene
expression in the brain. Proc Natl Acad Sci USA. 2000;/97:/
12880�4.
8. Ehret G, Fischer R. Neuronal activity and tonotopy in the
auditory system visualized by c-Fos gene expression. Brain
Res. 1991;/567:/350�4.
9. Friauf E. c-Fos immunocytochemical evidence for acoustic
pathway mapping in rats. Behav Brain Res. 1995;/66:/217�24.
10. Hillman DE, Gordon CE, Troublefield Y, Stone E, Giacchi
RJ, Chen S. Effect of unilateral tympanotomy on auditory
induced c-Fos expression in cochlear nuclei. Brain Res. 1997;/
748:/77�84.
11. Vischer MW, Hausler R, Rouiller EM. Distribution of
Fos-like immunoreactivity in the auditory pathway of the
Sprague-Dawley rat elicited by cochlear electrical stimulation.
Neurosci Res. 1994;/19:/175�85.
12. Saito H, Miller JM, Altschuler RA. Cochleotopic fos im-
munoreactivity in cochlea and cochlear nuclei evoked by
bipolar cochlear electrical stimulation. Hear Res. 2000;/145:/
37�51.
226 T. Jakob & R.-B. Illing
Aud
iol M
ed D
ownl
oade
d fr
om in
form
ahea
lthca
re.c
om b
y U
nive
rsity
of
Cal
ifor
nia
Irvi
ne o
n 10
/27/
14Fo
r pe
rson
al u
se o
nly.

13. Illing RB, Michler SA, Kraus KS, Laszig R. Transcription
factor modulation and expression in the rat auditory brain-
stem following electrical intracochlear stimulation. Exp Neu-
rol. 2002;/175:/226�44.
14. Nakamura M, Rosahl SK, Alkahlout E, Gharabaghi A, Walter
GF, Samii M. C-Fos immunoreactivity mapping of the
auditory system after electrical stimulation of the cochlear
nerve in rats. Hear Res. 2003;/184:/75�81.
15. Herdegen T, Leah JD. Inducible and constitutive transcrip-
tion factors in the mammalian nervous system: control of gene
expression by Jun, Fos and Krox, and CREB/ATF proteins.
Brain Res Rev. 1998;/28:/370�490.
16. Wisdom R. AP-1: one switch for many signals. Exp Cell Res.
1999;/253:/180�5.
17. De Groen PC, Eggen BJ, Gispen WH, Schotman P, Schrama
LH. Cloning and promoter analysis of the human B-50/GAP-
43 gene. J Mol Neurosci. 1995;/6:/109�19.
18. Rylski M, Kaczmarek L. AP-1 targets in the brain. Front
Biosci. 2004;/9:/8�23.
19. Benowitz LI, Routenberg A. GAP-43: an intrinsic determi-
nant of neuronal development and plasticity. Trends Neu-
rosci. 1997;/20:/84�91.
20. Kaczmarek L, Lapinska-Dzwonek J, Szymczak S. Matrix
metalloproteinases in the adult brain physiology: a link
between c-Fos, AP-1 and remodelling of neuronal connec-
tions? EMBO J. 2002;/21:/6643�8.
21. Meidinger MA, Hildebrandt-Schoenfeld H, Illing RB. Co-
chlear damage induces GAP-43 expression in cholinergic
synapses of the rat cochlear nucleus: a light and electron
microscopical study. Eur J Neurosci. 2006;/23:/3187�99.
22. Bliss TV, Lomo T. Long-lasting potentiation of synaptic
transmission in the dentate area of the anaesthetized rabbit
following stimulation of the perforant path. J Physiol. 1973;/
232:/331�56.
23. Hoelscher C, Richter-Levin G, editors. Neuronal Mechan-
isms of Memory Formation. Cambridge: Cambridge Univ.
Press; 2001.
24. Worley PF, Bhat RV, Baraban JM, Erickson CA, McNaugh-
ton BL, Barnes CA. Thresholds for synaptic activation of
transcription factors in hippocampus: correlation with long-
term enhancement. J Neurosci. 1993;/13:/4776�86.
25. Kaczmarek L. Expression of c-Fos and other genes encoding
transcription factors in long-term potentiation. Behav Neural
Biol. 1992;/57:/263�6.
26. Demmer J, Dragunow M, Lawlor PA, Mason SE, Leah JD,
Abraham WC, et al. Differential expression of immediate
early genes after hippocampal long-term potentiation in
awake rats. Mol Brain Res. 1993;/17:/279�86.
27. Jones MW, Errington ML, French PJ, Fine A, Bliss TV, Garel
S, et al. A requirement for the immediate early gene Zif268 in
the expression of late LTP and long-term memories. Nat
Neurosci. 2001;/4:/289�96.
28. Fleischmann A, Hvalby O, Jensen V, Strekalova T, Zacher C,
Layer LE, et al. Impaired long-term memory and NR2A-type
NMDA receptor-dependent synaptic plasticity in mice lack-
ing c-Fos in the CNS. J Neurosci. 2003;/23:/9116�22.
29. Duncan GE, Johnson KB, Breese GR. Topographic patterns
of brain activity in response to swim stress: assessment by
2-deoxyglucose uptake and expression of Fos-like immunor-
eactivity. J Neurosci. 1993;/13:/3932�43.
30. Reimer K. Simultaneous demonstration of Fos-like immu-
noreactivity and 2-deoxy-glucose uptake in the inferior
colliculus of the mouse. Brain Res. 1993;/616:/339�43.
31. White LE, Price JL. The functional anatomy of limbic status
epilepticus in the rat. I. Patterns of 14C-2-deoxyglucose
uptake and Fos immunocytochemistry. J Neurosci. 1993;/13:/
4787�809.
32. Kearney JA, Frey KA, Albin RL. Metabotropic glutamate
agonist-induced rotation: a pharmacological, FOS immuno-
histochemical, and [14C]-2-deoxyglucose autoradiographic
study. J Neurosci. 1997;/17:/4415�25.
33. Illing RB, Reisch A. Specific plasticity responses to unilat-
erally decreased or increased hearing intensity in the adult
cochlear nucleus and beyond. Hear Res. 2006;216/217,
189�97.
34. Illing RB, Horvath M, Laszig R. Plasticity of the auditory
brainstem: effects of cochlear lesions on GAP-43 immunor-
eactivity in the rat. J Comp Neurol. 1997;/382:/116�38.
35. Saito H, Miller JM, Pfingst BE, Atschuler RA. Fos-like
immunoreactivity in the auditory brainstem evoked by bipolar
intracochlear electrical stimulation: effects of current level
and pulse duration. Neuroscience. 1999;/91:/139�61.
36. Illing RB, Michler SA. Modulation of P-CREB and expres-
sion of c-Fos in cochlear nucleus and superior olive following
electrical intracochlear stimulation. Neuroreport. 2001;/12:/
875�8.
37. Rouiller EM, Wan XS, Moret V, Liang F. Mapping of c-Fos
expression elicited by pure tones stimulation in the auditory
pathways of the rat, with emphasis on the cochlear nucleus.
Neurosci Lett. 1992;/144:/19�24.
38. Zhang JS, Haenggeli CA, Tempini A, Vischer MW, Moret V,
Rouiller EM. Electrically induced Fos-like immunoreactivity
in the auditory pathway of the rat: effects of survival time,
duration, and intensity of stimulation. Brain Res Bull. 1996;/
39:/75�82.
39. Nakamura M, Rosahl SK, Alkahlout E, Walter GF, Samii
MM. Electrical stimulation of the cochlear nerve in rats:
analysis of c-Fos expression in auditory brainstem nuclei.
Brain Res. 2005;/1031:/39�55.
40. Luo L, Ryan AF, Saint Marie RL. Cochlear ablation alters
acoustically induced c-fos mRNA expression in the adult rat
auditory brainstem. J Comp Neurol. 1999;/404:/271�83.
41. Brown MC, Liu TS. Fos-like immunoreactivity in central
auditory neurons of the mouse. J Comp Neurol. 1995;/357:/
85�97.
42. Warr WB. Fibre degeneration following lesions in the anterior
ventral cochlear nucleus of the cat. Exp Neurol. 1966;/14:/
453�74.
43. Cant NB. The fine structure of the lateral superior olivary
nucleus of the cat. J Comp Neurol. 1984;/227:/63�77.
44. Glendenning KK, Hutson KA, Nudo RJ, Masterton RB.
Acoustic chiasm II: anatomical basis of binaurality in lateral
superior olive of cat. J Comp Neurol. 1985;/232:/261�85.
45. Moore MJ, Caspary DM. Strychnine blocks binaural inhibi-
tion in lateral superior olivary neurons. J Neurosci. 1983;/3:/
237�42.
46. Saint Marie RL, Luo L, Ryan AF. Effects of stimulus
frequency and intensity on c-fos mRNA expression in the
adult rat auditory brainstem. J Comp Neurol. 1999;/404:/258�70.
47. Adams JC, Mugnaini E. Immunocytochemical evidence for
inhibitory and disinhibitory circuits in the superior olive. Hear
Res. 1990;/49:/281�98.
48. Aitkin LM, Dickhaus H, Schult W, Zimmerman N. External
nucleus of the inferior colliculus: auditory and spinal soma-
tosensory afferents and their interactions. J Neurophysiol.
1978;/41:/421�40.
49. Oliver DL, Huerta MF. Inferior and superior colliculi. In:
Webster DB, Popper AN, Fay RR, editors. The Mammalian
Auditory Pathway: Neuroanatomy. New York: Springer;
1992. p. 168�221.
Activity-induced gene expression in auditory brainstem 227
Aud
iol M
ed D
ownl
oade
d fr
om in
form
ahea
lthca
re.c
om b
y U
nive
rsity
of
Cal
ifor
nia
Irvi
ne o
n 10
/27/
14Fo
r pe
rson
al u
se o
nly.