
Large Format Posters - The iCAPTURE Centre · Large Format Posters 06-19-2008 Programs – Why...
11
1 Large Format Posters 06-19-2008 Programs – Why Power Point? There are many different ways to build a poster and you can use many different programs like: Corel Draw, Illustrator, Power Point and Adobe In Design. We believe that most people will use Power Point to make posters because the program is available on all computers here, almost everyone has used the program and most feel comfortable with it. Often people use slides that they have already created for other presentations to make their posters, so it makes a lot of sense to use Power Point. We like it because excel and word integrate so well with it, and are fully editable once they are embedded. This is not always the case with the Adobe products. Limitations of Power Point Some limitations of Power Point are: 1. Size restraints You can’t make a poster that is longer than 56 inches when working at a100% scale. Chances are that you won’t need to go larger, but if you do this can be worked around by making a smaller poster and then scaling the size up when it is printed. For example a 36” x 56” poster can be scaled to 44”x 68” when it is printed. (As noted below there is a poster template available that can be scaled to 36” x 60”). 2. Conversion and compression of images to unknown formats Once images are put into Power Point they are “magically compressed”. Image quality is not affected enough to be concerned for a poster, however if your poster needs to be used later for publishing, Power Point is not the program to use. 3. File conversions for printing What you see is not always what you get. If your poster looks good on regular printers, it may not on our large format printer. We have experienced major problems with images that are not RGB tiffs (indexed colour and some images generated from the confocal microscope). 4. Macintosh Files Power Point and Excel Files created on a Macintosh are almost guaranteed to give us problems. Please try to create all of you files on a PC. If this is not possible, allow extra time to have your poster printed. Size and Resolution Our printer is capable of 42” wide by 90 feet long (way beyond the capability of Power Point). It will print up to a resolution of 1440 dpi. This high quality will not be necessary in most cases for posters which we will print at 720 dpi. We have three paper sizes: 24”, 36” and 42”. The 24” paper comes in double weight matte as well as semi gloss photo paper. The 36” paper comes in semi-gloss and glossy, while the 42” comes only in the semi-gloss. The semi-gloss paper is the most popular for final posters but the glossy can also look very professional if you have a lot of images/graphics. Templates To simplify things, we have made a few different poster “templates” as well as a logo Power Point and Poster Making Instructions. They are located on: Internet at – http://www.icapture.ubc.ca/posters/index.html Intranet at - http://home.icapture.ubc.ca/services/imaging/howto.htm
Transcript of Large Format Posters - The iCAPTURE Centre · Large Format Posters 06-19-2008 Programs – Why...

1
Large Format Posters
06-19-2008 Programs – Why Power Point? There are many different ways to build a poster and you can use many different programs like: Corel Draw, Illustrator, Power Point and Adobe In Design. We believe that most people will use Power Point to make posters because the program is available on all computers here, almost everyone has used the program and most feel comfortable with it. Often people use slides that they have already created for other presentations to make their posters, so it makes a lot of sense to use Power Point. We like it because excel and word integrate so well with it, and are fully editable once they are embedded. This is not always the case with the Adobe products. Limitations of Power Point Some limitations of Power Point are:
1. Size restraints You can’t make a poster that is longer than 56 inches when working at a100% scale. Chances are that you won’t need to go larger, but if you do this can be worked around by making a smaller poster and then scaling the size up when it is printed. For example a 36” x 56” poster can be scaled to 44”x 68” when it is printed. (As noted below there is a poster template available that can be scaled to 36” x 60”).
2. Conversion and compression of images to unknown formats Once images are put into Power Point they are “magically compressed”. Image quality is not affected enough to be concerned for a poster, however if your poster needs to be used later for publishing, Power Point is not the program to use.
3. File conversions for printing What you see is not always what you get. If your poster looks good on regular printers, it may not on our large format printer. We have experienced major problems with images that are not RGB tiffs (indexed colour and some images generated from the confocal microscope).
4. Macintosh Files Power Point and Excel Files created on a Macintosh are almost guaranteed to give us problems. Please try to create all of you files on a PC. If this is not possible, allow extra time to have your poster printed.
Size and Resolution Our printer is capable of 42” wide by 90 feet long (way beyond the capability of Power Point). It will print up to a resolution of 1440 dpi. This high quality will not be necessary in most cases for posters which we will print at 720 dpi. We have three paper sizes: 24”, 36” and 42”. The 24” paper comes in double weight matte as well as semi gloss photo paper. The 36” paper comes in semi-gloss and glossy, while the 42” comes only in the semi-gloss. The semi-gloss paper is the most popular for final posters but the glossy can also look very professional if you have a lot of images/graphics. Templates To simplify things, we have made a few different poster “templates” as well as a logo Power Point and Poster Making Instructions. They are located on: Internet at – http://www.icapture.ubc.ca/posters/index.html Intranet at - http://home.icapture.ubc.ca/services/imaging/howto.htm
2
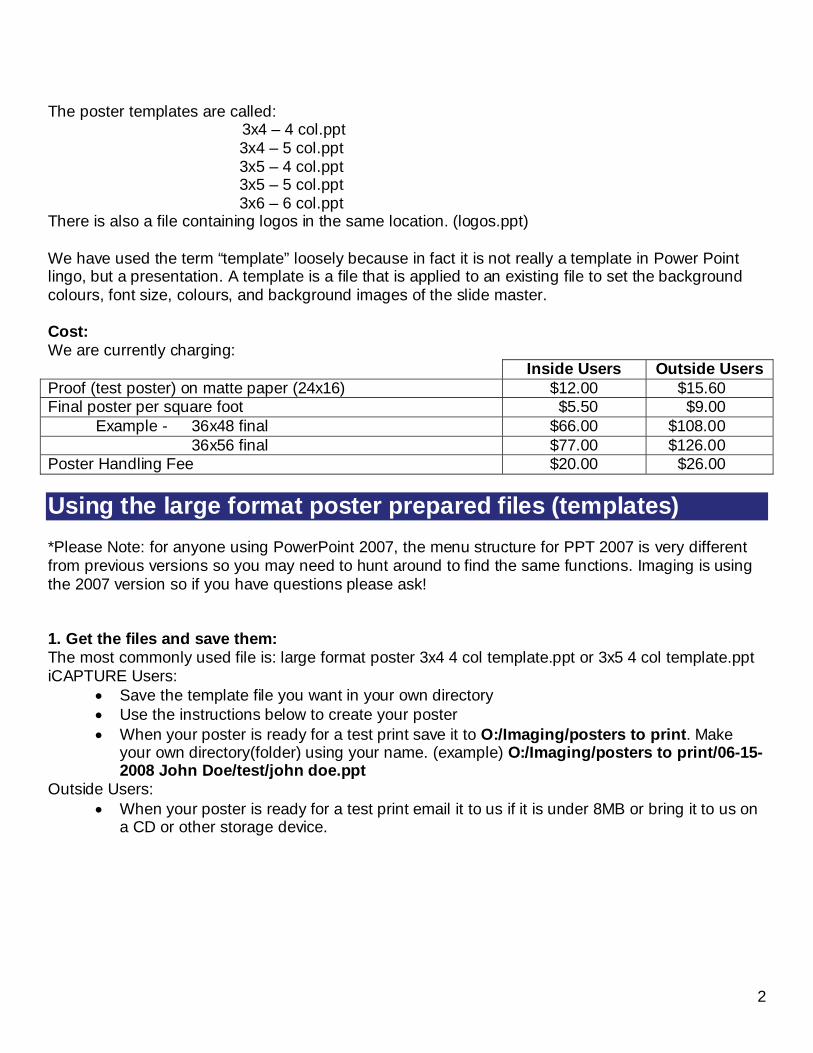
The poster templates are called: 3x4 – 4 col.ppt 3x4 – 5 col.ppt 3x5 – 4 col.ppt 3x5 – 5 col.ppt
3x6 – 6 col.ppt There is also a file containing logos in the same location. (logos.ppt) We have used the term “template” loosely because in fact it is not really a template in Power Point lingo, but a presentation. A template is a file that is applied to an existing file to set the background colours, font size, colours, and background images of the slide master. Cost: We are currently charging: Inside Users Outside Users Proof (test poster) on matte paper (24x16) $12.00 $15.60 Final poster per square foot $5.50 $9.00 Example - 36x48 final $66.00 $108.00 36x56 final $77.00 $126.00 Poster Handling Fee $20.00 $26.00 Using the large format poster prepared files (templates) *Please Note: for anyone using PowerPoint 2007, the menu structure for PPT 2007 is very different from previous versions so you may need to hunt around to find the same functions. Imaging is using the 2007 version so if you have questions please ask! 1. Get the files and save them: The most commonly used file is: large format poster 3x4 4 col template.ppt or 3x5 4 col template.ppt iCAPTURE Users:
• Save the template file you want in your own directory • Use the instructions below to create your poster • When your poster is ready for a test print save it to O:/Imaging/posters to print. Make
your own directory(folder) using your name. (example) O:/Imaging/posters to print/06-15-2008 John Doe/test/john doe.ppt
Outside Users: • When your poster is ready for a test print email it to us if it is under 8MB or bring it to us on
a CD or other storage device.

3
2. Understanding the background, guidelines and other tools provided Background:
• In the background of the template is a grid of red lines and yellow columns. It is there to help you place the images and text. It will be turned off before printing.
• Guidelines are also included in the poster. They can easily be moved and more can be
added. They will not print. To add another guideline, select a current guideline, hold the control key down (to duplicate), then move the cursor to the new position.
• To turn off the background image select format then background, then click on the check box to “omit background graphics from master”

4
3. Adding content Adding Power Point Slides- If you are taking content from previously made slide presentations, open the presentation and poster template and arrange them side by side. You can do this by opening both Power Point files, click on “Windows” in the top menu bar and then choose “Arrange All” or “Cascade”.

5
Copy and Pasting each Individual Slide: There are two ways to get your information from your presentation onto your poster template:
1) You can copy each section from your presentation and paste it over the existing text on the template (EDIT>PASTE SPECIAL>UNFORMATTED TEXT). If you do this the text will automatically format to what is already on the poster template (much faster).
2) Or you can highlight the text in your presentation and drag it onto the poster template. If you do this the text will not be formatted therefore you will have to format it manually.

6
Adding Content from MS Word- Open the word file. Select the paragraphs. Copy them to the clipboard. Minimize or close the word file. Select the template text box and paste in the abstract using: EDIT>PASTE SPECIAL> UNFORMATTED TEXT. The text will now adopt the format of the text on the template. Alternatively you can make a new text box. The size will have to be changed to match the other text boxes later (this will create more steps and therefore take you more time).
Tables
• DO NOT use power point to make tables. They are hard to work with and look bad. Make the table in MS Word. When you are finished, select the table. Copy it to the clipboard then EDIT > PASTE SPECIAL > Microsoft Word Document Object. By keeping it as a word document object, it will be easy to alter colours, spacing etc later, If you just “paste” the table in, it will adopt the html format and be very difficult to work with and will not look good.
• If you need to make the table larger – SCALE it. This can be done by either hold down the shift key, then dragging a corner or by right clicking on the table and selecting “Format Object” and selecting the “Size” tab. Ensure that the lock aspect ratio box is clicked on, then change the percentage.
• If you don’t scale the table properly, it will become distorted and look bad.
• See the Tips and TRICKS section below for more details about tables.
GRAPHS
• DO NOT use Power Point to make graphs. As for tables, power point graphs are hard to work with. Use MS Excel for the best results.
• Excel Tips – o If you are making more than 1 graph, start by spending a lot of time on the one that will
be the largest graph. Make all of the font sizes perfect. Once you are really happy with this graph, copy and paste it into the worksheet. Then simply change the source of its data. You will have a second perfect graph that you will not need to spend any time on. It will be the same size, have the same font sizes, and use the same colours. This will make your poster look professional.
7
• Do not choose a graded fill in excel unless you are sure that you will not want to change the colour. If you want to change the colour when it is in PowerPoint, it will be impossible to do and will need to be changed.
• If you need to make the graphs larger once they are in Power Point – SCALE them. Using the same method for scaling tables - select the graph (or groups of graphs if you have more than 1) then either hold down the shift key, and drag a corner or by right clicking on the graph and selecting “Format Object” then selecting the “Size” tab. Ensure that the lock aspect ratio box is clicked on, then change the percentage. (see tables) If you don’t scale them, they will become distorted.
• When making graphs, use solid fills as the patterns do not pdf properly. IMAGES
• Power point compresses images to an unknown format • For best results use 300 dpi jpg or tif images. • Please make sure your images are either RGB or Greyscale, not CMYK or Index color. • If you will be inserting groupings of images, make them all the same size. This is best done in
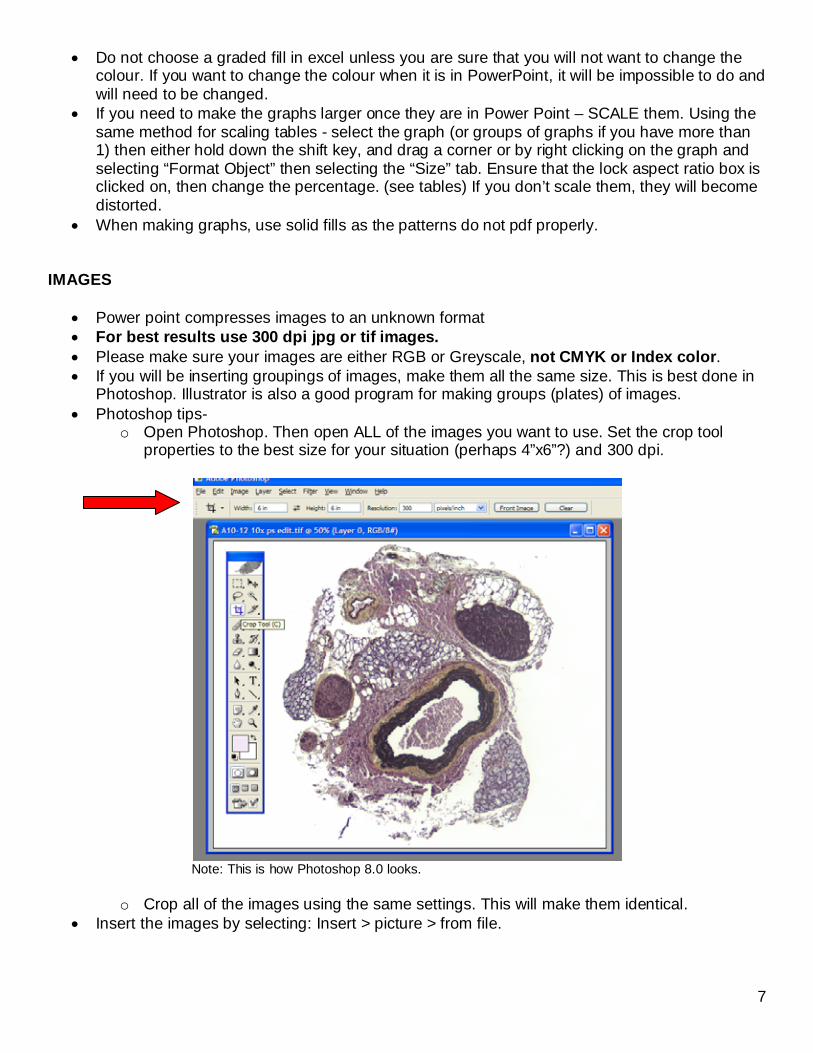
Photoshop. Illustrator is also a good program for making groups (plates) of images. • Photoshop tips-
o Open Photoshop. Then open ALL of the images you want to use. Set the crop tool properties to the best size for your situation (perhaps 4”x6”?) and 300 dpi.
Note: This is how Photoshop 8.0 looks.
o Crop all of the images using the same settings. This will make them identical.
• Insert the images by selecting: Insert > picture > from file.

8
If you need to make the images larger once they are in Power Point – SCALE them in the same way that tables and graphs are scaled. This can be done by selecting all of the images (hold the shift key down and click each one) then either hold down the shift key, then drag a corner or by right clicking on the graph and selecting “Format Picture” then selecting the “Size” tab. Ensure that the lock aspect ratio box is clicked on, then change the percentage (see Tables). If you don’t scale them properly, they will become distorted. Tips and Tricks
Changing the Fonts Globally If you end up with some different fonts that were carried over from a PowerPoint, word, or excel file, it is easy to change all of the fonts on the poster at once.
Numbered Lists (and bullets)
• They are essentially a form of bullet. • Numbered lists are easy to make in Office 2000 and XP. This is not the case for previous
versions. • Like bullets, the key to making the list look good is - indentation. • Type the number. Push the tab key, then enter the text. When the text drops down to the next
line – indent the second line below the tab. The ruler should look like this:
Aligning the “±” sign in a table.
• You can add characters (in power point) by clicking: insert > character, this will bring up the character window from which you can select the desired character.

9
To place the ± sign in a table and align it is fairly simple.
1. Create the table. It is not necessary to put a space before and after the ± sign. 2. Adjust the column widths so they are identical and large enough to accommodate the longest
set of numbers. 3. Align the cells to the left 4. Highlight all of the cells that contain numbers. Set the tabs in the center of the columns. You
need the first to be aligned right (1). The second aligned in the center (2) and the third aligned left (3), (This is under format-tabs).
5. As long as you have the text left aligned, you can place the cursor at the left of the text (left of 2.71). Hold down the control key and hit tab. Place the cursor to the left of ±. Again hold down the control key and press the tab key. Move the cursor to the right of ±. Hold down the control key and press the tab key. Repeat this for each cell. Now all of the ± signs are aligned and your table has a professional look.
1 2 3
10
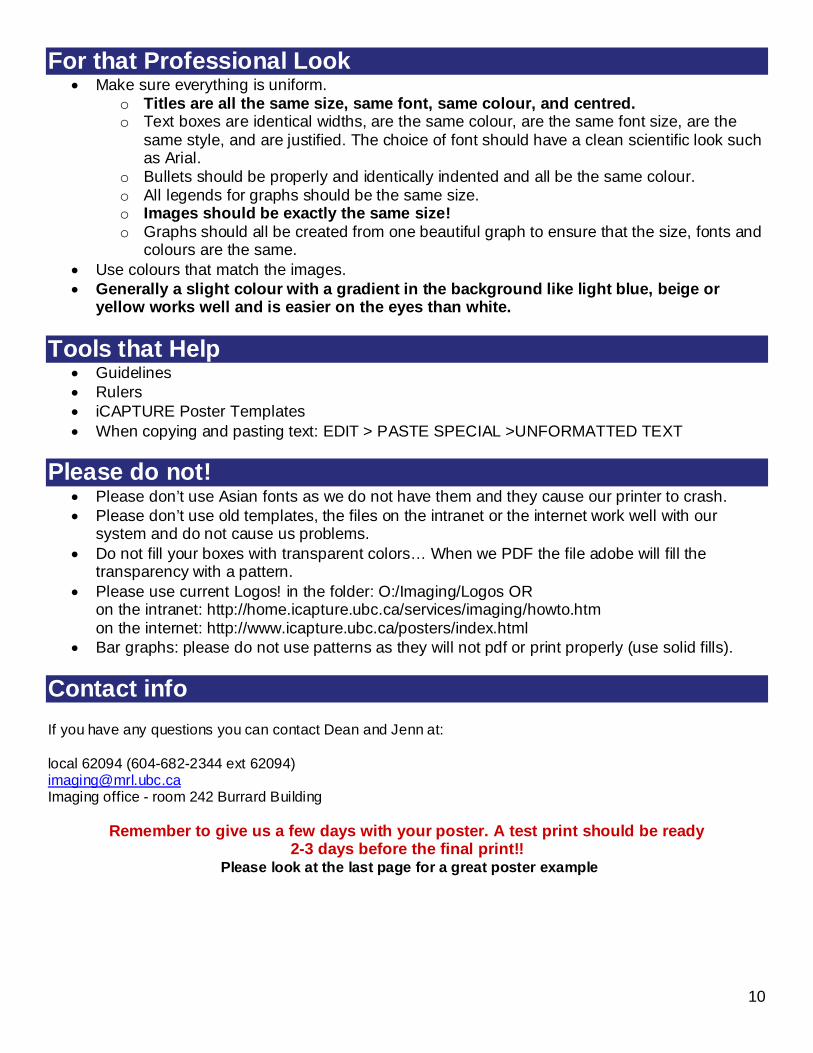
For that Professional Look • Make sure everything is uniform.
o Titles are all the same size, same font, same colour, and centred. o Text boxes are identical widths, are the same colour, are the same font size, are the
same style, and are justified. The choice of font should have a clean scientific look such as Arial.
o Bullets should be properly and identically indented and all be the same colour. o All legends for graphs should be the same size. o Images should be exactly the same size! o Graphs should all be created from one beautiful graph to ensure that the size, fonts and
colours are the same. • Use colours that match the images. • Generally a slight colour with a gradient in the background like light blue, beige or
yellow works well and is easier on the eyes than white. Tools that Help
• Guidelines • Rulers • iCAPTURE Poster Templates • When copying and pasting text: EDIT > PASTE SPECIAL >UNFORMATTED TEXT
Please do not!
• Please don’t use Asian fonts as we do not have them and they cause our printer to crash. • Please don’t use old templates, the files on the intranet or the internet work well with our
system and do not cause us problems. • Do not fill your boxes with transparent colors… When we PDF the file adobe will fill the
transparency with a pattern. • Please use current Logos! in the folder: O:/Imaging/Logos OR
on the intranet: http://home.icapture.ubc.ca/services/imaging/howto.htm on the internet: http://www.icapture.ubc.ca/posters/index.html
• Bar graphs: please do not use patterns as they will not pdf or print properly (use solid fills). Contact info If you have any questions you can contact Dean and Jenn at: local 62094 (604-682-2344 ext 62094) [email protected] Imaging office - room 242 Burrard Building
Remember to give us a few days with your poster. A test print should be ready 2-3 days before the final print!!
Please look at the last page for a great poster example

Figure 6. VEGF-induced transferrin uptake is reduced by 2hHCMEC were incubated with AlexaFluor® 594-conjugated transf errin (pseudocolored green) and stained with Texas Red® DHPE (red) and Hoechst 33342 (blue) to v isualize lipid membranes and nuclei, respectively. Cells were left untreated [a] or incubated with VEGF-A165 [b] and the uptake of transferrin was captured ov er time. Two hours post-stimulation with VEGF, we observ ed increased transf errin uptake in HCMEC in VEGF-treated cells compared to control, howev er, there was less transf errin present within cells compared to the 30 minute time point.
HOW TO MAKE A GREAT POSTER (Arial 60pt)Here are some pointers for making a great poster (Arial 45pt)The James Hogg iCAPTURE Centre for Cardiovascular and Pulmonary Research,
Department of Pathology and Laboratory Medicine, St. Paul's Hospital / Providence Health Care - University of British Columbia. (Arial 36)
Introduction (Arial 40pt)Vascular permeability can be defined as the movement of
materials from the lumen of blood vessels into the subendothelial layer and possibly into the underlying tissue. A number of disorders are associated w ith dysfunction in vascular permeability. Diabetes is complicated by the increase in endothelial permeability to plasma components, leading to accelerated coronary artery disease and atherosclerosis1,2. A similar mechanism occurs in vessels post-transplantation, giving rise to transplant vascular disease and resulting in subsequent rejection of the graft3,4.
Vascular endothelial growth factor (VEGF) is a potent and specific mitogen for vascular endothelial cells that is capable of stimulating angiogenesis and is one of the most potent inducers of vascular permeability known5-9. Previous reports have suggested that VEGF may enhance vascular permeability by affecting tight junction assembly via Src, PKB-, or eNOS-dependent pathways10-14. We hypothesizethat VEGF modulates tight junctions between endothelial cells, resulting in the formation of intercellular gaps and an increased permeability to lipoproteins. The underlying goal of our experiments is to determine the route of VEGF-induced endothelial hyperpermeability.
Materials and Methods (Arial 40pt)• Human cardiac microv essel endothelial cells (HCMEC) were
grown on 100% confluence, serum starv ed for 24 hours, followed by treatment with 100pg/mL VEGF-A165
• Differential interference contrast (DIC) microscopy was used to capture a real-time time series of the effects of VEGF stimulation
• Immunocytochemistry (ICC) was performed on HCMEC grown in 8-well chamber slides for platelet and endothelial cell adhesion molecule-1 (PECAM-1, CD31), and zonula occludens-1 (ZO-1)
• For permeability assays, HCMEC were grown to confluence on Fluoroblok® inserts in 24-well plates, diI-labeled LDL or –acLDL was added on top of confluent EC monolayers and passage through the monolayers was measured by a fluorometer
• Horseradish peroxidase (HRP) tracer was added to confluent EC monolayers grown on transwell inserts. Cells were fixed in glutaraldehyde, inserts were cut length-wise and embedded in epoxy. Blocks were sectioned, treated with diaminobenzidine (DAB) substrate, then imaged using transmission electron microscopy (TEM)
• AlexaFluor® 594-conjugated transferrin was added to confluent HCMEC then uptake was imaged using confocal microscopy
Abstract (Arial 40pt)Background: Vascular endothelial growth factor (VEGF) is specific mitogen for vascular endothelial cells and is a potent inducer of vascular permeability. Vascular permeability is a proposed mechanism for the rapid insudation of lipids and lipoprotei ns which occurs post-transplantation in the pathogenesis of transplant vascular disease. Our laborator y has previously demonstrated that VEGF can significantl y reduce the integrity of tight junctions and increase the permeability of low density lipoproteins across the endothelial monolayer. The goal of our experiments was to determi ne the mechanism of VEGF-induced tight junctional disassembl y and elucidate the route of induced vascular permeability.Hypothesis: Vascular endothelial growth factor induces phosphorylation-dependent disassociation of endothelial tight junctions, leading to increased permeability.Methods: Human coronary artery, cardiac microvessel, and umbilical vein endothelial cells were grown to 100% confluence on collagen-coated cultureware. Cells were treated with VEGF, then imaged using confocal microscopy in real time, using AlexaFluor® 488-tagged phalloidin and Hoechst 33342 to visualize F-actin and nuclei. Cell lysates were obtained at 15, 30, 60, and 120 minutes and Western bl ot was used to assess the expression and phosphoryl ation status of occludin, ZO-1, and claudin, complemented with alkaline phosphatase dephosphorylati on anal ysis. As well, horseradish peroxidase (HRP) tracer was used to assess VEGF-induced permeability using transmission electron microscopy (TEM). Finally, we have optimized the transfection of a ZO1-GFP construct and experiments are currently underway to image the alterations in ZO1 localization in real ti me using confocal microscopy.Results: Upon sti mulation with VEGF, cell retracti on and intercellular gap formation was visualized in real ti me using differential interference contrast (DIC) microscopy and fluorescent visualization of F-actin and nuclei. Phosphor ylation of occludin, ZO-1, and claudin was evident within 15 minutes as assessed by Western blot and alkaline phosphatase dephosphor ylation anal ysis. As well, after VEGF-treatment, more HRP tracer was noticeable within intracellular vesicles upon TEM examination.Summary: We have demonstrated in human coronary arter y, cardiac microvessel and umbilical vein endothelial cells that VEGF can induce cell retraction, actin disorganization, and phosphor ylation of tight junction proteins resulting in disruption of endothelial tight junctions. As well, TEM examination has demonstrated HRP tracer uptake in endothelial cells upon VEGF-stimulation. These data suggest two possible mechanisms of induced endothelial permeability upon VEGF stimulation. More experiments are currentl y underway to image low density lipoprotei n transport across the endothelium after VEGF stimulation in real time using a ZO1-GFP construct and confocal microscopy.
Conclusions (Arial 40pt)We hav e observed VEGF-A165 induced intercellular gap
formation and cell retraction in real time. In conjunction, we hav e determined that tight junctional proteins localize along HCMEC membranes in culture, and stimulation with VEGF increase both occludin and ZO-1 protein levels.
We have demonstrated increased passage of LDL through endothelial monolayers. VEGF-A121 induced 10-20% increases in LDL permeability, while VEGF-A165 and VEGF-D increased the passage of LDL through HCMEC monolayers as much as 40%. Interestingly, only VEGF-A165 and VEGF-D significantly increased acLDL permeability through EC monolayers. This may suggest an increase in intracellular passage of LDL induced by these stimuli.
Using HRP tracer v isualized by TEM, and AlexaFluor® 594-conjugated transferrin visualized by confocal microscopy, we hav e determined that VEGF increases the uptake of these two tracers within intracellular vesicles.
These results suggest that VEGF may be acting on tight junctions, decreasing intercellular barrier function. This result is correlated to an increased passage of LDL through confluent monolayers. Howev er, we hav e also observed increased intracellular uptake of HRP (small molecule tracer) and transferrin (uptaken by transferrin receptor). In line with the increased acLDL permeability observed in VEGF-A165-treated monolayers, we believe that both intercellular and intracellular routes of permeability are important, although contributing to di fferent extents. In continuation of this research, we are continuing our in vitro studies by performing further experiments to elucidate the signaling mechanisms that regulate VEGF-induced intracellular and intercellular permeability pathways.
References (Arial 40 pt)1. Kannel et al. JAMA. 1979; 241: 2035- 2038.2. Pyor ala et al. Di abetes M etabolism Revi ew. 1987; 3: 463-524.3. Adams et al. Transplantation, 1992. 53: 1115-9.4. McManus et al. Am J Pathol, 1995. 147: 293- 308.5. Senger et al. Science. 1983; 219: 983-5.6. Senger et al. C ancer Res. 1986; 46: 5629-32.7. Leung et al. Science. 1989; 246: 1306-9.8. Keck et al. Sci ence. 1989; 246: 1309- 12.9. Senger et al. C ancer Res. 1990; 50: 1774-8.10. He et al. J Biol C hem. 1999; 274: 25130- 5.11. Lal et al. Microvasc R es. 2001; 62: 252-262.12. Wang et al. Am J Physi ol Heart Circ Physiol. 2001; 280: H434- 40.13. Chen et al. Am J Physiol C ell Physiol. 2002; 282: C 1053- 63.14. Pedram et al. J Bi ol Chem. 2002; 277: 44385-98.
Figure 4. Uptake of HRP after VEGF stimulationUsing transmission electron microscopy (TEM), we demonstrated that upon stimulation with VEGF-A165, there was uptake of horseradish peroxidase (HRP) tracer within intracellular v esicles, at the one hour time point [b]. Untreated cells showed little to no presence of HRP within the cells [a].
Overarching Hypothesis
Figure 5. VEGF increases transferrin uptake in HCMECHCMEC were incubated wit h A lex aFluor® 594-conjugated t ransf err in (pseudocolored green) and stained with Texas Red® DHPE (red) and Hoechst 33342 (blue) to v isualize lipid membranes and nuclei, respectively. Cells were left untreated [a] or incubated with VEGF-A165 [b] and the uptake of transferrin was captured ov er time. Thirty minutes post-stimulation with VEGFA165, we o b s e r v e d i n c r e a s e d t r a n s f e r r i n u p t a k e i n H C M E C .
Results (Arial 40pt)
Figure 1. Differential interference contrast microscopy images of HCMEC upon VEGF stimulation To v isualize intercellular gap formation and cell retraction upon VEGF stimulation in real time, we used differential interf erence contrast microscopy (DIC). As denoted by the arrows in subsequent panels, the f ormation of an intercellular gap between f our adjacent endothelial cells can be seen through the time course of stimulation.
Figure 3. VEGF significantly increases LDL permeability through HCMEC monolayersAll treatments signif icantly increase LDL permeability through HCMEC monolay ers as early as 5 minutes post-treatment. VEGF-A121 showed modest (10-20%) increases in LDL passage whereas VEGF-A165 and VEGF-D showed greater increases, which peaked around 1-2 hours at 40% (as compared with control). These increases in LDL permeability were sustained f or up to 6 hours. Interestingly , only VEGF-A165 and VEGF-D signif icantly increased acLDL permeability (~40% and 20%, respectiv ely ). VEGF-A121 did not induce signif icant changes in acLDL permeability, in contrast to LDL. * p<0.05
Time (mi nutes)
Rel
ativ
e Fl
uor
esce
nce
(% o
f co
ntro
l)
80.00%90.00%
100.00%110.00%120.00%130.00%140.00%150.00%160.00%170.00%
30 60 120 180 240
VEGF-A121 (L DL)VEGF-A165 (L DL)VEGF-D (LDL)
Time (mi nutes)
Rel
ativ
e Fl
uor
esce
nce
(% o
f co
ntro
l)
80.00%90.00%
100.00%110.00%120.00%130.00%140.00%150.00%160.00%170.00%
30 60 120 180 240
VEGF-A121 ( acL DL)VEGF-A165 ( acL DL)VEGF-D (acLDL)
Figure 2. Tight junction localization along endothelial membranesConf ocal microscopy f or CD31 [b , green] and ZO-1 [c , red], visualized using AlexaFluor® 488 and 594 tagged secondary antibodies, respectiv ely, v erifiedthe membrane localization of ZO-1 with CD31. Hoechst 33342 was used to v isualize the nucleus [a, blue]. Panel d represents an overlaid image of panels a-c. Using an orthogonal v iew of the conf ocal stack of the z-planes through the cell, we v isualized the aty pical localization of occludin (red) and F-actin (green) [e]. Western blot analysis was perf ormed to assess the lev els of ZO-1 and occludin protein in VEGF-treated HCMEC [f]. Upon treatment with VEGF-A121, VEGF-A165, and VEGF-D, there was an increase in both ZO-1 and occludin protein lev els. β -actin was used as protein loading control.
VEGF A121
VEGF A165
61 kD a
225 kDaContro
l
VEGF D
42 kD a
occludin
β-actin
42 kD a
ZO-1
β-actin
d
e
f
g
0’
20’
5’
30’
10’
45’
15’
60’
a
b
a b
a b
VEGF induces endothelia l cell hyperpermeability to lipids and
lipoproteins in atheromatous diseases0
0.20.40.60.8
11.2
Control VEGF-A121
VEGF-A165
VEGF-D
occludin/B-actinZO-1/B-actin
A121 A165
Rel
ativ
e de
nsit
om
etry
uni
ts
** * *
**
** * *
*
** *
*
a b
*
* * * **
* * * *
Align text boxes to the topAlign text boxes to the top
The information here is only a guideline. You may change it in any way you see fit.
Poster Templates and instructions can be found in:http://home.mrl.ubc.ca/services/imaging/howto.htm
Tips:
• Read poster instructions
• Keep all your fonts the same• Align your text, “Justify”
• Do not use power point to make graphs or tables
• Make graphs in Excel
• Make tables in Word
Text Arial 24pt Justify
Text Arial 17pt Justify
Photo Tips:
• 300 dpi Tiff images work the best and must be RGB images.
• Images should be exactly the same size!
• Crop images using Photoshop• Make your image plates in Illustrator or Photoshop
More Poster Tips:• Use colours that match your images• Make your poster using PC and not Mac, using a Mac may incur extra fees
• Power point and Illustrator are the best programs for making posters.
• Generally a slight colour in the background like light blue, beige or yellow works well and is easier on the eyes than white.
Tips:• Titles are all the same size, same font, same colour,
and centred.
• Text boxes are identical w idths, are the same colour, are the same font size, are the same style, and are justified. The choice of font should have a clean scientific look such as Arial
• Bullets should be properly indented and all be the same colour
• All legends for graphs should be the same size• Graphs should all be created from one beautiful
graph to ensure that the size, fonts and colours are the same
Need some help:• Call or e-mail, Dean English or Jenn Myers at local 62094 (room 242 Burrard building)
Text Arial 20pt JustifyText Arial 20pt Justify
Text Arial 20pt Justify
Text Arial 20pt Justify
Text Arial 20pt Justify
Text Arial 18pt Justify
Align text boxes
This poster is 36” X 48”