LAR MDA Q1 2015 draft - OTC Markets Group
13
Select Sands Corp. Form 51-102F1 Management’s Discussion and Analysis For the year ended December 31, 2016 Page 1 of 13 CORPORATION Management’s Discussion and Analysis For the Year Ended December 31, 2016 This Management Discussion and Analysis (“MD&A”) should be read in conjunction with the audited consolidated financial statements of Select Sands Corp. (“Select Sands” or the “Company”) for the year ended December 31, 2016, which have been prepared in accordance with International Financial Reporting Standards (“IFRS”). This MD&A has been prepared as of April 27, 2017. All amounts are expressed in Canadian dollars unless otherwise stated. Nature of Operations The Company’s primary business is an advanced stage silica sand project located in Arkansas, USA. The company is focused on developing this project to enable commercial silica sand sales to industrial and energy customers. Select Sands is a Canadian listed public company with its shares traded on the TSX Venture Exchange (“TSX-V”) under the symbol “SNS” as a Tier 2 company. The address of the Company’s corporate office and principal place of business is Suite 310, 850 West Hastings Street, Vancouver, British Columbia, Canada, V6C 1E1. On June 18, 2015, the Company elected to change its year-end to December 31, 2015 to align its reporting periods with the industry standard calendar year-end. Select Sands' goal is to be a premium Industrial/Silica Sand supplier selling into the Industrial and Specialty and Oil & Gas markets. Arkansas, USA Silica Sand Project In October 2014, Select Sands entered into a binding letter of agreement for an option to acquire a 100% undivided right, title and interest in an approximately 520-acre prospective silica sand property called Sandtown located in northeast Arkansas, USA (“Sandtown” or the “Project” or the “Property”). The Project is an advanced stage commercial silica sand exploration prospect underlain by the Ordovician St. Peter sandstone formation. Sandtown is located 3.1 miles from Highway 167, near a natural gas pipeline, has an active power line on the property, and is about 14.7 miles away from the nearest rail system. Sandtown has a competitive location advantage of being closer to the Texas/Louisiana oil/gas plays and Houston port and industrial hub over Wisconsin sand mines. The St. Peter formation is host to a number of producing silica sand mines/quarries, namely, Guion (Unimin), Crystal City, Pacific (US Silica), Agusta (Hi Crush), Festus, Pevely, Alton, Ottawa (US Silica), Kasota and Ottawa Township, all of which supply “Tier 1” quality commercial silica sand (also known as “Northern White” or “Ottawa White Sand”) to oil and gas operations in the US. Tier 1 commercial silica sand specifications are set out in ISO 13503- 2:2006/API RP 19C Recommended Practice for Measurement of Properties of Proppants Used in Hydraulic Fracturing and Gravel- packing Operations. These properties include sand sphericity and roundness, crush (K Value), acid solubility, turbidity and SiO2% content.
Transcript of LAR MDA Q1 2015 draft - OTC Markets Group

Select Sands Corp. Form 51-102F1
Management’s Discussion and Analysis For the year ended December 31, 2016
Page 1 of 13
CORPORATION
Management’s Discussion and Analysis
For the Year Ended December 31, 2016
This Management Discussion and Analysis (“MD&A”) should be read in conjunction with the audited consolidated
financial statements of Select Sands Corp. (“Select Sands” or the “Company”) for the year ended December 31,
2016, which have been prepared in accordance with International Financial Reporting Standards (“IFRS”).
This MD&A has been prepared as of April 27, 2017. All amounts are expressed in Canadian dollars unless
otherwise stated.
Nature of Operations
The Company’s primary business is an advanced stage silica sand project located in Arkansas, USA. The company
is focused on developing this project to enable commercial silica sand sales to industrial and energy customers.
Select Sands is a Canadian listed public company with its shares traded on the TSX Venture Exchange (“TSX-V”)
under the symbol “SNS” as a Tier 2 company. The address of the Company’s corporate office and principal place
of business is Suite 310, 850 West Hastings Street, Vancouver, British Columbia, Canada, V6C 1E1. On June 18,
2015, the Company elected to change its year-end to December 31, 2015 to align its reporting periods with the
industry standard calendar year-end.
Select Sands' goal is to be a premium Industrial/Silica Sand supplier selling into the Industrial and Specialty and
Oil & Gas markets.
Arkansas, USA Silica Sand Project
In October 2014, Select Sands entered into a binding letter of agreement for an option to acquire a 100% undivided
right, title and interest in an approximately 520-acre prospective silica sand property called Sandtown located in northeast
Arkansas, USA (“Sandtown” or the “Project” or the “Property”). The Project is an advanced stage commercial silica
sand exploration prospect underlain by the Ordovician St. Peter sandstone formation. Sandtown is located 3.1 miles
from Highway 167, near a natural gas pipeline, has an active power line on the property, and is about 14.7 miles
away from the nearest rail system. Sandtown has a competitive location advantage of being closer to the
Texas/Louisiana oil/gas plays and Houston port and industrial hub over Wisconsin sand mines.
The St. Peter formation is host to a number of producing silica sand mines/quarries, namely, Guion (Unimin), Crystal
City, Pacific (US Silica), Agusta (Hi Crush), Festus, Pevely, Alton, Ottawa (US Silica), Kasota and Ottawa Township,
all of which supply “Tier 1” quality commercial silica sand (also known as “Northern White” or “Ottawa White Sand”)
to oil and gas operations in the US. Tier 1 commercial silica sand specifications are set out in ISO 13503- 2:2006/API
RP 19C Recommended Practice for Measurement of Properties of Proppants Used in Hydraulic Fracturing and Gravel-
packing Operations. These properties include sand sphericity and roundness, crush (K Value), acid solubility, turbidity
and SiO2% content.
Select Sands Corp. Form 51-102F1
Management’s Discussion and Analysis For the year ended December 31, 2016
Page 2 of 13
For the year ended December 31, 2016, the Company spent $1,784,494 (five months ended December 31, 2015 -
$156,273; year ended July 31, 2015 - $463,179) on the Sandtown property and recovered $260,959 in test sales (five
months ended December 31, 2015 - $Nil; year ended July 31, 2015 - $Nil).
Sandtown Option Exercised
On November 24, 2016, the Company exercised the option to acquire a 100% undivided right, title and interest in
Sandtown. At the time of the option exercise, US$32,000 of extension payments have been paid with US$16,000
being credited against the US$736,000 purchase price and the remaining balance owing was paid in full on closing
bringing the aggregate amount paid to the vendors (inclusive of extension payments) to US$952,000.
An aggregate finder’s fee of US$65,520 (equal to 7% of the original transaction value of US$936,000) was paid in
respect of this transaction to two separate finders. One-half of this finder’s fee was satisfied through the issuance of
46,191 common shares in the capital of the Company. The number of common shares was based on the 20-day
volume weighted average price of the Company's common shares on the TSX Venture Exchange (for the 20 days
preceding the closing date) with Canadian dollars converted to U.S. dollars at the noon rate of Exchange for
CDN/U.S. dollars on the closing date as posted on the Bank of Canada's website.
Plant and Equipment Acquisitions
On August 23, 2016, the Company purchased a permitted and producing silica sand wet processing plant, equipment
and related assets (the “Assets”), all nearby its Sandtown silica sands deposit in Arkansas, USA from Tutle Holding,
LLC (“Tutle”).
In consideration of the sale and transfer of the Assets, Select Sands paid Tutle $612,845 (US$475,000) in cash and
issued Tutle 258,290 common shares in the capital of Select Sands for $96,765 (US$75,000) for a total purchase
price of $709,610 (US$550,000). The number of common shares was calculated by dividing US $75,000 by the 20-
day volume weighted average price of Select Sands’ common shares on the TSX Venture Exchange with Canadian
dollars converted to U.S. dollars at the noon rate of Exchange for Canadian to U.S. dollars on September 1, 2016 as
posted on the Bank of Canada’s website. The shares issued in connection with the transaction were subject to a hold
period of four months and one day which expired on January 2, 2017. The company also incurred $11,612 in costs
associated with this acquisition bringing the total cost to $721,222.
On December 15, 2016, the Company, through its wholly-owned subsidiary, Select Sands America Corp. (formerly
American Select Corp.), completed a transaction with Tutle Holding, LLC, Steve Hackmann and Ozark Premium
Sand, LLC (“OPS’) in which Select Sands purchased OPS’s wet/dry processing plants, operating equipment, saleable
inventory, real estate, and customer lists amongst other miscellaneous assets owned by OPS, located in Northeast
Arkansas, USA.
Pursuant to the terms of the agreement, Select Sands American Corp. paid a total of USD$3,317,000, after deducting
a previously paid USD$250,000 option payment. USD$400,000 of this purchase price was satisfied through the
issuance of (i) 547,381 common shares of the Company at a deemed issue price of $0.97 and (ii) 270,270 common
share purchase warrants with each warrant being exercisable into one common share of the Company at a price of
$0.97 for a period of two years from the date of issue. The remainder of the purchase price was satisfied with a cash
payment.
In connection with the completion of the transaction, a finder’s fee of USD$93,965 was paid to DownHoleTrader,
Inc. of which USD$46,983 was satisfied through the issuance of 62,365 common shares in the capital of the
Company.
Select Sands Corp. Form 51-102F1
Management’s Discussion and Analysis For the year ended December 31, 2016
Page 3 of 13
Updated Mineral Resource Estimate
On February 10, 2016, the Company announced the completion of an updated mineral resource estimate for
Sandtown. Tetra Tech of Vancouver, Canada completed the update. The indicated silica sand resource of 22.0
Million Tons (20 Million Tonnes) reported in the Company’s Preliminary Economic Assessment has nearly
doubled to 41.98 Million Tons (38.08 Million Tonnes). The breakdown by pit is given in the table below:
Mineral Resources Volume
Metric
Specific
Gravity
Thousand
Tonnes
Imperial
Specific
Gravity
Thousand
Short tons Classification
(m3) (mt/m3) (kt) (st/yd3) (kst)
South Pit 12,749,000 2.2 28,048 3.2 30,917 Indicated
North Pit 4,560,000 2.2 10,032 3.2 11,058 Indicated
Total Pit
constrained
resources
17,309,000 2.2 38,080 3.2 41,976 Indicated
Resources were estimated by modelling the extent of the targeted St. Peter Sandstone on the Sandtown property using
a total of 41 vertical drill holes completed by Select Sands during 2014 and 2015. The model was constructed utilizing
Aranz Geo’s Leapfrog 3D modelling software and involved the construction of mesh solids for each of the
predominant lithological units identified from drilling. The results of the modelling indicate that the St. Peter
Formation underlies much of the northern and central parts of the property, with the thickest portions occurring along
the northern boundary and gradually thinning to a discontinuous veneer in the south. Previous testing on composite
samples from the St. Peter Formation collected by Select Sands during drilling indicate a grain size distribution of
approximately 13% 30/50 mesh, 22% 40/70 mesh, and 58% of 100 mesh. Please visit the Company’s website at
http://www.selectsandscorp.com/projects/silica-sand-project/ for the maps and other details about the Project.
Exclusions for a power line right of way and allowances for property boundaries and pit slopes have been factored
into the estimates presented above. The total Indicated Mineral Resource of 42 Million short tons comprises the
portion of the St. Peter Formation that was determined to have reasonable prospects for economic extraction
constrained by the open pits.
The Preliminary Economic Assessment (“PEA”) completed by Select Sands in June 2015 was done on a portion of
the St. Peter Sandstone that remains within the updated resource area. Economic considerations have not been applied
to newly defined resources and, as such, the existing PEA remains current and will be summarized in the supporting
NI 43-101 technical report for the resource update. Readers are cautioned that mineral resources for the Sandtown
Property are not mineral reserves and do not have demonstrated economic viability and there is no certainty that this
preliminary economic assessment will be realized.
Test Mining and Production
In April, 2016, the Company commenced limited production at the Sandtown deposit, located in Arkansas, US, in
order to fulfill purchase orders for its Tier 1 silica sands into the industrial markets.
The Company anticipates purchase orders from the current customer base will be ongoing and is in a position to
ramp up production if there is an increase in demand. Additionally, Select Sands will aggressively pursue new
customers in the industrial markets, some of which have already requested large bulk samples or tested the variety
of products available from the Sandtown Deposit.
Select Sands Corp. Form 51-102F1
Management’s Discussion and Analysis For the year ended December 31, 2016
Page 4 of 13
Drilling
In October 2015, the Company completed a drilling program covering approximately 95% of the Sandtown silica
sands project. The drilling demonstrated uniformity and quality equivalence to the sandstone that was incorporated
in the Company’s inaugural PEA.
Drilling Highlights from 2015:
• Largest intersection returned 131 feet of silica sand.
• Average thickness of the sandstone in the drilling was 56.5 feet.
• Sandstone intersected in 15 holes show consistent quality.
A total of 15 of the 20 holes drilled intersected the targeted silica sand zone, while 4 holes to the southwest intersected
a gravel/clay zone which will be used to build haul roads on the property.
Quarry Permit
On May 1, 2015, the Arkansas Department of Environmental Quality (ADEQ) issued the Company an
unconditional Authorization to Quarry for Sandtown. The Authorization to Quarry was issued pursuant to the
Arkansas Quarry Operation, Reclamation and Safe Closure Act for a five year period ending April 30, 2020
subject to further renewals.
Bell Farm Acquisition
On January 25, 2017, the Company, through its wholly-owned subsidiary Select Sands America Corp., completed
the purchase of an additional 457 acres of property approximately three miles from its 520 acre Sandtown location
referred to as the Bell Farm. The Bell Farm property has paved road access and available three-phase power. The
total purchase price was approximately USD$950,560 which included agent’s fees of USD$36,560.
On April 4, 2017, the Company completed a National Instrument 43-101 (“NI 43-101”) mineral resource estimate
its Bell Farm property. The estimate and report was prepared by Elliott A Mallard, P.G. of Kleinfelder, Jacksonville,
FL, USA. The Inferred Mineral Resource for Bell Farm totalled 49,622,003 tons of silica sand. A copy of the report
was filed under the Company’s profile on www.sedar.com on April 21, 2017. Readers are cautioned that mineral
resources for the Bell Farm Property are not mineral reserves and do not have demonstrated economic viability.
The deposit consists of the middle Ordovician-aged St Peter Sandstone, generally a massive bedded, medium- to
fine-grained, well-rounded, friable, white sandstone. Forty (40) NQ diameter core holes have been drilled on the
property in three (3) separate drilling programs (October 2011, November 2012 and March/April 2014). Sieve
analyses indicate a grain size distribution of 23.5% of 30/50 mesh, 48% of 40/70 mesh and 42.1% of 100 mesh
(70/140 mesh). Average thickness of the sandstone on the property is 48.9 feet (ranging from 1 foot to a maximum
thickness of 108 feet on the property). Samples submitted to Stim-Lab (a Core Laboratories Company) for quality
analysis returned results that met or exceeded ISO 13503-2:2006/API RP19C:2008 standards.
Oil & Gas Sector Sand Sales
On January 12, 2017, the Company announced it had received its first Oil & Gas sector purchase order for 7,000
tons.

Select Sands Corp. Form 51-102F1
Management’s Discussion and Analysis For the year ended December 31, 2016
Page 5 of 13
On March 17, 2017, the Company announced that Select Sands America Corp. has entered into a multiyear frac sand
supply agreement with Liberty Oilfield Services, LLC of Denver Colorado. Initial rail shipments were completed in
February, 2017 and are anticipated to continue throughout 2017 with volumes expected to increase in 2018 and 2019
to surpass one million tons per year. The 40/70 and 100 mesh products to be supplied under the agreement will be
sourced from the Company’s facilities in Arkansas.
Amisk Lake, Saskatchewan
Select Sands has staked two blocks of claims in north central Saskatchewan, both of which have the potential to host
silican sand resources. The Amisk Lake block, is located about 30 km southwest of Creighton and the Deschambeault
Lake block is located along the southeast shore of Deschambeault. During the year ended July 31, 2015, the Company
decided it was no longer going to focus on exploring the Amisk Lake and wrote off $91,512 of acquisition and
exploration costs impairing the property’s carrying value to $1. The Company has since dropped the claims.
La Ronge Gold Belt and Old Cabin Prospect, Ontario
On September 14, 2016, the Company sold the La Range Gold Belt (Preview SW) and early stage Jacobson, Old
Cabin projects to Comstock Metals Ltd (TSX-V: CSL) (“Comstock”) in exchange for 20,000,000 common shares
of Comstock valued at $5,200,0000. Due to current market conditions, the Company determined that the value of
investment in affiliate was impaired and estimated the recoverable amount at $3,000,000. Accordingly, the
Company recorded a provision for impairment.
Changes to the Board of Directors and Management
On December 23, 2016, the Company announced that Zigurds “Zig” Vitols, the Company’s Chief Operating Officer,
had been appointed President and CEO of the Company. Mr. Vitols replaced Rasool Mohammad, who took on a new
role as Chief Operating Officer of Select Sands and President of Select Sands America Corp. Mr. Mohammad will
be moving to Houston, Texas during 2017 and Mr. Vitols will continue to be based in Houston.
On November 22, 2016, David Giannini joined the Company’s Board as an independent director. Mr. Giannini is an
investment banker registered with Scarsdale Equities LLC working from both Houston, Texas and Ottawa,
Ontario. David has over 30 years experience in the investment business.
Prior to joining Scarsdale Equities in 2006, he spent nearly ten years with Sanders Morris Harris in institutional sales,
after stints with Jefferies & Company, Inc., Simmons & Company International also in Houston, and seven years
with Kidder Peabody & Co. Incorporated in New York. In recent years, he has specialized in oil & gas, metal mining,
and related industries. Mr. Giannini graduated with a B.A. and LL.B. from the University of Western Ontario, and
an LL.M. from the London School of Economics.
Mr. Giannini was granted 300,000 options. Each option is exercisable into one common share at an exercise price of
$0.90 at any time on or before the fifth anniversary of its issuance. One half of such options will vested on issuance
date with the remainder vesting on the six month anniversary of the issuance date.
On December 21, 2016, the Company accepted the resignations of Mr. Arnold Tenney as Chairman and Director and
Mr. Steven Goldman as General Counsel and Director.

Select Sands Corp. Form 51-102F1
Management’s Discussion and Analysis For the year ended December 31, 2016
Page 6 of 13
Select Annual Results
IFRS
December 31, 2016 December 31, 2015 July 31, 2015
Total Revenues $ - $ - $ -
Other expense (income) 1,193,198 (35,160) 451,934
Net loss 3,278,602 610,360 1,104,366
Net loss per share $ 0.05 $ 0.01 $ 0.03
Total assets 24,016,988 8,393,214 6,251,346
Long-term debt - - -
Dividends - - -
Results of Operations
For the year ended December 31, 2016, the Company incurred a net loss of $3,278,602 (five months ended
December 31, 2015 - $610,360, year ended July 31, 2015 - $1,104,366). The Company’s focus during the year
ended December 31, 2016 remained on developing the Sandtown, Arkansas, USA property towards commercial
production through the acquisition of capital assets and test sands sales. Differences of note between the two
periods are:
• Advertising and promotion increased to $338,139 (five months ended December 31, 2015 - $81,699; year
ended July 31, 2015 - $180,163) due to the Company’s increased activity regarding its Sandtown property.
• Compensation and consulting increased to $720,248 (five months ended December 31, 2015 - $205,600;
year ended July 31, 2015 - $145,450) due to the Company employing more consultants for the
development of the Sandtown property.
• Professional fees increased to $316,786 (five months ended December 31, 2015 - $148,399; year ended
July 31, 2015 - $116,866). The Company incurred additional professional fees in connection with the
development of the Sandtown project and incorporation and operation of its American subsidiary.
• Share-based compensation increased to $497,412 (five months ended December 31, 2015 - $160,711; year
ended July 31, 2015 - $167,874). Options were granted to management, directors and consultants in all
periods. The options granted have vesting terms and share based compensation is recognized each quarter in
proportion to the number of stock options that vest.
• Foreign exchange gain increased to $270,751 (five months ended December 31, 2015 - $33,007; year ended
July 31, 2015 - $(1,709)) due to the Company having more transactions and balances denominated in U.S.
dollars.
• The Company recorded a one-time gain on sale of mineral properties of $738,605 (five months ended
December 31, 2015 - $Nil; year ended July 31, 2015 - $Nil). The gain resulted from the sale of the La Ronge
Gold Belt (Preview SW) and Jacobson, Old Cabin properties in exchange for 20,000,000 shares in
Comstock Metals Ltd. The amount of gain is the result of the difference between the book value of the two
properties and the market value of the Comstock shares on the day of receipt. The Company also recorded
a one-time provision for impairment of its investment in the Comstock shares of $2,076,866 605 (five
months ended December 31, 2015 - $Nil; year ended July 31, 2015 - $Nil) due to current market conditions.
As of December 31, 2016, exploration and evaluation assets totaled $2,142,986 compared to $5,066,468 at
December 31, 2015. The decrease is due to the sale of its La Ronge Gold Belt and Jacobson, Old Cabin
properties on September 14, 2016.

Select Sands Corp. Form 51-102F1
Management’s Discussion and Analysis For the year ended December 31, 2016
Page 7 of 13
Fourth Quarter
For the three months ended December 31, 2016, the Company continued its focus on moving the Sandtown property
toward commercial production. Limited test production has already commenced and was announced April 19, 2016.
For the year ended December 31, 2016, the Company has now realized a total of $260,959 in test sand sales to
industrial clients seeking high quality materials with $141,420 of the total coming during the fourth quarter.
Highlights of the fourth quarter include:
• The closing of a private placement financing on November 4, 2016 issuing 21,376,341 shares and raising
$16,459,782.
• The exercising of Company’s option to purchase the Sandtown property with a final payment of US$736,000.
• The purchase of over US$3 million in property, plant and equipment in Arkansas for processing silica sand
from the Sandtown property.
Summary of Quarterly Results
The following table sets forth selected quarterly financial information for the nine months ended September 30, 2016,
the two month stub period ended December 31, 2015 and each of the prior five quarters.
Quarter Ending Interest Income
(Expenses)
Net Income
(Loss)
Net (Loss)
Income per Share
December 31, 2016 $840 $(2,600,549) * $(0.03)
September 30, 2016 $2,933 $71,558 ** $0.00
June 30, 2016 $3,382 $(416,494) $(0.01)
March 31, 2016 $3,804 $(333,117) $(0.01)
December 31, 2015 (2 months) $1,624 $(345,688) $(0.01)
October 31, 2015 $529 $(264,672) $(0.01)
July 31, 2015 $3,312 $(280,928) $(0.01)
April 30, 2015 $4,942 $(31,484) $(0.00)
January 31, 2015 $140 $(678,296) $(0.02)
October 31, 2014 $(3,185) $(113,658) $(0.00)
* Net Loss of $2,600,549 due to a one time provision for impairment of $2,076,866 for the Company’s investment
in affiliate.
** Net income of $71,558 due to the Company recognizing a one-time $538,605 gain on the sale of its La Ronge
Gold Belt (Preview SW) and Jacobson, Old Cabin mineral properties.
Liquidity
As of December 31, 2016, the Company had working capital of $11,540,578 including cash on hand of $11,776,321.
Capital Resources
On November 4, 2016, the Company closed a non-brokered private placement financing issuing a total of 21,376,341
common shares at a price of $0.77 per share for aggregate gross proceeds of $16,459,782 (the “Offering”). The net
proceeds of the Offering will be used to fund capital expenditures and for general corporate purposes.

Select Sands Corp. Form 51-102F1
Management’s Discussion and Analysis For the year ended December 31, 2016
Page 8 of 13
Cash finders’ fees in the aggregate amount of $930,299 were paid to certain finders. In addition, 1,087,051 finder
warrants were issued to certain finders. Each finder’s warrant entitles the holder to purchase one common share of
the Company for a period of two years from the date of issuance of the warrants at an exercise price of $0.77 per
share.
The securities issued in connection with the Offering and the common shares issuable on exercise of the finder
warrants were issued pursuant to applicable exemptions from the prospectus requirements under applicable securities
laws. Such securities are subject to a four month hold period which will expire on March 5, 2017.
Subsequent Events
a) On January 9, 2017, the Company granted 2,475,000 options to certain officers, directors and employees of the
Company. These options are exercisable for a period of five years at a price of $1.33 per share. 1,525,000 options
vest immediately and 950,000 options vest on July 6, 2017. In addition, 300,000 options granted to a director in 2016
was amended to vest immediately.
b) On January 25, 2017, the Company completed the purchase of an additional 457 acres of property, Bell Farm,
approximately three miles from its 520 acre Sandtown location. The total purchase price was approximately
US$950,560.
c) The Company received $1,041,480 from the exercise of 1,817,124 stock purchase warrants.
d) The Company received $389,350 from the exercise of 908,500 stock options.
e) On April 1, 2017, the Company entered into an agreement to acquire a rail loading facility for US$2,050,000 paid
over 5 years. The first year payment of US$500,000 has been made. The balance will be paid in equal amounts of
US$387,500 per year until March 2021.
f) On March 7, 2017, the Company entered into a two year frac sand supply agreement that automatically renews
after the two years unless it is terminated. The buyer agrees to purchase a minimum of 450,000 tons of product in the
first year and will increase to 1,000,000 tons annually if production capacity increases.
Off-Balance Sheet Arrangements
The Company has not entered into any off-balance sheet arrangements.
Related Parties Transactions
As of the date of this report, the Company’s officers and directors are as follows:
Name Position
Zigurds Vitols President, Chief Executive Officer and Director
Rasool Mohammad Chief Operations Officer and Director
Douglas Turnbull Director
John Kime Director and Audit Committee Chairman
David Giannini Director
Darren Urquhart Chief Financial Officer
Select Sands Corp. Form 51-102F1
Management’s Discussion and Analysis For the year ended December 31, 2016
Page 9 of 13
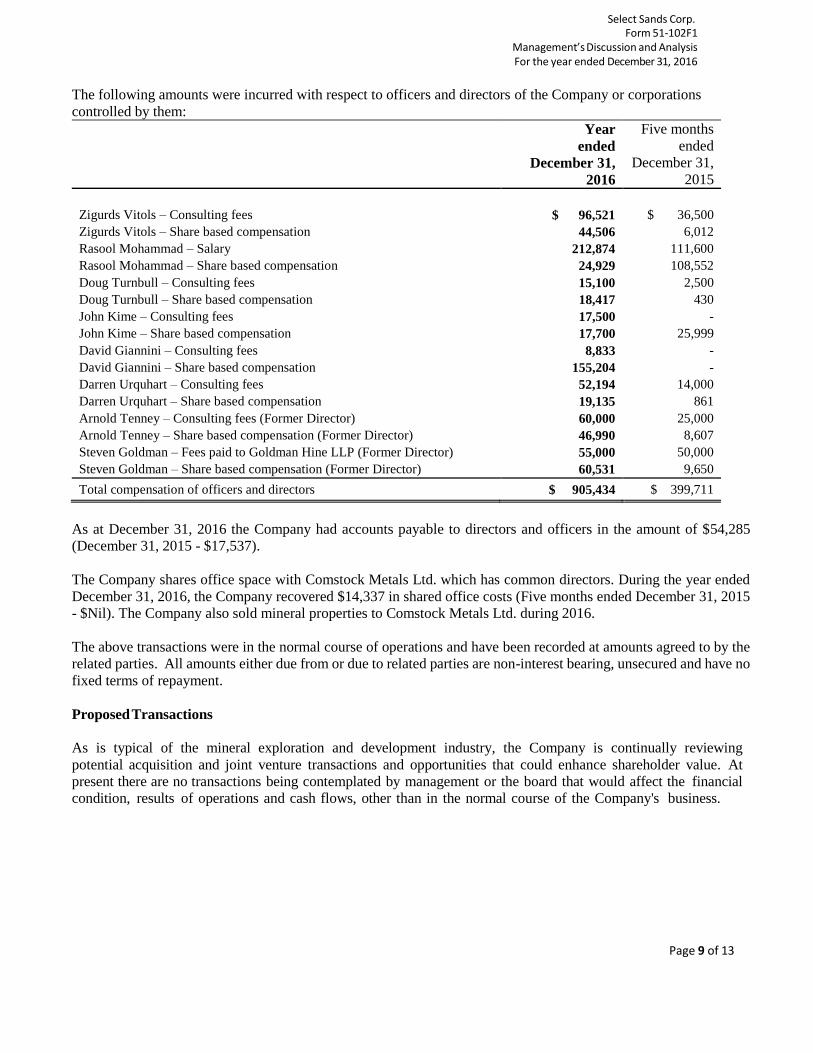
The following amounts were incurred with respect to officers and directors of the Company or corporations
controlled by them:
Year
ended
December 31,
2016
Five months
ended
December 31,
2015
Zigurds Vitols – Consulting fees $ 96,521 $ 36,500
Zigurds Vitols – Share based compensation 44,506 6,012
Rasool Mohammad – Salary 212,874 111,600
Rasool Mohammad – Share based compensation 24,929 108,552
Doug Turnbull – Consulting fees 15,100 2,500
Doug Turnbull – Share based compensation 18,417 430
John Kime – Consulting fees 17,500 -
John Kime – Share based compensation 17,700 25,999
David Giannini – Consulting fees 8,833 -
David Giannini – Share based compensation 155,204 -
Darren Urquhart – Consulting fees 52,194 14,000
Darren Urquhart – Share based compensation 19,135 861
Arnold Tenney – Consulting fees (Former Director) 60,000 25,000
Arnold Tenney – Share based compensation (Former Director) 46,990 8,607
Steven Goldman – Fees paid to Goldman Hine LLP (Former Director) 55,000 50,000
Steven Goldman – Share based compensation (Former Director) 60,531 9,650
Total compensation of officers and directors $ 905,434 $ 399,711
As at December 31, 2016 the Company had accounts payable to directors and officers in the amount of $54,285
(December 31, 2015 - $17,537).
The Company shares office space with Comstock Metals Ltd. which has common directors. During the year ended
December 31, 2016, the Company recovered $14,337 in shared office costs (Five months ended December 31, 2015
- $Nil). The Company also sold mineral properties to Comstock Metals Ltd. during 2016.
The above transactions were in the normal course of operations and have been recorded at amounts agreed to by the
related parties. All amounts either due from or due to related parties are non-interest bearing, unsecured and have no
fixed terms of repayment.
Proposed Transactions
As is typical of the mineral exploration and development industry, the Company is continually reviewing
potential acquisition and joint venture transactions and opportunities that could enhance shareholder value. At
present there are no transactions being contemplated by management or the board that would affect the financial
condition, results of operations and cash flows, other than in the normal course of the Company's business.

Select Sands Corp. Form 51-102F1
Management’s Discussion and Analysis For the year ended December 31, 2016
Page 10 of 13
Critical Accounting Estimates
Mineral properties consist of exploration and mining concessions, options and contracts. Exploration and
evaluation assets costs are capitalized and deferred until such time as the property is put into production, or
the property is disposed of either through sale or abandonment. If the property enters the production stage, the
costs of exploration and evaluation assets will be written off over the life of the property based on estimated
economic reserves. Proceeds received from the sale of any interest in a property will be credited against the
carrying value of the property, with any excess included in operations for the year. If a property is abandoned,
the acquisition and deferred exploration costs will be written off to operations.
Although the Company has taken steps to verify title to mineral properties in which it has an interest, in accordance
with industry norms for the current stage of exploration of such properties, these procedures do not guarantee the
Company’s title. Property may be subject to unregistered prior agreements and non-compliance with regulatory
requirements. The Company is not aware of any disputed claims of title.
Recorded costs of mineral properties and deferred exploration expenditures are not intended to reflect present or
future values of mineral properties. The costs are subject to measurement uncertainty and it is reasonably
possible, based on existing knowledge, that change in future conditions could require a material change in the
recognized amount.
Management reviews capitalized costs on its mineral properties on a periodic basis and will recognize impairment
in value based upon current exploration results and upon management’s assessment of the future probability of
profitable revenues from the property or from sale of the property.
The Company measures the cost of the service received for all stock options made to consultants, employees and
directors based on an estimate of fair value at the date of grant. The Company uses the Black-Scholes option
pricing model to estimate the fair value of each stock option at the date of grant. Stock options which vest
immediately are recorded at the date of grant. Stock options that vest over time are recorded over the vesting
period using the straight line method. Stock options issued to outside consultants that vest over time are valued at
the grant date and subsequently re-valued on each vesting date and expensed as services are rendered. Stock based
compensation is recognized as expense or, if applicable, capitalized to mineral property costs with a corresponding
increase in contributed surplus. On exercise of the stock option, consideration received and the estimated fair
value previously recorded in contributed surplus is recorded as share capital.
Future Accounting Pronouncements Not Yet Adopted
The following standards and interpretations have been issued but are not yet effective and have not been early
adopted by the Company:
IFRS 9 Financial Instruments was issued in November 2009 and covers the classification and measurement of
financial assets as part of its project to replace IAS 39 Financial Instruments: Recognition and Measurement. In
October 2010, the requirements for classifying and measuring financial liabilities were added to IFRS 9. Under this
guidance, entities have the option to recognize financial liabilities at fair value through earnings. If this option is
elected, entitles would be required to reverse the portion of the fair value change due to own credit risk out of earnings
and recognize the change in other comprehensive income. IFRS 9 is applicable for periods beginning on or after
January 1, 2018. The Company has not yet assessed the impact of the standard or determined whether it will adopt
the standard early.

Select Sands Corp. Form 51-102F1
Management’s Discussion and Analysis For the year ended December 31, 2016
Page 11 of 13
IFRS 15 Revenue from Contracts with Customers establishes a five-step model that will apply to revenue earned
from a contract, regardless of the type of revenue transaction or the industry. The standard’s requirements will also
apply to the recognition and measurement of gains and losses on the sale of some non-financial assets that are not an
output of the entity’s ordinary activities. IFRS 15 is effective for annual periods beginning on or after January 1,
2018 with earlier adoption permitted.
IFRS 16 Leases replaces IAS 17 – Leases and requires lessees to account for leases on the balance sheet by
recognizing a right to use asset and lease liability. The standard is effective for annual reports beginning on or after
January 1, 2019, with earlier adoption permitted.
Financial Instruments and Other Instruments
The Company has not entered into any specialized financial agreements to minimize its investment risk, currency
risk or commodity risk. As of the date hereof, the Company’s investment in resource properties has full exposure
to commodity risk, both upside and downside.
Outstanding Share Data as of the Report Date
The authorized share capital consists of an unlimited number of common shares. As of the date of this report,
there are an aggregate of 87,003,316 common shares issued, 5,349,780 warrants and 4,989,833 stock options
outstanding.
Risks and Uncertainties
The Company is subject to a number of risks and uncertainties due to the nature of its business. The Company’s
exploration and development activities expose the Company to various financial and operational risks that could
have a significant impact on its level of operating cash flows in the future. Readers are advised to study and
consider risk factors stressed below. The following are identified as main risk factors that could cause actual results
to differ materially from those stated in any forward-looking statements made by, or on behalf of, the Company.
Financing
The Company’s future financial success depends on the ability to raise additional capital from the issue of
shares or the discovery of properties which could be economically justifiable to develop. Such development could
take years to complete and resulting income, if any, is difficult to determine. The sales value of any mineralization
potentially discovered by the Company is largely dependent upon factors beyond the Company’s control, such as
the market value of the products produced.
General Resource Exploration Risks and Competitive Conditions
The resource exploration industry is an inherently risky business with significant capital expenditures and volatile
metals markets. The marketability of any minerals discovered may be affected by numerous factors that are
beyond the Company’s control and which cannot be predicted, such as market fluctuations, mineral markets and
processing equipment, and changes to government regulations, including those relating to royalties, allowable
production, importing and exporting of minerals, and environmental protection. This industry is intensely competitive
and there is no guarantee that, even if commercial quantities are discovered, a profitable market will exist for their
sale. The Company competes with other junior exploration companies for the acquisition of mineral claims as well
for the engagement of qualified contractors. Metal prices have fluctuated widely in recent years, and they are
determined in international markets over which the Company has no influence.
Select Sands Corp. Form 51-102F1
Management’s Discussion and Analysis For the year ended December 31, 2016
Page 12 of 13
Governmental Regulation
Regulatory standards continue to change, making the review process longer, more complex and therefore more
expensive. Exploration and development on the Company’s properties are affected by government regulations
relating to such matters as environmental protection, health, safety and labour, mining law reform, restrictions
on production, price control, tax increases, maintenance of claims, and tenure. There is no assurance that future
changes in such regulations couldn’t result in additional expenses and capital expenditures, decreasing availability
of capital, increased competition, reserve uncertainty, title risks, and delays in operations. The Company relies on
the expertise and commitment of its management team, advisors, employees and contractors to ensure compliance
with current laws.
Financial Instruments and Risk Management
Financial assets and financial liabilities are measured on an ongoing basis at fair value or amortized cost. The
disclosures in the notes to these financial statements describe how the categories of financial instruments are
measured and how income and expenses, including fair value gains and losses, are recognized.
As of the date of this report and December 31, 2016, the Company’s financial instruments which are measured at
fair value on a recurring basis are cash and cash equivalents and available for sale investments. The available-
for-sale investments are based on quoted prices. The carrying values of the Company’s loans and receivables
and financial liabilities were a reasonable approximation of fair value due to the short term nature of their maturities.
The Company is exposed to potential loss from various risks including commodity price risk, interest rate risk,
currency risk, credit risk and liquidity risk. Based on the Company’s operations the liquidity risk and commodity
price risk are considered the most significant. There have been no substantive changes in the Company’s
exposure to financial instrument risks, its objectives, policies and processes for managing those risks or the
methods used to measure them from previous years unless otherwise stated in the note.
Commodity Price Risk
The Company’s ability to raise capital to fund exploration or development activities is subject to risk associated
with fluctuations in the market prices of base and precious metals including gold, silver, zinc, lead, diamonds and
silica sand and the outlook for these minerals. The Company does not have any hedging or other derivative
contracts respecting its operations.
Market prices for minerals historically have fluctuated widely and are affected by numerous factors outside of the
Company’s control, including, but not limited to, levels of worldwide production, short-term changes in supply
and demand, industrial and retail demand, central bank lending, and forward sales by producers and speculators.
The Company has elected not to actively manage its commodity price risk, as the nature of Company’s business is
in exploration.
Liquidity Risk
The liquidity risk is the risk that the Company will not be able to meet its financial obligations as they come
due. The Company manages its liquidity risk through careful management of its financial obligations in relation to
its cash position. Using budgeting processes, the Company manages its liquidity requirements based on
expected cash flow to ensure there are adequate funds to meet the short term obligations during the year.

Select Sands Corp. Form 51-102F1
Management’s Discussion and Analysis For the year ended December 31, 2016
Page 13 of 13
During the past period the Company has been able to maintain its liquidity position through private placements.
However, the variable market conditions make it uncertain whether the Company can continue to raise adequate
funds to meet its financial obligations.
Credit Risk
Credit risk is the risk of financial loss to the Company if a customer or a counterparty to a financial instrument
fails to meet its contractual obligations. Financial instruments which are potentially subject to credit risk for the
Company consist of cash and cash equivalents. Cash and cash equivalents are maintained with financial
institutions of reputable credit and may be redeemed on demand.
Approval
The Board of Directors of Select Sands Corp. has approved the contents of this Management Discussion and Analysis
as of the date of this report.
Additional Information
Additional information relating to the Company and its operations is available on SEDAR at www.sedar.com and
also on the Company’s website at www.selectsandscorp.com
Cautionary Note Regarding Forward Looking Statements
This MD&A includes some statements that may be considered “forward-looking statements”. All statements in
this discussion that address the Company’s expectations about future exploration and development are forward-
looking statements. Although the Company believes the expectations presented in such forward-looking statements
are based on reasonable assumptions, such statements are not guarantees of future performance and actual results
or developments may differ materially from those in the forward-looking statements. Factors that could cause
actual results to differ materially from those in forward-looking statements include market prices, exploration
successes, availability of capital and financing, and general economic, market, and business conditions. Readers
are cautioned that any such statements are not guarantees of future performance and actual results or developments
may differ materially from those projected in the forward-looking statements.


![· Web viewThere are other definitions of MDA; of particular note is that included in An MDA Manifesto [MDA Manifesto] as published by the MDA Journal: “In essence, the foundations](https://static.fdocuments.us/doc/165x107/5b2adca07f8b9afd328b48f5/-web-viewthere-are-other-definitions-of-mda-of-particular-note-is-that-included.jpg)