Q3 2016 MDA - Slate Office REITTitle Q3 2016 MDA Created Date 20161131655
Canadian Natural Resources LimitedMANAGEMENT’S DISCUSSION AND ANALYSIS
FOR THE THREE AND NINE MONTHS ENDED SEPTEMBER 30, 2018
Canadian Natural Resources Limited 1 Nine Months Ended September 30, 2018
MANAGEMENT’S DISCUSSION AND ANALYSIS
Forward-Looking StatementsCertain statements relating to Canadian Natural Resources Limited (the “Company”) in this document or documents incorporated herein by reference constitute forward-looking statements or information (collectively referred to herein as “forward-looking statements”) within the meaning of applicable securities legislation. Forward-looking statements can be identified by the words “believe”, “anticipate”, “expect”, “plan”, “estimate”, “target”, “continue”, “could”, “intend”, “may”, “potential”, “predict”, “should”, “will”, “objective”, “project”, “forecast”, “goal”, “guidance”, “outlook”, “effort”, “seeks”, “schedule”, “proposed” or expressions of a similar nature suggesting future outcome or statements regarding an outlook. Disclosure related to expected future commodity pricing, forecast or anticipated production volumes, royalties, production expenses, capital expenditures, income tax expenses and other guidance provided throughout this Management’s Discussion and Analysis (“MD&A”) of the financial condition and results of operations of the Company, constitute forward-looking statements. Disclosure of plans relating to and expected results of existing and future developments, including but not limited to the Horizon Oil Sands ("Horizon") operations and future expansions, the Athabasca Oil Sands Project ("AOSP"), Primrose thermal projects, the Pelican Lake water and polymer flood project, the Kirby Thermal Oil Sands Project, the cost and timing of construction and future operations of the North West Redwater bitumen upgrader and refinery, construction by third parties of new or expansion of existing pipeline capacity or other means of transportation of bitumen, crude oil, natural gas or synthetic crude oil (“SCO”) that the Company may be reliant upon to transport its products to market, development and deployment of technology and technological innovations and the assumption of operations at processing facilities also constitute forward-looking statements. This forward-looking information is based on annual budgets and multi-year forecasts, and is reviewed and revised throughout the year as necessary in the context of targeted financial ratios, project returns, product pricing expectations and balance in project risk and time horizons. These statements are not guarantees of future performance and are subject to certain risks. The reader should not place undue reliance on these forward-looking statements as there can be no assurances that the plans, initiatives or expectations upon which they are based will occur.In addition, statements relating to “reserves” are deemed to be forward-looking statements as they involve the implied assessment based on certain estimates and assumptions that the reserves described can be profitably produced in the future. There are numerous uncertainties inherent in estimating quantities of proved and proved plus probable crude oil, natural gas and natural gas liquids (“NGLs”) reserves and in projecting future rates of production and the timing of development expenditures. The total amount or timing of actual future production may vary significantly from reserve and production estimates.The forward-looking statements are based on current expectations, estimates and projections about the Company and the industry in which the Company operates, which speak only as of the date such statements were made or as of the date of the report or document in which they are contained, and are subject to known and unknown risks and uncertainties that could cause the actual results, performance or achievements of the Company to be materially different from any future results, performance or achievements expressed or implied by such forward-looking statements. Such risks and uncertainties include, among others: general economic and business conditions which will, among other things, impact demand for and market prices of the Company’s products; volatility of and assumptions regarding crude oil and natural gas prices; fluctuations in currency and interest rates; assumptions on which the Company’s current guidance is based; economic conditions in the countries and regions in which the Company conducts business; political uncertainty, including actions of or against terrorists, insurgent groups or other conflict including conflict between states; industry capacity; ability of the Company to implement its business strategy, including exploration and development activities; impact of competition; the Company’s defense of lawsuits; availability and cost of seismic, drilling and other equipment; ability of the Company and its subsidiaries to complete capital programs; the Company’s and its subsidiaries’ ability to secure adequate transportation for its products; unexpected disruptions or delays in the resumption of the mining, extracting or upgrading of the Company’s bitumen products; potential delays or changes in plans with respect to exploration or development projects or capital expenditures; ability of the Company to attract the necessary labour required to build its thermal and oil sands mining projects; operating hazards and other difficulties inherent in the exploration for and production and sale of crude oil and natural gas and in mining, extracting or upgrading the Company’s bitumen products; availability and cost of financing; the Company’s and its subsidiaries’ success of exploration and development activities and its ability to replace and expand crude oil and natural gas reserves; timing and success of integrating the business and operations of acquired companies and assets; production levels; imprecision of reserve estimates and estimates of recoverable quantities of crude oil, natural gas and NGLs not currently classified as proved; actions by governmental authorities; government regulations and the expenditures required to comply with them (especially safety and environmental laws and regulations and the impact of climate change initiatives on capital expenditures and production expenses); asset retirement obligations; the adequacy of the Company’s provision for taxes; and other circumstances affecting revenues and expenses.
Canadian Natural Resources Limited 2 Nine Months Ended September 30, 2018
The Company’s operations have been, and in the future may be, affected by political developments and by national, federal, provincial and local laws and regulations such as restrictions on production, changes in taxes, royalties and other amounts payable to governments or governmental agencies, price or gathering rate controls and environmental protection regulations. Should one or more of these risks or uncertainties materialize, or should any of the Company’s assumptions prove incorrect, actual results may vary in material respects from those projected in the forward-looking statements. The impact of any one factor on a particular forward-looking statement is not determinable with certainty as such factors are dependent upon other factors, and the Company’s course of action would depend upon its assessment of the future considering all information then available. Readers are cautioned that the foregoing list of factors is not exhaustive. Unpredictable or unknown factors not discussed in this MD&A could also have material adverse effects on forward-looking statements. Although the Company believes that the expectations conveyed by the forward-looking statements are reasonable based on information available to it on the date such forward-looking statements are made, no assurances can be given as to future results, levels of activity and achievements. All subsequent forward-looking statements, whether written or oral, attributable to the Company or persons acting on its behalf are expressly qualified in their entirety by these cautionary statements. Except as required by applicable law, the Company assumes no obligation to update forward-looking statements, whether as a result of new information, future events or other factors, or the foregoing factors affecting this information, should circumstances or the Company’s estimates or opinions change.
Management’s Discussion and AnalysisThis MD&A should be read in conjunction with the unaudited interim consolidated financial statements for the three and nine months ended September 30, 2018 and the MD&A and the audited consolidated financial statements for the year ended December 31, 2017.
All dollar amounts are referenced in millions of Canadian dollars, except where noted otherwise. The Company’s unaudited interim consolidated financial statements for the three and nine months ended September 30, 2018 and this MD&A have been prepared in accordance with International Financial Reporting Standards (“IFRS”) as issued by the International Accounting Standards Board ("IASB"). This MD&A includes references to financial measures commonly used in the crude oil and natural gas industry, such as: adjusted net earnings from operations; adjusted funds flow (previously referred to as funds flow from operations); net capital expenditures; adjusted cash production costs and adjusted depreciation, depletion and amortization. These financial measures are not defined by IFRS and therefore are referred to as non-GAAP measures. The non-GAAP measures used by the Company may not be comparable to similar measures presented by other companies. The Company uses these non-GAAP measures to evaluate its performance. The non-GAAP measures should not be considered an alternative to or more meaningful than net earnings, cash flows from operating activities, and cash flows from investing activities as determined in accordance with IFRS, as an indication of the Company's performance. The non-GAAP measure adjusted net earnings from operations is reconciled to net earnings, as determined in accordance with IFRS, in the “Financial Highlights” section of this MD&A. The non-GAAP measure adjusted funds flow is reconciled to cash flows from operating activities, as determined in accordance with IFRS, in the "Financial Highlights" section of this MD&A. The non-GAAP measure net capital expenditures is reconciled to cash flows from investing activities, as determined in accordance with IFRS, in the “Net capital expenditures” section of this MD&A. The derivation of adjusted cash production costs and adjusted depreciation, depletion and amortization are included in the "Operating Highlights - Oil Sands Mining and Upgrading" section of this MD&A. The Company also presents certain non-GAAP financial ratios and their derivation in the “Liquidity and Capital Resources” section of this MD&A.A Barrel of Oil Equivalent (“BOE”) is derived by converting six thousand cubic feet (“Mcf”) of natural gas to one barrel (“bbl”) of crude oil (6 Mcf:1 bbl). This conversion may be misleading, particularly if used in isolation, since the 6 Mcf:1 bbl ratio is based on an energy equivalency conversion method primarily applicable at the burner tip and does not represent a value equivalency at the wellhead. In comparing the value ratio using current crude oil prices relative to natural gas prices, the 6 Mcf:1 bbl conversion ratio may be misleading as an indication of value. In addition, for the purposes of this MD&A, crude oil is defined to include the following commodities: light and medium crude oil, primary heavy crude oil, Pelican Lake heavy crude oil, bitumen (thermal oil), and SCO.Production volumes and per unit statistics are presented throughout this MD&A on a “before royalty” or “gross” basis, and realized prices are net of blending and feedstock costs and exclude the effect of risk management activities. Production on an “after royalty” or “net” basis is also presented for information purposes only.The following discussion and analysis refers primarily to the Company’s financial results for the three and nine months ended September 30, 2018 in relation to the comparable periods in 2017 and the second quarter of 2018. The accompanying tables form an integral part of this MD&A. Additional information relating to the Company, including its Annual Information Form for the year ended December 31, 2017, is available on SEDAR at www.sedar.com, and on EDGAR at www.sec.gov. This MD&A is dated October 31, 2018.
Canadian Natural Resources Limited 3 Nine Months Ended September 30, 2018
FINANCIAL HIGHLIGHTS
Three Months Ended Nine Months Ended
($ millions, except per common share amounts)Sep 30
2018Jun 30
2018Sep 30
2017Sep 30
2018Sep 30
2017Product sales $ 6,327 $ 6,389 $ 4,725 $ 18,451 $ 12,844
Crude oil and NGLs $ 5,967 $ 6,071 $ 4,320 $ 17,341 $ 11,424Natural gas $ 360 $ 318 $ 405 $ 1,110 $ 1,420
Net earnings $ 1,802 $ 982 $ 684 $ 3,367 $ 2,001Per common share – basic $ 1.48 $ 0.80 $ 0.56 $ 2.75 $ 1.72
– diluted $ 1.47 $ 0.80 $ 0.56 $ 2.74 $ 1.71Adjusted net earnings from operations (1) $ 1,354 $ 1,279 $ 229 $ 3,518 $ 838
Per common share – basic $ 1.11 $ 1.05 $ 0.19 $ 2.88 $ 0.72 – diluted $ 1.11 $ 1.04 $ 0.19 $ 2.86 $ 0.72Cash flows from operating activities $ 3,642 $ 2,613 $ 2,522 $ 8,724 $ 5,824Adjusted funds flow (2) $ 2,830 $ 2,706 $ 1,675 $ 7,859 $ 5,040
Per common share – basic $ 2.32 $ 2.20 $ 1.38 $ 6.42 $ 4.34 – diluted $ 2.31 $ 2.19 $ 1.37 $ 6.39 $ 4.32Cash flows on (from) investing activities $ 1,265 $ 1,138 $ 1,960 $ 3,772 $ 12,028Net capital expenditures (3) $ 1,473 $ 974 $ 2,094 $ 3,550 $ 15,986
(1) Adjusted net earnings from operations is a non-GAAP measure that represents net earnings as presented in the Company's consolidated Statements of Earnings, adjusted for certain items of a non-operational nature. The Company considers adjusted net earnings from operations a key measure in evaluating the Company's performance. The reconciliation “Adjusted Net Earnings from Operations” presented in this MD&A, presents the after-tax effects of certain items of a non-operational nature that are included in the Company’s financial results. Adjusted net earnings from operations may not be comparable to similar measures presented by other companies.
(2) Adjusted funds flow (previously referred to as funds flow from operations) is a non-GAAP measure that represents cash flows from operating activities as presented in the Company's consolidated Statements of Cash Flows, adjusted for the net change in non-cash working capital, and abandonment and other expenditures. The Company evaluates its performance based on adjusted funds flow. The Company considers adjusted funds flow a key measure as it demonstrates the Company’s ability to generate the cash flow necessary to fund future growth through capital investment and to repay debt. The reconciliation “Adjusted Funds Flow, as Reconciled to Cash Flows from Operating Activities” is presented below in this MD&A. Adjusted funds flow may not be comparable to similar measures presented by other companies.
(3) Net capital expenditures is a non-GAAP measure that represents cash flows from investing activities as presented in the Company's consolidated Statements of Cash Flows, adjusted for the net change in non-cash working capital, investment in other long-term assets, share consideration in business acquisitions and abandonment expenditures. The Company considers net capital expenditures a key measure as it provides an understanding of the Company’s capital spending activities in comparison to the Company's annual capital budget. The reconciliation “Net Capital Expenditures, as Reconciled to Cash Flows from Investing Activities” is presented in the Net Capital Expenditures section of this MD&A on page 25. Net capital expenditures may not be comparable to similar measures presented by other companies.
Canadian Natural Resources Limited 4 Nine Months Ended September 30, 2018
Adjusted Net Earnings from OperationsThree Months Ended Nine Months Ended
($ millions)Sep 30
2018Jun 30
2018Sep 30
2017Sep 30
2018Sep 30
2017
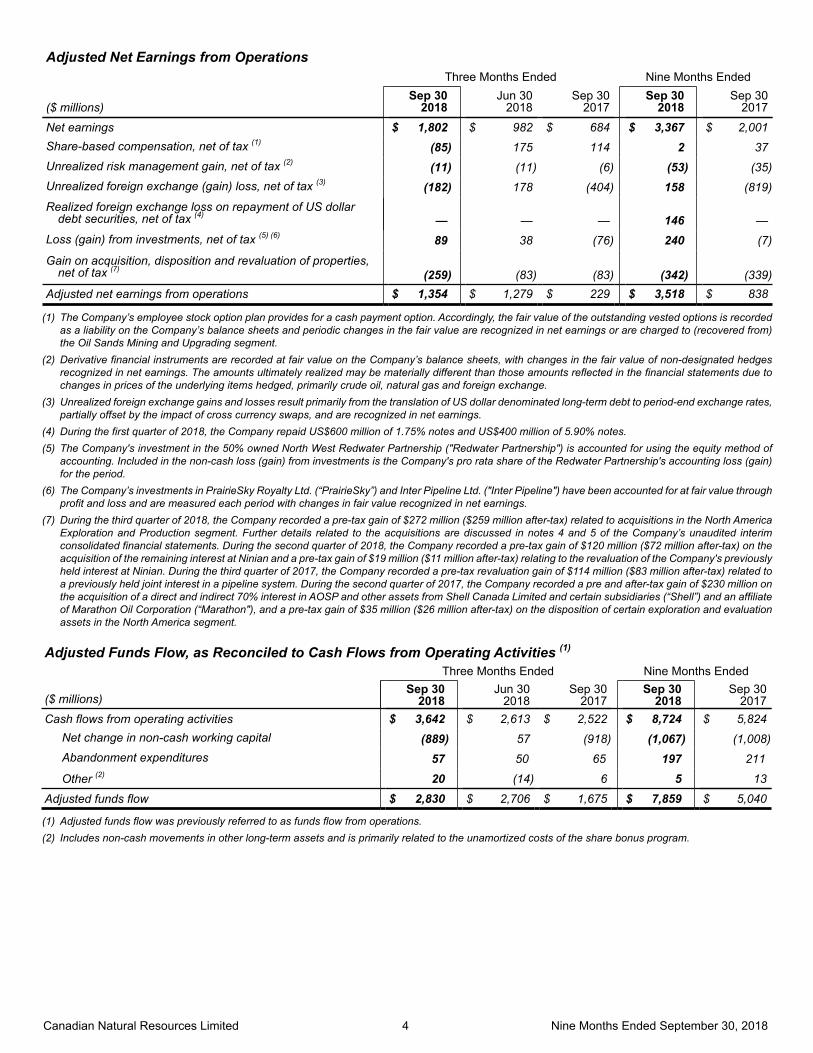
Net earnings $ 1,802 $ 982 $ 684 $ 3,367 $ 2,001Share-based compensation, net of tax (1) (85) 175 114 2 37Unrealized risk management gain, net of tax (2) (11) (11) (6) (53) (35)Unrealized foreign exchange (gain) loss, net of tax (3) (182) 178 (404) 158 (819)Realized foreign exchange loss on repayment of US dollar
debt securities, net of tax (4) — — — 146 —Loss (gain) from investments, net of tax (5) (6) 89 38 (76) 240 (7)
Gain on acquisition, disposition and revaluation of properties, net of tax (7) (259) (83) (83) (342) (339)
Adjusted net earnings from operations $ 1,354 $ 1,279 $ 229 $ 3,518 $ 838
(1) The Company’s employee stock option plan provides for a cash payment option. Accordingly, the fair value of the outstanding vested options is recorded as a liability on the Company’s balance sheets and periodic changes in the fair value are recognized in net earnings or are charged to (recovered from) the Oil Sands Mining and Upgrading segment.
(2) Derivative financial instruments are recorded at fair value on the Company’s balance sheets, with changes in the fair value of non-designated hedges recognized in net earnings. The amounts ultimately realized may be materially different than those amounts reflected in the financial statements due to changes in prices of the underlying items hedged, primarily crude oil, natural gas and foreign exchange.
(3) Unrealized foreign exchange gains and losses result primarily from the translation of US dollar denominated long-term debt to period-end exchange rates, partially offset by the impact of cross currency swaps, and are recognized in net earnings.
(4) During the first quarter of 2018, the Company repaid US$600 million of 1.75% notes and US$400 million of 5.90% notes.(5) The Company's investment in the 50% owned North West Redwater Partnership ("Redwater Partnership") is accounted for using the equity method of
accounting. Included in the non-cash loss (gain) from investments is the Company's pro rata share of the Redwater Partnership's accounting loss (gain) for the period.
(6) The Company’s investments in PrairieSky Royalty Ltd. (“PrairieSky”) and Inter Pipeline Ltd. ("Inter Pipeline") have been accounted for at fair value through profit and loss and are measured each period with changes in fair value recognized in net earnings.
(7) During the third quarter of 2018, the Company recorded a pre-tax gain of $272 million ($259 million after-tax) related to acquisitions in the North America Exploration and Production segment. Further details related to the acquisitions are discussed in notes 4 and 5 of the Company’s unaudited interim consolidated financial statements. During the second quarter of 2018, the Company recorded a pre-tax gain of $120 million ($72 million after-tax) on the acquisition of the remaining interest at Ninian and a pre-tax gain of $19 million ($11 million after-tax) relating to the revaluation of the Company's previously held interest at Ninian. During the third quarter of 2017, the Company recorded a pre-tax revaluation gain of $114 million ($83 million after-tax) related to a previously held joint interest in a pipeline system. During the second quarter of 2017, the Company recorded a pre and after-tax gain of $230 million on the acquisition of a direct and indirect 70% interest in AOSP and other assets from Shell Canada Limited and certain subsidiaries (“Shell”) and an affiliate of Marathon Oil Corporation (“Marathon"), and a pre-tax gain of $35 million ($26 million after-tax) on the disposition of certain exploration and evaluation assets in the North America segment.
Adjusted Funds Flow, as Reconciled to Cash Flows from Operating Activities (1)
Three Months Ended Nine Months Ended
($ millions)Sep 30
2018Jun 30
2018Sep 30
2017Sep 30
2018Sep 30
2017Cash flows from operating activities $ 3,642 $ 2,613 $ 2,522 $ 8,724 $ 5,824
Net change in non-cash working capital (889) 57 (918) (1,067) (1,008)Abandonment expenditures 57 50 65 197 211
Other (2) 20 (14) 6 5 13
Adjusted funds flow $ 2,830 $ 2,706 $ 1,675 $ 7,859 $ 5,040
(1) Adjusted funds flow was previously referred to as funds flow from operations. (2) Includes non-cash movements in other long-term assets and is primarily related to the unamortized costs of the share bonus program.
Canadian Natural Resources Limited 5 Nine Months Ended September 30, 2018
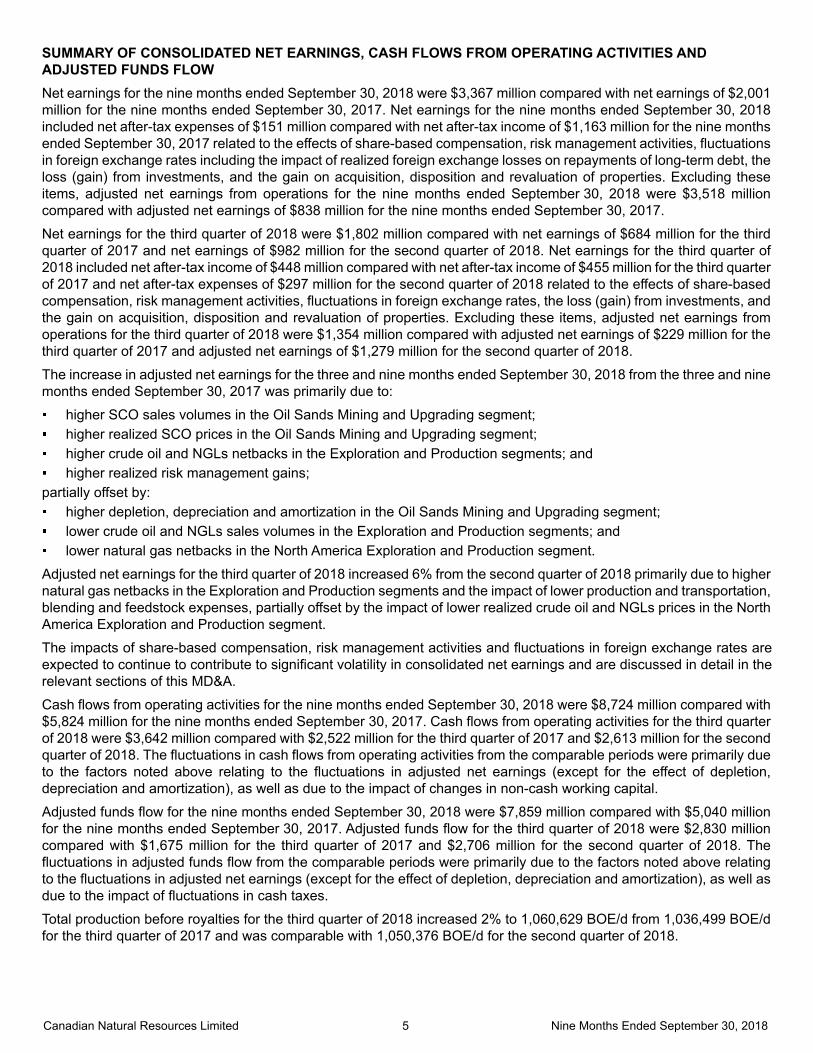
SUMMARY OF CONSOLIDATED NET EARNINGS, CASH FLOWS FROM OPERATING ACTIVITIES AND ADJUSTED FUNDS FLOWNet earnings for the nine months ended September 30, 2018 were $3,367 million compared with net earnings of $2,001 million for the nine months ended September 30, 2017. Net earnings for the nine months ended September 30, 2018 included net after-tax expenses of $151 million compared with net after-tax income of $1,163 million for the nine months ended September 30, 2017 related to the effects of share-based compensation, risk management activities, fluctuations in foreign exchange rates including the impact of realized foreign exchange losses on repayments of long-term debt, the loss (gain) from investments, and the gain on acquisition, disposition and revaluation of properties. Excluding these items, adjusted net earnings from operations for the nine months ended September 30, 2018 were $3,518 million compared with adjusted net earnings of $838 million for the nine months ended September 30, 2017.
Net earnings for the third quarter of 2018 were $1,802 million compared with net earnings of $684 million for the third quarter of 2017 and net earnings of $982 million for the second quarter of 2018. Net earnings for the third quarter of 2018 included net after-tax income of $448 million compared with net after-tax income of $455 million for the third quarter of 2017 and net after-tax expenses of $297 million for the second quarter of 2018 related to the effects of share-based compensation, risk management activities, fluctuations in foreign exchange rates, the loss (gain) from investments, and the gain on acquisition, disposition and revaluation of properties. Excluding these items, adjusted net earnings from operations for the third quarter of 2018 were $1,354 million compared with adjusted net earnings of $229 million for the third quarter of 2017 and adjusted net earnings of $1,279 million for the second quarter of 2018.
The increase in adjusted net earnings for the three and nine months ended September 30, 2018 from the three and nine months ended September 30, 2017 was primarily due to:
higher SCO sales volumes in the Oil Sands Mining and Upgrading segment; higher realized SCO prices in the Oil Sands Mining and Upgrading segment; higher crude oil and NGLs netbacks in the Exploration and Production segments; and higher realized risk management gains;
partially offset by: higher depletion, depreciation and amortization in the Oil Sands Mining and Upgrading segment; lower crude oil and NGLs sales volumes in the Exploration and Production segments; and lower natural gas netbacks in the North America Exploration and Production segment.
Adjusted net earnings for the third quarter of 2018 increased 6% from the second quarter of 2018 primarily due to higher natural gas netbacks in the Exploration and Production segments and the impact of lower production and transportation, blending and feedstock expenses, partially offset by the impact of lower realized crude oil and NGLs prices in the North America Exploration and Production segment.
The impacts of share-based compensation, risk management activities and fluctuations in foreign exchange rates are expected to continue to contribute to significant volatility in consolidated net earnings and are discussed in detail in the relevant sections of this MD&A.
Cash flows from operating activities for the nine months ended September 30, 2018 were $8,724 million compared with $5,824 million for the nine months ended September 30, 2017. Cash flows from operating activities for the third quarter of 2018 were $3,642 million compared with $2,522 million for the third quarter of 2017 and $2,613 million for the second quarter of 2018. The fluctuations in cash flows from operating activities from the comparable periods were primarily due to the factors noted above relating to the fluctuations in adjusted net earnings (except for the effect of depletion, depreciation and amortization), as well as due to the impact of changes in non-cash working capital.
Adjusted funds flow for the nine months ended September 30, 2018 were $7,859 million compared with $5,040 million for the nine months ended September 30, 2017. Adjusted funds flow for the third quarter of 2018 were $2,830 million compared with $1,675 million for the third quarter of 2017 and $2,706 million for the second quarter of 2018. The fluctuations in adjusted funds flow from the comparable periods were primarily due to the factors noted above relating to the fluctuations in adjusted net earnings (except for the effect of depletion, depreciation and amortization), as well as due to the impact of fluctuations in cash taxes.
Total production before royalties for the third quarter of 2018 increased 2% to 1,060,629 BOE/d from 1,036,499 BOE/d for the third quarter of 2017 and was comparable with 1,050,376 BOE/d for the second quarter of 2018.

Canadian Natural Resources Limited 6 Nine Months Ended September 30, 2018
SUMMARY OF QUARTERLY RESULTSThe following is a summary of the Company’s quarterly results for the eight most recently completed quarters:
($ millions, except per common shareamounts)
Sep 302018
Jun 302018
Mar 312018
Dec 312017
Product sales (1) $ 6,327 $ 6,389 $ 5,735 $ 5,516Crude oil and NGLs $ 5,967 $ 6,071 $ 5,303 $ 5,098Natural gas $ 360 $ 318 $ 432 $ 418
Net earnings $ 1,802 $ 982 $ 583 $ 396Net earnings per common share
– basic $ 1.48 $ 0.80 $ 0.48 $ 0.32– diluted $ 1.47 $ 0.80 $ 0.47 $ 0.32
($ millions, except per common shareamounts)
Sep 302017
Jun 302017
Mar 312017
Dec 312016
Product sales (1) $ 4,725 $ 4,127 $ 3,992 $ 3,672Crude oil and NGLs $ 4,320 $ 3,645 $ 3,459 $ 3,193Natural gas $ 405 $ 482 $ 533 $ 479
Net earnings $ 684 $ 1,072 $ 245 $ 566Net earnings per common share
– basic $ 0.56 $ 0.93 $ 0.22 $ 0.51– diluted $ 0.56 $ 0.93 $ 0.22 $ 0.51
(1) Comparative figures for product sales in 2016 are reported in accordance with the Company’s presentation prior to adoption of IFRS 15 on January 1, 2018. There were no changes to reported net earnings or retained earnings as a result of adopting IFRS 15.
Canadian Natural Resources Limited 7 Nine Months Ended September 30, 2018
Volatility in the quarterly net earnings over the eight most recently completed quarters was primarily due to: Crude oil pricing – Fluctuating global supply/demand including crude oil production levels from the Organization of
the Petroleum Exporting Countries (“OPEC”) and its impact on world supply, the impact of geopolitical uncertainties on worldwide benchmark pricing, the impact of shale oil production in North America, the impact of the Western Canadian Select ("WCS") Heavy Differential from the West Texas Intermediate reference location at Cushing, Oklahoma ("WTI") in North America and the impact of the differential between WTI and Dated Brent ("Brent") benchmark pricing in the North Sea and Offshore Africa.
Natural gas pricing – The impact of fluctuations in both the demand for natural gas and inventory storage levels, third-party pipeline maintenance and the impact of shale gas production in the US.
Crude oil and NGLs sales volumes – Fluctuations in production due to the cyclic nature of the Company’s Primrosethermal projects, production from Kirby South, the results from the Pelican Lake water and polymer flood projects, fluctuations in the Company’s drilling program in North America, the impact and timing of acquisitions, including the acquisition of AOSP and other assets, new production from Horizon Phase 2B and Phase 3, the impact of turnarounds and pitstops in the Oil Sands Mining and Upgrading segment, shut-in production due to low commodity prices, and the impact of the drilling program in the International segments. Sales volumes also reflected fluctuations due to timing of liftings and maintenance activities in the International segments.
Natural gas sales volumes – Fluctuations in production due to the Company’s allocation of capital to higher return crude oil projects, natural decline rates, fluctuating capacity at a third-party processing facility, shut-in production due to third party pipeline restrictions and related pricing impacts, shut-in production due to low commodity prices, and the impact and timing of acquisitions.
Production expense – Fluctuations primarily due to the impact of the demand and cost for services, fluctuations in product mix and production, the impact of seasonal costs that are dependent on weather, cost optimizations across all segments, the impact and timing of acquisitions, including the acquisition of AOSP and other assets, turnarounds and pitstops in the Oil Sands Mining and Upgrading segment, and maintenance activities in the International segments.
Depletion, depreciation and amortization – Fluctuations due to changes in sales volumes including the impact and timing of acquisitions and dispositions, proved reserves, asset retirement obligations, finding and development costs associated with crude oil and natural gas exploration, estimated future costs to develop the Company’s proved undeveloped reserves, fluctuations in International sales volumes subject to higher depletion rates, fluctuations in depletion, depreciation and amortization expense in the North Sea due to the cessation of production at the Ninian North platform in the second quarter of 2017, and the impact of turnarounds at Horizon.
Share-based compensation – Fluctuations due to the determination of fair market value based on the Black-Scholes valuation model of the Company’s share-based compensation liability.
Risk management – Fluctuations due to the recognition of gains and losses from the mark - to - market and subsequent settlement of the Company’s risk management activities.
Foreign exchange rates – Fluctuations in the Canadian dollar relative to the US dollar, which impact the realized price the Company received for its crude oil and natural gas sales, as sales prices are based predominantly on US dollar denominated benchmarks. Fluctuations in realized and unrealized foreign exchange gains and losses were also recorded with respect to US dollar denominated debt, partially offset by the impact of cross currency swap hedges.
Income tax expense – Fluctuations in income tax expense include statutory tax rate and other legislative changes substantively enacted in the various periods.
Gains on acquisition, disposition and revaluation of properties and gains/losses on investments – Fluctuations due to the recognition of gains on the acquisition of AOSP and other assets, the acquisition, disposition and revaluation of properties in the various periods, fair value changes in the investments in PrairieSky and Inter Pipeline shares, and the equity loss (gain) in Redwater Partnership.
Canadian Natural Resources Limited 8 Nine Months Ended September 30, 2018
BUSINESS ENVIRONMENT
Three Months Ended Nine Months Ended
(Average for the period)Sep 30
2018Jun 30
2018Sep 30
2017Sep 30
2018Sep 30
2017WTI benchmark price (US$/bbl) $ 69.50 $ 67.90 $ 48.19 $ 66.79 $ 49.43Dated Brent benchmark price (US$/bbl) $ 75.46 $ 74.51 $ 51.76 $ 72.35 $ 52.01WCS heavy differential from WTI (US$/bbl) $ 22.17 $ 19.24 $ 9.94 $ 21.89 $ 11.86SCO price (US$/bbl) $ 68.44 $ 67.27 $ 48.83 $ 65.75 $ 50.03Condensate benchmark price (US$/bbl) $ 66.82 $ 68.85 $ 47.96 $ 66.28 $ 49.52NYMEX benchmark price (US$/MMBtu) $ 2.90 $ 2.80 $ 3.00 $ 2.89 $ 3.16AECO benchmark price (C$/GJ) $ 1.28 $ 0.97 $ 1.94 $ 1.33 $ 2.45US/Canadian dollar average exchange rate
(US$) $ 0.7651 $ 0.7746 $ 0.7983 $ 0.7766 $ 0.7649
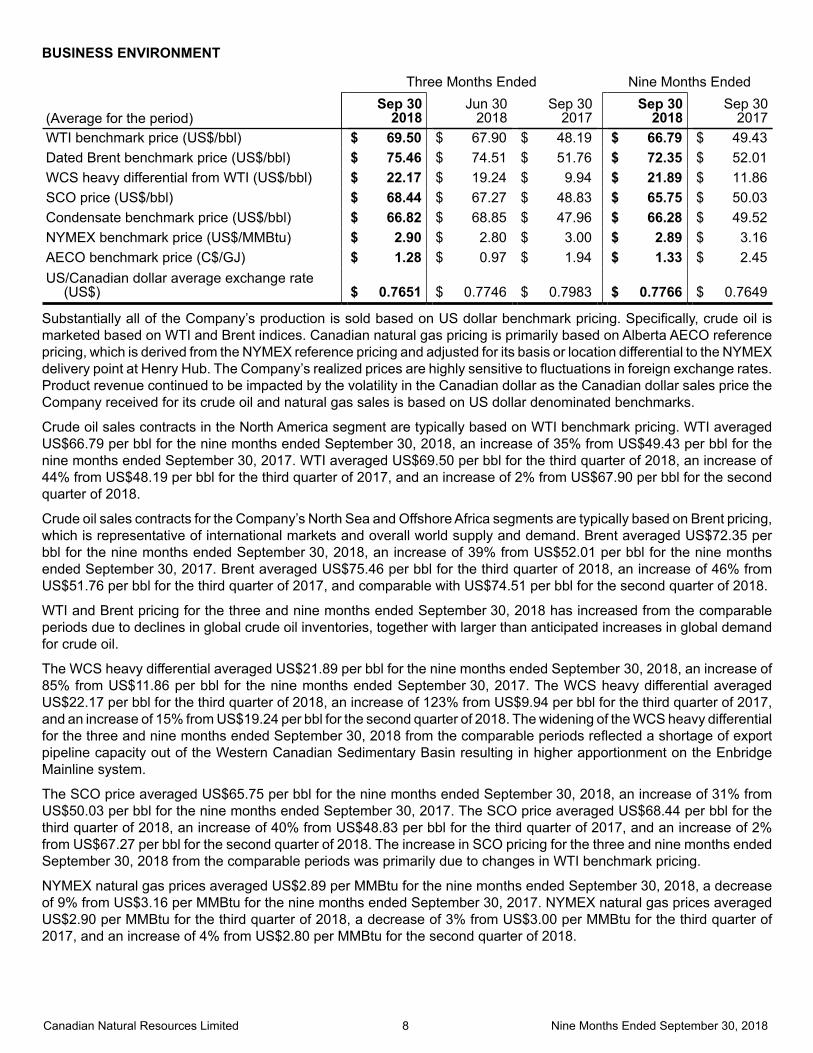
Substantially all of the Company’s production is sold based on US dollar benchmark pricing. Specifically, crude oil is marketed based on WTI and Brent indices. Canadian natural gas pricing is primarily based on Alberta AECO reference pricing, which is derived from the NYMEX reference pricing and adjusted for its basis or location differential to the NYMEX delivery point at Henry Hub. The Company’s realized prices are highly sensitive to fluctuations in foreign exchange rates. Product revenue continued to be impacted by the volatility in the Canadian dollar as the Canadian dollar sales price the Company received for its crude oil and natural gas sales is based on US dollar denominated benchmarks.
Crude oil sales contracts in the North America segment are typically based on WTI benchmark pricing. WTI averaged US$66.79 per bbl for the nine months ended September 30, 2018, an increase of 35% from US$49.43 per bbl for the nine months ended September 30, 2017. WTI averaged US$69.50 per bbl for the third quarter of 2018, an increase of 44% from US$48.19 per bbl for the third quarter of 2017, and an increase of 2% from US$67.90 per bbl for the secondquarter of 2018.
Crude oil sales contracts for the Company’s North Sea and Offshore Africa segments are typically based on Brent pricing, which is representative of international markets and overall world supply and demand. Brent averaged US$72.35 per bbl for the nine months ended September 30, 2018, an increase of 39% from US$52.01 per bbl for the nine months ended September 30, 2017. Brent averaged US$75.46 per bbl for the third quarter of 2018, an increase of 46% from US$51.76 per bbl for the third quarter of 2017, and comparable with US$74.51 per bbl for the second quarter of 2018.
WTI and Brent pricing for the three and nine months ended September 30, 2018 has increased from the comparable periods due to declines in global crude oil inventories, together with larger than anticipated increases in global demand for crude oil.
The WCS heavy differential averaged US$21.89 per bbl for the nine months ended September 30, 2018, an increase of 85% from US$11.86 per bbl for the nine months ended September 30, 2017. The WCS heavy differential averaged US$22.17 per bbl for the third quarter of 2018, an increase of 123% from US$9.94 per bbl for the third quarter of 2017, and an increase of 15% from US$19.24 per bbl for the second quarter of 2018. The widening of the WCS heavy differential for the three and nine months ended September 30, 2018 from the comparable periods reflected a shortage of export pipeline capacity out of the Western Canadian Sedimentary Basin resulting in higher apportionment on the Enbridge Mainline system.
The SCO price averaged US$65.75 per bbl for the nine months ended September 30, 2018, an increase of 31% from US$50.03 per bbl for the nine months ended September 30, 2017. The SCO price averaged US$68.44 per bbl for the third quarter of 2018, an increase of 40% from US$48.83 per bbl for the third quarter of 2017, and an increase of 2%from US$67.27 per bbl for the second quarter of 2018. The increase in SCO pricing for the three and nine months endedSeptember 30, 2018 from the comparable periods was primarily due to changes in WTI benchmark pricing.
NYMEX natural gas prices averaged US$2.89 per MMBtu for the nine months ended September 30, 2018, a decreaseof 9% from US$3.16 per MMBtu for the nine months ended September 30, 2017. NYMEX natural gas prices averaged US$2.90 per MMBtu for the third quarter of 2018, a decrease of 3% from US$3.00 per MMBtu for the third quarter of 2017, and an increase of 4% from US$2.80 per MMBtu for the second quarter of 2018.
Canadian Natural Resources Limited 9 Nine Months Ended September 30, 2018
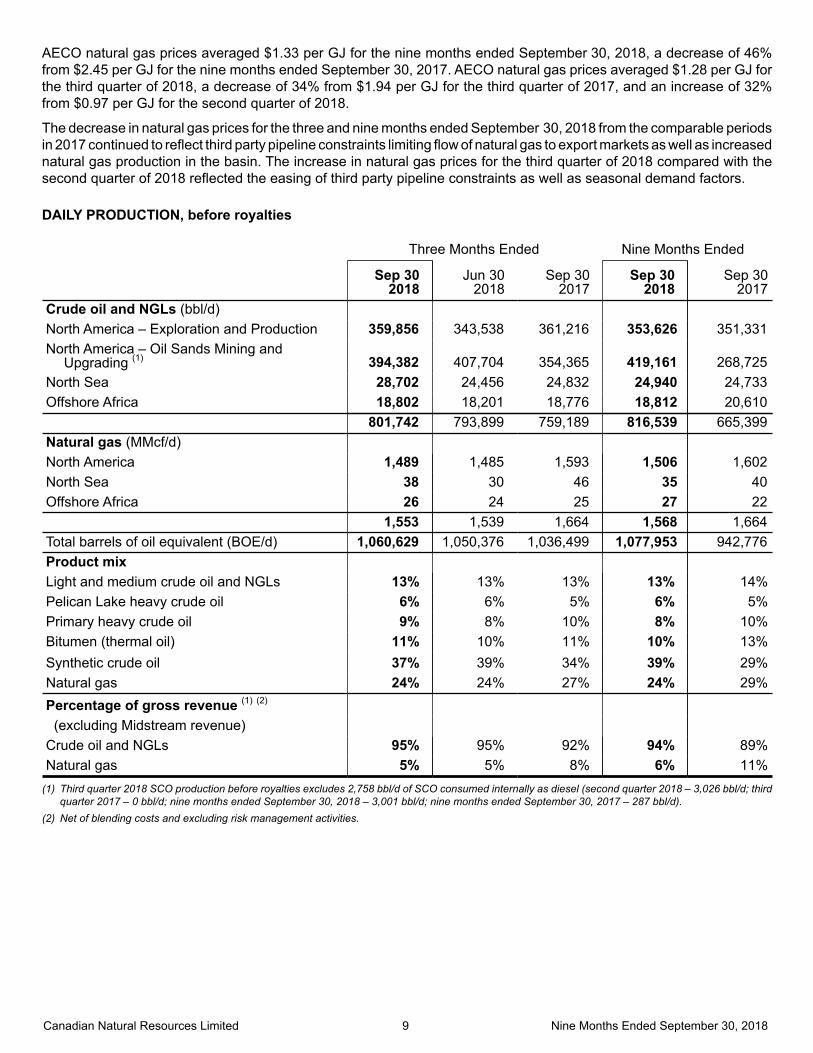
AECO natural gas prices averaged $1.33 per GJ for the nine months ended September 30, 2018, a decrease of 46%from $2.45 per GJ for the nine months ended September 30, 2017. AECO natural gas prices averaged $1.28 per GJ for the third quarter of 2018, a decrease of 34% from $1.94 per GJ for the third quarter of 2017, and an increase of 32%from $0.97 per GJ for the second quarter of 2018.
The decrease in natural gas prices for the three and nine months ended September 30, 2018 from the comparable periods in 2017 continued to reflect third party pipeline constraints limiting flow of natural gas to export markets as well as increased natural gas production in the basin. The increase in natural gas prices for the third quarter of 2018 compared with the second quarter of 2018 reflected the easing of third party pipeline constraints as well as seasonal demand factors.
DAILY PRODUCTION, before royalties
Three Months Ended Nine Months Ended
Sep 30
2018Jun 30
2018Sep 30
2017Sep 30
2018Sep 30
2017Crude oil and NGLs (bbl/d)
North America – Exploration and Production 359,856 343,538 361,216 353,626 351,331North America – Oil Sands Mining and
Upgrading (1) 394,382 407,704 354,365 419,161 268,725North Sea 28,702 24,456 24,832 24,940 24,733Offshore Africa 18,802 18,201 18,776 18,812 20,610 801,742 793,899 759,189 816,539 665,399Natural gas (MMcf/d)
North America 1,489 1,485 1,593 1,506 1,602North Sea 38 30 46 35 40Offshore Africa 26 24 25 27 22 1,553 1,539 1,664 1,568 1,664Total barrels of oil equivalent (BOE/d) 1,060,629 1,050,376 1,036,499 1,077,953 942,776Product mix
Light and medium crude oil and NGLs 13% 13% 13% 13% 14%Pelican Lake heavy crude oil 6% 6% 5% 6% 5%Primary heavy crude oil 9% 8% 10% 8% 10%Bitumen (thermal oil) 11% 10% 11% 10% 13%Synthetic crude oil 37% 39% 34% 39% 29%Natural gas 24% 24% 27% 24% 29%Percentage of gross revenue (1) (2)
(excluding Midstream revenue)
Crude oil and NGLs 95% 95% 92% 94% 89%Natural gas 5% 5% 8% 6% 11%
(1) Third quarter 2018 SCO production before royalties excludes 2,758 bbl/d of SCO consumed internally as diesel (second quarter 2018 – 3,026 bbl/d; third quarter 2017 – 0 bbl/d; nine months ended September 30, 2018 – 3,001 bbl/d; nine months ended September 30, 2017 – 287 bbl/d).
(2) Net of blending costs and excluding risk management activities.

Canadian Natural Resources Limited 10 Nine Months Ended September 30, 2018
DAILY PRODUCTION, net of royalties
Three Months Ended Nine Months Ended
Sep 30
2018Jun 30
2018Sep 30
2017Sep 30
2018Sep 30
2017Crude oil and NGLs (bbl/d)
North America – Exploration and Production 307,668 293,080 310,497 303,833 305,084North America – Oil Sands Mining and
Upgrading 372,521 385,986 345,067 400,444 262,528North Sea 28,609 24,411 24,784 24,873 24,683Offshore Africa 17,264 16,502 17,735 17,467 19,543 726,062 719,979 698,083 746,617 611,838Natural gas (MMcf/d)
North America 1,455 1,407 1,543 1,445 1,525North Sea 38 30 46 35 40Offshore Africa 22 20 22 23 19 1,515 1,457 1,611 1,503 1,584Total barrels of oil equivalent (BOE/d) 978,481 962,742 966,528 997,044 875,831
The Company’s business approach is to maintain large project inventories and production diversification among each of the commodities it produces; namely light and medium crude oil and NGLs, primary heavy crude oil, Pelican Lake heavy crude oil, bitumen (thermal oil), SCO and natural gas.
Crude oil and NGLs production for the nine months ended September 30, 2018 increased 23% to 816,539 bbl/d from 665,399 bbl/d for the nine months ended September 30, 2017. Crude oil and NGLs production for the third quarter of 2018 of 801,742 bbl/d increased 6% from 759,189 bbl/d for the third quarter of 2017, and was comparable with 793,899 bbl/d in the second quarter of 2018. The increase in crude oil and NGLs production for the three and nine months ended September 30, 2018 from the comparable periods in 2017 was primarily due to the impact of Phase 3 production at Horizon, acquisitions completed in 2017, and production from new wells in the North Sea, partially offset by the impact of proactive measures taken to delay completion and ramp up of new wells in thermal and heavy oil in the first half of 2018.
Third quarter 2018 crude oil and NGLs production was above the midpoint of the Company's previously issued guidance of 771,000 to 819,000 bbl/d. Fourth quarter 2018 crude oil and NGLs production guidance is targeted to average between 801,000 and 849,000 bbl/d. Annual 2018 crude oil and NGLs production guidance is now targeted to average between 802,000 and 868,000 bbl/d.
Natural gas production for the nine months ended September 30, 2018 decreased 6% to 1,568 MMcf/d from 1,664 MMcf/d for the nine months ended September 30, 2017. Natural gas production for the third quarter of 2018 averaged 1,553 MMcf/d, a decrease of 7% from 1,664 MMcf/d for the third quarter of 2017, and comparable with 1,539 MMcf/d for the second quarter of 2018. Natural gas production in the third quarter of 2018 as compared with the second quarter of 2018 reflected the Company’s reliable and efficient operations following the planned maintenance activities in the second quarter of 2018, partially offset by the impact of the strategic deferral of natural gas activities due to low natural gas prices and natural field declines. The decrease in production for the three and nine months ended September 30, 2018 from the comparable periods in 2017 primarily reflected reduced natural gas activity, including the impact of shut-in volumes as a result of low natural gas prices together with natural field declines.
Third quarter 2018 natural gas production was within the Company's previously issued guidance of 1,535 to 1,565 MMcf/d. Fourth quarter 2018 natural gas production guidance is targeted to average between 1,480 and 1,510 MMcf/d.
Canadian Natural Resources Limited 11 Nine Months Ended September 30, 2018
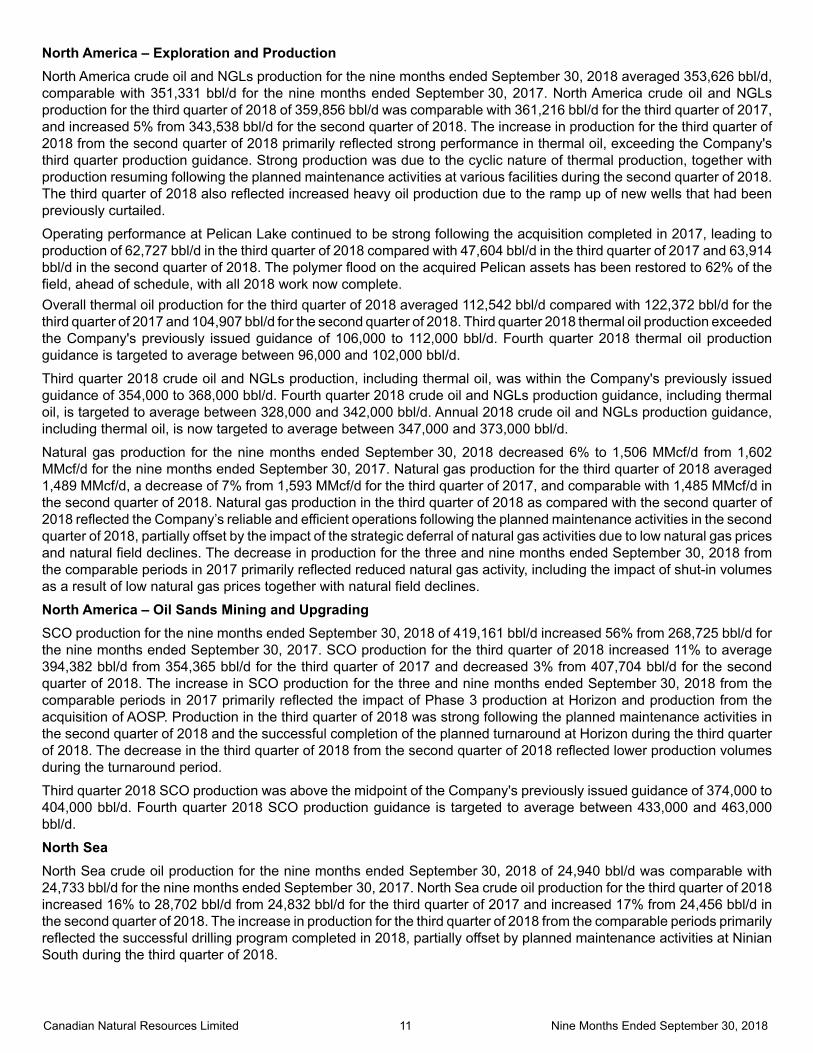
North America – Exploration and ProductionNorth America crude oil and NGLs production for the nine months ended September 30, 2018 averaged 353,626 bbl/d, comparable with 351,331 bbl/d for the nine months ended September 30, 2017. North America crude oil and NGLs production for the third quarter of 2018 of 359,856 bbl/d was comparable with 361,216 bbl/d for the third quarter of 2017, and increased 5% from 343,538 bbl/d for the second quarter of 2018. The increase in production for the third quarter of 2018 from the second quarter of 2018 primarily reflected strong performance in thermal oil, exceeding the Company's third quarter production guidance. Strong production was due to the cyclic nature of thermal production, together with production resuming following the planned maintenance activities at various facilities during the second quarter of 2018. The third quarter of 2018 also reflected increased heavy oil production due to the ramp up of new wells that had been previously curtailed.
Operating performance at Pelican Lake continued to be strong following the acquisition completed in 2017, leading to production of 62,727 bbl/d in the third quarter of 2018 compared with 47,604 bbl/d in the third quarter of 2017 and 63,914bbl/d in the second quarter of 2018. The polymer flood on the acquired Pelican assets has been restored to 62% of the field, ahead of schedule, with all 2018 work now complete.Overall thermal oil production for the third quarter of 2018 averaged 112,542 bbl/d compared with 122,372 bbl/d for the third quarter of 2017 and 104,907 bbl/d for the second quarter of 2018. Third quarter 2018 thermal oil production exceeded the Company's previously issued guidance of 106,000 to 112,000 bbl/d. Fourth quarter 2018 thermal oil production guidance is targeted to average between 96,000 and 102,000 bbl/d.
Third quarter 2018 crude oil and NGLs production, including thermal oil, was within the Company's previously issued guidance of 354,000 to 368,000 bbl/d. Fourth quarter 2018 crude oil and NGLs production guidance, including thermal oil, is targeted to average between 328,000 and 342,000 bbl/d. Annual 2018 crude oil and NGLs production guidance, including thermal oil, is now targeted to average between 347,000 and 373,000 bbl/d.
Natural gas production for the nine months ended September 30, 2018 decreased 6% to 1,506 MMcf/d from 1,602 MMcf/d for the nine months ended September 30, 2017. Natural gas production for the third quarter of 2018 averaged 1,489 MMcf/d, a decrease of 7% from 1,593 MMcf/d for the third quarter of 2017, and comparable with 1,485 MMcf/d in the second quarter of 2018. Natural gas production in the third quarter of 2018 as compared with the second quarter of 2018 reflected the Company’s reliable and efficient operations following the planned maintenance activities in the second quarter of 2018, partially offset by the impact of the strategic deferral of natural gas activities due to low natural gas prices and natural field declines. The decrease in production for the three and nine months ended September 30, 2018 from the comparable periods in 2017 primarily reflected reduced natural gas activity, including the impact of shut-in volumes as a result of low natural gas prices together with natural field declines.
North America – Oil Sands Mining and UpgradingSCO production for the nine months ended September 30, 2018 of 419,161 bbl/d increased 56% from 268,725 bbl/d for the nine months ended September 30, 2017. SCO production for the third quarter of 2018 increased 11% to average 394,382 bbl/d from 354,365 bbl/d for the third quarter of 2017 and decreased 3% from 407,704 bbl/d for the secondquarter of 2018. The increase in SCO production for the three and nine months ended September 30, 2018 from the comparable periods in 2017 primarily reflected the impact of Phase 3 production at Horizon and production from the acquisition of AOSP. Production in the third quarter of 2018 was strong following the planned maintenance activities in the second quarter of 2018 and the successful completion of the planned turnaround at Horizon during the third quarter of 2018. The decrease in the third quarter of 2018 from the second quarter of 2018 reflected lower production volumes during the turnaround period.
Third quarter 2018 SCO production was above the midpoint of the Company's previously issued guidance of 374,000 to 404,000 bbl/d. Fourth quarter 2018 SCO production guidance is targeted to average between 433,000 and 463,000 bbl/d.
North SeaNorth Sea crude oil production for the nine months ended September 30, 2018 of 24,940 bbl/d was comparable with 24,733 bbl/d for the nine months ended September 30, 2017. North Sea crude oil production for the third quarter of 2018increased 16% to 28,702 bbl/d from 24,832 bbl/d for the third quarter of 2017 and increased 17% from 24,456 bbl/d in the second quarter of 2018. The increase in production for the third quarter of 2018 from the comparable periods primarily reflected the successful drilling program completed in 2018, partially offset by planned maintenance activities at Ninian South during the third quarter of 2018.
Canadian Natural Resources Limited 12 Nine Months Ended September 30, 2018
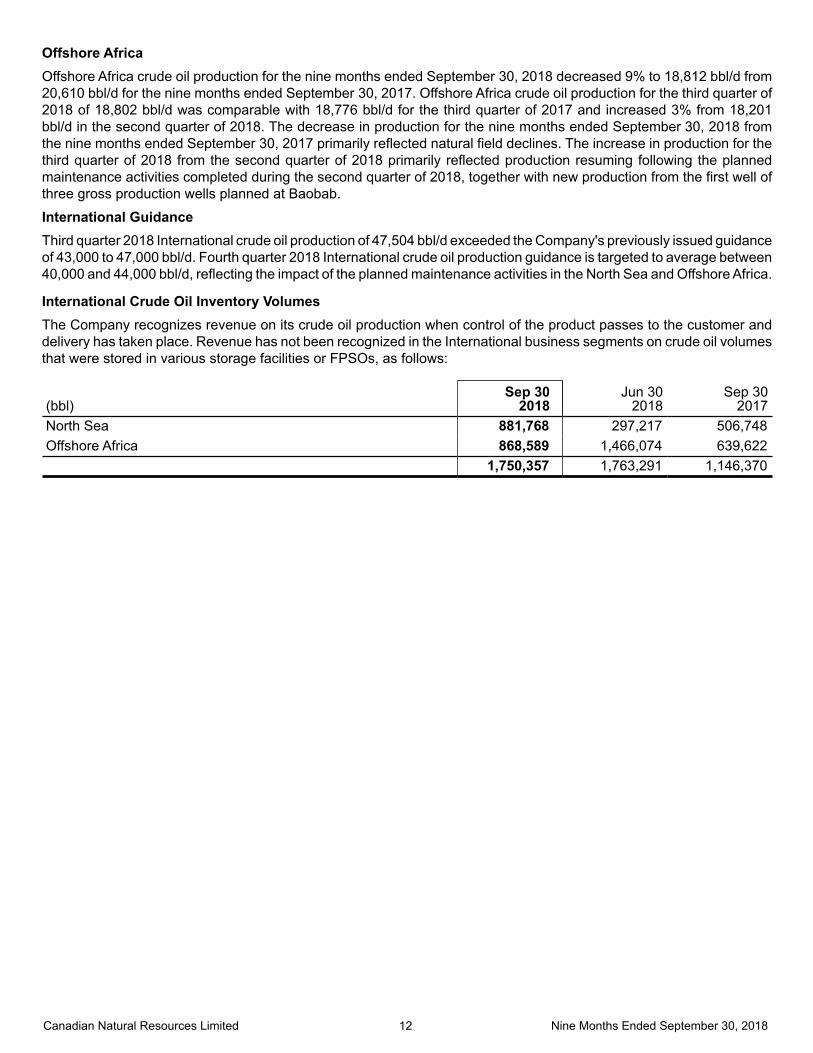
Offshore AfricaOffshore Africa crude oil production for the nine months ended September 30, 2018 decreased 9% to 18,812 bbl/d from 20,610 bbl/d for the nine months ended September 30, 2017. Offshore Africa crude oil production for the third quarter of 2018 of 18,802 bbl/d was comparable with 18,776 bbl/d for the third quarter of 2017 and increased 3% from 18,201 bbl/d in the second quarter of 2018. The decrease in production for the nine months ended September 30, 2018 from the nine months ended September 30, 2017 primarily reflected natural field declines. The increase in production for the third quarter of 2018 from the second quarter of 2018 primarily reflected production resuming following the planned maintenance activities completed during the second quarter of 2018, together with new production from the first well of three gross production wells planned at Baobab.
International GuidanceThird quarter 2018 International crude oil production of 47,504 bbl/d exceeded the Company's previously issued guidance of 43,000 to 47,000 bbl/d. Fourth quarter 2018 International crude oil production guidance is targeted to average between 40,000 and 44,000 bbl/d, reflecting the impact of the planned maintenance activities in the North Sea and Offshore Africa.
International Crude Oil Inventory VolumesThe Company recognizes revenue on its crude oil production when control of the product passes to the customer and delivery has taken place. Revenue has not been recognized in the International business segments on crude oil volumes that were stored in various storage facilities or FPSOs, as follows:
(bbl)Sep 30
2018Jun 30
2018Sep 30
2017North Sea 881,768 297,217 506,748Offshore Africa 868,589 1,466,074 639,622 1,750,357 1,763,291 1,146,370

Canadian Natural Resources Limited 13 Nine Months Ended September 30, 2018
OPERATING HIGHLIGHTS – EXPLORATION AND PRODUCTION
Three Months Ended Nine Months Ended
Sep 30
2018Jun 30
2018Sep 30
2017Sep 30
2018Sep 30
2017Crude oil and NGLs ($/bbl) (1)
Sales price (2) $ 57.89 $ 61.14 $ 46.33 $ 54.26 $ 46.82Transportation 3.00 3.30 2.81 3.13 2.79Realized sales price, net of transportation 54.89 57.84 43.52 51.13 44.03Royalties 7.08 7.56 5.33 6.54 5.03Production expense 14.47 15.64 14.71 15.25 14.84Netback $ 33.34 $ 34.64 $ 23.48 $ 29.34 $ 24.16Natural gas ($/Mcf) (1)
Sales price (2) $ 2.32 $ 1.95 $ 2.29 $ 2.34 $ 2.83Transportation 0.42 0.51 0.33 0.47 0.37Realized sales price, net of transportation 1.90 1.44 1.96 1.87 2.46Royalties 0.05 0.08 0.07 0.08 0.12Production expense 1.33 1.39 1.22 1.38 1.25Netback (3) $ 0.52 $ (0.03) $ 0.67 $ 0.41 $ 1.09Barrels of oil equivalent ($/BOE) (1)
Sales price (2) $ 40.77 $ 41.63 $ 33.27 $ 38.20 $ 34.40Transportation 2.83 3.20 2.51 3.03 2.59Realized sales price, net of transportation 37.94 38.43 30.76 35.17 31.81Royalties 4.44 4.75 3.36 4.10 3.28Production expense 11.91 12.75 11.73 12.44 11.83Netback $ 21.59 $ 20.93 $ 15.67 $ 18.63 $ 16.70
(1) Amounts expressed on a per unit basis are based on sales volumes.(2) Net of blending costs and excluding risk management activities.(3) Natural gas netbacks exclude netbacks derived from the sale of NGLs. Combining natural gas and NGLs, the netback for the three months ended
September 30, 2018 was $1.05/Mcfe (three months ended June 30, 2018 - $0.60/Mcfe, three months ended September 30, 2017 - $0.96/Mcfe).
Canadian Natural Resources Limited 14 Nine Months Ended September 30, 2018
PRODUCT PRICES – EXPLORATION AND PRODUCTION
Three Months Ended Nine Months Ended
Sep 30
2018Jun 30
2018Sep 30
2017Sep 30
2018Sep 30
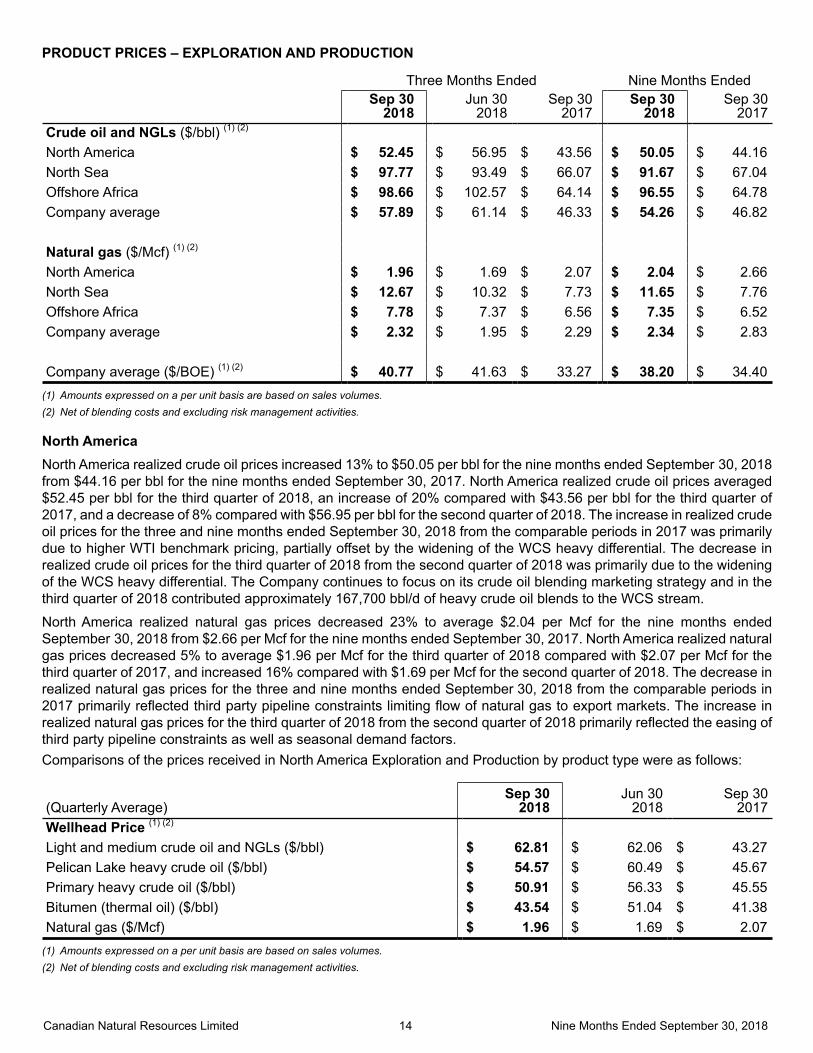
2017Crude oil and NGLs ($/bbl) (1) (2) North America $ 52.45 $ 56.95 $ 43.56 $ 50.05 $ 44.16North Sea $ 97.77 $ 93.49 $ 66.07 $ 91.67 $ 67.04Offshore Africa $ 98.66 $ 102.57 $ 64.14 $ 96.55 $ 64.78Company average $ 57.89 $ 61.14 $ 46.33 $ 54.26 $ 46.82
Natural gas ($/Mcf) (1) (2) North America $ 1.96 $ 1.69 $ 2.07 $ 2.04 $ 2.66North Sea $ 12.67 $ 10.32 $ 7.73 $ 11.65 $ 7.76Offshore Africa $ 7.78 $ 7.37 $ 6.56 $ 7.35 $ 6.52Company average $ 2.32 $ 1.95 $ 2.29 $ 2.34 $ 2.83
Company average ($/BOE) (1) (2) $ 40.77 $ 41.63 $ 33.27 $ 38.20 $ 34.40(1) Amounts expressed on a per unit basis are based on sales volumes.(2) Net of blending costs and excluding risk management activities.
North AmericaNorth America realized crude oil prices increased 13% to $50.05 per bbl for the nine months ended September 30, 2018from $44.16 per bbl for the nine months ended September 30, 2017. North America realized crude oil prices averaged $52.45 per bbl for the third quarter of 2018, an increase of 20% compared with $43.56 per bbl for the third quarter of 2017, and a decrease of 8% compared with $56.95 per bbl for the second quarter of 2018. The increase in realized crude oil prices for the three and nine months ended September 30, 2018 from the comparable periods in 2017 was primarily due to higher WTI benchmark pricing, partially offset by the widening of the WCS heavy differential. The decrease in realized crude oil prices for the third quarter of 2018 from the second quarter of 2018 was primarily due to the widening of the WCS heavy differential. The Company continues to focus on its crude oil blending marketing strategy and in the third quarter of 2018 contributed approximately 167,700 bbl/d of heavy crude oil blends to the WCS stream.
North America realized natural gas prices decreased 23% to average $2.04 per Mcf for the nine months endedSeptember 30, 2018 from $2.66 per Mcf for the nine months ended September 30, 2017. North America realized natural gas prices decreased 5% to average $1.96 per Mcf for the third quarter of 2018 compared with $2.07 per Mcf for the third quarter of 2017, and increased 16% compared with $1.69 per Mcf for the second quarter of 2018. The decrease in realized natural gas prices for the three and nine months ended September 30, 2018 from the comparable periods in 2017 primarily reflected third party pipeline constraints limiting flow of natural gas to export markets. The increase in realized natural gas prices for the third quarter of 2018 from the second quarter of 2018 primarily reflected the easing of third party pipeline constraints as well as seasonal demand factors.Comparisons of the prices received in North America Exploration and Production by product type were as follows:
(Quarterly Average)Sep 30
2018Jun 30
2018Sep 30
2017Wellhead Price (1) (2) Light and medium crude oil and NGLs ($/bbl) $ 62.81 $ 62.06 $ 43.27Pelican Lake heavy crude oil ($/bbl) $ 54.57 $ 60.49 $ 45.67Primary heavy crude oil ($/bbl) $ 50.91 $ 56.33 $ 45.55Bitumen (thermal oil) ($/bbl) $ 43.54 $ 51.04 $ 41.38Natural gas ($/Mcf) $ 1.96 $ 1.69 $ 2.07
(1) Amounts expressed on a per unit basis are based on sales volumes.(2) Net of blending costs and excluding risk management activities.

Canadian Natural Resources Limited 15 Nine Months Ended September 30, 2018
North SeaNorth Sea realized crude oil prices increased 37% to average $91.67 per bbl for the nine months ended September 30, 2018 from $67.04 per bbl for the nine months ended September 30, 2017. North Sea realized crude oil prices increased48% to average $97.77 per bbl for the third quarter of 2018 from $66.07 per bbl for the third quarter of 2017 and increased5% from $93.49 per bbl for the second quarter of 2018. Realized crude oil prices per bbl in any particular period are dependent on the terms of the various sales contracts, the frequency and timing of liftings of each field, and prevailing crude oil prices and foreign exchange rates at the time of lifting. The fluctuations in realized crude oil prices for the three and nine months ended September 30, 2018 from the comparable periods reflected prevailing Brent benchmark pricing at the time of liftings, together with the impact of movements in the Canadian dollar.
Offshore AfricaOffshore Africa realized crude oil prices increased 49% to average $96.55 per bbl for the nine months ended September 30, 2018 from $64.78 per bbl for the nine months ended September 30, 2017. Offshore Africa realized crude oil prices increased 54% to average $98.66 per bbl for the third quarter of 2018 from $64.14 per bbl for the third quarter of 2017 and decreased 4% from $102.57 per bbl for the second quarter of 2018. Realized crude oil prices per bbl in any particular year are dependent on the terms of the various sales contracts, the frequency and timing of liftings of each field, and prevailing crude oil prices and foreign exchange rates at the time of lifting. The fluctuations in realized crude oil prices for the three and nine months ended September 30, 2018 from the comparable periods reflected prevailing Brent benchmark pricing at the time of liftings, together with the impact of movements in the Canadian dollar.
ROYALTIES – EXPLORATION AND PRODUCTION
Three Months Ended Nine Months Ended
Sep 30
2018Jun 30
2018Sep 30
2017Sep 30
2018Sep 30
2017Crude oil and NGLs ($/bbl) (1)
North America $ 7.44 $ 8.03 $ 5.84 $ 6.87 $ 5.50North Sea $ 0.31 $ 0.17 $ 0.13 $ 0.23 $ 0.13Offshore Africa $ 8.07 $ 9.58 $ 3.56 $ 7.72 $ 3.37Company average $ 7.08 $ 7.56 $ 5.33 $ 6.54 $ 5.03
Natural gas ($/Mcf) (1)
North America $ 0.04 $ 0.06 $ 0.05 $ 0.06 $ 0.12Offshore Africa $ 1.20 $ 1.17 $ 0.95 $ 1.07 $ 0.73Company average $ 0.05 $ 0.08 $ 0.07 $ 0.08 $ 0.12
Company average ($/BOE) (1) $ 4.44 $ 4.75 $ 3.36 $ 4.10 $ 3.28(1) Amounts expressed on a per unit basis are based on sales volumes.
North AmericaNorth America crude oil and natural gas royalties for the three and nine months ended September 30, 2018 and the comparable periods reflected movements in benchmark commodity prices. North America crude oil royalties also reflected fluctuations in the WCS heavy differential.
Crude oil and NGLs royalties averaged approximately 15% of product sales for the nine months ended September 30, 2018 compared with 13% of product sales for the nine months ended September 30, 2017. Crude oil and NGLs royalties averaged approximately 15% of product sales for the third quarter of 2018 compared with 14% for the third quarter of 2017 and 15% for the second quarter of 2018. The increase in royalties for the three and nine months ended September 30, 2018 from the comparable periods in 2017 was primarily due to higher realized crude oil prices.
Natural gas royalties averaged approximately 4% of product sales for the nine months ended September 30, 2018 compared with 5% of product sales for the nine months ended September 30, 2017. Natural gas royalties averaged approximately 2% of product sales for the third quarter of 2018 compared with 3% for the third quarter of 2017 and 5% for the second quarter of 2018. The decrease in royalties for the three and nine months ended September 30, 2018 from the comparable periods in 2017 primarily reflected lower realized natural gas prices. The decrease in royalties for the third quarter of 2018 from the second quarter of 2018 primarily reflected the impact of royalty adjustments in both periods.

Canadian Natural Resources Limited 16 Nine Months Ended September 30, 2018
Offshore AfricaUnder the terms of the various Production Sharing Contracts, royalty rates fluctuate based on realized commodity pricing, capital expenditures and production expenses, the status of payouts, and the timing of liftings from each field.
Royalty rates as a percentage of product sales averaged approximately 9% for the nine months ended September 30, 2018, compared with 6% of product sales for the nine months ended September 30, 2017. Royalty rates as a percentage of product sales averaged approximately 9% for the third quarter of 2018, compared with 6% of product sales for the third quarter of 2017 and 10% for the second quarter of 2018. Royalties as a percentage of product sales reflected the timing of liftings and the status of payout in the various fields.
PRODUCTION EXPENSE – EXPLORATION AND PRODUCTION
Three Months Ended Nine Months Ended
Sep 30
2018Jun 30
2018Sep 30
2017Sep 30
2018Sep 30
2017Crude oil and NGLs ($/bbl) (1)
North America $ 12.67 $ 13.78 $ 12.10 $ 13.52 $ 12.66North Sea $ 37.32 $ 35.12 $ 35.72 $ 37.84 $ 34.06Offshore Africa $ 19.53 $ 24.78 $ 29.24 $ 23.03 $ 26.39Company average $ 14.47 $ 15.64 $ 14.71 $ 15.25 $ 14.84
Natural gas ($/Mcf) (1)
North America $ 1.20 $ 1.28 $ 1.15 $ 1.26 $ 1.17North Sea $ 5.22 $ 5.81 $ 3.09 $ 5.20 $ 3.18Offshore Africa $ 2.69 $ 3.00 $ 2.32 $ 2.69 $ 3.13Company average $ 1.33 $ 1.39 $ 1.22 $ 1.38 $ 1.25
Company average ($/BOE) (1) $ 11.91 $ 12.75 $ 11.73 $ 12.44 $ 11.83(1) Amounts expressed on a per unit basis are based on sales volumes.
North AmericaNorth America crude oil and NGLs production expense for the nine months ended September 30, 2018 increased 7%to $13.52 per bbl from $12.66 per bbl for the nine months ended September 30, 2017. North America crude oil and NGLs production expense for the third quarter of 2018 of $12.67 per bbl increased 5% from $12.10 per bbl in the third quarterof 2017 and decreased 8% from $13.78 per bbl for the second quarter of 2018. Crude oil and NGLs production expense for the three and nine months ended September 30, 2018 as compared with the periods in 2017 primarily reflected the Company's continuous focus on cost control and achieving efficiencies on acquired assets and across the entire asset base partially offsetting significantly increased carbon tax and energy costs in 2018. The decrease per barrel for the third quarter of 2018 from the second quarter of 2018 reflected higher volumes and lower service costs, together with the Company's continuous focus on cost control.
North America natural gas production expense for the nine months ended September 30, 2018 averaged $1.26 per Mcf, an increase of 8% from $1.17 per Mcf for the nine months ended September 30, 2017. North America natural gas production expense for the third quarter of 2018 increased 4% to $1.20 per Mcf from $1.15 per Mcf for the third quarterof 2017 and decreased 6% from $1.28 per Mcf for the second quarter of 2018. Natural gas production expense for the three and nine months ended September 30, 2018 as compared with the periods in 2017 primarily reflected the Company's continuous focus on cost control and achieving efficiencies on acquired assets and across the entire asset base partially offsetting the impact of lower volumes on a relatively fixed cost base. The decrease in natural gas production expense for the third quarter of 2018 from the second quarter of 2018 primarily reflected lower service costs.
Canadian Natural Resources Limited 17 Nine Months Ended September 30, 2018
North Sea North Sea crude oil production expense for the nine months ended September 30, 2018 increased 11% to $37.84 per bbl from $34.06 per bbl for the nine months ended September 30, 2017. North Sea crude oil production expense for the third quarter of 2018 increased 4% to $37.32 per bbl from $35.72 per bbl for the third quarter of 2017 and increased 6%from $35.12 per bbl in the second quarter of 2018. The increase in crude oil production expense for the three and nine months ended September 30, 2018 from the comparable periods in 2017 primarily reflected higher carbon tax costs in 2018, along with higher recoveries realized in the second quarter of 2017. The increase in production expense for the third quarter of 2018 from the second quarter of 2018 primarily reflected the timing of liftings from various fields that have different cost structures and higher fuel and carbon tax costs, partially offset by increased production. Production expense is also impacted by movements in the Canadian dollar.
Offshore Africa Crude oil production expense for the Baobab and Espoir fields in Côte d'Ivoire for the nine months ended September 30, 2018 was $14.05 per bbl, while total crude oil production expense for the Offshore Africa segment, including the Olowi field in Gabon, was $23.03 per bbl. Production expense for the third quarter of 2018 relating to Côte d'Ivoire was $13.94 per bbl, while total crude oil production expense for the Offshore Africa segment, including the Olowi field in Gabon, was $19.53 per bbl. Total Offshore Africa crude oil production expense for the three and nine months ended September 30, 2018 primarily reflected the timing of liftings from various fields, including the Olowi field, that have different cost structures, fluctuating production volumes on a relatively fixed cost base, planned maintenance activities, and fluctuations in the Canadian dollar.
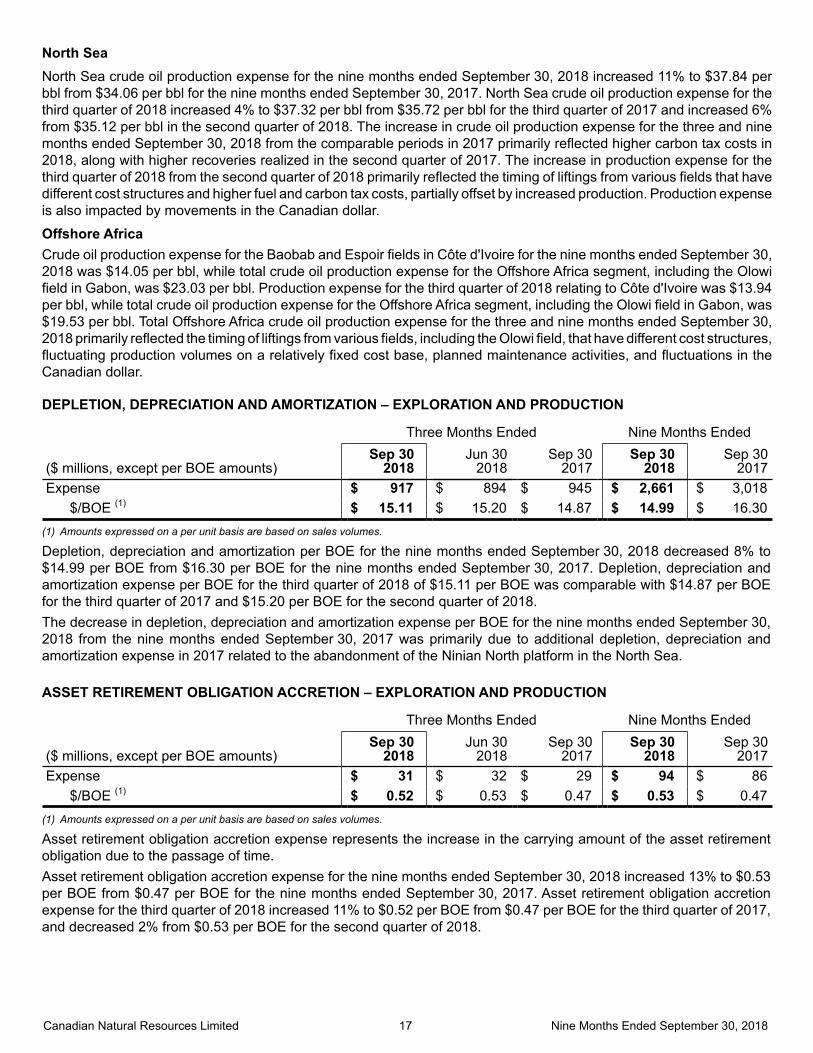
DEPLETION, DEPRECIATION AND AMORTIZATION – EXPLORATION AND PRODUCTION
Three Months Ended Nine Months Ended
($ millions, except per BOE amounts)Sep 30
2018Jun 30
2018Sep 30
2017Sep 30
2018Sep 30
2017Expense $ 917 $ 894 $ 945 $ 2,661 $ 3,018
$/BOE (1) $ 15.11 $ 15.20 $ 14.87 $ 14.99 $ 16.30(1) Amounts expressed on a per unit basis are based on sales volumes.
Depletion, depreciation and amortization per BOE for the nine months ended September 30, 2018 decreased 8% to $14.99 per BOE from $16.30 per BOE for the nine months ended September 30, 2017. Depletion, depreciation and amortization expense per BOE for the third quarter of 2018 of $15.11 per BOE was comparable with $14.87 per BOE for the third quarter of 2017 and $15.20 per BOE for the second quarter of 2018.The decrease in depletion, depreciation and amortization expense per BOE for the nine months ended September 30, 2018 from the nine months ended September 30, 2017 was primarily due to additional depletion, depreciation and amortization expense in 2017 related to the abandonment of the Ninian North platform in the North Sea.
ASSET RETIREMENT OBLIGATION ACCRETION – EXPLORATION AND PRODUCTION
Three Months Ended Nine Months Ended
($ millions, except per BOE amounts)Sep 30
2018Jun 30
2018Sep 30
2017Sep 30
2018Sep 30
2017Expense $ 31 $ 32 $ 29 $ 94 $ 86
$/BOE (1) $ 0.52 $ 0.53 $ 0.47 $ 0.53 $ 0.47(1) Amounts expressed on a per unit basis are based on sales volumes.
Asset retirement obligation accretion expense represents the increase in the carrying amount of the asset retirement obligation due to the passage of time.Asset retirement obligation accretion expense for the nine months ended September 30, 2018 increased 13% to $0.53 per BOE from $0.47 per BOE for the nine months ended September 30, 2017. Asset retirement obligation accretion expense for the third quarter of 2018 increased 11% to $0.52 per BOE from $0.47 per BOE for the third quarter of 2017, and decreased 2% from $0.53 per BOE for the second quarter of 2018.
Canadian Natural Resources Limited 18 Nine Months Ended September 30, 2018
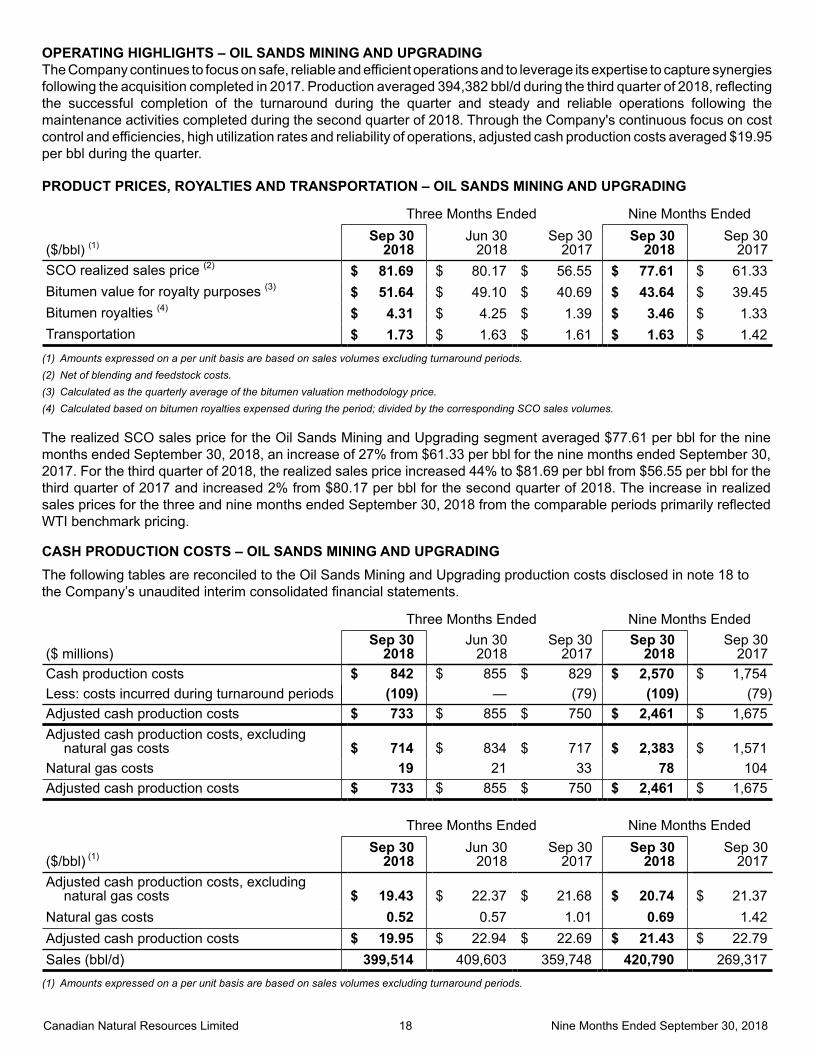
OPERATING HIGHLIGHTS – OIL SANDS MINING AND UPGRADINGThe Company continues to focus on safe, reliable and efficient operations and to leverage its expertise to capture synergies following the acquisition completed in 2017. Production averaged 394,382 bbl/d during the third quarter of 2018, reflecting the successful completion of the turnaround during the quarter and steady and reliable operations following the maintenance activities completed during the second quarter of 2018. Through the Company's continuous focus on cost control and efficiencies, high utilization rates and reliability of operations, adjusted cash production costs averaged $19.95per bbl during the quarter.
PRODUCT PRICES, ROYALTIES AND TRANSPORTATION – OIL SANDS MINING AND UPGRADING
Three Months Ended Nine Months Ended
($/bbl) (1)Sep 30
2018Jun 30
2018Sep 30
2017Sep 30
2018Sep 30
2017SCO realized sales price (2) $ 81.69 $ 80.17 $ 56.55 $ 77.61 $ 61.33Bitumen value for royalty purposes (3) $ 51.64 $ 49.10 $ 40.69 $ 43.64 $ 39.45Bitumen royalties (4) $ 4.31 $ 4.25 $ 1.39 $ 3.46 $ 1.33Transportation $ 1.73 $ 1.63 $ 1.61 $ 1.63 $ 1.42
(1) Amounts expressed on a per unit basis are based on sales volumes excluding turnaround periods.(2) Net of blending and feedstock costs.(3) Calculated as the quarterly average of the bitumen valuation methodology price.(4) Calculated based on bitumen royalties expensed during the period; divided by the corresponding SCO sales volumes.
The realized SCO sales price for the Oil Sands Mining and Upgrading segment averaged $77.61 per bbl for the nine months ended September 30, 2018, an increase of 27% from $61.33 per bbl for the nine months ended September 30, 2017. For the third quarter of 2018, the realized sales price increased 44% to $81.69 per bbl from $56.55 per bbl for the third quarter of 2017 and increased 2% from $80.17 per bbl for the second quarter of 2018. The increase in realized sales prices for the three and nine months ended September 30, 2018 from the comparable periods primarily reflected WTI benchmark pricing.
CASH PRODUCTION COSTS – OIL SANDS MINING AND UPGRADINGThe following tables are reconciled to the Oil Sands Mining and Upgrading production costs disclosed in note 18 to the Company’s unaudited interim consolidated financial statements.
Three Months Ended Nine Months Ended
($ millions)Sep 30
2018Jun 30
2018Sep 30
2017Sep 30
2018Sep 30
2017Cash production costs $ 842 $ 855 $ 829 $ 2,570 $ 1,754Less: costs incurred during turnaround periods (109) — (79) (109) (79)Adjusted cash production costs $ 733 $ 855 $ 750 $ 2,461 $ 1,675Adjusted cash production costs, excluding
natural gas costs $ 714 $ 834 $ 717 $ 2,383 $ 1,571Natural gas costs 19 21 33 78 104Adjusted cash production costs $ 733 $ 855 $ 750 $ 2,461 $ 1,675
Three Months Ended Nine Months Ended
($/bbl) (1)Sep 30
2018Jun 30
2018Sep 30
2017Sep 30
2018Sep 30
2017Adjusted cash production costs, excluding
natural gas costs $ 19.43 $ 22.37 $ 21.68 $ 20.74 $ 21.37Natural gas costs 0.52 0.57 1.01 0.69 1.42Adjusted cash production costs $ 19.95 $ 22.94 $ 22.69 $ 21.43 $ 22.79Sales (bbl/d) 399,514 409,603 359,748 420,790 269,317
(1) Amounts expressed on a per unit basis are based on sales volumes excluding turnaround periods.
Canadian Natural Resources Limited 19 Nine Months Ended September 30, 2018
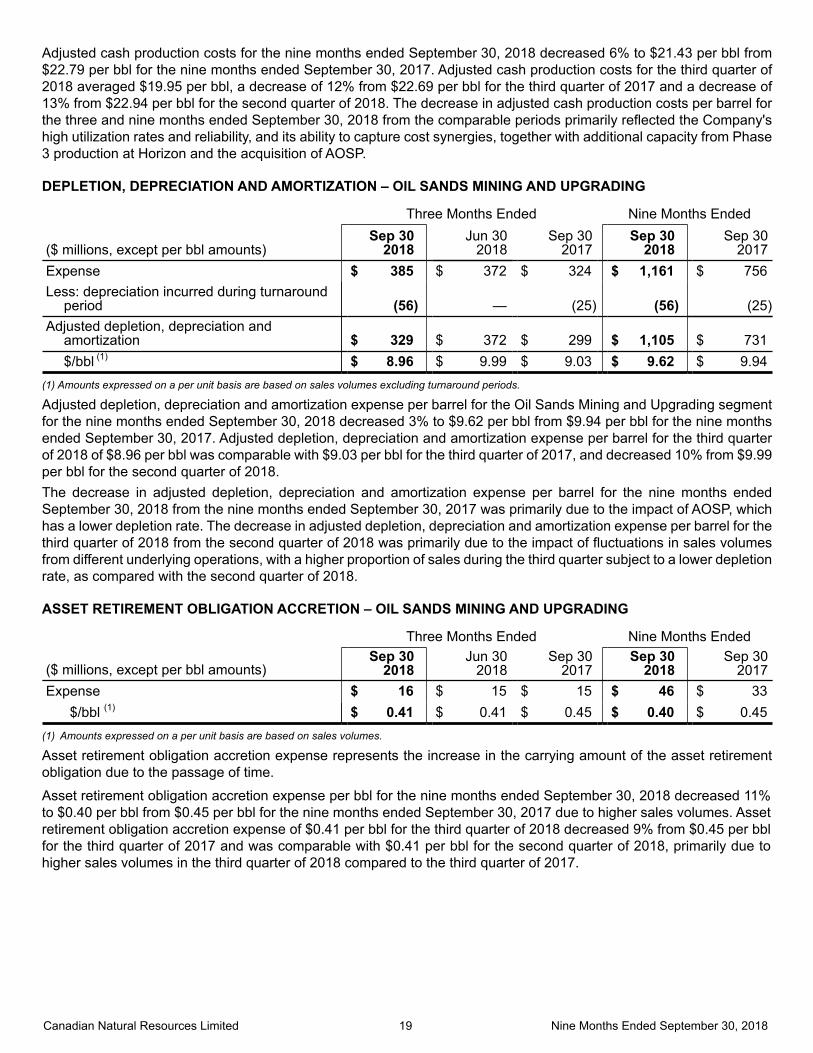
Adjusted cash production costs for the nine months ended September 30, 2018 decreased 6% to $21.43 per bbl from $22.79 per bbl for the nine months ended September 30, 2017. Adjusted cash production costs for the third quarter of 2018 averaged $19.95 per bbl, a decrease of 12% from $22.69 per bbl for the third quarter of 2017 and a decrease of 13% from $22.94 per bbl for the second quarter of 2018. The decrease in adjusted cash production costs per barrel for the three and nine months ended September 30, 2018 from the comparable periods primarily reflected the Company's high utilization rates and reliability, and its ability to capture cost synergies, together with additional capacity from Phase 3 production at Horizon and the acquisition of AOSP.
DEPLETION, DEPRECIATION AND AMORTIZATION – OIL SANDS MINING AND UPGRADING
Three Months Ended Nine Months Ended
($ millions, except per bbl amounts)Sep 30
2018Jun 30
2018Sep 30
2017Sep 30
2018Sep 30
2017Expense $ 385 $ 372 $ 324 $ 1,161 $ 756Less: depreciation incurred during turnaround
period (56) — (25) (56) (25)Adjusted depletion, depreciation and
amortization $ 329 $ 372 $ 299 $ 1,105 $ 731$/bbl (1) $ 8.96 $ 9.99 $ 9.03 $ 9.62 $ 9.94
(1) Amounts expressed on a per unit basis are based on sales volumes excluding turnaround periods.
Adjusted depletion, depreciation and amortization expense per barrel for the Oil Sands Mining and Upgrading segment for the nine months ended September 30, 2018 decreased 3% to $9.62 per bbl from $9.94 per bbl for the nine months ended September 30, 2017. Adjusted depletion, depreciation and amortization expense per barrel for the third quarterof 2018 of $8.96 per bbl was comparable with $9.03 per bbl for the third quarter of 2017, and decreased 10% from $9.99per bbl for the second quarter of 2018.The decrease in adjusted depletion, depreciation and amortization expense per barrel for the nine months endedSeptember 30, 2018 from the nine months ended September 30, 2017 was primarily due to the impact of AOSP, which has a lower depletion rate. The decrease in adjusted depletion, depreciation and amortization expense per barrel for the third quarter of 2018 from the second quarter of 2018 was primarily due to the impact of fluctuations in sales volumes from different underlying operations, with a higher proportion of sales during the third quarter subject to a lower depletion rate, as compared with the second quarter of 2018.
ASSET RETIREMENT OBLIGATION ACCRETION – OIL SANDS MINING AND UPGRADING
Three Months Ended Nine Months Ended
($ millions, except per bbl amounts)Sep 30
2018Jun 30
2018Sep 30
2017Sep 30
2018Sep 30
2017Expense $ 16 $ 15 $ 15 $ 46 $ 33
$/bbl (1) $ 0.41 $ 0.41 $ 0.45 $ 0.40 $ 0.45(1) Amounts expressed on a per unit basis are based on sales volumes.
Asset retirement obligation accretion expense represents the increase in the carrying amount of the asset retirement obligation due to the passage of time.
Asset retirement obligation accretion expense per bbl for the nine months ended September 30, 2018 decreased 11% to $0.40 per bbl from $0.45 per bbl for the nine months ended September 30, 2017 due to higher sales volumes. Asset retirement obligation accretion expense of $0.41 per bbl for the third quarter of 2018 decreased 9% from $0.45 per bbl for the third quarter of 2017 and was comparable with $0.41 per bbl for the second quarter of 2018, primarily due to higher sales volumes in the third quarter of 2018 compared to the third quarter of 2017.

Canadian Natural Resources Limited 20 Nine Months Ended September 30, 2018
MIDSTREAM
Three Months Ended Nine Months Ended
($ millions)Sep 30
2018Jun 30
2018Sep 30
2017Sep 30
2018Sep 30
2017Revenue $ 26 $ 25 $ 26 $ 78 $ 74Less:
Production expense 5 6 4 16 12Depreciation 4 4 2 11 6Equity loss (gain) on investment 2 2 (20) 5 (32)Gain on revaluation of properties (1) — — (114) — (114)
Segment earnings before taxes $ 15 $ 13 $ 154 $ 46 $ 202(1) During the third quarter of 2017, the Company recorded a pre-tax revaluation gain of $114 million ($83 million after-tax) related to a previously held joint
interest in a pipeline system.
The Company has a 50% interest in the Redwater Partnership. Redwater Partnership has entered into agreements to construct and operate a 50,000 barrel per day bitumen upgrader and refinery (the "Project") under processing agreements that target to process 12,500 barrels per day of bitumen feedstock for the Company and 37,500 barrels per day of bitumen feedstock for the Alberta Petroleum Marketing Commission (“APMC”), an agent of the Government of Alberta, under a 30 year fee-for-service tolling agreement.The facility capital cost ("FCC") budget for the Project is currently estimated to be $9,700 million. The Project is currently in the commissioning phase, with completion targeted for the first quarter of 2019. During 2013, the Company and APMC agreed, each with a 50% interest, to provide subordinated debt, bearing interest at prime plus 6%, as required for Project costs to reflect an agreed debt to equity ratio of 80/20. To September 30, 2018, each party has provided $439 million of subordinated debt, together with accrued interest thereon of $138 million, for a Company total of $577 million. Any additional subordinated debt financing is not expected to be significant.As per the processing agreements, on June 1, 2018 the Company began paying its 25% pro rata share of the debt portion of the monthly cost of service toll, which currently consists of interest and fees, with principal repayments beginning in 2020. The Company is unconditionally obligated to pay the service toll of the syndicated credit facility and bonds over the tolling period of 30 years.
As at September 30, 2018, Redwater Partnership had borrowings of $2,344 million under its secured $3,500 million syndicated credit facility. During the first quarter of 2018, Redwater Partnership extended $2,000 million of the $3,500 million revolving syndicated credit facility to June 2021. The remaining $1,500 million was extended on a fully drawn non-revolving basis maturing February 2020.
ADMINISTRATION EXPENSE
Three Months Ended Nine Months Ended
($ millions, except per BOE amounts)Sep 30
2018Jun 30
2018Sep 30
2017Sep 30
2018Sep 30
2017Expense $ 77 $ 76 $ 73 $ 234 $ 235
$/BOE (1) $ 0.79 $ 0.79 $ 0.75 $ 0.80 $ 0.91(1) Amounts expressed on a per unit basis are based on sales volumes.
Administration expense per BOE for the nine months ended September 30, 2018 decreased 12% to $0.80 per BOE from $0.91 per BOE for the nine months ended September 30, 2017. Administration expense for the third quarter of 2018 of $0.79 per BOE increased 5% from $0.75 per BOE for the third quarter of 2017 and was comparable with $0.79 per BOE for the second quarter of 2018. Administration expense per BOE decreased for the nine months ended September 30, 2018 from the nine months ended September 30, 2017 primarily due to higher sales volumes. The increase in the third quarter of 2018 from the third quarter of 2017 was primarily due to higher overhead recoveries realized in the third quarter of 2017.
Canadian Natural Resources Limited 21 Nine Months Ended September 30, 2018
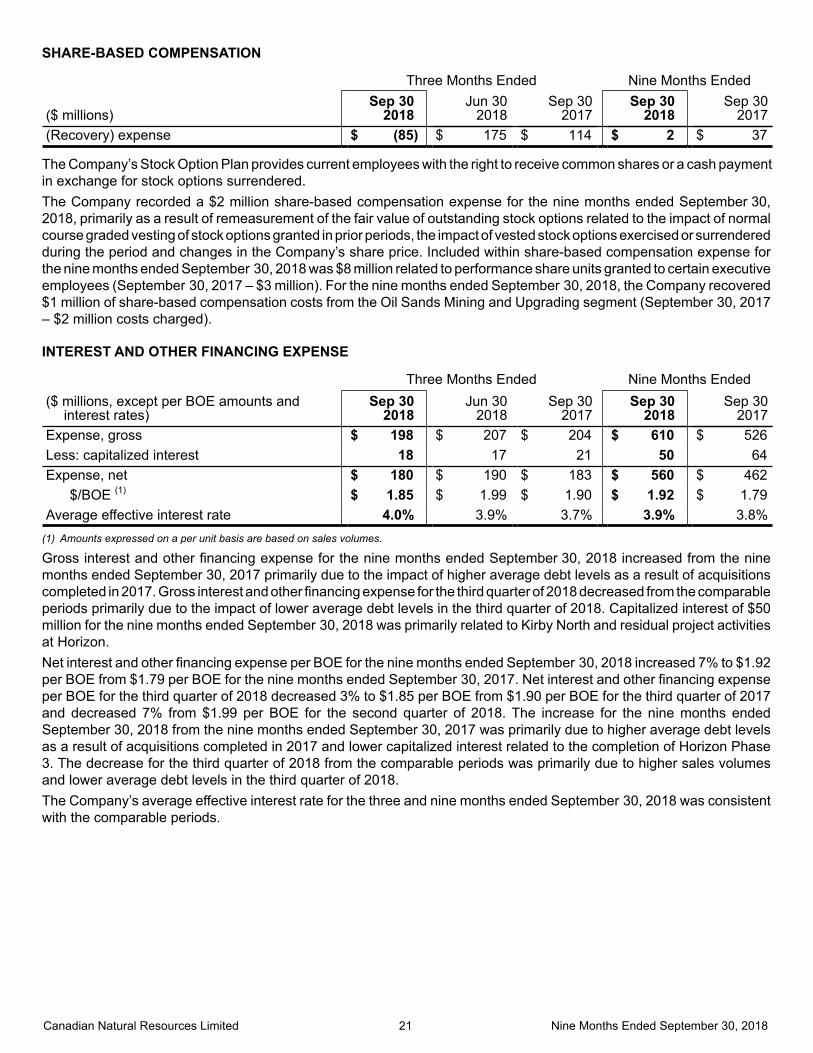
SHARE-BASED COMPENSATION
Three Months Ended Nine Months Ended
($ millions)Sep 30
2018Jun 30
2018Sep 30
2017Sep 30
2018Sep 30
2017(Recovery) expense $ (85) $ 175 $ 114 $ 2 $ 37
The Company’s Stock Option Plan provides current employees with the right to receive common shares or a cash payment in exchange for stock options surrendered.The Company recorded a $2 million share-based compensation expense for the nine months ended September 30, 2018, primarily as a result of remeasurement of the fair value of outstanding stock options related to the impact of normal course graded vesting of stock options granted in prior periods, the impact of vested stock options exercised or surrendered during the period and changes in the Company’s share price. Included within share-based compensation expense for the nine months ended September 30, 2018 was $8 million related to performance share units granted to certain executive employees (September 30, 2017 – $3 million). For the nine months ended September 30, 2018, the Company recovered $1 million of share-based compensation costs from the Oil Sands Mining and Upgrading segment (September 30, 2017 – $2 million costs charged).
INTEREST AND OTHER FINANCING EXPENSE
Three Months Ended Nine Months Ended($ millions, except per BOE amounts and
interest rates)Sep 30
2018Jun 30
2018Sep 30
2017Sep 30
2018Sep 30
2017Expense, gross $ 198 $ 207 $ 204 $ 610 $ 526Less: capitalized interest 18 17 21 50 64Expense, net $ 180 $ 190 $ 183 $ 560 $ 462
$/BOE (1) $ 1.85 $ 1.99 $ 1.90 $ 1.92 $ 1.79Average effective interest rate 4.0% 3.9% 3.7% 3.9% 3.8%
(1) Amounts expressed on a per unit basis are based on sales volumes.
Gross interest and other financing expense for the nine months ended September 30, 2018 increased from the nine months ended September 30, 2017 primarily due to the impact of higher average debt levels as a result of acquisitions completed in 2017. Gross interest and other financing expense for the third quarter of 2018 decreased from the comparable periods primarily due to the impact of lower average debt levels in the third quarter of 2018. Capitalized interest of $50 million for the nine months ended September 30, 2018 was primarily related to Kirby North and residual project activities at Horizon.Net interest and other financing expense per BOE for the nine months ended September 30, 2018 increased 7% to $1.92 per BOE from $1.79 per BOE for the nine months ended September 30, 2017. Net interest and other financing expense per BOE for the third quarter of 2018 decreased 3% to $1.85 per BOE from $1.90 per BOE for the third quarter of 2017 and decreased 7% from $1.99 per BOE for the second quarter of 2018. The increase for the nine months ended September 30, 2018 from the nine months ended September 30, 2017 was primarily due to higher average debt levels as a result of acquisitions completed in 2017 and lower capitalized interest related to the completion of Horizon Phase 3. The decrease for the third quarter of 2018 from the comparable periods was primarily due to higher sales volumes and lower average debt levels in the third quarter of 2018.The Company’s average effective interest rate for the three and nine months ended September 30, 2018 was consistent with the comparable periods.

Canadian Natural Resources Limited 22 Nine Months Ended September 30, 2018
RISK MANAGEMENT ACTIVITIESThe Company utilizes various derivative financial instruments to manage its commodity price, interest rate and foreign currency exposures. These derivative financial instruments are not intended for trading or speculative purposes.
Three Months Ended Nine Months Ended
($ millions)Sep 30
2018Jun 30
2018Sep 30
2017Sep 30
2018Sep 30
2017Crude oil and NGLs financial instruments $ — $ — $ (14) $ — $ (32)Natural gas financial instruments 6 (3) (4) 3 (5)Foreign currency contracts (14) (24) 114 (57) 108Realized (gain) loss (8) (27) 96 (54) 71
Crude oil and NGLs financial instruments (25) — 66 (25) (7)Natural gas financial instruments (14) 16 1 2 (8)Foreign currency contracts 18 (24) (59) (39) (23)Unrealized (gain) loss (21) (8) 8 (62) (38)Net (gain) loss $ (29) $ (35) $ 104 $ (116) $ 33
During the nine months ended September 30, 2018, net realized risk management gains were primarily related to the settlement of foreign currency contracts. The Company recorded a net unrealized gain of $62 million ($53 million after-tax) on its risk management activities for the nine months ended September 30, 2018, including an unrealized gain of $21 million ($11 million after-tax) for the third quarter of 2018 (June 30, 2018 – unrealized gain of $8 million, $11 million after-tax; September 30, 2017 – unrealized loss of $8 million, $6 million gain after-tax).Further details related to outstanding derivative financial instruments at September 30, 2018 are disclosed in note 16 to the Company’s unaudited interim consolidated financial statements.
FOREIGN EXCHANGE
Three Months Ended Nine Months Ended
($ millions)Sep 30
2018Jun 30
2018Sep 30
2017Sep 30
2018Sep 30
2017Net realized loss (gain) $ 14 $ (7) $ 37 $ 123 $ 49Net unrealized (gain) loss (182) 178 (404) 158 (819)Net (gain) loss (1) $ (168) $ 171 $ (367) $ 281 $ (770)
(1) Amounts are reported net of the hedging effect of cross currency swaps.
The net realized foreign exchange loss for the nine months ended September 30, 2018 was primarily due to foreign exchange rate fluctuations on settlement of working capital items denominated in US dollars or UK pounds sterling and the repayment of US$600 million of 1.75% notes and US$400 million of 5.90% notes. The net unrealized foreign exchange loss for the nine months ended September 30, 2018 was primarily related to the impact of the weakening Canadian dollar with respect to outstanding US dollar debt, partially offset by the reversal of the net unrealized foreign exchange loss on the repayment of US$600 million of 1.75% notes and US$400 million of 5.90% notes. The net unrealized (gain) loss for each of the periods presented included the impact of cross currency swaps (three months ended September 30, 2018– unrealized loss of $23 million, June 30, 2018 – unrealized gain of $25 million, September 30, 2017 – unrealized lossof $50 million; nine months ended September 30, 2018 – unrealized gain of $42 million, September 30, 2017 – unrealized loss of $281 million). The US/Canadian dollar exchange rate at September 30, 2018 was US$0.7738 (June 30, 2018 – US$0.7609, September 30, 2017 – US$0.7994).
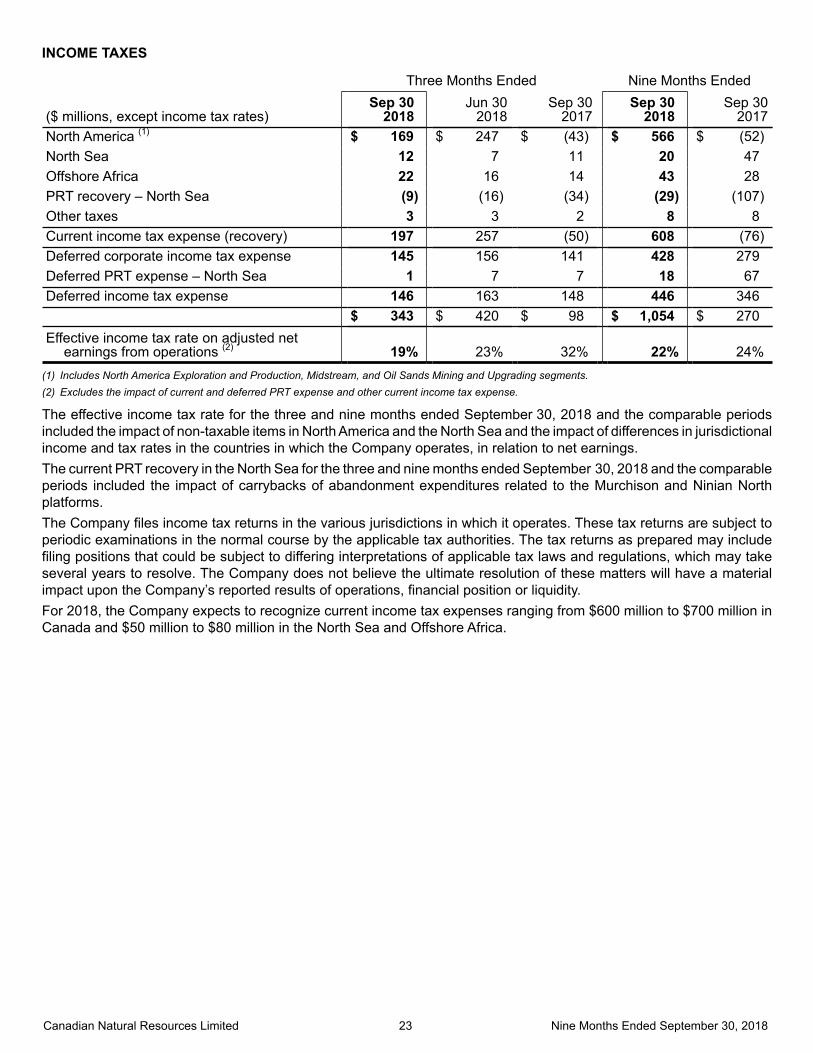
Canadian Natural Resources Limited 23 Nine Months Ended September 30, 2018
INCOME TAXES
Three Months Ended Nine Months Ended
($ millions, except income tax rates)Sep 30
2018Jun 30
2018Sep 30
2017Sep 30
2018Sep 30
2017North America (1) $ 169 $ 247 $ (43) $ 566 $ (52)North Sea 12 7 11 20 47Offshore Africa 22 16 14 43 28PRT recovery – North Sea (9) (16) (34) (29) (107)Other taxes 3 3 2 8 8Current income tax expense (recovery) 197 257 (50) 608 (76)Deferred corporate income tax expense 145 156 141 428 279Deferred PRT expense – North Sea 1 7 7 18 67Deferred income tax expense 146 163 148 446 346
$ 343 $ 420 $ 98 $ 1,054 $ 270Effective income tax rate on adjusted net
earnings from operations (2) 19% 23% 32% 22% 24%(1) Includes North America Exploration and Production, Midstream, and Oil Sands Mining and Upgrading segments.(2) Excludes the impact of current and deferred PRT expense and other current income tax expense.
The effective income tax rate for the three and nine months ended September 30, 2018 and the comparable periods included the impact of non-taxable items in North America and the North Sea and the impact of differences in jurisdictional income and tax rates in the countries in which the Company operates, in relation to net earnings.The current PRT recovery in the North Sea for the three and nine months ended September 30, 2018 and the comparable periods included the impact of carrybacks of abandonment expenditures related to the Murchison and Ninian North platforms.The Company files income tax returns in the various jurisdictions in which it operates. These tax returns are subject to periodic examinations in the normal course by the applicable tax authorities. The tax returns as prepared may include filing positions that could be subject to differing interpretations of applicable tax laws and regulations, which may take several years to resolve. The Company does not believe the ultimate resolution of these matters will have a material impact upon the Company’s reported results of operations, financial position or liquidity.For 2018, the Company expects to recognize current income tax expenses ranging from $600 million to $700 million in Canada and $50 million to $80 million in the North Sea and Offshore Africa.

Canadian Natural Resources Limited 24 Nine Months Ended September 30, 2018
NET CAPITAL EXPENDITURES (1)
Three Months Ended Nine Months Ended
($ millions)Sep 30
2018Jun 30
2018Sep 30
2017Sep 30
2018Sep 30
2017Exploration and EvaluationNet expenditures (2) (3) (4) $ 79 $ 8 $ 66 $ 143 $ 133Property, Plant and Equipment
Net property acquisitions (2) (3) (4) 5 (70) 820 97 1,200Well drilling, completion and equipping 416 350 241 1,087 789Production and related facilities 325 308 241 897 602Capitalized interest and other (5) 26 25 22 74 64Net expenditures 772 613 1,324 2,155 2,655Total Exploration and Production 851 621 1,390 2,298 2,788Oil Sands Mining and Upgrading
Project costs (6) 131 63 252 260 573Sustaining capital 173 152 195 430 347Turnaround costs 41 46 75 100 86Acquisitions of Exploration and Evaluation
assets (2) (4) 218 — — 218 219
Net property acquisitions (2) (4) — — — — 11,604Capitalized interest and other (5) (3) 30 33 22 50Total Oil Sands Mining and Upgrading 560 291 555 1,030 12,879Midstream 2 5 76 11 78
Abandonments (7) 57 50 65 197 211Head office 3 7 8 14 30Total net capital expenditures $ 1,473 $ 974 $ 2,094 $ 3,550 $ 15,986By segment
North America (2) (3) (4) $ 727 $ 568 $ 1,327 $ 2,067 $ 2,612North Sea (3) 35 3 32 73 108Offshore Africa 89 50 31 158 68Oil Sands Mining and Upgrading (4) 560 291 555 1,030 12,879Midstream 2 5 76 11 78Abandonments (7) 57 50 65 197 211Head office 3 7 8 14 30Total $ 1,473 $ 974 $ 2,094 $ 3,550 $ 15,986
(1) Net capital expenditures exclude fair value and revaluation adjustments, and include non-cash transfers of property, plant and equipment to inventory due to change in use.
(2) Includes business combinations.(3) Includes proceeds from the acquisition and disposition of properties.(4) In the second quarter of 2017, total purchase consideration for the acquisition of AOSP of $12,157 million included $26 million of exploration and evaluation
assets and $308 million of property, plant and equipment within the North America segment, and $219 million of exploration and evaluation assets and $11,604 million of property, plant and equipment within the Oil Sands Mining and Upgrading segment.
(5) Capitalized interest and other includes expenditures related to land acquisition and retention, seismic, and other adjustments.(6) Includes Horizon Phase 2/3 construction costs.(7) Abandonments represent expenditures to settle asset retirement obligations and have been reflected as capital expenditures in this table.
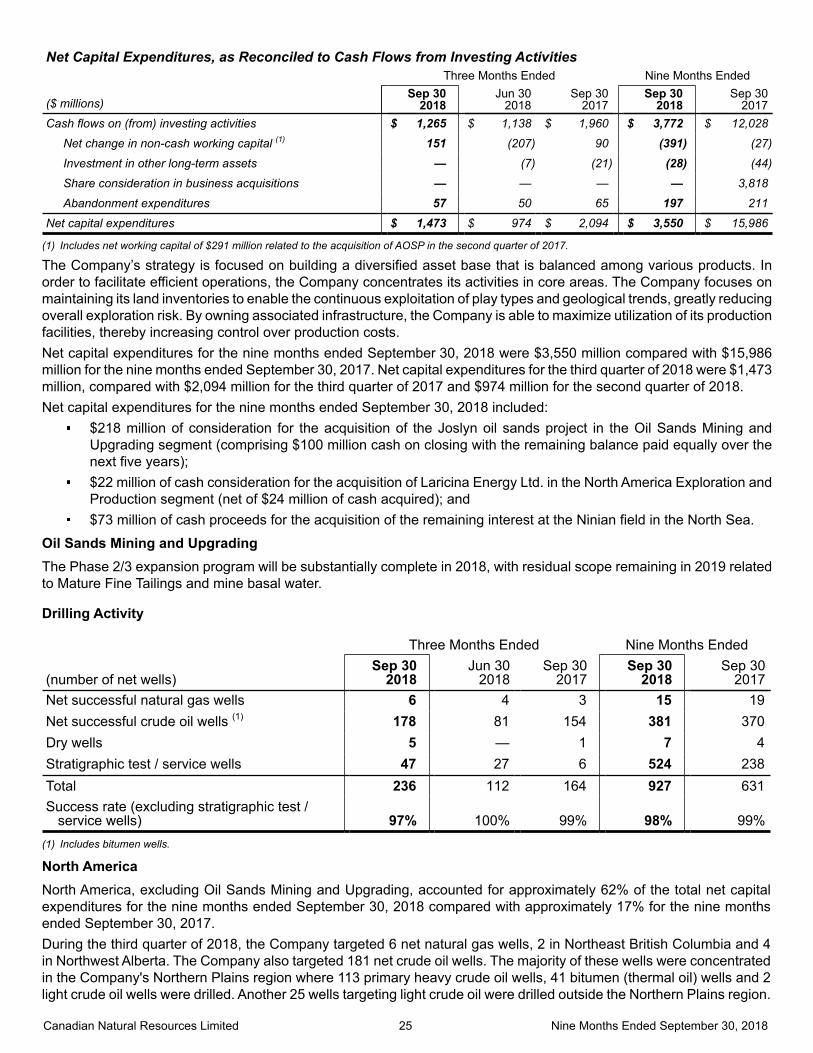
Canadian Natural Resources Limited 25 Nine Months Ended September 30, 2018
Net Capital Expenditures, as Reconciled to Cash Flows from Investing ActivitiesThree Months Ended Nine Months Ended
($ millions)Sep 30
2018Jun 30
2018Sep 30
2017Sep 30
2018Sep 30
2017Cash flows on (from) investing activities $ 1,265 $ 1,138 $ 1,960 $ 3,772 $ 12,028
Net change in non-cash working capital (1) 151 (207) 90 (391) (27)
Investment in other long-term assets — (7) (21) (28) (44)
Share consideration in business acquisitions — — — — 3,818
Abandonment expenditures 57 50 65 197 211
Net capital expenditures $ 1,473 $ 974 $ 2,094 $ 3,550 $ 15,986
(1) Includes net working capital of $291 million related to the acquisition of AOSP in the second quarter of 2017.
The Company’s strategy is focused on building a diversified asset base that is balanced among various products. In order to facilitate efficient operations, the Company concentrates its activities in core areas. The Company focuses on maintaining its land inventories to enable the continuous exploitation of play types and geological trends, greatly reducing overall exploration risk. By owning associated infrastructure, the Company is able to maximize utilization of its production facilities, thereby increasing control over production costs.Net capital expenditures for the nine months ended September 30, 2018 were $3,550 million compared with $15,986 million for the nine months ended September 30, 2017. Net capital expenditures for the third quarter of 2018 were $1,473 million, compared with $2,094 million for the third quarter of 2017 and $974 million for the second quarter of 2018. Net capital expenditures for the nine months ended September 30, 2018 included:
$218 million of consideration for the acquisition of the Joslyn oil sands project in the Oil Sands Mining and Upgrading segment (comprising $100 million cash on closing with the remaining balance paid equally over the next five years);
$22 million of cash consideration for the acquisition of Laricina Energy Ltd. in the North America Exploration and Production segment (net of $24 million of cash acquired); and
$73 million of cash proceeds for the acquisition of the remaining interest at the Ninian field in the North Sea.
Oil Sands Mining and UpgradingThe Phase 2/3 expansion program will be substantially complete in 2018, with residual scope remaining in 2019 related to Mature Fine Tailings and mine basal water.
Drilling Activity
Three Months Ended Nine Months Ended
(number of net wells)Sep 30
2018Jun 30
2018Sep 30
2017Sep 30
2018Sep 30
2017Net successful natural gas wells 6 4 3 15 19Net successful crude oil wells (1) 178 81 154 381 370Dry wells 5 — 1 7 4Stratigraphic test / service wells 47 27 6 524 238Total 236 112 164 927 631Success rate (excluding stratigraphic test /
service wells) 97% 100% 99% 98% 99%(1) Includes bitumen wells.
North AmericaNorth America, excluding Oil Sands Mining and Upgrading, accounted for approximately 62% of the total net capital expenditures for the nine months ended September 30, 2018 compared with approximately 17% for the nine months ended September 30, 2017.During the third quarter of 2018, the Company targeted 6 net natural gas wells, 2 in Northeast British Columbia and 4 in Northwest Alberta. The Company also targeted 181 net crude oil wells. The majority of these wells were concentrated in the Company's Northern Plains region where 113 primary heavy crude oil wells, 41 bitumen (thermal oil) wells and 2 light crude oil wells were drilled. Another 25 wells targeting light crude oil were drilled outside the Northern Plains region.
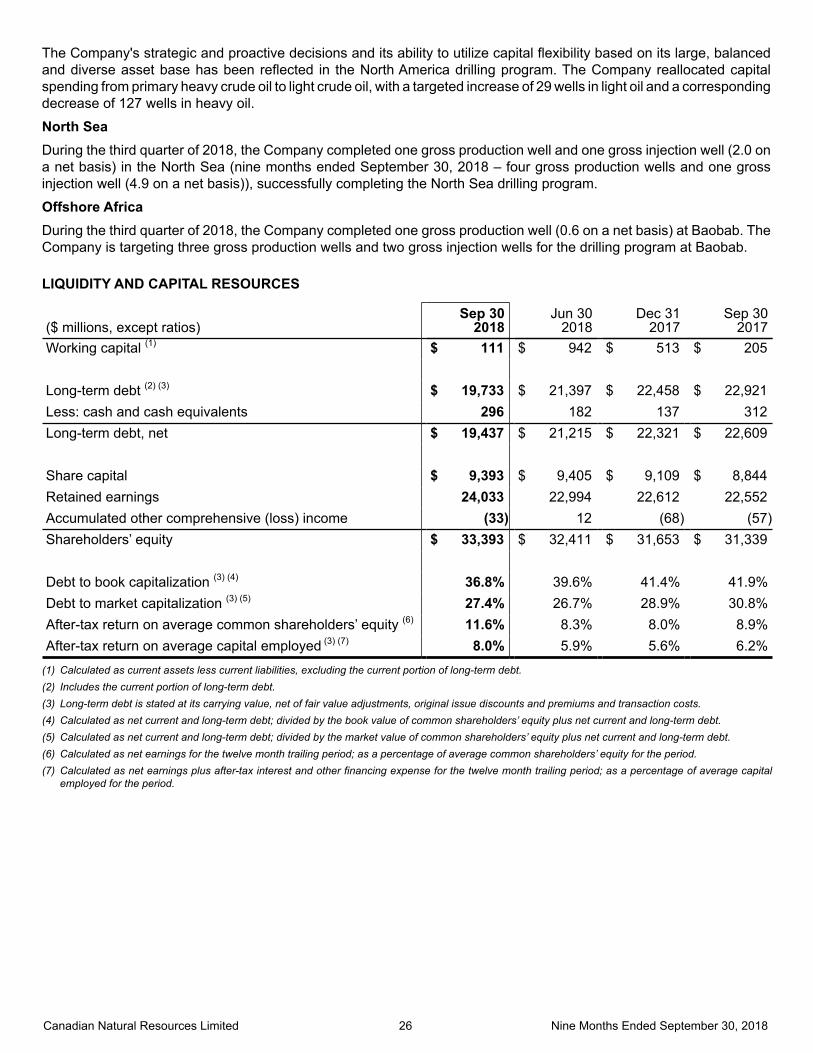
Canadian Natural Resources Limited 26 Nine Months Ended September 30, 2018
The Company's strategic and proactive decisions and its ability to utilize capital flexibility based on its large, balanced and diverse asset base has been reflected in the North America drilling program. The Company reallocated capital spending from primary heavy crude oil to light crude oil, with a targeted increase of 29 wells in light oil and a corresponding decrease of 127 wells in heavy oil.
North SeaDuring the third quarter of 2018, the Company completed one gross production well and one gross injection well (2.0 on a net basis) in the North Sea (nine months ended September 30, 2018 – four gross production wells and one gross injection well (4.9 on a net basis)), successfully completing the North Sea drilling program.
Offshore Africa During the third quarter of 2018, the Company completed one gross production well (0.6 on a net basis) at Baobab. The Company is targeting three gross production wells and two gross injection wells for the drilling program at Baobab.
LIQUIDITY AND CAPITAL RESOURCES
($ millions, except ratios)Sep 30
2018Jun 30
2018Dec 31
2017Sep 30
2017Working capital (1) $ 111 $ 942 $ 513 $ 205
Long-term debt (2) (3) $ 19,733 $ 21,397 $ 22,458 $ 22,921Less: cash and cash equivalents 296 182 137 312Long-term debt, net $ 19,437 $ 21,215 $ 22,321 $ 22,609
Share capital $ 9,393 $ 9,405 $ 9,109 $ 8,844Retained earnings 24,033 22,994 22,612 22,552Accumulated other comprehensive (loss) income (33) 12 (68) (57)Shareholders’ equity $ 33,393 $ 32,411 $ 31,653 $ 31,339
Debt to book capitalization (3) (4) 36.8% 39.6% 41.4% 41.9%Debt to market capitalization (3) (5) 27.4% 26.7% 28.9% 30.8%After-tax return on average common shareholders’ equity (6) 11.6% 8.3% 8.0% 8.9%After-tax return on average capital employed (3) (7) 8.0% 5.9% 5.6% 6.2%
(1) Calculated as current assets less current liabilities, excluding the current portion of long-term debt.(2) Includes the current portion of long-term debt.(3) Long-term debt is stated at its carrying value, net of fair value adjustments, original issue discounts and premiums and transaction costs.(4) Calculated as net current and long-term debt; divided by the book value of common shareholders’ equity plus net current and long-term debt.(5) Calculated as net current and long-term debt; divided by the market value of common shareholders’ equity plus net current and long-term debt.(6) Calculated as net earnings for the twelve month trailing period; as a percentage of average common shareholders’ equity for the period.(7) Calculated as net earnings plus after-tax interest and other financing expense for the twelve month trailing period; as a percentage of average capital
employed for the period.
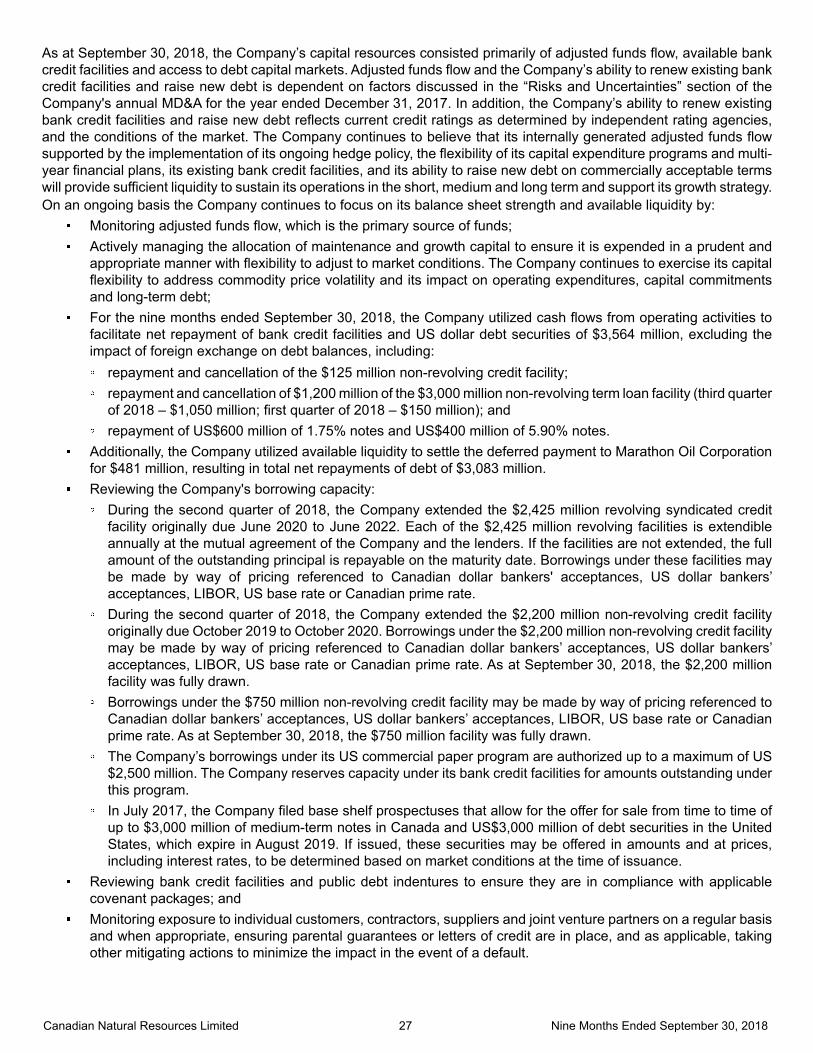
Canadian Natural Resources Limited 27 Nine Months Ended September 30, 2018
As at September 30, 2018, the Company’s capital resources consisted primarily of adjusted funds flow, available bank credit facilities and access to debt capital markets. Adjusted funds flow and the Company’s ability to renew existing bank credit facilities and raise new debt is dependent on factors discussed in the “Risks and Uncertainties” section of the Company's annual MD&A for the year ended December 31, 2017. In addition, the Company’s ability to renew existing bank credit facilities and raise new debt reflects current credit ratings as determined by independent rating agencies, and the conditions of the market. The Company continues to believe that its internally generated adjusted funds flow supported by the implementation of its ongoing hedge policy, the flexibility of its capital expenditure programs and multi-year financial plans, its existing bank credit facilities, and its ability to raise new debt on commercially acceptable terms will provide sufficient liquidity to sustain its operations in the short, medium and long term and support its growth strategy.On an ongoing basis the Company continues to focus on its balance sheet strength and available liquidity by:
Monitoring adjusted funds flow, which is the primary source of funds; Actively managing the allocation of maintenance and growth capital to ensure it is expended in a prudent and
appropriate manner with flexibility to adjust to market conditions. The Company continues to exercise its capital flexibility to address commodity price volatility and its impact on operating expenditures, capital commitments and long-term debt;
For the nine months ended September 30, 2018, the Company utilized cash flows from operating activities to facilitate net repayment of bank credit facilities and US dollar debt securities of $3,564 million, excluding the impact of foreign exchange on debt balances, including: repayment and cancellation of the $125 million non-revolving credit facility; repayment and cancellation of $1,200 million of the $3,000 million non-revolving term loan facility (third quarter
of 2018 – $1,050 million; first quarter of 2018 – $150 million); and repayment of US$600 million of 1.75% notes and US$400 million of 5.90% notes.
Additionally, the Company utilized available liquidity to settle the deferred payment to Marathon Oil Corporation for $481 million, resulting in total net repayments of debt of $3,083 million.
Reviewing the Company's borrowing capacity: During the second quarter of 2018, the Company extended the $2,425 million revolving syndicated credit
facility originally due June 2020 to June 2022. Each of the $2,425 million revolving facilities is extendible annually at the mutual agreement of the Company and the lenders. If the facilities are not extended, the full amount of the outstanding principal is repayable on the maturity date. Borrowings under these facilities may be made by way of pricing referenced to Canadian dollar bankers' acceptances, US dollar bankers’ acceptances, LIBOR, US base rate or Canadian prime rate.
During the second quarter of 2018, the Company extended the $2,200 million non-revolving credit facility originally due October 2019 to October 2020. Borrowings under the $2,200 million non-revolving credit facility may be made by way of pricing referenced to Canadian dollar bankers’ acceptances, US dollar bankers’ acceptances, LIBOR, US base rate or Canadian prime rate. As at September 30, 2018, the $2,200 million facility was fully drawn.
Borrowings under the $750 million non-revolving credit facility may be made by way of pricing referenced to Canadian dollar bankers’ acceptances, US dollar bankers’ acceptances, LIBOR, US base rate or Canadian prime rate. As at September 30, 2018, the $750 million facility was fully drawn.
The Company’s borrowings under its US commercial paper program are authorized up to a maximum of US$2,500 million. The Company reserves capacity under its bank credit facilities for amounts outstanding under this program.
In July 2017, the Company filed base shelf prospectuses that allow for the offer for sale from time to time of up to $3,000 million of medium-term notes in Canada and US$3,000 million of debt securities in the United States, which expire in August 2019. If issued, these securities may be offered in amounts and at prices, including interest rates, to be determined based on market conditions at the time of issuance.
Reviewing bank credit facilities and public debt indentures to ensure they are in compliance with applicable covenant packages; and
Monitoring exposure to individual customers, contractors, suppliers and joint venture partners on a regular basis and when appropriate, ensuring parental guarantees or letters of credit are in place, and as applicable, taking other mitigating actions to minimize the impact in the event of a default.
Canadian Natural Resources Limited 28 Nine Months Ended September 30, 2018
As at September 30, 2018, the Company had in place revolving bank credit facilities of $4,975 million which were undrawn and available for use. Additionally, the Company had in place fully drawn term credit facilities of $4,750 million. Including cash and cash equivalents and other liquidity, the Company had approximately $5,350 million in available liquidity. This excludes certain other dedicated credit facilities supporting letters of credit.As at September 30, 2018, the Company had total US dollar denominated debt with a carrying amount of $13,715 million(US$10,615 million), before transaction costs and original issue discounts. This included $5,185 million (US$4,015 million) hedged by way of cross currency swaps (US$1,050 million) and foreign currency forwards (US$2,965 million). The fixed repayment amount of these hedging instruments is $5,010 million, resulting in a notional reduction of the carrying amount of the Company’s US dollar denominated debt by approximately $174 million to $13,541 million as at September 30, 2018.Net long-term debt was $19,437 million at September 30, 2018, resulting in a debt to book capitalization ratio of 36.8%(December 31, 2017 – 41.4%); this ratio is within the 25% to 45% internal range utilized by management. This range may be exceeded in periods when a combination of capital projects, acquisitions, or lower commodity prices occurs. The Company may be below the low end of the targeted range when adjusted funds flow is greater than current investment activities. The Company remains committed to maintaining a strong balance sheet, adequate available liquidity and a flexible capital structure.Further details related to the Company’s long-term debt at September 30, 2018 are discussed in note 9 of the Company’s unaudited interim consolidated financial statements.The Company is subject to a financial covenant that requires debt to book capitalization as defined in its credit facility agreements to not exceed 65%. At September 30, 2018, the Company was in compliance with this covenant.The Company periodically utilizes commodity derivative financial instruments under its commodity hedge policy to reduce the risk of volatility in commodity prices and to support the Company’s cash flow for its capital expenditure programs. This policy currently allows for the hedging of up to 60% of the near 12 months budgeted production and up to 40% of the following 13 to 24 months estimated production. For the purpose of this policy, the purchase of put options is in addition to the above parameters. At September 30, 2018, 300,000 GJ/d of currently forecasted natural gas volumes were hedged using AECO swaps for October 2018. Additionally, at September 30, 2018, 15,000 bbl/d of currently forecasted crude oil volumes were hedged using WCS differential swaps for October to December 2018 and an additional 8,000 bbl/d were hedged for January to September 2019. Further details related to the Company’s commodity derivative financial instruments outstanding at September 30, 2018 are discussed in note 16 of the Company’s unaudited interim consolidated financial statements.
Share CapitalAs at September 30, 2018, there were 1,212,340,000 common shares outstanding (December 31, 2017 – 1,222,769,000common shares) and 46,826,000 stock options outstanding. As at October 30, 2018, the Company had 1,205,777,000 common shares outstanding and 46,615,000 stock options outstanding.On February 28, 2018, the Board of Directors approved an increase in the quarterly dividend to $0.335 per common share, beginning with the dividend payable on April 1, 2018 (previous quarterly dividend rate of $0.275 per common share). The dividend policy undergoes periodic review by the Board of Directors and is subject to change.On May 16, 2018, the Company's application was approved for a Normal Course Issuer Bid to purchase through the facilities of the Toronto Stock Exchange, alternative Canadian trading platforms, and the New York Stock Exchange, up to 61,454,856 common shares, over a 12-month period commencing May 23, 2018 and ending May 22, 2019. The Company's Normal Course Issuer Bid announced in March 2017 expired on May 22, 2018.For the nine months ended September 30, 2018, the Company purchased for cancellation 20,012,727 common shares at a weighted average price of $43.66 per common share for a total cost of $874 million. Retained earnings were reduced by $720 million, representing the excess of the purchase price of common shares over their average carrying value. Subsequent to September 30, 2018, the Company purchased 6,900,000 common shares at a weighted average price of $38.66 per common share for a total cost of $267 million.

Canadian Natural Resources Limited 29 Nine Months Ended September 30, 2018
COMMITMENTS AND CONTINGENCIESIn the normal course of business, the Company has entered into various commitments that will have an impact on the Company’s future operations. The following table summarizes the Company’s commitments as at September 30, 2018:
($ millions)Remaining
2018 2019 2020 2021 2022 ThereafterProduct transportation and pipeline $ 169 $ 644 $ 611 $ 585 $ 500 $ 4,250North West Redwater Partnership debt
service toll (1) $ 24 $ 79 $ 126 $ 157 $ 158 $ 3,015Offshore equipment operating leases $ 55 $ 111 $ 69 $ 72 $ 7 $ —Long-term debt (2) $ — $ 1,000 $ 5,826 $ 1,392 $ 1,000 $ 10,640Interest and other financing expense (3) $ 181 $ 787 $ 712 $ 579 $ 531 $ 5,544Office leases $ 11 $ 43 $ 43 $ 40 $ 31 $ 121Other $ 37 $ 48 $ 39 $ 36 $ 35 $ 362
(1) As per the processing agreements, on June 1, 2018 the Company began paying its 25% pro rata share of the debt portion of the monthly cost of service toll, which currently consists of interest and fees, with principal repayments beginning in 2020. Included in the service toll is $1,318 million of interest payable over the 30 year tolling period.
(2) Long-term debt represents principal repayments only and does not reflect original issue discounts and premiums or transaction costs.(3) Interest and other financing payments were estimated based upon applicable interest and foreign exchange rates as at September 30, 2018.
In addition to the commitments disclosed above, the Company has entered into various agreements related to the engineering, procurement and construction of its various development projects. These contracts can be cancelled by the Company upon notice without penalty, subject to the costs incurred up to and in respect of the cancellation.
LEGAL PROCEEDINGS AND OTHER CONTINGENCIESThe Company is defendant and plaintiff in a number of legal actions arising in the normal course of business. In addition, the Company is subject to certain contractor construction claims. The Company believes that any liabilities that might arise pertaining to any such matters would not have a material effect on its consolidated financial position.
CHANGES IN ACCOUNTING POLICIESFor the impact of new accounting standards, refer to the audited consolidated financial statements for the year ended December 31, 2017 and the unaudited interim consolidated financial statements for the three and nine months ended September 30, 2018.
ACCOUNTING POLICIES ISSUED BUT NOT YET APPLIEDIn January 2016, the IASB issued IFRS 16 “Leases”, which provides guidance on accounting for leases. The new standard replaces IAS 17 “Leases” and related interpretations. IFRS 16 eliminates the distinction between operating leases and financing leases for lessees and requires the recognition of right-of-use assets and lease liabilities on the balance sheet. The Company will elect to apply the exemptions for mineral leases and for certain short-term leases and leases of low-value assets. These leases will not be required to be recognized on the balance sheet.
The new standard is effective January 1, 2019 and is required to be applied retrospectively, with a policy alternative of restating comparative prior periods or recognizing the cumulative adjustment in opening retained earnings at the date of adoption. The Company plans to adopt IFRS 16 on January 1, 2019 using the retrospective with cumulative effect method. The Company is in the process of reviewing its various arrangements, developing business and accounting processes, and making applicable changes to the Company's internal controls as a result of the new standard.
While the Company has not completed its quantitative analysis of the impacts of IFRS 16, the Company expects material increases in the assets and liabilities reported on the balance sheet. In addition, the Company expects the statement of earnings to be impacted for the amortization of right-of-use assets, interest expense, and lease recoveries from partners, with corresponding decreases in operating, transportation and administrative expenses. Under the new standard, cash outflows for repayment of the principal portion of the lease liability will be classified as cash flows from financing activities. The interest portion of the lease payments will continue to be classified as cash flows from operating activities.

Canadian Natural Resources Limited 30 Nine Months Ended September 30, 2018
CRITICAL ACCOUNTING POLICIES AND ESTIMATES The preparation of financial statements requires the Company to make estimates, assumptions and judgements in the application of IFRS that have a significant impact on the financial results of the Company. Actual results could differ from estimated amounts, and those differences may be material. A comprehensive discussion of the Company's significant accounting estimates is contained in the annual MD&A and the audited consolidated financial statements for the year ended December 31, 2017.