Item 2. Management’s Discussion and Analysis of Financial...
13
20 Item 2. Management’s Discussion and Analysis of Financial Condition and Results of Operations The following discussion of our results of operations and financial condition should be read together with our unaudited consolidated financial statements for the three and nine months ended April 30, 2015 and 2014, including the notes thereto, which appear elsewhere in this quarterly report on Form 10-Q. All amounts are in thousands, except per share data. This discussion, including, without limitation, the section entitled “Summary of Operating Results”, contains forward-looking statements regarding future events and our future results that are subject to the safe harbors created under the Securities Act of 1933 (the “Securities Act”) and the Securities Exchange Act of 1934 (the “Exchange Act”). All statements other than statements of historical facts are statements that could be deemed to be forward-looking statements. These statements are based on current expectations, estimates, forecasts, and projections about the markets in which we operate and the beliefs and assumptions of our management. Words such as “expects,” “anticipates,” “targets,” “goals,” “projects,” “intends,” “plans,” “believes,” “seeks,” “estimates,” “endeavors,” “strives,” “may,” variations of such words, and similar expressions are intended to identify such forward-looking statements. In addition, any statements that refer to projections of our future financial performance, our anticipated growth and trends in our businesses, and other characterizations of future events or circumstances are forward-looking statements. Readers are cautioned that these forward-looking statements are only predictions and are subject to risks, uncertainties, and assumptions that are difficult to predict, estimate, or verify, including those identified in Part I, Item 1A of our annual report on Form 10-K for the year ended July 31, 2014, and elsewhere herein. Therefore, actual results may differ materially and adversely from those expressed in any forward-looking statements. We undertake no obligation to revise or update any forward-looking statements for any reason. Overview ARI Network Services, Inc. offers an award-winning suite of data-driven software tools and marketing services to help dealers, equipment manufacturers and distributors in selected vertical markets Sell More Stuff!™ – online and in-store. Our innovative products are powered by a proprietary data repository of enriched original equipment and aftermarket electronic content spanning more than 17 million active part and accessory SKUs and 750,000 equipment models. Business is complicated, but we believe our customers’ technology tools don’t have to be. We remove the complexity of selling and servicing new and used vehicle inventory, parts, garments and accessories (“PG&A”) for customers in the automotive tire and wheel aftermarket (“ATW”), powersports, outdoor power equipment (“OPE”), marine, home medical equipment (“HME”), recreational vehicles (“RV”) and appliance industries. More than 23,500 equipment dealers, 195 distributors and 3,360 brands worldwide leverage our web and eCatalog platforms to Sell More Stuff!™ Our Solutions Our SaaS, DaaS and other solutions, designed to help our customers sell more stuff, both in-store and online, include: (i) eCommerce-enabled websites, which provide a web presence for dealers and serve as a platform for driving leads and eCommerce sales; (ii) eCatalog content, which drives sales of inventory and PG&A both online and within the dealership; (iii) fully integrated business management software for the ATW market; (iv) lead management software designed to increase sales for dealers through more efficient management and improved closure of leads; and (v) digital marketing solutions designed to generate leads and drive traffic both on-line and in store for our dealer customers. Our solutions also improve our customers’ overall customer satisfaction through a highly efficient and accurate data lookup experience at the parts counter and a quicker response time to online inquiries, both of which serve to significantly improve a customer’s overall experience with the dealer. Our SaaS, DaaS and other solutions are sold through our internal sales force and are composed primarily of annual recurring license and subscriptions and, in the case of business management software, perpetual license and maintenance contracts. Customers typically sign annual, auto-renewing contracts. Today, approximately 90% of our revenues are recurring. In addition to our award-winning SaaS and DaaS solutions, ARI offers a suite of complementary products and services designed to supplement our primary offerings in order to help our customers Sell More Stuff!™ Web Platform Solutions Our eCommerce-enabled website solutions provide consumers with information about a dealership and its product lines through our extensive library of electronic catalog content and allow consumers to obtain information on whole goods and purchase PG&A via the dealers’ website 24 hours a day, 7 days a week. Our website solutions are tailored to each of the vertical markets we serve and are tightly integrated with our electronic library of inventory and PG&A content. We also offer a mobile solution that allows dealers’ websites to be fully functional on smart mobile phones.
-
Upload
vuongtuyen -
Category
Documents
-
view
227 -
download
0
Transcript of Item 2. Management’s Discussion and Analysis of Financial...
20
Item 2. Management’s Discussion and Analysis of Financial Condition and Results of Operations The following discussion of our results of operations and financial condition should be read together with our unaudited consolidated financial statements for the three and nine months ended April 30, 2015 and 2014, including the notes thereto, which appear elsewhere in this quarterly report on Form 10-Q. All amounts are in thousands, except per share data. This discussion, including, without limitation, the section entitled “Summary of Operating Results”, contains forward-looking statements regarding future events and our future results that are subject to the safe harbors created under the Securities Act of 1933 (the “Securities Act”) and the Securities Exchange Act of 1934 (the “Exchange Act”). All statements other than statements of historical facts are statements that could be deemed to be forward-looking statements. These statements are based on current expectations, estimates, forecasts, and projections about the markets in which we operate and the beliefs and assumptions of our management. Words such as “expects,” “anticipates,” “targets,” “goals,” “projects,” “intends,” “plans,” “believes,” “seeks,” “estimates,” “endeavors,” “strives,” “may,” variations of such words, and similar expressions are intended to identify such forward-looking statements. In addition, any statements that refer to projections of our future financial performance, our anticipated growth and trends in our businesses, and other characterizations of future events or circumstances are forward-looking statements. Readers are cautioned that these forward-looking statements are only predictions and are subject to risks, uncertainties, and assumptions that are difficult to predict, estimate, or verify, including those identified in Part I, Item 1A of our annual report on Form 10-K for the year ended July 31, 2014, and elsewhere herein. Therefore, actual results may differ materially and adversely from those expressed in any forward-looking statements. We undertake no obligation to revise or update any forward-looking statements for any reason. Overview
ARI Network Services, Inc. offers an award-winning suite of data-driven software tools and marketing services to help dealers, equipment manufacturers and distributors in selected vertical markets Sell More Stuff!™ – online and in-store. Our innovative products are powered by a proprietary data repository of enriched original equipment and aftermarket electronic content spanning more than 17 million active part and accessory SKUs and 750,000 equipment models. Business is complicated, but we believe our customers’ technology tools don’t have to be. We remove the complexity of selling and servicing new and used vehicle inventory, parts, garments and accessories (“PG&A”) for customers in the automotive tire and wheel aftermarket (“ATW”), powersports, outdoor power equipment (“OPE”), marine, home medical equipment (“HME”), recreational vehicles (“RV”) and appliance industries. More than 23,500 equipment dealers, 195 distributors and 3,360 brands worldwide leverage our web and eCatalog platforms to Sell More Stuff!™ Our Solutions Our SaaS, DaaS and other solutions, designed to help our customers sell more stuff, both in-store and online, include: (i) eCommerce-enabled websites, which provide a web presence for dealers and serve as a platform for driving leads and eCommerce sales; (ii) eCatalog content, which drives sales of inventory and PG&A both online and within the dealership; (iii) fully integrated business management software for the ATW market; (iv) lead management software designed to increase sales for dealers through more efficient management and improved closure of leads; and (v) digital marketing solutions designed to generate leads and drive traffic both on-line and in store for our dealer customers. Our solutions also improve our customers’ overall customer satisfaction through a highly efficient and accurate data lookup experience at the parts counter and a quicker response time to online inquiries, both of which serve to significantly improve a customer’s overall experience with the dealer. Our SaaS, DaaS and other solutions are sold through our internal sales force and are composed primarily of annual recurring license and subscriptions and, in the case of business management software, perpetual license and maintenance contracts. Customers typically sign annual, auto-renewing contracts. Today, approximately 90% of our revenues are recurring. In addition to our award-winning SaaS and DaaS solutions, ARI offers a suite of complementary products and services designed to supplement our primary offerings in order to help our customers Sell More Stuff!™ Web Platform Solutions Our eCommerce-enabled website solutions provide consumers with information about a dealership and its product lines through our extensive library of electronic catalog content and allow consumers to obtain information on whole goods and purchase PG&A via the dealers’ website 24 hours a day, 7 days a week. Our website solutions are tailored to each of the vertical markets we serve and are tightly integrated with our electronic library of inventory and PG&A content. We also offer a mobile solution that allows dealers’ websites to be fully functional on smart mobile phones.
21
Websites are sold through our inside sales teams, which are aligned by vertical market. The sales process will typically include a live demo of the site and may even include a free trial period (we refer to these as “test drives”). We may charge a nominal, one-time set-up fee to develop a new dealer website. Additional fees will include monthly recurring subscription fees and, under certain circumstances, variable transaction fees. Our website solutions are typically sold under one year, renewable contracts with monthly payment terms. We currently host and maintain more than 7,000 websites for dealers in all of our vertical markets. eCatalog Platform Solutions Our eCatalog solutions, which encompass our PartSmart®, PartSmart Web™, PartStream™, and AccessorySmart™ products, leverage our industry-leading library of electronic whole goods and PG&A content to allow distributors and dealers to view and interact with this information to efficiently support the sales and service of equipment. We believe that our eCatalog solution is the fastest and most efficient in the market, as it allows multi-line dealers to quickly access data for any of the brands serviced from within the same software, allowing the dealer’s parts and service operations to more quickly identify, locate and sell products and services to their customers. Our eCatalog solutions include:
PartSmart®, our CD-based, online accessible, electronic parts catalog, is used by dealers worldwide in the OPE, powersports, marine, appliance and agricultural equipment industries to increase productivity by significantly reducing parts lookup time. Our PartSmart® software is designed to allow multi-line dealers to look up parts and service information for all manufacturer product lines that the dealer carries, and integrates with more than 90 of the leading dealer business management systems. PartSmart Web™, a SaaS solution, is used by distributors and manufacturers to provide their dealers with access to parts and pricing information via the Internet. PartStream™, a SaaS solution, is a modular, consumer-focused illustrated parts lookup application that integrates with existing dealer and distributor websites and shopping carts and allows consumers to quickly identify the desired part, add the part to their electronic shopping cart and check out. It leverages ARI’s parts content, delivering it to PartStream™ users on demand from ARI servers. AccessorySmartTM, a SaaS solution, is the only aftermarket PG&A lookup product of its kind, providing access to more than 500,000 SKUs from more than 1,400 powersports aftermarket manufacturers. AccessorySmart provides parts and service counter personnel a one-stop resource to look up products, cost and availability for all of the leading aftermarket PG&A distributors. AccessorySmart significantly decreases the time it takes to look up PG&A information and availability, allowing dealers to service and sell more stuff to customers on a given day. This product is powered by the fitment data we acquired with the assets of Ready2Ride, Inc. in August 2012.
Our eCatalog products are sold through our dedicated internal sales team, and fees charged include a recurring license fee, subscription fees for subscribed catalogs, and in some cases, page view fees. Lead Management Solution Our award-winning SaaS solution, Footsteps™, is designed to efficiently manage and nurture generated leads, increasing conversion rates and ultimately revenues for our customers. Footsteps™ connects equipment manufacturers with their dealer channel through lead consolidation and distribution, and allows the dealers to handle leads more efficiently and professionally through marketing automation and business management system integration. The product is used as a complete database of customers and prospects, and manages the dealer-to-customer relationship, from generating email campaigns and automated responses, to providing sales teams with a daily follow-up calendar and reminder notices. Digital Marketing Solution Our digital marketing solutions provide lead generation tools through search engine optimization, social media marketing and website enhancements, which serve to drive on-line sales and increase traffic at dealerships. Digital marketing services is a relatively new service offering by ARI and in the third quarter of fiscal 2014, we went to market with a more robust offering in the space as a result of our continued integration of the DUO acquisition.
22
Other Solutions We also offer a suite of complementary solutions, which include software and website customization services and hosting services. Through the recent acquisitions of Tire Company Solutions, LLC (“TCS”) and TASCO Corporation (“TASCO”), we acquired a fully integrated suite of business management software solutions for the ATW market. These solutions, TirePower and Tireworks HD for tire retailers, ePower for tire wholesalers and TreadTracks for tire retreaders, are designed to streamline every aspect of a dealer’s operations to allow them to provide improved customer service. These products are sold through our dedicated internal sales team, and fees charged include a perpetual one-time license or installation fee, maintenance and other fees.
Our Growth Strategy ARI’s goal is to become the leading provider of SaaS, Daas and other solutions that help our customers, in selected vertical markets, efficiently and effectively sell and service more whole goods and PG&A – in other words, to Sell More Stuff!™ Our goal is to grow revenues at a double-digit rate and to grow earnings through scalability. We will provide our solutions to dealers, distributors, manufacturers, service providers, and consumers in vertical markets where the finished goods are complex equipment requiring service and are primarily sold and serviced through an independent dealer channel. We believe this strategy will drive increased value to our shareholders, customers and employees. We also believe the execution of the following strategic pillars will enable us to achieve the growth and profitability needed to drive long-term sustainable value for our shareholders. These strategic foundations are primarily centered on enhancing the value proposition to our customers, which will lead to additional revenues through pricing actions, product and feature upsells, and reduced customer churn rates, and expansion by leveraging our core competencies in new markets where appropriate. Each of these strategic pillars is a long-term foundation for growth; within each one we have established near-term goals, as discussed below. Drive organic growth through innovative new solutions, differentiated content, entering new markets and expanding geographically As a subscription-based, recurring revenue (“RR”) business, the most important drivers of future growth are increasing the level of our RR and reducing the rate of our customer churn. We define RR as revenue from products and services which are subscription-based and renewable, including software access fees, data content fees, maintenance and support fees and hosting fees, and we define churn as the percentage of RR that does not renew. During the nine months ended April 30, 2015, our RR increased 15.6% over the same period last year while the percentage of our total revenues that were RR decreased to 90.3% for the nine months ended April 30, 2015 from 94.2% for the same period in fiscal 2014, primarily due to TCS having a lower percentage of RR than our historical RR.
Develop and deploy innovative new solutions. We have resources assigned to each of our core products that continue to research and develop new value-added features and functionality for our existing products. The introduction of new solutions, upgrades to existing products, and new feature sets are all designed to grow our average revenue per dealer (“ARPD”), an important measure for a subscription-based business, and the increase in our customer base serves to quickly compound the benefits of an increased ARPD. This fiscal year, we released a number of new features, upgrades and products including the following:
Web Platform
o We developed an all new whole goods shopping experience, delivering the most advanced unit inventory browsing experience in the market, which includes convenient search and filtering capabilities that rival the leading independent shopping portals.
o We released the first smartphone and tablet application for iOS and Android in the market that enables dealers to manage all of their unit inventory directly from the app, including adding units, taking photos, managing promotions, and pushing inventory to third party channels such as CycleTrader and Craigslist.
o We released a new auto-quote response feature for tire and wheel products, as well as major units that automatically emails interested consumers with current pricing information upon submitting a quote request.
o We partnered with a third party vendor to release ARI Inventory, an add-on feature to our website that enables dealers to automatically push inventory listings from their website to third party channels such as Craigslist and eBay Motors, as well as to their social media channels.
o We developed and released an all new tire shopping experience, which presents consumers with targeted tire recommendations for their unique vehicle based on various key decision criteria, such as expert recommendations,
23
best warranty, best promotion, lowest price, and more, as well as significantly reducing the number of steps required to submit a quote, which resulted in a 48% increase in leads to our dealers.
o We developed additional integrations to leading credit card processors, as well as additional integration points for 3rd
parties to integrate with our software to streamline order processing.
eCatalog
o We developed a major update to our PartSmart Web platform, delivering a series of market-driven enhancements and innovations, including a streamlined user experience, dynamic diagram thumbnail previews, and fast moving parts tracking and display by unit.
o We released an expanded DataSmart product offering that provides key product data extract access, in addition to on-demand API access, to offer additional flexibility for implementation with various e-commerce software and SEO customization capabilities.
o We developed a new Search Engine Optimization plugin for our AccessoryStream product, helping to bolster the search engine ranking of parts, garments, and apparel products on website running on the PHP framework. This release compliments a previous release of the same tool for the .NET framework.
o We completed a partnership and integration of our DaaS offering with Channel Advisor, the leader in multi-channel e-commerce, to help dealers utilize our data to automatically place product sales listings on Amazon and eBay.
These product enhancements were designed to automate and enhance the marketing, sales and servicing activities for our customers, in order to help them sell and service more parts, garments, accessories and whole goods.
Differentiate our content. We believe we have the largest library of replacement part, major unit, and PG&A content in the vertical markets we serve. This fiscal year, we authored 5 new OEM parts catalogs and we added 7 new product catalogs to our library, encompassing more than 40,000 new items. However, simply offering the largest content library in the markets we serve is not sufficient to drive the long-term revenue growth we desire. We strive to deliver more value to our customers through enrichment of our content. Content enrichment can take several forms, including the incorporation of user reviews and feedback into our existing content, further enhancing content provided to us by our OEM customers, and creating new forms of content that further our customers’ ability to efficiently service and sell more whole goods and PG&A. This fiscal year, our enrichment activities included the addition of over 230,000 new part-to-unit fitments and 115,000 new product attributes. Additionally, we substantially expanded the level of enrichment of our tire product information with the addition of 11 new performance and quality classifications to better aid the shopping experience, such as dry handling, wet handling, snow traction, and braking. We have also continued integrating analytic tools into several of our products, offering value-added feedback to our customers and channel partners to help them “Sell More Stuff!”
Enter new markets. ARI currently maintains a significant share in our core vertical markets of OPE, powersports, marine, RV and appliances. Accordingly, we anticipate low single-digit growth in these markets.
o As we continue to increase our share in our current markets, leveraging our technology in new and underserved markets will be important to maintaining substantial organic growth rates. Including the acquisition of TCS, ARI currently has more than 3,000 dealer websites in the ATW market. We estimate that the total market approximates 18,000 dealers and further, the broader automotive aftermarket comprises nearly 80,000 dealers, more than all of our other markets combined. We intend to continue to invest heavily in this market, including seeking opportunities to leverage our products and services in the broader automotive aftermarket. We are one of the first website providers to service the HME market. We estimate that this market comprises nearly 25,000 service providers, and believe the market to be in its infancy with respect to eCommerce. We recently invested in dedicated resources designed to expedite our growth in this market.
o Our acquisition of TCS not only cemented our position as the largest supplier of e-commerce solutions in the ATW market, it also included a new business management software product for retailers, wholesalers and retreaders in the ATW market.
o Our recent acquisition of TASCO has extended our position as a Business Management System leader in the ATW market, including expanded software dedicated to solving the unique needs of large, multi-location franchised businesses.
24
Expand geographically. Although we maintain relationships with dealers throughout the world, we have low penetration into international markets. Growing our international business will require us to secure and publish electronic content from OEMs outside the U.S. and make changes to our existing products that will allow us to rapidly deploy these products in a scalable and efficient manner and without the need to have “boots on the ground” in those countries.
To this end we have a business development resource solely dedicated to obtaining new international content and to date, we have added 14 new catalog content offerings in the international OPE market and 3 catalogs within the other vertical markets we serve. We have continued to establish relationships with OEMs in China and Europe. Also, we have upgraded our product roadmaps to allow us to rapidly deploy our products in these markets as discussed above.
Nurture and retain existing customers through world-class customer service and value-added product feature updates In order to achieve high single-digit to low double-digit organic growth, we not only need to execute the new growth strategies described above, we must also retain our existing customers. In a SaaS business, the cost to retain an existing customer is much less than the cost to acquire a new customer. Accordingly, customer churn is one of the most important metrics we track and manage. We experienced improvements in our churn rates the past several years as a result of strategic actions taken by the Company, all of which are designed to enhance the “stickiness” of our product within our customers’ operations. We will continue to leverage our relationships with existing customers and closely monitor and manage the level of customer churn. On a trailing 12 month basis, customer churn was 14.5% for the period ended April 30, 2015. We will continue to leverage our relationships with existing customers and closely monitor and manage the level of customer churn. Lead the market with open integration to related platforms One of our strategic advantages is our focus on integrating our solutions with dealer business management systems (“DMS”) in order to pass key information, including customer and transactional data, between our solutions and the DMS, saving our customers valuable time and eliminating redundant data entry. We currently have integration capabilities with over 90 DMSs (we refer to these relationships as “Compass Partners”) and we continue to seek other strategic alliances that can be integrated with our product and service offerings. Successfully execute acquisitions that align with our core strategy Since 1995 we have had a formal corporate development program aimed at identifying, evaluating and closing acquisitions that align with our strategy. Since the program’s inception, we have closed thirteen acquisitions. A summary of some of our most recent acquisitions is as follows:
Acquisition Date Strategy
TASCO Corporation and affiliated Signal April 2015 ▪ Extend business management software platform in the ATW
Extraprise Corporation market
Tire Company Solutions, LLC September 2014 ▪ Consolidate position and add new
business management software in the ATW market
DUO Web Solutions November 2013 ▪ A leading provider of social media and online marketing
services in the powersports industry 50 Below Sales & Marketing, Inc. November 2012 ▪ A market leader in the powersports industry
(Retail Division) ▪ Entrance into ATW and DME industries
▪ New award-winning website platform
Ready2Ride, Inc. August 2012 ▪ First of its kind aftermarket fitment data for the
powersports industry
Summary of Operating Results Total revenue increased 25.7% or $2,104,000 for the three months ended April 30, 2015 compared to the same period last year. Year to date revenue increased 20.7% or $5,060,000. Recurring revenue constituted 90.5% and 90.3% of our total revenue for the three and nine months ended April 30, 2015 respectively, compared to 93.3% and 94.2% for the same periods last year. Recurring revenue increased 21.9% and 15.6% during the three and nine months ended April 30, 2015, compared to the same periods last year. The growth in year over year total revenue was attributable to incremental revenue from the TCS business acquired in September 2014, as well as organic growth in revenue from ARI’s historical products.
25
Operating income increased 84.9% or $310,000, from $365,000 for the three months ended April 30, 2014 to $675,000 for the same period this year, and increased $1,702,000 from a loss of $74,000 for the nine months ended April 30, 2014 to income of $1,628,000 for the same period this year. Net operating expenses increased 25.2% or $1,574,000 and 14.0% or $2,773,000 during the three and nine month periods ended April 30, 2015, compared to the same periods last year, primarily due to the additional costs of the TCS operation and transaction fees related to the TCS acquisition. The year to date difference was partially offset by $234,000 in severance and related costs incurred in January 2014 as a result of the workforce reduction.
Net income was $339,000, or $0.02 per share, for the three months ended April 30, 2015, compared to $160,000, or $0.01 per share, for the same period last year. Net income for the nine months ended April 30, 2015 was $703,000, or $0.05 per share, compared to a net loss of $276,000, or $0.02 per share, for the same period last year. Cash provided by operations was $4,595,000 for the nine months ended April 30, 2015 compared to $1,042,000 for the same period last year, primarily as a result of revenue growth, operational efficiencies and the workforce reduction made in January 2014. Revenue
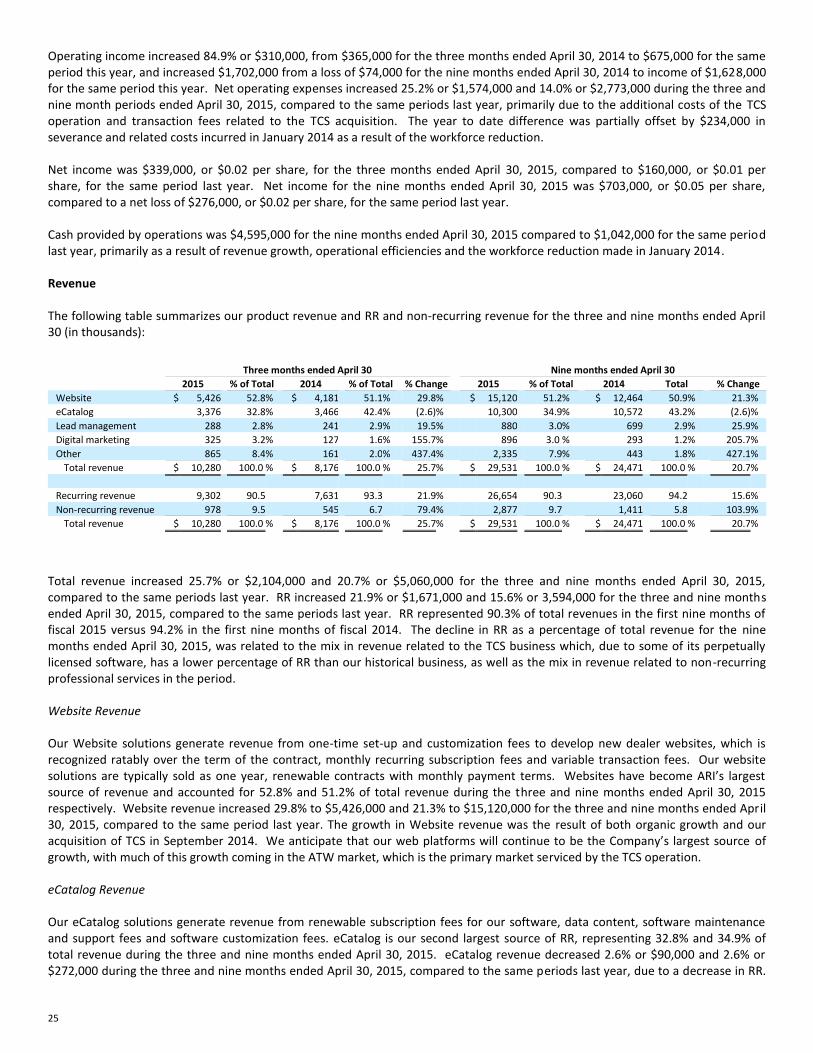
The following table summarizes our product revenue and RR and non-recurring revenue for the three and nine months ended April 30 (in thousands):
Three months ended April 30 Nine months ended April 30
2015 % of Total 2014 % of Total % Change 2015 % of Total 2014 Total % Change
Website $ 5,426 52.8 % $ 4,181 51.1 % 29.8 % $ 15,120 51.2 % $ 12,464 50.9 % 21.3 %
eCatalog 3,376 32.8 % 3,466 42.4 % (2.6) % 10,300 34.9 % 10,572 43.2 % (2.6) %
Lead management 288 2.8 % 241 2.9 % 19.5 % 880 3.0 % 699 2.9 % 25.9 %
Digital marketing 325 3.2 % 127 1.6 % 155.7 % 896 3.0 % 293 1.2 % 205.7 %
Other 865 8.4 % 161 2.0 % 437.4 % 2,335 7.9 % 443 1.8 % 427.1 %
Total revenue $ 10,280 100.0 % $ 8,176 100.0 % 25.7 % $ 29,531 100.0 % $ 24,471 100.0 % 20.7 %
Recurring revenue 9,302 90.5 7,631 93.3 21.9 % 26,654 90.3 23,060 94.2 15.6 %
Non-recurring revenue 978 9.5 545 6.7 79.4 % 2,877 9.7 1,411 5.8 103.9 %
Total revenue $ 10,280 100.0 % $ 8,176 100.0 % 25.7 % $ 29,531 100.0 % $ 24,471 100.0 % 20.7 %
Total revenue increased 25.7% or $2,104,000 and 20.7% or $5,060,000 for the three and nine months ended April 30, 2015, compared to the same periods last year. RR increased 21.9% or $1,671,000 and 15.6% or 3,594,000 for the three and nine months ended April 30, 2015, compared to the same periods last year. RR represented 90.3% of total revenues in the first nine months of fiscal 2015 versus 94.2% in the first nine months of fiscal 2014. The decline in RR as a percentage of total revenue for the nine months ended April 30, 2015, was related to the mix in revenue related to the TCS business which, due to some of its perpetually licensed software, has a lower percentage of RR than our historical business, as well as the mix in revenue related to non-recurring professional services in the period. Website Revenue Our Website solutions generate revenue from one-time set-up and customization fees to develop new dealer websites, which is recognized ratably over the term of the contract, monthly recurring subscription fees and variable transaction fees. Our website solutions are typically sold as one year, renewable contracts with monthly payment terms. Websites have become ARI’s largest source of revenue and accounted for 52.8% and 51.2% of total revenue during the three and nine months ended April 30, 2015 respectively. Website revenue increased 29.8% to $5,426,000 and 21.3% to $15,120,000 for the three and nine months ended April 30, 2015, compared to the same period last year. The growth in Website revenue was the result of both organic growth and our acquisition of TCS in September 2014. We anticipate that our web platforms will continue to be the Company’s largest source of growth, with much of this growth coming in the ATW market, which is the primary market serviced by the TCS operation. eCatalog Revenue Our eCatalog solutions generate revenue from renewable subscription fees for our software, data content, software maintenance and support fees and software customization fees. eCatalog is our second largest source of RR, representing 32.8% and 34.9% of total revenue during the three and nine months ended April 30, 2015. eCatalog revenue decreased 2.6% or $90,000 and 2.6% or $272,000 during the three and nine months ended April 30, 2015, compared to the same periods last year, due to a decrease in RR.
26
The catalog content provided in our eCatalog solutions helps to drive sales growth in our Website and Lead Management solutions as well, so while eCatalog revenue has declined to date this fiscal year, it continues to drive growth in other areas of the business. Lead Management Revenue Lead management revenue is primarily generated from renewable subscription fees and variable transaction fees for the use of our Footsteps™ products. Lead management revenue increased 19.5% to $288,000 and 25.9% to $880,000 during the three and nine months ended April 30, 2015 compared to the same periods last year, as a result of growth in both recurring subscriptions and non-recurring set-up fees. Digital Marketing Revenue Revenues from our digital marketing solutions are generated from set-up fees and subscription fees for our lead generation tools through search engine optimization, social media marketing and website enhancements. In addition to this, the recently acquired the TCS business provides recurring digital marketing services to its customers. Total digital marketing revenue increased 155.7% to $325,000 and 205.7% to $896,000 during the three and nine months ended April 30, 2015 compared to the same periods last year. We expect digital marketing revenue to continue to increase over the prior year as we continue to grow this business. Other Revenue We also offer a suite of complementary solutions, which include software and website customization services, perpetually licensed software and hosting services. Other revenue increased 437.4% to $865,000 and 427.1% to $2,335,000 during the three and nine months ended April 30, 2015 compared to the same periods last year. The increase in other revenue is due to the sale of business management software licenses and services associated with the TCS acquisition. In addition to this, other revenue increased due to an increase in our professional services revenue, related to a service contract with one of our major manufacturers. Recurring Revenue RR is one of the most important growth drivers of our business. Increasing the percentage of our revenues that are recurring, while at the same time reducing the rate of product churn, enhances our ability to generate profitable growth. Our subscription-based SaaS and DaaS products generate higher margins than our non-recurring products and services, and the incremental cost of selling these products to new dealers (we refer to these as new “logos”) is relatively low. Reducing the rate of our product churn, which is the percentage of RR that does not renew, helps drive organic growth as it allows for a greater percentage of our new logos to be incremental to the top line (versus making up for lost logos) and also increases the base upon which we can apply price increases and sell additional products and features. We generate RR from each of our primary product categories from annual license, subscription, maintenance and support fees. RR increased 21.9% or $1,671,000 and 15.6% or $3,594,000 for the three and nine months ended April 30, 2015, compared to the same periods last year. The growth in RR was primarily attributable to both the addition of RR from our TCS acquisition and organic growth in our historic Website products. We expect Website RR to continue to be our largest contributor to RR growth in fiscal 2015. Non-recurring Revenue Non-recurring revenue is generated from certain offerings within the Company’s business management and digital marketing services, professional services related to software customization and data conversion, usage fees charged on our RR products, perpetual license revenue and other complementary products and services. Total non-recurring revenues were $978,000 and $2,877,000 for the three and nine months ended April 30, 2015, versus $545,000 and $1,411,000 for the same periods last year, increases of 79.4% and 103.9%, respectively, primarily due to an increase in professional service revenue and perpetual license revenue related to TCS. As a percentage of total revenues, non-recurring revenues were 9.7% for the nine months ended April 30, 2015, versus 5.8% for the same period in fiscal 2014. Our goal is to maintain non-recurring revenues of less than 10% of total revenues, as the margins on these revenues tend to be lower than our RR products. Furthermore, these revenues must be resold each year. Revenue from the TCS operation has a lower percentage of RR than our historical revenue due to a portion of its revenue being derived from perpetual licenses, however, these offerings carry similar margins to our historical RR and often are sold with a recurring revenue maintenance fee component.
27
Cost of Revenue and Gross Margin
We classify as cost of revenue those costs directly attributable to the provision of services. These costs include (i) software amortization, which represents the periodic amortization of costs for internally developed or purchased software sold to customers; (ii) direct labor for the provision of catalog production, product implementations and professional services revenue; and (iii) other direct costs, which represent amounts paid to third party vendors for data royalties, as well as data conversion and replication fees directly attributable to the services we provide our customers.
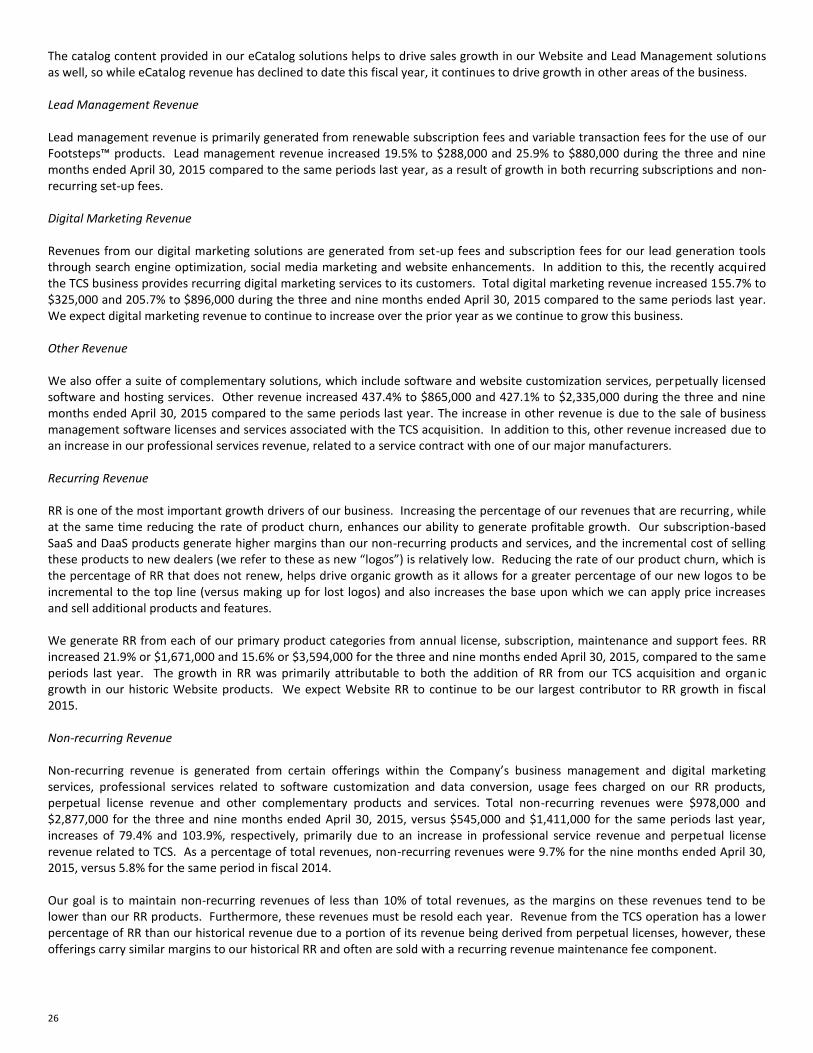
The table below breaks out cost of revenue into each of these three categories for the three and nine months ended April 30 (in thousands):
Three months ended April 30 Nine months ended April 30
% of % of % of % of
2015 Revenue 2014 Revenue 2015 Revenue 2014 Revenue % Change
Net revenues $ 10,280 $ 8,176 $ 29,531 $ 24,471 20.7 %
Cost of revenues:
Amortization of capitalized software costs 458 4.5 % 532 6.5 % 1,560 5.3 % 1,494 6.1 % 4.4 %
Direct labor 613 6.0 % 474 5.8 % 1,612 5.5 % 1,723 7.0 % (6.4) %
Other direct costs 709 6.9 % 554 6.8 % 2,219 7.5 % 1,589 6.5 % 39.6 %
Total cost of revenues 1,780 17.3 % 1,560 19.1 % 5,391 18.3 % 4,806 19.6 % 12.2 %
Gross profit $ 8,500 82.7 % $ 6,616 80.9 % $ 24,140 81.7 % $ 19,665 80.4 % 22.8 %
Gross profit was $8,500,000 or 82.7% of revenue for the three months ended April 30, 2015, compared to $6,616,000 or 80.9% of revenue for the same period last year and $24,140,000 or 81.7% of revenue for the nine months ended April 30, 2015, compared to $19,665,000 or 80.4% of revenue for the same period last year. Amortization of capitalized software costs as a percentage of revenue decreased for the nine months ended April 30, 2015, compared to the same period last year, primarily due to revenue increasing at a faster rate than software capitalization costs. Direct labor costs as a percentage of revenue decreased for the nine months ended April 30, 2015, compared to the same period last year primarily due to operational efficiencies in our catalog production and website implementation operations. Other direct costs increased as a percentage of revenue for the three and nine months ended April 30, 2015, compared to the same periods last year, due to an increase in royalty expense as we expanded our website offerings, as well as subcontracted labor that was used for a portion of our professional services work in the current year periods. The Company expects fluctuations in gross margin from quarter to quarter and year over year based on the mix of products sold.
Operating Expenses We categorize net operating expenses as follows:
Sales and marketing expenses consist primarily of personnel and related costs, including commissions for our sales and marketing employees, and the cost of marketing programs and trade show attendance;
Customer operations and support expenses are composed of our computer hosting operations, software maintenance agreements for our core network, and personnel and related costs for operations and support employees;
Software development and technical support expenses are composed primarily of personnel and related costs; we capitalize certain of these costs in accordance with GAAP, which is discussed below, while the remaining costs are primarily related to technical support and research and development;
General and administrative expenses primarily consist of personnel and related costs for executive, finance, human resources and administrative personnel, legal and other professional fees and other corporate expenses and overhead;
Depreciation and amortization expenses consist of depreciation on fixed assets, which are composed of leasehold improvements and information technology assets, and the amortization of acquisition-related intangible assets. Costs associated with the amortization of software products are a component of cost of revenue; and
We allocate certain shared costs among the various net operating expense classifications. Allocated costs include facilities, insurance, internal software, and telecommunications. These costs are generally allocated based on headcount, unless circumstances dictate otherwise. All public company costs, including legal and accounting fees, investor relations costs, board fees and directors and officers liability insurance, remain in general and administrative.
28
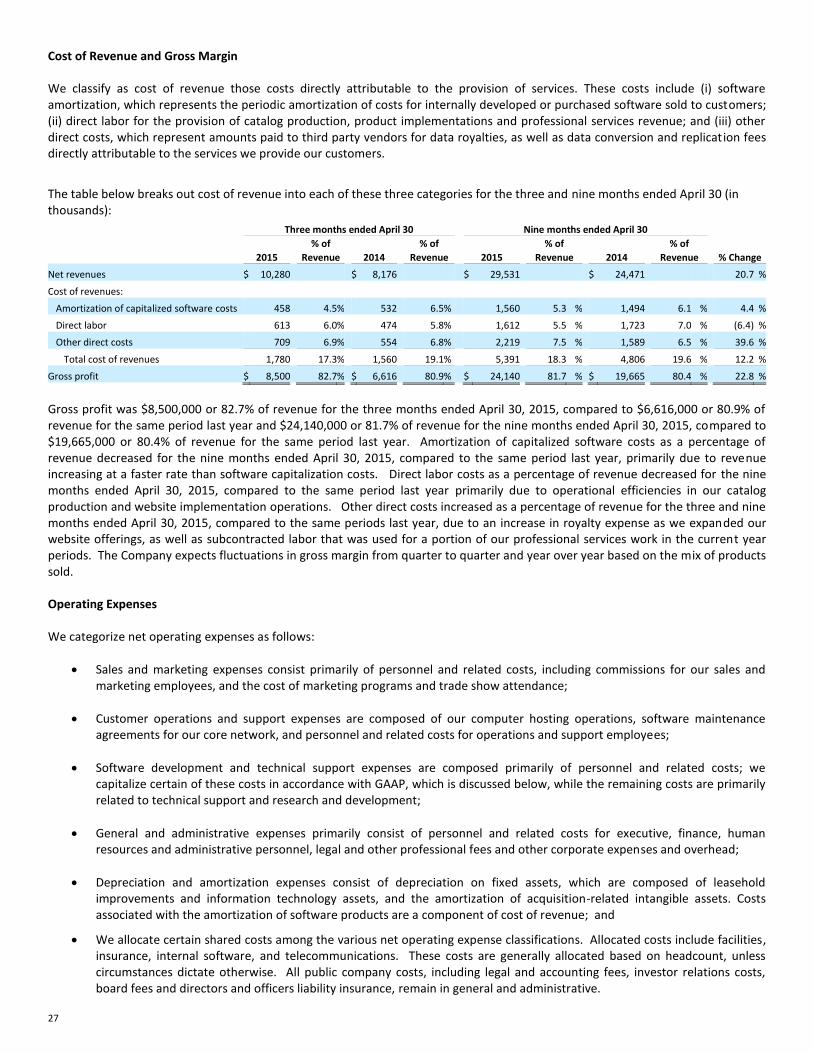
The following table summarizes our unaudited operating expenses by expense category for the three and nine months ended April 30 (in thousands):
Three months ended April 30 Nine months ended April 30
% of % of % % of % of %
2015 Revenue 2014 Revenue Change 2015 Revenue 2014 Revenue Change
Sales and marketing $ 2,718 26.4 % $ 2,291 28.0 % 18.6 % $ 7,928 26.8 % $ 7,190 29.4 % 10.3 %
Customer operations and support 1,831 17.8 % 1,638 20.0 % 11.8 % 5,392 18.3 % 5,029 20.6 % 7.2 %
Software development and technical support 1,102 10.7 % 679 8.3 % 62.3 % 3,046 10.3 % 2,016 8.2 % 51.1 %
General and administrative 1,709 16.6 % 1,289 15.8 % 32.6 % 4,901 16.6 % 4,490 18.3 % 9.2 %
Depreciation and amortization (1) 465 4.5 % 354 4.3 % 31.4 % 1,245 4.2 % 1,014 4.1 % 22.8 %
Net operating expenses $ 7,825 76.1 % $ 6,251 76.5 % 25.2 % $ 22,512 76.2 % $ 19,739 80.7 % 14.0 %
(1) Exclusive of amortization of software products of $553, $518, $1,102 and $962 for the three and nine months ended April 30, 2015 and 2014, respectively, which are included in cost of revenue.
Net operating expenses increased 25.2% or $1,574,000 and 14.0% or $2,773,000 for the three and nine months ended April 30, 2015, compared to the same periods last year. The Company acquired the net assets of TCS in September 2014 and the net assets of TASCO in April 2015. The increase in net operating expenses was largely due to the TCS operating costs during fiscal 2015 and transaction fees for the TCS and TASCO acquisitions. Management expects net operating expenses to continue to decline as a percentage of total revenue, as the Company continues to integrate the TCS and TASCO operations and, to the extent the Company can leverage growth in its core RR products, as incremental costs related to these products decrease for every dollar of new revenue.
Sales and Marketing
Sales and marketing expense increased 18.6% or $427,000 and 10.3% or $738,000 during the three and nine months ended April 30, 2015, compared to the same periods last year. The increase was primarily a result of the expenses associated with the TCS operations. Sales and marketing expense as a percentage of revenue decreased from 29.4% of revenue for the nine months ended April 30, 2014 to 26.8% for the same period in fiscal 2015. Management expects sales and marketing expense as a percentage of revenue to fluctuate, based upon the timing of the Company’s marketing events and trade show schedule and its decision to add additional sales and marketing resources to drive organic revenue growth.
Customer Operations and Support
Customer operations and support expense increased 11.8% or $193,000 and 7.2% or $363,000 during the three and nine months ended April 30, 2015, compared to the same periods last year. The increase was primarily a result of the expense associated with the TCS operations. Customer operations and support expense as a percentage of revenue decreased from 20.6% of revenue for the nine months ended April 30, 2014 to 18.3% during the first nine months of fiscal 2015. To the extent RR continues to grow, management expects customer operations and support expenses to continue to decline as a percentage of total revenues over time, as we realize anticipated cost savings related to the efficiencies implemented in the catalog conversion and customer implementation and support areas.
Software Development and Technical Support
Our software development and technical support staff have three essential responsibilities for which the accounting treatment varies depending upon the work performed: (i) costs associated with internal software development efforts (after technological feasibility is established) are capitalized as software product costs and amortized over the estimated useful lives of the product; (ii) costs for professional services performed for customers related to software customization projects are classified as cost of revenue; and (iii) all other activities, including research and development, are considered operating expenses and included within the software development and technical support operating expense category.
29
Software development and technical support costs increased 62.3% or $423,000 and 51.1% or $1,030,000 during the three and nine months ended April 30, 2015 versus the same periods last year. The increase was primarily a result of the additional TCS software development and technical support costs, partially offset by the workforce reduction in January 2014.
During the three and nine months ended April 30, 2015, we capitalized $248,000 and $761,000 of software development labor and overhead, versus $334,000 and $1,171,000 during the same periods last year. In addition to internal capitalized software costs, we had outsourced capitalized development costs of $32,000 and $234,000 during the three and nine months ended April 30, 2015 and $81,000 and $249,000 during the same periods last year. During the nine months ended April 30, 2015, we devoted resources to several enhancements to our website products and a major new upgrade to our web eCatalog product, but have largely completed our work on AccessorySmart and PartStream products, which contributed to the higher capitalization rate in the same period last year.
We expect fluctuations in the percentage of software development and technical support costs classified as operating expenses from period to period, based on the mix of research and prototype work versus capitalized software development and professional services activities.
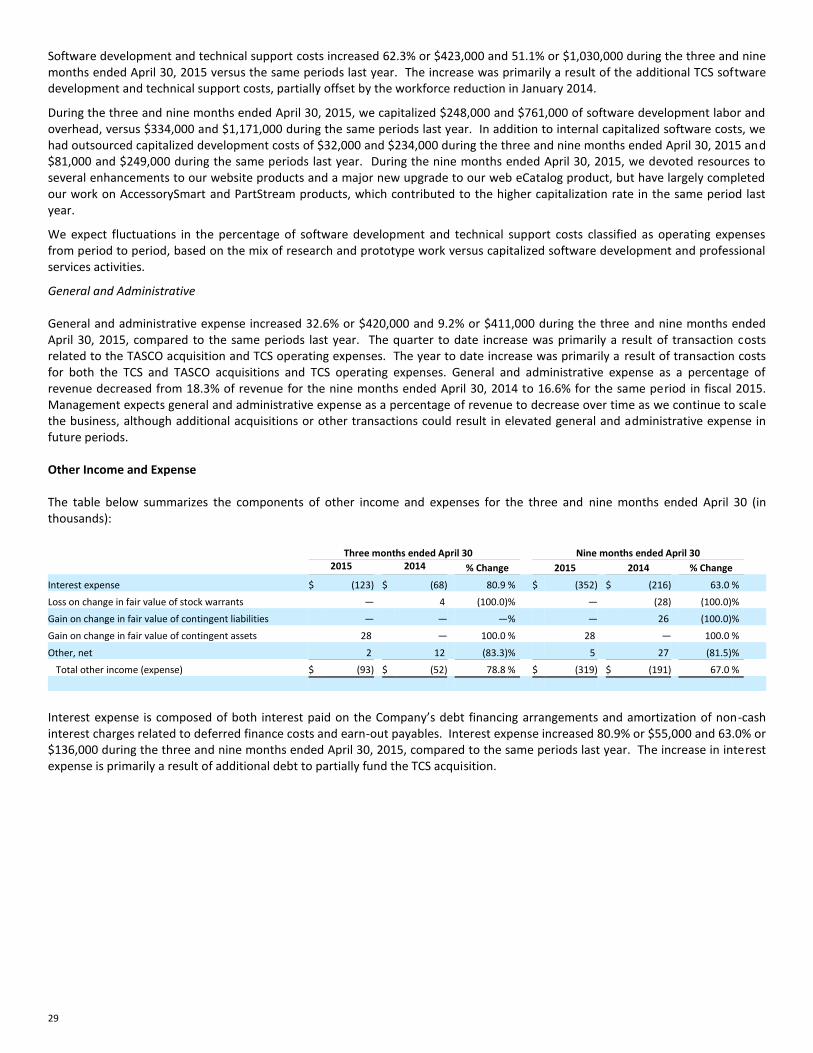
General and Administrative General and administrative expense increased 32.6% or $420,000 and 9.2% or $411,000 during the three and nine months ended April 30, 2015, compared to the same periods last year. The quarter to date increase was primarily a result of transaction costs related to the TASCO acquisition and TCS operating expenses. The year to date increase was primarily a result of transaction costs for both the TCS and TASCO acquisitions and TCS operating expenses. General and administrative expense as a percentage of revenue decreased from 18.3% of revenue for the nine months ended April 30, 2014 to 16.6% for the same period in fiscal 2015. Management expects general and administrative expense as a percentage of revenue to decrease over time as we continue to scale the business, although additional acquisitions or other transactions could result in elevated general and administrative expense in future periods. Other Income and Expense The table below summarizes the components of other income and expenses for the three and nine months ended April 30 (in thousands):
Three months ended April 30 Nine months ended April 30 2015 2014 % Change 2015 2014 % Change
Interest expense $ (123) $ (68) 80.9 % $ (352) $ (216) 63.0 %
Loss on change in fair value of stock warrants — 4 (100.0) % — (28) (100.0) %
Gain on change in fair value of contingent liabilities — — — % — 26 (100.0) %
Gain on change in fair value of contingent assets 28 — 100.0 % 28 — 100.0 %
Other, net 2 12 (83.3) % 5 27 (81.5) %
Total other income (expense) $ (93) $ (52) 78.8 % $ (319) $ (191) 67.0 %
Interest expense is composed of both interest paid on the Company’s debt financing arrangements and amortization of non-cash interest charges related to deferred finance costs and earn-out payables. Interest expense increased 80.9% or $55,000 and 63.0% or $136,000 during the three and nine months ended April 30, 2015, compared to the same periods last year. The increase in interest expense is primarily a result of additional debt to partially fund the TCS acquisition.
30
Acquisitions
On April 27, 2015, the Company acquired substantially all of the assets of TASCO, a leading provider of business management software designed exclusively for the automotive tire and wheel aftermarket industry. Consideration for the acquisition included: (1) a cash payment at the closing of the transaction equal to $1,750,000; (2) 242,424 shares of the Company’s common stock; and (3) a $200,000 holdback payable on April 27, 2016.
On September 30, 2014, we completed the acquisition of TCS, a leading provider of software, websites and marketing services designed exclusively for the automotive tire and wheel vertical. Consideration for the acquisition included, (1) a cash payment equal to $4,200,000; (2) 618,744 shares of the Company's common stock; (3) the issuance of two promissory notes initially in aggregate principal amount of $3,000,000 to the former owners of TCS. The principal amount of the Notes was reduced by $67,000 to $2,933,000 as a result of post-closing adjustments to the valuation of the net assets acquired, pursuant to the terms of the asset purchase agreement; and (4) a contingent earn-out purchase price payable in three potential payments and contingent upon the attainment of specific revenue goals. The earn-out does not have an upper range, however, the payout at 100% per the asset purchase agreement is $933,000 and the estimated fair value is $711,000. The Company’s strategy is to integrate these acquisitions as quickly as possible in order to realize the cost savings of operational synergies. As a result of this, we do not track revenues and costs specific to the individual acquired businesses.
Income Taxes
The Company has net deferred tax assets of $ 5,686,000 as of April 30, 2015, primarily consisting of net operating loss carryforwards (“NOLs”) and book to tax temporary differences. Income tax expense is provided for at the applicable statutory tax rate applied to current U.S. income before taxes, plus or minus any adjustments to the deferred tax assets and to the estimated valuation allowance against deferred tax assets. Income tax expense, if any, does not represent a significant current cash obligation, as we continue to have NOLs to offset substantially all of the taxable income. We had income tax expense of $243,000 and $606,000 during the three and nine months ended April 30, 2015, compared to income tax expense of $153,000 and $11,000 during the same periods last year, primarily due to the increase in income before taxes. We paid income taxes of $25,000 and $70,000 during the nine months ended April 30, 2015 and 2014, respectively, primarily related to statutory alternative minimum taxes. Income tax expense may vary from period to period as we continue to evaluate the valuation allowance against net deferred tax assets.
We also have NOLs related to tax losses incurred by our Netherlands operation. We have determined that, consistent with prior periods, it is not likely that the net operating losses will be utilized and therefore, a full valuation allowance is recorded, resulting in $0 net deferred tax assets related to the Netherlands operation at April 30, 2015 and 2014.
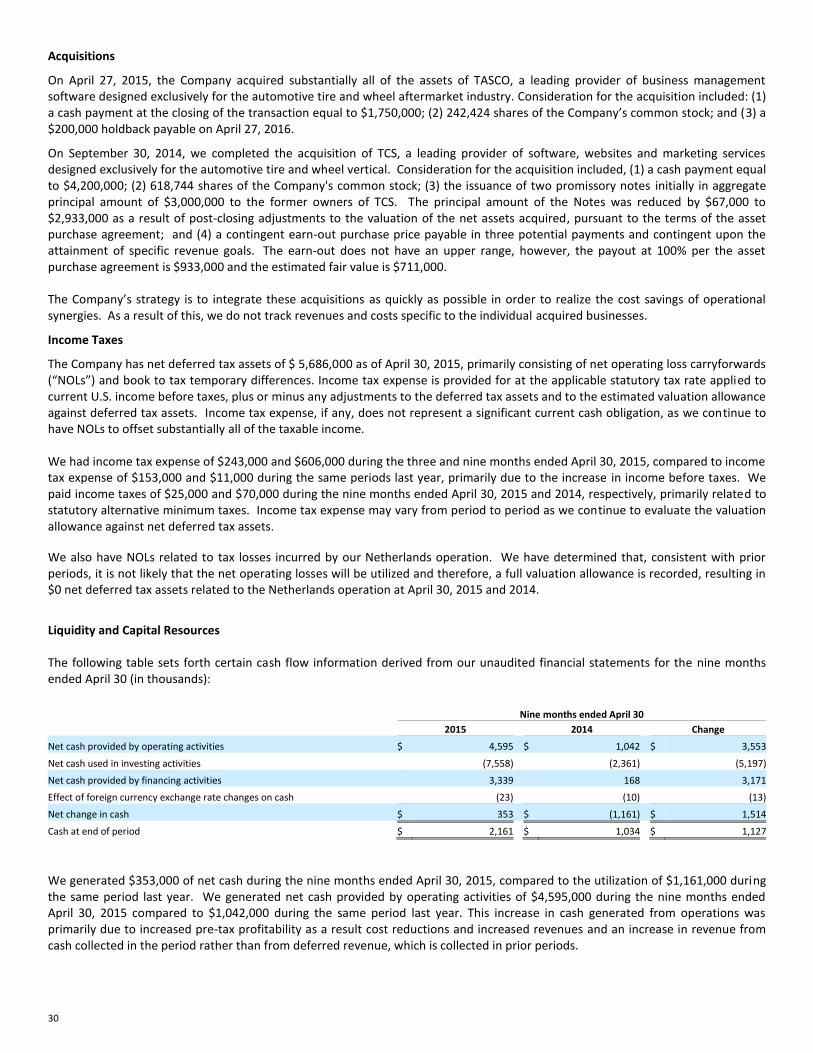
Liquidity and Capital Resources The following table sets forth certain cash flow information derived from our unaudited financial statements for the nine months ended April 30 (in thousands):
Nine months ended April 30
2015 2014 Change
Net cash provided by operating activities $ 4,595 $ 1,042 $ 3,553
Net cash used in investing activities (7,558) (2,361) (5,197)
Net cash provided by financing activities 3,339 168 3,171
Effect of foreign currency exchange rate changes on cash (23) (10) (13)
Net change in cash $ 353 $ (1,161) $ 1,514
Cash at end of period $ 2,161 $ 1,034 $ 1,127
We generated $353,000 of net cash during the nine months ended April 30, 2015, compared to the utilization of $1,161,000 during the same period last year. We generated net cash provided by operating activities of $4,595,000 during the nine months ended April 30, 2015 compared to $1,042,000 during the same period last year. This increase in cash generated from operations was primarily due to increased pre-tax profitability as a result cost reductions and increased revenues and an increase in revenue from cash collected in the period rather than from deferred revenue, which is collected in prior periods.
31
Cash used in investing activities increased $5,197,000 for the nine months ended April 30, 2015, compared to the same period last year. We paid cash of $4,200,000 as consideration for the TCS acquisition, paid cash of $1,750,000 as consideration for the TASCO acquisition, paid $250,000 for a cash earn-out and holdback related to our August 2012 acquisition of the assets of Ready2Ride, Incorporated, capitalized $1,000,000 of software development costs, acquired technology and equipment of $469,000 and received $111,000 from an earn-out receivable, during the nine months ended April 30, 2015. We paid cash of $200,000 as consideration for the DUO acquisition, paid $250,000 related to the Ready2Ride cash earn-out and holdback, capitalized $1,420,000 of software development costs, acquired technology and equipment of $592,000, and received $101,000 from an earn-out receivable during the same period last year. We will continue to invest cash in the business to further our growth strategies previously discussed.
Net cash provided from financing activities was $3,339,000 during the nine months ended April 30, 2015, as the Company increased its senior debt, as described below, to partially fund the TCS acquisition in September 2014, and drew $1,750,000 on the line of credit to fund the TASCO acquisition in April 2015. Net cash provided by financing activities was $168,000 in the nine months ended April 30, 2014.
Management believes that current cash balances and its ability to generate cash from operations are sufficient to fund our needs over the next twelve months, although additional financing may be necessary if the Company were to complete a material acquisition or to make a large investment in its business.
On May 12, 2015, the Company completed an underwritten offering pursuant to which it sold 1,760,000 shares of its common stock at a price to the public of $3.00 per share. The Company received net proceeds of approximately $4,686,300 from the sale, after deducting underwriting discounts and commissions and estimated offering expenses payable by the Company. The Company used a portion of the net proceeds to repay its outstanding line of credit balance of $1,750,000 incurred in connection with its April 2015 acquisition of TASCO (thus making the line of credit fully available for future transactions), and intends to use the balance of the net proceeds to invest in or to acquire, from time to time, businesses that align with its core acquisition strategy (although there were no commitments or agreements with respect to any acquisitions as of the date of the offering), and for general corporate purposes, which may include working capital and/or capital expenditures.
Debt Silicon Valley Bank
On April 26, 2013, the Company entered into a Loan and Security Agreement (the “Agreement”) with Silicon Valley Bank (“SVB”), pursuant to which SVB extended to the Company credit facilities consisting of a $3,000,000 revolving credit facility with a maturity date of April 26, 2015 and a $4,500,000 term loan with a maturity date of April 26, 2018. The Agreement replaced the Company’s Loan and Security Agreement with Fifth Third Bank.
On September 30, 2014, in connection with the Company’s acquisition of TCS, the Company entered into the First Loan Modificat ion Agreement (the “Modification Agreement”) with SVB, which contained substantial amendments to the terms of the Agreement.
The Modification Agreement includes credit facilities consisting of a $3,000,000 revolving credit facility with a maturity date of September 30, 2016 and a $6,050,000 term loan with a maturity date of September 30, 2019. This term loan is an amendment to the existing $4,500,000 term loan with an original maturity date of April 26, 2018. The term loan and any loans made under the SVB revolving credit facility accrue interest at a per annum rate equal to the Prime rate plus the Applicable Margin for Prime Rate Loans based on the Total Leverage Ratio. The Company had $1,750,000 outstanding on the revolving credit facility, which was primarily used to fund the TASCO acquisition, and an effective interest rate of 3.75% at April 30, 2015.
The Modification Agreement contains covenants that restrict, among other things and subject to certain conditions, the ability of the Company to permit a change of control, incur debt, create liens on its assets, make certain investments, enter into merger or acquisition transactions and make distributions to its shareholders. Financial covenants include the maintenance of a minimum Total Leverage Ratio equal to or less than 3.25 to 1.00 through the period ending October 31, 2014 and 3.00 to 1.00 thereafter, and the maintenance of a Fixed Charge Coverage Ratio (as defined in the Agreement) equal to or greater than 1.25 to 1.00. The Agreement also contains customary events of default that, if triggered, could result in an acceleration of the Company’s obligations under the Agreement. The loans are secured by a first priority security interest in substantially all assets of the Company. The Company was in compliance with its debt covenants as of April 30, 2015.
TCS Promissory Notes
In connection with the acquisition of TCS, on September 30, 2014, the Company issued two promissory notes with an original aggregate value of $3,000,000 to the former owners of TCS. The principal amount of the Notes was subsequently reduced by $66,575 as a result of post-closing adjustments to the valuation of the net assets acquired, pursuant to the terms of the asset purchase agreement. The notes initially are accruing interest on the outstanding unpaid principal balance at a rate per annum equal
32
to 5%; however, if any amount payable under a note is not paid when due, such overdue amount will bear interest at the default rate of 7.5% from the date of such non-payment until such amount is paid in full.
Off-Balance Sheet Arrangements The Company has no off-balance sheet arrangements that have or are reasonably likely to have a current or future effect on its financial condition, revenue or expenses, results of operations, liquidity, capital expenditures or capital resources. Item 3. Quantitative and Qualitative Disclosures about Market Risk
Not Applicable. Item 4. Controls and Procedures The Company has established disclosure controls and procedures to ensure that material information relating to it, including its consolidated subsidiaries, is made known on a timely basis to the officers who certify our financial reports and to other members of senior management and the Board of Directors. The Company’s management, with the participation of our Chief Executive Officer and Chief Financial Officer, has evaluated the effectiveness of our disclosure controls and procedures (as such term is defined in Rules 13a-15(e) and 15d-15(e) under the Exchange Act) as of the end of the period covered by this report. Based on such evaluation, our Chief Executive Officer and Chief Financial Officer have concluded that, as of such date, the Company’s disclosure controls and procedures are effective (1) in recording, processing, summarizing and reporting, on a timely basis, information required to be disclosed by the Company in the reports that it files or submits under the Exchange Act and (2) to ensure that information required to be disclosed in the reports it files or submits under the Exchange Act is accumulated and communicated to its management, including the Chief Executive Officer and Chief Financial Officer, to allow timely decisions regarding required disclosure. There have not been any changes in our internal control over financial reporting (as defined in Exchange Act Rules 13a-15(f) and 15d-15(f)) that occurred during the quarter ended April 30, 2015 that have materially affected, or are reasonably likely to materially affect the Company’s internal control over financial reporting. PART II - OTHER INFORMATION Item 1. Legal Proceedings
From time to time, the Company may be involved in litigation relating to claims arising out of its operations in the usual course of business. No material legal proceedings to which the Company is a party exist at April 30, 2015.
Item 1A. Risk Factors The Company’s risks and uncertainties are described in Part I, Item 1A of the Company’s annual report on Form 10-K for the fiscal year ended July 31, 2014. There have been no significant changes to the risks described in our Form 10-K. Item 2. Unregistered Sales of Equity Securities and Use of Proceeds In connection with the April 27, 2015 acquisition of substantially all of the assets of TASCO, the Company issued 242,424 shares of its common stock to Aidan J. McKenna, the sole shareholder of TASCO, as a portion of the consideration paid for the assets. The Company believes that this transaction was exempt from registration requirements pursuant to Section 4(a)(2) of the Securities Act of 1933, as amended. The recipient of these securities represented his intention to acquire the securities for investment only and not with a view toward their distribution, and appropriate legends were affixed to the share certificates. Item 3. Defaults upon Senior Securities None. Item 4. Mine Safety Disclosures Not applicable.