Labour migration from · PDF fileLabour migration from Pakistan: ... Skill composition of...
84
Ministry of Overseas Pakistanis and Human Resource Development Government of Pakistan Islamabad Labour migration from Pakistan: 2015 status report
Transcript of Labour migration from · PDF fileLabour migration from Pakistan: ... Skill composition of...

Ministry of Overseas Pakistanis and Human Resource DevelopmentGovernment of Pakistan
Islamabad
Labour migration from Pakistan:2015 status report


Labour migration from Pakistan: 2015 status report
i

Labour migration from Pakistan: 2015 status report
ii
Labour migration from Pakistan: 2015 status report
iii
We are delighted with the publication of the first national report on the status of labour migration from Pakistan. The surge in migration for foreign employment has brought profound changes in the socio-economic fabric of the country. Although the labour migration phenomenon has emerged as an alternative livelihood opportunity for many Pakistani households, it poses new challenges for the Government and policy-makers in managing safe migratory flows to destination countries. A strength-ening of the migration governance system is needed in the current context and that requires reliable and easily accessible data that informs the present situation and provides a basis for future interven-tions. The singing of Pakistan’s third Decent Work Country Program 2016-2020 by the Ministry of Overseas Pakistanis and Human Resource Development, the Employers Federation of Pakistan, the Pakistan Workers Federation and the ILO in May 2016 reiterates our joint commitment to protect the rights of migrant workers and build effective institutions.
This report captures trends in labour migration from Pakistan, identifies the structural gaps and sug-gests ways to move forward for the Government and stakeholders. Although various government agen-cies have maintained and published data on numerous aspects of labour migration, no one source had assembled all the pieces into one report. This report fills that gap and goes beyond to highlight the achievements of the Government as well as remaining challenges. It presents a guide for policy-makers, international agencies, local NGOs, academics, journalists and any other actors to use when investigat-ing and addressing labour migration issues, particularly when ensuring that the rights of migrants are protected at all stages of the migration cycle.
This report is the outcome of a long and trusting partnership between the Ministry of Overseas Paki-stanisand Human Resource Development and the International Labour Organization. The staff of PPU and ILO have worked tirelessly to give birth to this report.
We hope this report will be the first in a series of yearly reports and that all stakeholders will continue to cooperate to promote safe migration.
Ingrid Christensen Khizer Hayat KhanDirector Secretary ILO Country Office for Pakistan Ministry of Overseas Pakistanis and Human Resource Development
Foreword
Labour migration from Pakistan: 2015 status report
v
Foreword iii
Acknowledgements viii
Abbreviations ix
1. Introduction 11.1 Background 11.2 Report objectives 21.3 Methodology 21.3.1 Consultation process with informants 31.3.2 Capacity-building workshop 3
2. Magnitude and patterns of overseas migration from Pakistan 52.1 Magnitude of overseas migration 52.2 Origin of migrant workers 72.3 Destination countries 112.4. Skill composition of migrant workers 152.5 Mode of migration 172.6 Private overseas employment promoters 192.7 Irregular migration 212.8 Reports of deceased migrant workers 232.9 Female migrant workers 242.10 Future projection of migration 272.11 Cost of migration for low-skilled workers 30
3. Remittances 35
4. Institutional arrangements to promote migration 394.1. Institutional framework 394.1.1 Bureau of Emigration and Overseas Employment 404.1.2 Overseas Pakistanis Foundation 404.2 The recruitment process 414.3 Grievances and redress 434.3.1 Community welfare attachés 434.3.2 Federal Ombudsman of Pakistan 434.3.3 Overseas Pakistanis Foundation 43
5. Achievements, challenges and ways forward 455.1 Major achievements 455.2 Challenges and ways forward 475.2.1 Migration statistics 475.2.2 Institutional framework 48
References 51
Appendix 53
Contents
Labour migration from Pakistan: 2015 status report
vi
TABLESTable 1. Top 20 origin districts in Pakistan of workers
going abroad for jobs, 2014 and 2015 10Table 2. Distribution (%) of Pakistani workers, by country of destination, 1971–2015* 12Table 3. Top country destinations, by number and share
of total migration flow, 1971–2015 14Table 4. Overseas employment promoters, by city, 2015 19Table 5. Pakistanis deported, by deporting country, 2012–15 22Table 6. Irregular migrant workers, since 2005 23Table 7. Number of deaths of migrant workers in destination countries, 2005–15* 24Table 8. Major destination countries of Pakistani women migrant workers, 2008–13 25Table 9. Number of Pakistani women migrant workers, by job, 2008–13 26Table 10. GDP growth rates and migration stock and migration elasticity, 2005–14 28Table 11. Projected annual growth (%) and total Pakistan migrant workers stock,
in GCC countries and Malaysia, 2014–20 29Table 12. Migration cost estimates, by component, 2014 31Table 13. Official charges (in PKR) for overseas migration,
by recruitment channel, 2015 32Table 14. Annual inflows of remittances to Pakistan, 2013/14 and 2014/15 35Table 15. Pakistan’s ranking in migration and remittance flows, 2015 37Table 16. Key points of the 1979 Emigration Ordinance 40Table 17. Protector of Emigrants Offices and their area (districts) of jurisdiction 40 FIGURESFigure 1. Magnitude of migration, 2005–15 6Figure 2. Growth rate in overseas migration and GDP growth rate of Pakistan, 2001–14 7Figure 3. Distribution of migrant workers across provinces and regions, 1981–2015 9Figure 4. Share (%) of provinces or regions in the total population and
overseas migration flow, 1981–2015 9Figure 5. Skill composition of workers who went overseas for employment, 2015 15Figure 6. Skill composition (%) of migrant workers going abroad for
employment, by decade, 1971–2015 16Figure 7. Top categories of migrant workers going abroad for employment,
by job, 2005–15 17Figure 8. Distribution (%) of Pakistani workers going abroad for employment,
by mode of recruitment, 1971–2015 18Figure 9. Migrant workers going abroad for employment, by mode of
recruitment, 1981–2015 18Figure 10. Overseas employment agency licenses issued, by year, 2005–15 19
Labour migration from Pakistan: 2015 status report
vii
Figure 11. Number of overseas employment agency licenses cancelled, 2011–16 20Figure 12. Total number of Pakistanis deported per year, 2007–15 21Figure 13. Number of female workers going abroad through the Overseas
Employment Corporation, January 2004–September 2015 26Figure 14: Projected migrant workers for 2020 in GCC countries
and Malaysia (millions), based on actual migrant workers since 1970 30Figure 15. Remittances inflow, 1992/93 to 2014/15 36
MAPSMap 1. Distribution of foreign migrant workers’ homes at the provincial
and region levels,1981–2015 8Map 2. Distribution of foreign migrant workers’ homes in Pakistan
at the district level, 1981–2015 11
APPENDIX TABLES Table A1. Workers registered for overseas employment by the BEOE, by province,
1981–2015 53Table A2. Workers registered for overseas employment by the BEOE, by district,
1981–2015 54Table A3. Workers registered for overseas employment by the BEOE, by province
or protectorate, 1981–2015 58Table A4. Skill level among migrant workers, 1971–2015 59Table A5. Workers registered for overseas employment by the BEOE, by country of
destination, 1971–2015 60Table A6. Number of persons processed for foreign employment by the Overseas
Employment Corporation, 1976–2016 62Table A7. Number of persons sent abroad for employment through the Overseas
Employment Corporation, by sex, 2004–15 64Table A8. Number of female workers sent abroad for employment through Overseas
Employment Corporation, January 2004–September 2015 64Table A9. Number of overseas employment agency licences cancelled 65Table A10. Number of irregular migrant workers deported back to Pakistan,
2005/06–2014/15 66Table A11. Number of deaths of migrant workers in destination countries,
2005/06–2014/15 66Table A12. Number of migrant workers stranded, deported or detained in
jail and monitoring visits 67
Labour migration from Pakistan: 2015 status report
viii
This report was commissioned by the International Labour Organization. I am particularly thankful to Anna Engblom, Chief Technical Adviser, and Sadia Hameed, National Programme Officer of the South Asia Labour Migration Governance project for their support at every stage of the study. I am also thankful to the Policy Planning Unit team, especially Unit Chief Fayyaz Malik, for their valuable inputs. I extend deep gratitude to all of them. I also acknowledge the contribution of all institutions cited, especially the Overseas Employment Corporation and the Overseas Pakistanis Foundation, and individuals who were kind enough to help us during the collection of data and information. I thank Muhammad Javid for his continuous support in data collection and organizing the capacity-building workshop.
Nasir IqbalDirector ResearchBenazir Income Support Programme
Acknowledgements
Labour migration from Pakistan: 2015 status report
ix
BEOE Bureau of Emigration and Overseas EmploymentGCC Gulf Cooperation CouncilGDP gross domestic productILO International Labour OrganizationKNOMAD Knowledge Partnership on Migration and DevelopmentOEC Overseas Employment CorporationUNODC United Nations Office on Drugs and Crime
Abbreviations

Labour migration from Pakistan: 2015 status report
x
Labour migration from Pakistan: 2015 status report
1
1.1 Background
The world faces immense challenges of sustainable development. Billions of people continue to live in poverty and are deprived of a life of dignity. Unemployment, particularly youth un-employment, is a major concern. Like other developing countries, Pakistan is confronted with problems of massive poverty and unemployment due to a rapid increase in its population and labour force.
With such a huge working-age population in Pakistan, an increasing number of workers have moved to other countries for employment; after India, Pakistan annually sends abroad the sec-ond-largest grouping of workers in South Asia, mainly to the Gulf region. Pakistan relies heav-ily on labour migration as an avenue for reducing both unemployment and poverty. Migration is recognized as a central dimension of globalization, touching almost all countries around the world as points of origin, transit or destination for migrants or even all three at once.
Since the mid-1970s when dramatically rising oil prices led to an economic boom in the oil-rich countries of the Gulf region, large-scale temporary and circular foreign worker migration has accommodated the associated labour needs. Pakistani workers have been a large presence in that movement as well as in the flow to other new opportunities in the world, particularly the United Kingdom, North America and Europe. Over the past four decades, more than 8 million Pakistanis moved abroad through the formal channel for employment. Migration from Pakistan reached a new peak after 2011. In the five-year period from 2011 to 2015, more than 3 million people left the country for foreign-based jobs.
These migrant workers have contributed heavily to Pakistan’s development through the remit-ting of their earnings, their gaining of new and updated knowledge and skills and through other social assets they acquired while working abroad. Yet, there is little recognition of their contribution to the development of their communities in Pakistan as well as their destination countries. And despite their valuable contributions, they are subjected to extensive abuse and exploitation during the recruitment and employment stages of their migration journey.
High recruitment costs, non-compliance with their placement terms, changes in the terms and conditions of the employment and/or reduced wages are the more common issues migrant workers encounter. This and other forms of labour exploitation and human rights abuses, along with debts taken on or valuable assets sold to cover the cost of migrating for work, con-tribute to migrant workers’ financial distress.
1. Introduction
Labour migration from Pakistan: 2015 status report
2
Although female migrant workers are fewer in number, evidence shows extensive abuse against female domestic workers. Much more research is needed, however, on female migrant workers’ lives in destination countries.
Also needed is strengthening of the labour migration governance system and policy frame-work. An effective international labour migration governance system requires government in-vestment in creating cohesive legislation and policies centred on the well-being and rights of migrant workers and investment in the enforcement of those laws and policies. For all of this to happen, access to accurate and reliable data is absolutely necessary.
1.2 Report objectives
Although the Emigration Ordinance and Rules of 1979 have been revised from time to time, gaps and loopholes in their implementation remain and adversely affect the safety and rights of migrants. The oversight process is significantly hampered by the lack of accessible, disaggregat-ed and statistically comparable data that would help to strengthen the governance framework.
There is currently no consolidation or analysis of data on labour migration that encapsulates past trends and future challenges and how labour migration governance might be strengthened through policy, programmes and projects accordingly. In the first of an expected series of yearly migration status updates, this report maps the trends and patterns of labour migration out of Pakistan.
The primary function of this status report is to amalgamate and examine the labour migration trends. Within this broad objective, the report covers three specific objectives:
i. Assess and delineate the magnitude of labour migration for foreign employment from Paki-stan in all its dimensions by collecting and collating information already available from government agencies.
ii. Specify potential government-led initiatives to promote safe migration as well as the rights and welfare of migrant workers in Pakistan and in destination countries.
iii. Single out achievements in the area of improved labour migration governance made during 2015 as well as remaining gaps and challenges and ways forward in existing policies and structural mechanisms on labour migration in Pakistan.
1.3 Methodology
This status report focuses on two broad characteristics of international labour migration from Pakistan: first, the characteristics of workers who have migrated through the formal chan-nel in terms of the scale of migration and the demographic and geographic characteristics of migrants; and second, the recent changes in the institutional framework that governs labour migration from Pakistan.
Labour migration from Pakistan: 2015 status report
3
The analysis is primarily based on official data generated by ministries and government agen-cies, including the Bureau of Emigration and Overseas Employment (BEOE), the Ministry of Overseas Pakistanis and Human Resource Development and the Overseas Employment Corporation (OEC). These sources provided detailed information on the scale of migration through the formal channel as well as the demographic and geographic characteristics of those migrants. For trend analysis, time series data from 1971 to 2015 were used; for current status, data for the 2014/2015 fiscal year was used. For institutional arrangements and achievements, various documents, including policy briefs, Acts, laws and other relevant information, were reviewed. Data on remittances were obtained from the State Bank of Pakistan. Data on mac-roeconomic indicators, such as gross domestic product (GDP), were taken from the Economic Survey of Pakistan findings.
Data on migration trends from the BEOE are based on a calendar year (1 January to 31 De-cember), while data on remittances and OEC data on migration are based on a fiscal year (FY) 1 July through 30 June. All data referred to in the slashed format, such as 2014/15, refers to the fiscal year.
At the time of writing this report, the full data sets for 2015 were not yet available. Thus, the data for 2015 is limited to the first ten months (January–October 2015).
NOTE: Although the Government of Pakistan uses the term “emigration” in the name of its departments managing overseas migration as well as the ordinances and laws (and the ensuing text) covering the movement of workers abroad for employment, this report uses the terms “migration” and “migrant” due to the temporary nature of the migration and that the workers intend to ultimately return to Pakistan. Thus, “emigration” is recognized as the movement out of a resident country with the intent to settle elsewhere.
1.3.1 Consultation process with informantsInformant interviews were conducted with high-level officials, focal persons from the various ministries, civil society organizations and academic institutions to gain an in-depth perspective on the nature and issues of labour migration for foreign employment. These interviews helped to formulate suggestions for ways forward to improve the laws and policies towards ensuring safe migration.
1.3.2 Capacity-building workshopA two-day workshop was organized at the International Labour Organization (ILO) Country Office for Pakistan in September 2015 to train the Policy Planning Unit team (within the Min-istry of Overseas Pakistanis and Human Resource Development) on producing similar reports using their own resources. The training covered data collection to finalizing reports. The objec-tive of the workshop was to provide training on the use of basic statistical packages, including Excel, SPSS and STATA, for data handling, analysis and preparation of summary statistics and frequency tables for this report, as well as for the generation of similar reports in the future.

Labour migration from Pakistan: 2015 status report
4
Labour migration from Pakistan: 2015 status report
5
This chapter presents the data on the magnitude and patterns of overseas migration from Paki-stan through the formal channel, with the focus on 2015 along with the historical trends. The Bureau of Emigration and Overseas Employment is the official agency responsible for manag-ing the migration of workers for employment. The BEOE publishes migration statistics on a regular basis, disaggregated by:
n origin of workers (home address); n destination countries; andn skills and occupational groups.
NOTE: The vast majority of overseas Pakistani labour migrants are men. According to the BEOE, between 2008 and 20131 , the proportion of migrating Pakistani women was only 0.1 per cent, or 6,444 workers. Given that more than 99 per cent of all migrant workers have been men, the discussions and presentation of data in sections 2.1–2.8 do not present sex-disaggre-gated data. Section 2.9 discusses the trends linked to women’s migration in more detail.
2.1 Magnitude of overseas migration
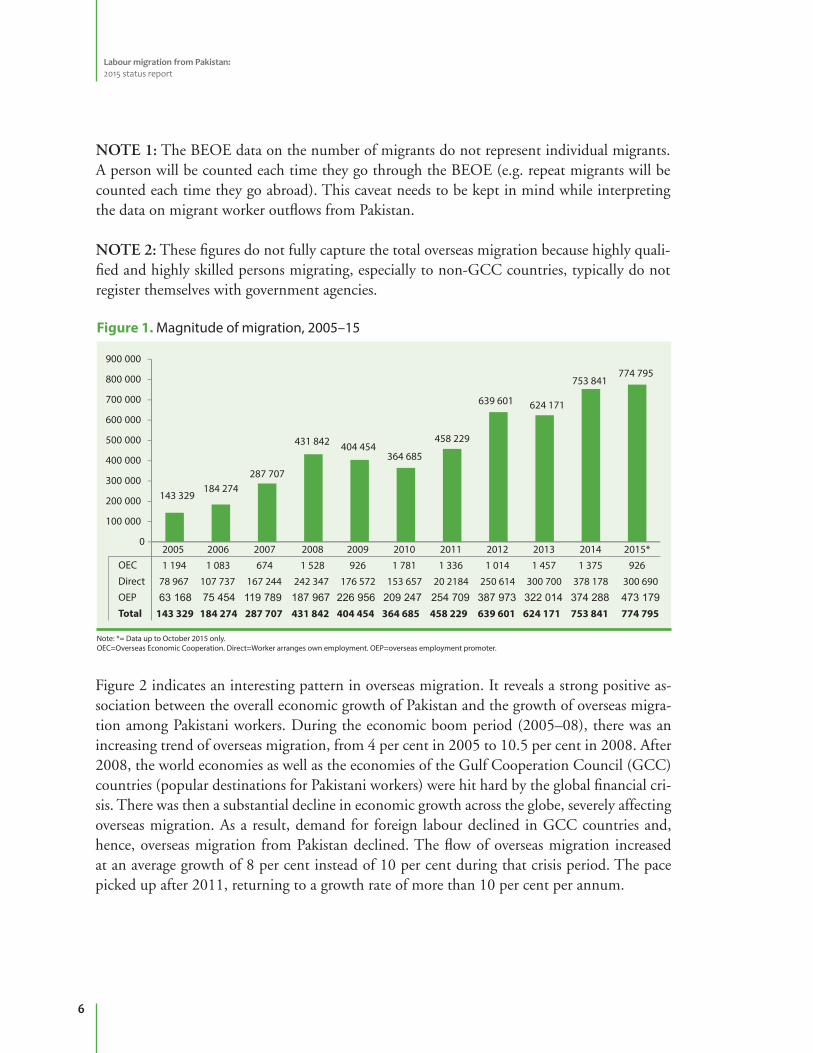
Over the past decade, there has been a substantial increase in the foreign employment of Paki-stanis. There are three modes for migrating overseas: through overseas employment promoters, through the OEC and for workers to directly obtain employment. The data on workers using an overseas employment promoter and managing overseas migration on their own is collected by the BEOE. The OEC maintains its own records. Based on both sets of records, more than 8.7 million Pakistani workers have gone abroad for employment since the 1970s. Most of them were registered with the BEOE, with only a total of 139,354 Pakistani workers using the services of the OEC over the past five decades. According to the BEOE records, the annual placement of Pakistanis increased from 143,329 in 2005 to 431,842 in 2008. After a decline during the following two years, it reached 458,229 migrant workers in 2011 before jumping to 639,601 workers in 2012 and 753,841 workers in 2014 (figure 1). During the first ten months of 2015, a total of 774,795 migrant workers left Pakistan. That number is presumed to have exceeded 800,000 by end of December 2015, constituting yet a new record.
1 In its regular reporting formats, the BEOE does not keep sex-disaggregated data. Upon special request, it can produce information on the number of men and women migrant workers, such as when a government minister requires it. Sex-disaggregated data are only available for 2008–13.
2. Magnitude and patterns of overseas migration from Pakistan
Labour migration from Pakistan: 2015 status report
6
NOTE 1: The BEOE data on the number of migrants do not represent individual migrants. A person will be counted each time they go through the BEOE (e.g. repeat migrants will be counted each time they go abroad). This caveat needs to be kept in mind while interpreting the data on migrant worker outflows from Pakistan.
NOTE 2: These figures do not fully capture the total overseas migration because highly quali-fied and highly skilled persons migrating, especially to non-GCC countries, typically do not register themselves with government agencies.
Figure 1. Magnitude of migration, 2005–15
Note: *= Data up to October 2015 only. OEC=Overseas Economic Cooperation. Direct=Worker arranges own employment. OEP=overseas employment promoter.
Figure 2 indicates an interesting pattern in overseas migration. It reveals a strong positive as-sociation between the overall economic growth of Pakistan and the growth of overseas migra-tion among Pakistani workers. During the economic boom period (2005–08), there was an increasing trend of overseas migration, from 4 per cent in 2005 to 10.5 per cent in 2008. After 2008, the world economies as well as the economies of the Gulf Cooperation Council (GCC) countries (popular destinations for Pakistani workers) were hit hard by the global financial cri-sis. There was then a substantial decline in economic growth across the globe, severely affecting overseas migration. As a result, demand for foreign labour declined in GCC countries and, hence, overseas migration from Pakistan declined. The flow of overseas migration increased at an average growth of 8 per cent instead of 10 per cent during that crisis period. The pace picked up after 2011, returning to a growth rate of more than 10 per cent per annum.

Labour migration from Pakistan: 2015 status report
7
Figure 2. Growth rate in overseas migration and GDP growth rate of Pakistan, 2001–14
Source: Author’s own calculation based on BEOE data; GDP growth rates were taken from World Development Indicator.
2 Including 125 districts in Punjab, Baluchistan, Sindh, Khyber Pakhtunkhwa and Islamabad Capital Territory; 13 in the Federally Administered Tribal Areas; and 10 in the Pakistan-administered Azad Jammu and Kashmir.
2.2 Origin of migrant workers
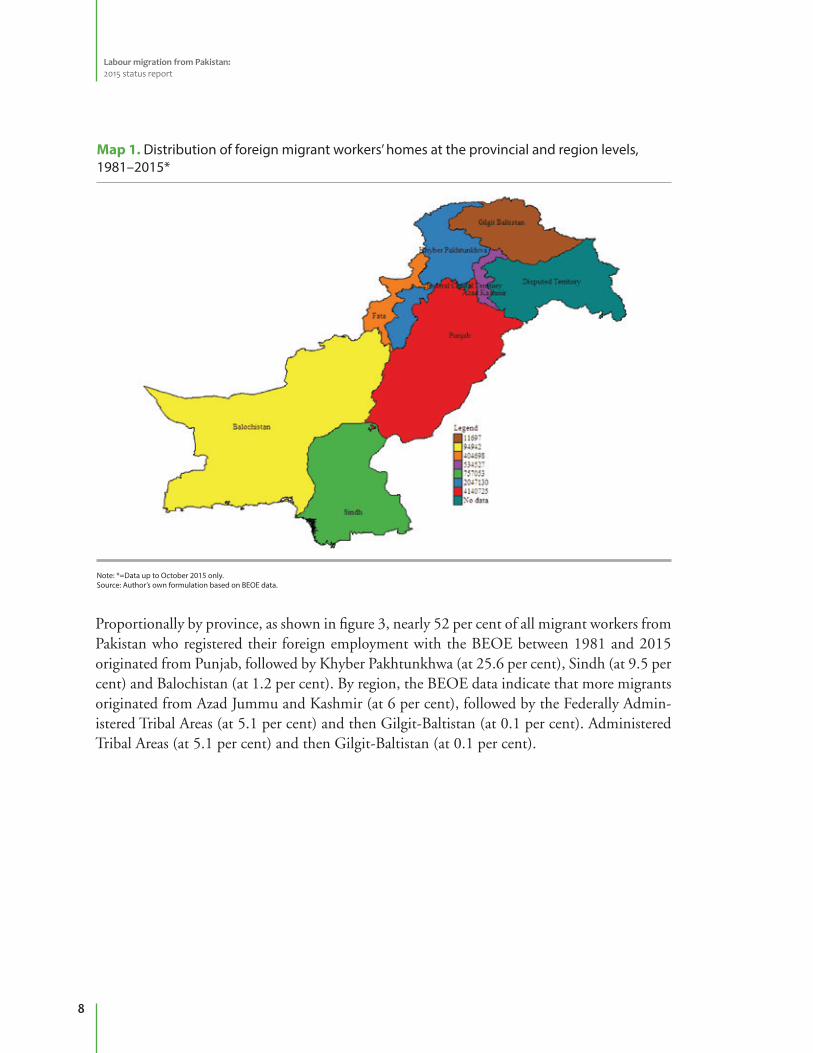
Pakistan is administratively demarcated into four provinces and three regions (the Federally Administered Tribal Areas, Gilgit-Baltistan and Azad Jammu and Kashmir). There are 148 dis-tricts2 in these provinces and regions. The data on the origin of migrants from Pakistan is not evenly distributed across provinces and regions nor across districts; rather, there appears to be a concentration in some districts. Between 1981 and 2015, as shown in Map 1, more than 4.1 million workers from Punjab Province who registered with the BEOE went abroad for employ-ment, followed by more than 2 million workers from Khyber Pakhtunkhwa Province, 757,053 workers from Sindh Province, 404,698 workers from the Federally Administered Tribal Areas and 94,942 from Balochistan.
Labour migration from Pakistan: 2015 status report
8
Map 1. Distribution of foreign migrant workers’ homes at the provincial and region levels, 1981–2015*
Note: *=Data up to October 2015 only.Source: Author’s own formulation based on BEOE data.
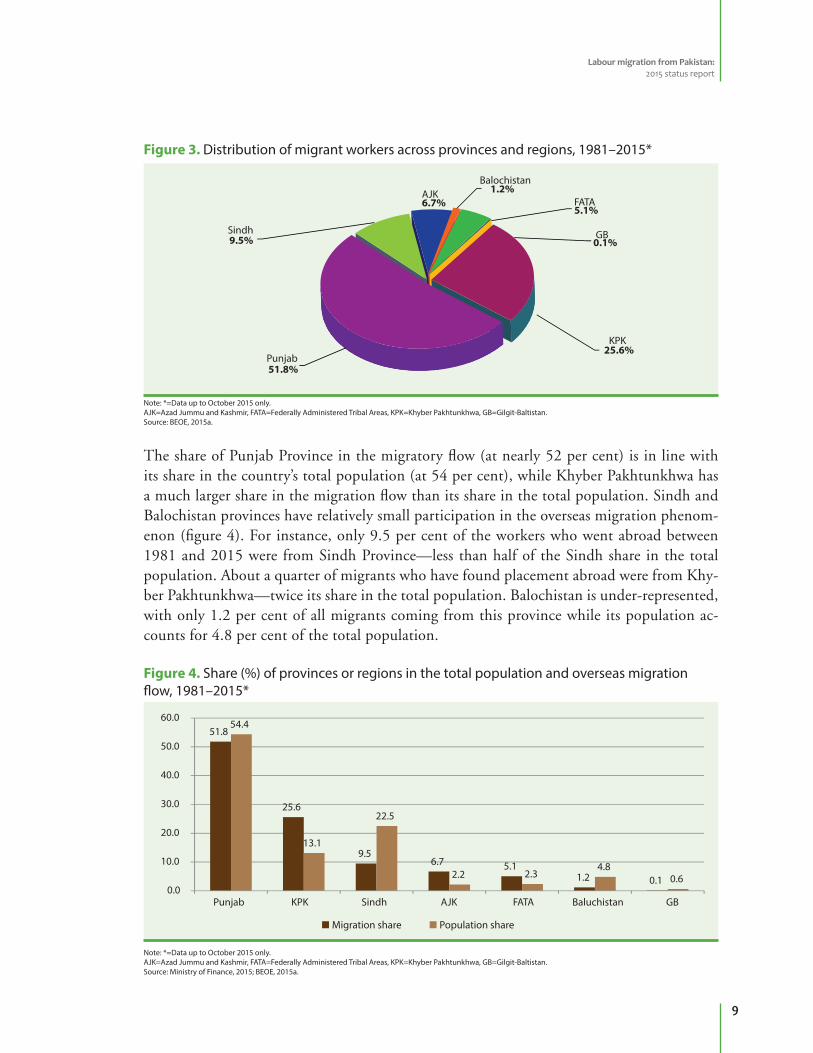
Proportionally by province, as shown in figure 3, nearly 52 per cent of all migrant workers from Pakistan who registered their foreign employment with the BEOE between 1981 and 2015 originated from Punjab, followed by Khyber Pakhtunkhwa (at 25.6 per cent), Sindh (at 9.5 per cent) and Balochistan (at 1.2 per cent). By region, the BEOE data indicate that more migrants originated from Azad Jummu and Kashmir (at 6 per cent), followed by the Federally Admin-istered Tribal Areas (at 5.1 per cent) and then Gilgit-Baltistan (at 0.1 per cent). Administered Tribal Areas (at 5.1 per cent) and then Gilgit-Baltistan (at 0.1 per cent).
Labour migration from Pakistan: 2015 status report
9
The share of Punjab Province in the migratory flow (at nearly 52 per cent) is in line with its share in the country’s total population (at 54 per cent), while Khyber Pakhtunkhwa has a much larger share in the migration flow than its share in the total population. Sindh and Balochistan provinces have relatively small participation in the overseas migration phenom-enon (figure 4). For instance, only 9.5 per cent of the workers who went abroad between 1981 and 2015 were from Sindh Province—less than half of the Sindh share in the total population. About a quarter of migrants who have found placement abroad were from Khy-ber Pakhtunkhwa—twice its share in the total population. Balochistan is under-represented, with only 1.2 per cent of all migrants coming from this province while its population ac-counts for 4.8 per cent of the total population.
Figure 3. Distribution of migrant workers across provinces and regions, 1981–2015*
Note: *=Data up to October 2015 only.AJK=Azad Jummu and Kashmir, FATA=Federally Administered Tribal Areas, KPK=Khyber Pakhtunkhwa, GB=Gilgit-Baltistan.Source: BEOE, 2015a.
Figure 4. Share (%) of provinces or regions in the total population and overseas migration flow, 1981–2015*
Note: *=Data up to October 2015 only.AJK=Azad Jummu and Kashmir, FATA=Federally Administered Tribal Areas, KPK=Khyber Pakhtunkhwa, GB=Gilgit-Baltistan.Source: Ministry of Finance, 2015; BEOE, 2015a.
Labour migration from Pakistan: 2015 status report
10
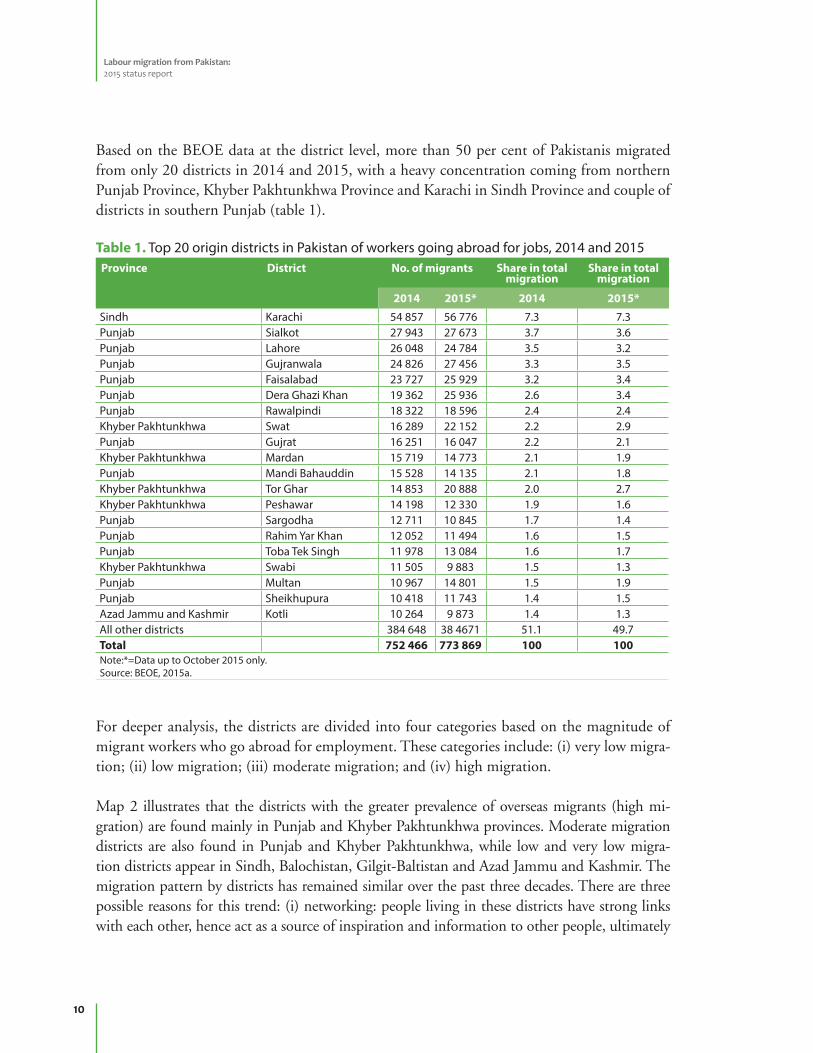
Based on the BEOE data at the district level, more than 50 per cent of Pakistanis migrated from only 20 districts in 2014 and 2015, with a heavy concentration coming from northern Punjab Province, Khyber Pakhtunkhwa Province and Karachi in Sindh Province and couple of districts in southern Punjab (table 1).
Table 1. Top 20 origin districts in Pakistan of workers going abroad for jobs, 2014 and 2015Province District No. of migrants Share in total
migrationShare in total
migration
2014 2015* 2014 2015*
Sindh Karachi 54 857 56 776 7.3 7.3Punjab Sialkot 27 943 27 673 3.7 3.6Punjab Lahore 26 048 24 784 3.5 3.2Punjab Gujranwala 24 826 27 456 3.3 3.5Punjab Faisalabad 23 727 25 929 3.2 3.4Punjab Dera Ghazi Khan 19 362 25 936 2.6 3.4Punjab Rawalpindi 18 322 18 596 2.4 2.4Khyber Pakhtunkhwa Swat 16 289 22 152 2.2 2.9Punjab Gujrat 16 251 16 047 2.2 2.1Khyber Pakhtunkhwa Mardan 15 719 14 773 2.1 1.9Punjab Mandi Bahauddin 15 528 14 135 2.1 1.8Khyber Pakhtunkhwa Tor Ghar 14 853 20 888 2.0 2.7Khyber Pakhtunkhwa Peshawar 14 198 12 330 1.9 1.6Punjab Sargodha 12 711 10 845 1.7 1.4Punjab Rahim Yar Khan 12 052 11 494 1.6 1.5Punjab Toba Tek Singh 11 978 13 084 1.6 1.7Khyber Pakhtunkhwa Swabi 11 505 9 883 1.5 1.3Punjab Multan 10 967 14 801 1.5 1.9Punjab Sheikhupura 10 418 11 743 1.4 1.5Azad Jammu and Kashmir Kotli 10 264 9 873 1.4 1.3All other districts 384 648 38 4671 51.1 49.7Total 752 466 773 869 100 100Note:*=Data up to October 2015 only. Source: BEOE, 2015a.
For deeper analysis, the districts are divided into four categories based on the magnitude of migrant workers who go abroad for employment. These categories include: (i) very low migra-tion; (ii) low migration; (iii) moderate migration; and (iv) high migration.
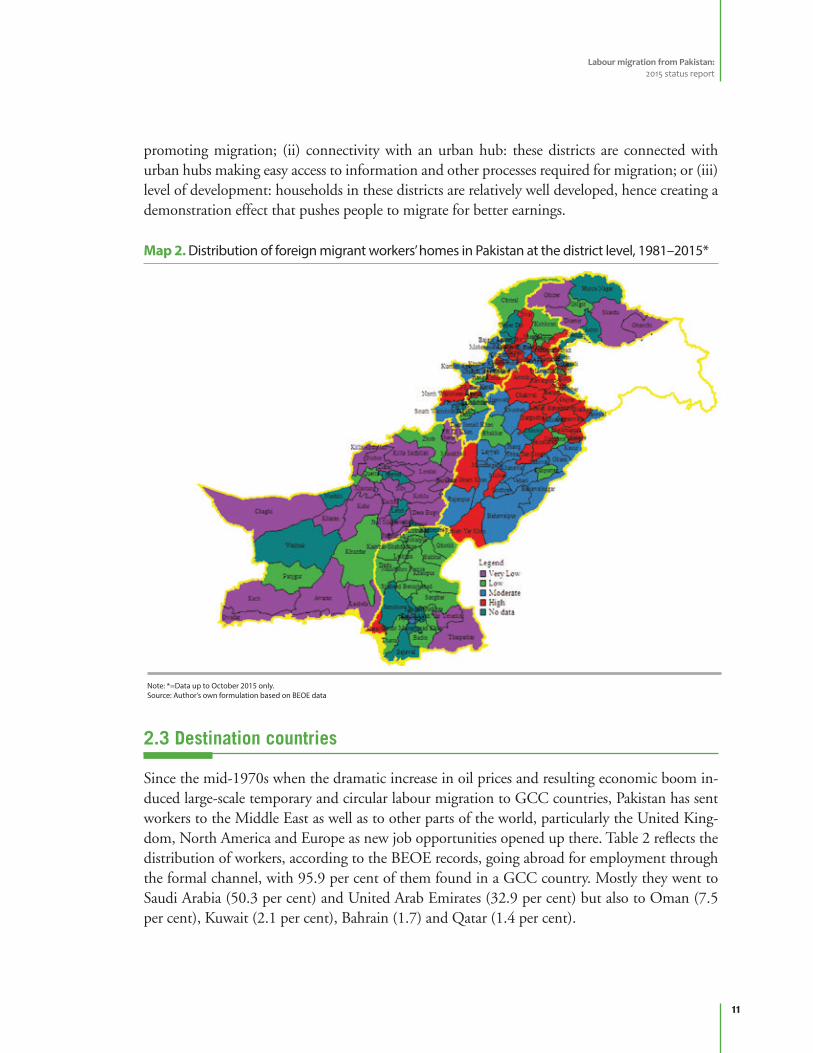
Map 2 illustrates that the districts with the greater prevalence of overseas migrants (high mi-gration) are found mainly in Punjab and Khyber Pakhtunkhwa provinces. Moderate migration districts are also found in Punjab and Khyber Pakhtunkhwa, while low and very low migra-tion districts appear in Sindh, Balochistan, Gilgit-Baltistan and Azad Jammu and Kashmir. The migration pattern by districts has remained similar over the past three decades. There are three possible reasons for this trend: (i) networking: people living in these districts have strong links with each other, hence act as a source of inspiration and information to other people, ultimately
Labour migration from Pakistan: 2015 status report
11
Map 2. Distribution of foreign migrant workers’ homes in Pakistan at the district level, 1981–2015*
Note: *=Data up to October 2015 only.Source: Author’s own formulation based on BEOE data
promoting migration; (ii) connectivity with an urban hub: these districts are connected with urban hubs making easy access to information and other processes required for migration; or (iii) level of development: households in these districts are relatively well developed, hence creating a demonstration effect that pushes people to migrate for better earnings.
2.3 Destination countries
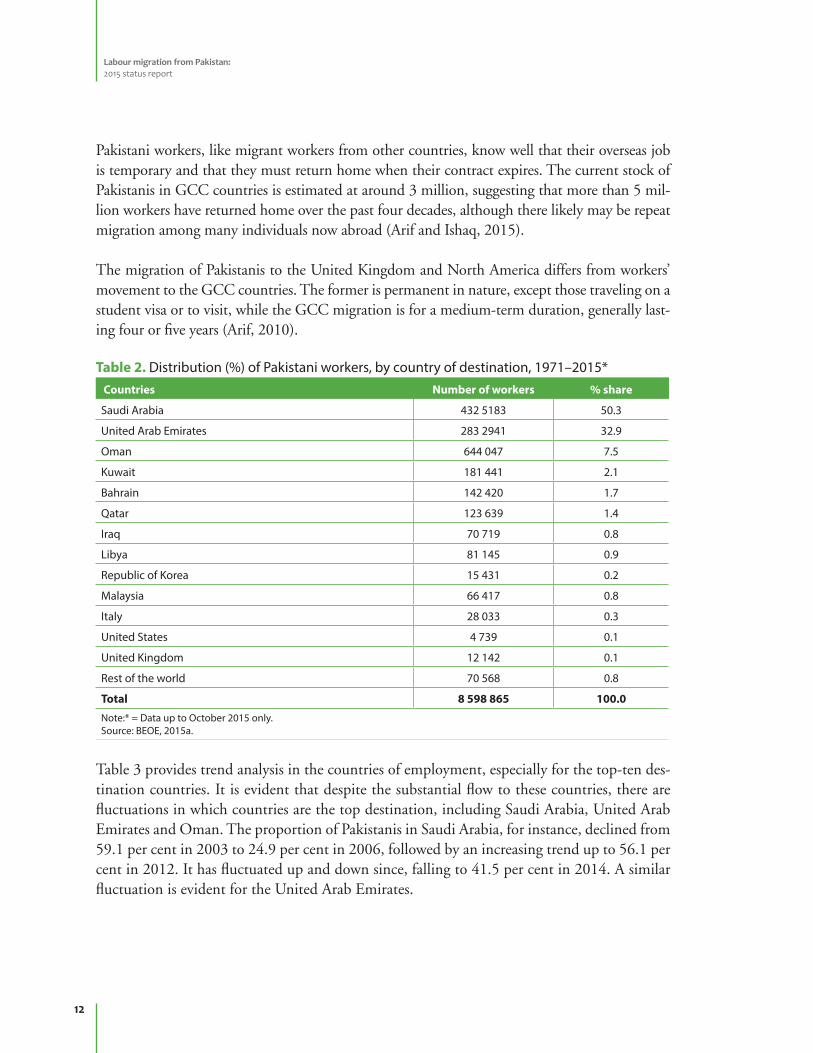
Since the mid-1970s when the dramatic increase in oil prices and resulting economic boom in-duced large-scale temporary and circular labour migration to GCC countries, Pakistan has sent workers to the Middle East as well as to other parts of the world, particularly the United King-dom, North America and Europe as new job opportunities opened up there. Table 2 reflects the distribution of workers, according to the BEOE records, going abroad for employment through the formal channel, with 95.9 per cent of them found in a GCC country. Mostly they went to Saudi Arabia (50.3 per cent) and United Arab Emirates (32.9 per cent) but also to Oman (7.5 per cent), Kuwait (2.1 per cent), Bahrain (1.7) and Qatar (1.4 per cent).
Labour migration from Pakistan: 2015 status report
12
Pakistani workers, like migrant workers from other countries, know well that their overseas job is temporary and that they must return home when their contract expires. The current stock of Pakistanis in GCC countries is estimated at around 3 million, suggesting that more than 5 mil-lion workers have returned home over the past four decades, although there likely may be repeat migration among many individuals now abroad (Arif and Ishaq, 2015).
The migration of Pakistanis to the United Kingdom and North America differs from workers’ movement to the GCC countries. The former is permanent in nature, except those traveling on a student visa or to visit, while the GCC migration is for a medium-term duration, generally last-ing four or five years (Arif, 2010).
Table 2. Distribution (%) of Pakistani workers, by country of destination, 1971–2015* Countries Number of workers % share
Saudi Arabia 432 5183 50.3
United Arab Emirates 283 2941 32.9
Oman 644 047 7.5
Kuwait 181 441 2.1
Bahrain 142 420 1.7
Qatar 123 639 1.4
Iraq 70 719 0.8
Libya 81 145 0.9
Republic of Korea 15 431 0.2
Malaysia 66 417 0.8
Italy 28 033 0.3
United States 4 739 0.1
United Kingdom 12 142 0.1
Rest of the world 70 568 0.8
Total 8 598 865 100.0
Note:* = Data up to October 2015 only.Source: BEOE, 2015a.
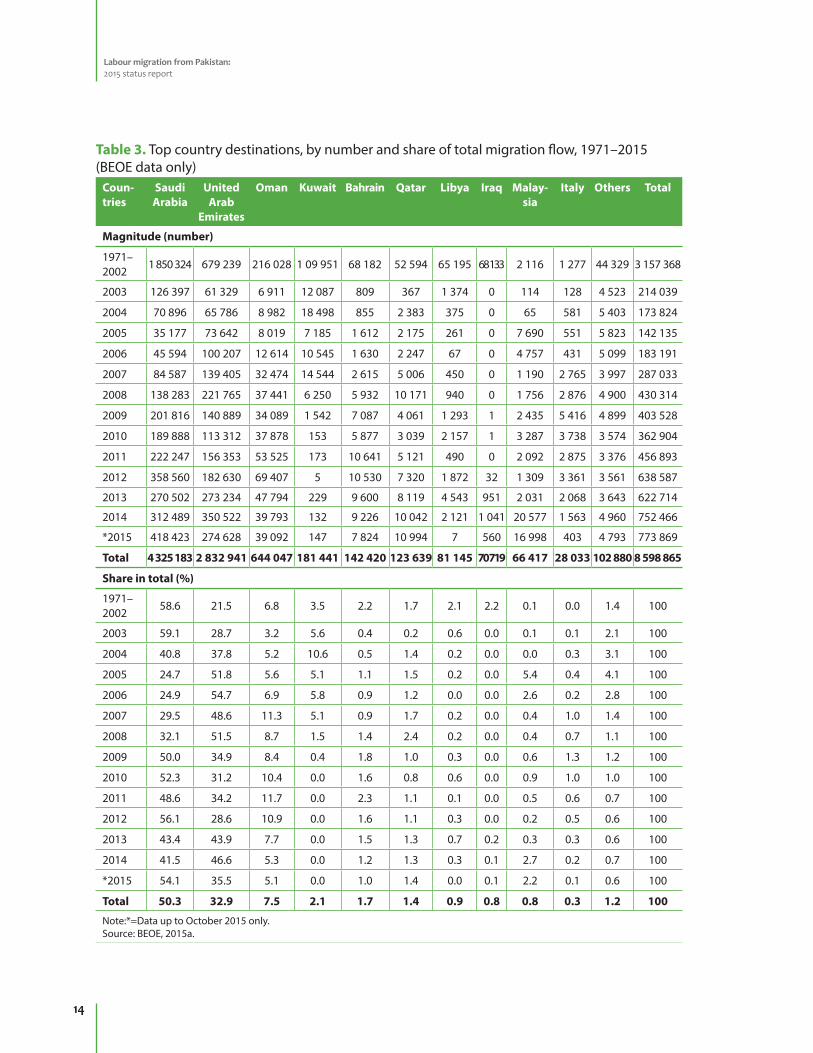
Table 3 provides trend analysis in the countries of employment, especially for the top-ten des-tination countries. It is evident that despite the substantial flow to these countries, there are fluctuations in which countries are the top destination, including Saudi Arabia, United Arab Emirates and Oman. The proportion of Pakistanis in Saudi Arabia, for instance, declined from 59.1 per cent in 2003 to 24.9 per cent in 2006, followed by an increasing trend up to 56.1 per cent in 2012. It has fluctuated up and down since, falling to 41.5 per cent in 2014. A similar fluctuation is evident for the United Arab Emirates.
Labour migration from Pakistan: 2015 status report
13
Saudi Arabia and the United Arab Emirates share an interesting trend. Both countries have constituted more than 80 per cent of all migrant workers going abroad through the formal channel over the past 15 years. But whenever there is a decline in migrant workers to Saudi Arabia, there is an increasing trend to the United Arab Emirates, and vice versa. Although both countries remain top destinations for Pakistani workers, the fluctuations could be related to the shift of demand from infrastructure development after the completion of projects to the maintenance sector, competition from other labour-exporting countries and/or the impact of the uneducated labour force of Pakistan (Arif, 2010).
The choice of destination country is mainly influenced by the easy access to a job market, the wage structure and the nature of jobs available. The job market in the GCC region has shown great fluctuation in terms of the placement of Pakistani workers through the formal channel. The first peak occurred in 1977 and then in 1981. The annual placement was far fewer than 100,000 workers, particularly between 1984 and 1989. After the Gulf War that began in 1990, the placements reached a record high (at that time) of 195,000 workers but then remained low in the second half of the 1990s. The placements increased from 123,500 in 2001 to 207,900 in 2003. After a decline during the next two years, an upward trend began, reaching a new peak in 2008 when 419,843 workers went abroad to GCC countries.
The global financial crisis had a significant impact on the job market for Pakistani workers in the GCC region. The number of workers going to the GCC countries declined to 350,146 in 2010. Recent construction activities have renewed the demand for Pakistani workers, with the number of migrant workers reaching the largest to date, at 773,869 for the first ten months of 2015.
Labour migration from Pakistan: 2015 status report
14
Table 3. Top country destinations, by number and share of total migration flow, 1971–2015 (BEOE data only)
Coun-tries
Saudi Arabia
United Arab
Emirates
Oman Kuwait Bahrain Qatar Libya Iraq Malay-sia
Italy Others Total
Magnitude (number)
1971–2002
1 850 324 679 239 216 028 1 09 951 68 182 52 594 65 195 68 133 2 116 1 277 44 329 3 157 368
2003 126 397 61 329 6 911 12 087 809 367 1 374 0 114 128 4 523 214 039
2004 70 896 65 786 8 982 18 498 855 2 383 375 0 65 581 5 403 173 824
2005 35 177 73 642 8 019 7 185 1 612 2 175 261 0 7 690 551 5 823 142 135
2006 45 594 100 207 12 614 10 545 1 630 2 247 67 0 4 757 431 5 099 183 191
2007 84 587 139 405 32 474 14 544 2 615 5 006 450 0 1 190 2 765 3 997 287 033
2008 138 283 221 765 37 441 6 250 5 932 10 171 940 0 1 756 2 876 4 900 430 314
2009 201 816 140 889 34 089 1 542 7 087 4 061 1 293 1 2 435 5 416 4 899 403 528
2010 189 888 113 312 37 878 153 5 877 3 039 2 157 1 3 287 3 738 3 574 362 904
2011 222 247 156 353 53 525 173 10 641 5 121 490 0 2 092 2 875 3 376 456 893
2012 358 560 182 630 69 407 5 10 530 7 320 1 872 32 1 309 3 361 3 561 638 587
2013 270 502 273 234 47 794 229 9 600 8 119 4 543 951 2 031 2 068 3 643 622 714
2014 312 489 350 522 39 793 132 9 226 10 042 2 121 1 041 20 577 1 563 4 960 752 466
*2015 418 423 274 628 39 092 147 7 824 10 994 7 560 16 998 403 4 793 773 869
Total 4 325 183 2 832 941 644 047 181 441 142 420 123 639 81 145 70 719 66 417 28 033 102 880 8 598 865
Share in total (%)
1971–2002
58.6 21.5 6.8 3.5 2.2 1.7 2.1 2.2 0.1 0.0 1.4 100
2003 59.1 28.7 3.2 5.6 0.4 0.2 0.6 0.0 0.1 0.1 2.1 100
2004 40.8 37.8 5.2 10.6 0.5 1.4 0.2 0.0 0.0 0.3 3.1 100
2005 24.7 51.8 5.6 5.1 1.1 1.5 0.2 0.0 5.4 0.4 4.1 100
2006 24.9 54.7 6.9 5.8 0.9 1.2 0.0 0.0 2.6 0.2 2.8 100
2007 29.5 48.6 11.3 5.1 0.9 1.7 0.2 0.0 0.4 1.0 1.4 100
2008 32.1 51.5 8.7 1.5 1.4 2.4 0.2 0.0 0.4 0.7 1.1 100
2009 50.0 34.9 8.4 0.4 1.8 1.0 0.3 0.0 0.6 1.3 1.2 100
2010 52.3 31.2 10.4 0.0 1.6 0.8 0.6 0.0 0.9 1.0 1.0 100
2011 48.6 34.2 11.7 0.0 2.3 1.1 0.1 0.0 0.5 0.6 0.7 100
2012 56.1 28.6 10.9 0.0 1.6 1.1 0.3 0.0 0.2 0.5 0.6 100
2013 43.4 43.9 7.7 0.0 1.5 1.3 0.7 0.2 0.3 0.3 0.6 100
2014 41.5 46.6 5.3 0.0 1.2 1.3 0.3 0.1 2.7 0.2 0.7 100
*2015 54.1 35.5 5.1 0.0 1.0 1.4 0.0 0.1 2.2 0.1 0.6 100
Total 50.3 32.9 7.5 2.1 1.7 1.4 0.9 0.8 0.8 0.3 1.2 100
Note:*=Data up to October 2015 only.Source: BEOE, 2015a.
Labour migration from Pakistan: 2015 status report
15
2.4. Skill composition of migrant workers
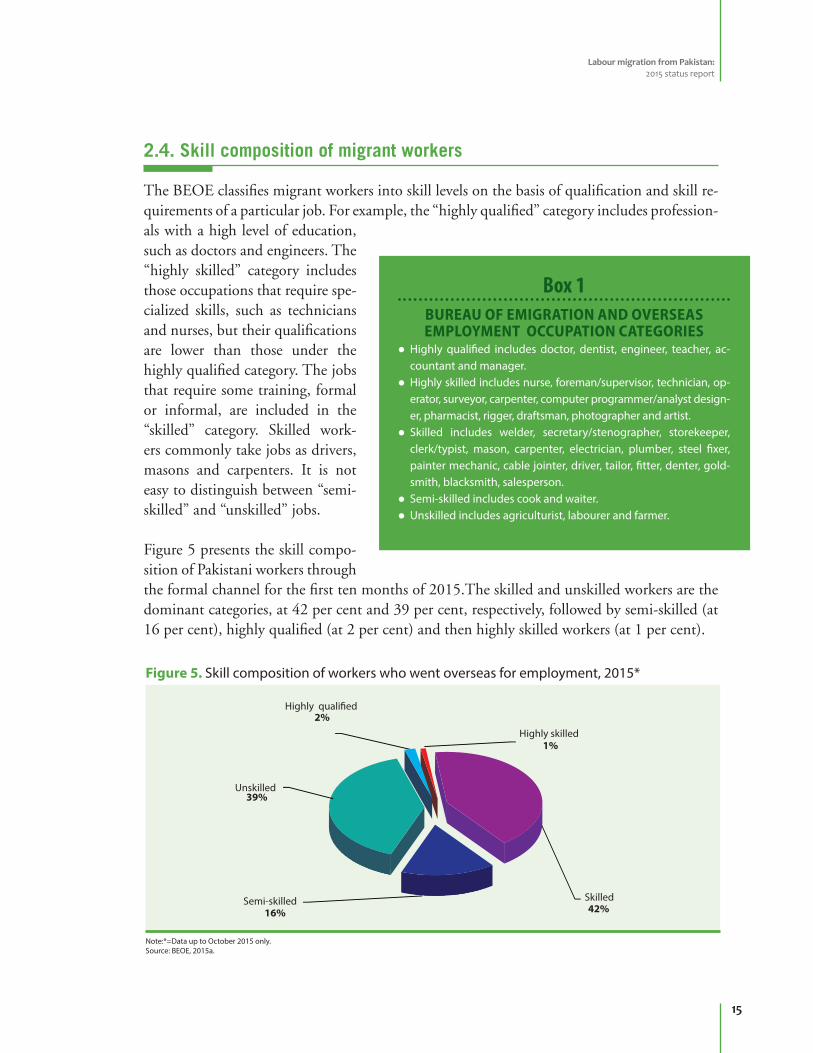
The BEOE classifies migrant workers into skill levels on the basis of qualification and skill re-quirements of a particular job. For example, the “highly qualified” category includes profession-als with a high level of education, such as doctors and engineers. The “highly skilled” category includes those occupations that require spe-cialized skills, such as technicians and nurses, but their qualifications are lower than those under the highly qualified category. The jobs that require some training, formal or informal, are included in the “skilled” category. Skilled work-ers commonly take jobs as drivers, masons and carpenters. It is not easy to distinguish between “semi-skilled” and “unskilled” jobs.
Figure 5 presents the skill compo-sition of Pakistani workers through the formal channel for the first ten months of 2015.The skilled and unskilled workers are the dominant categories, at 42 per cent and 39 per cent, respectively, followed by semi-skilled (at 16 per cent), highly qualified (at 2 per cent) and then highly skilled workers (at 1 per cent).
Box 1BUREAU OF EMIGRATION AND OVERSEAS EMPLOYMENT OCCUPATION CATEGORIES
Highly qualified includes doctor, dentist, engineer, teacher, ac-countant and manager.
Highly skilled includes nurse, foreman/supervisor, technician, op-erator, surveyor, carpenter, computer programmer/analyst design-er, pharmacist, rigger, draftsman, photographer and artist.
Skilled includes welder, secretary/stenographer, storekeeper, clerk/typist, mason, carpenter, electrician, plumber, steel fixer, painter mechanic, cable jointer, driver, tailor, fitter, denter, gold-smith, blacksmith, salesperson.
Semi-skilled includes cook and waiter. Unskilled includes agriculturist, labourer and farmer.
Figure 5. Skill composition of workers who went overseas for employment, 2015*
Note:*=Data up to October 2015 only.Source: BEOE, 2015a.
Highly qualified
Unskilled
Highly skilled
Skilled Semi-skilled
Labour migration from Pakistan: 2015 status report
16
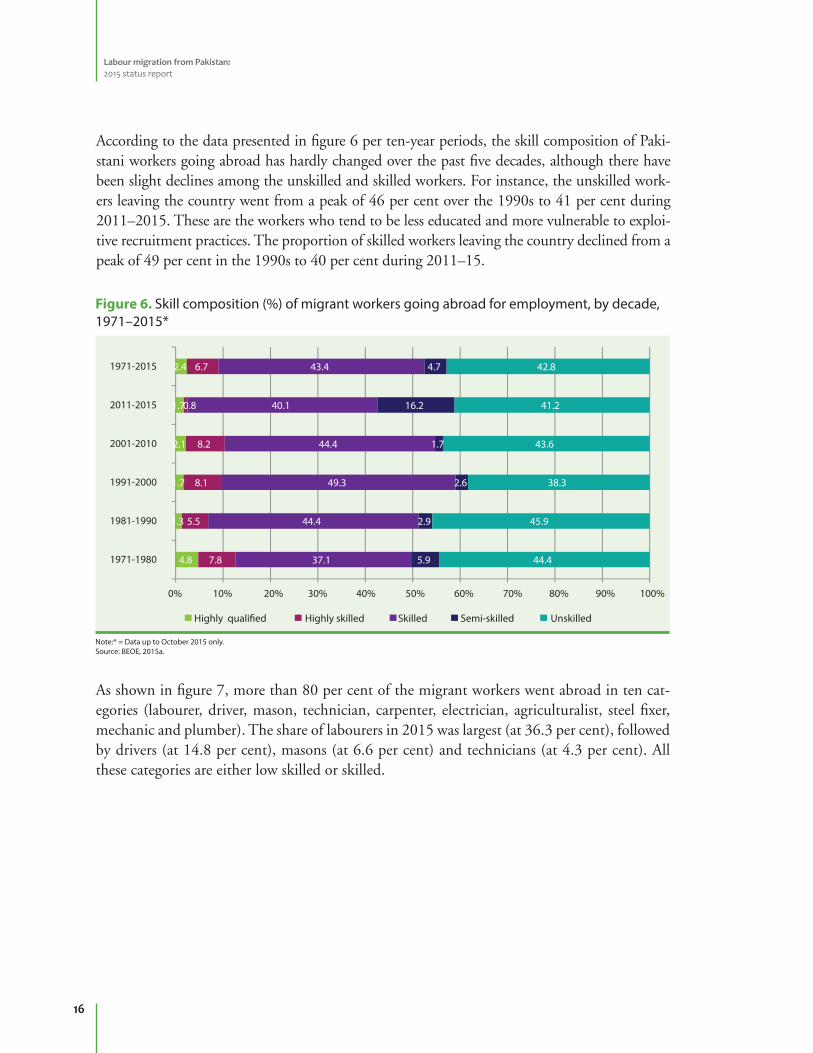
According to the data presented in figure 6 per ten-year periods, the skill composition of Paki-stani workers going abroad has hardly changed over the past five decades, although there have been slight declines among the unskilled and skilled workers. For instance, the unskilled work-ers leaving the country went from a peak of 46 per cent over the 1990s to 41 per cent during 2011–2015. These are the workers who tend to be less educated and more vulnerable to exploi-tive recruitment practices. The proportion of skilled workers leaving the country declined from a peak of 49 per cent in the 1990s to 40 per cent during 2011–15.
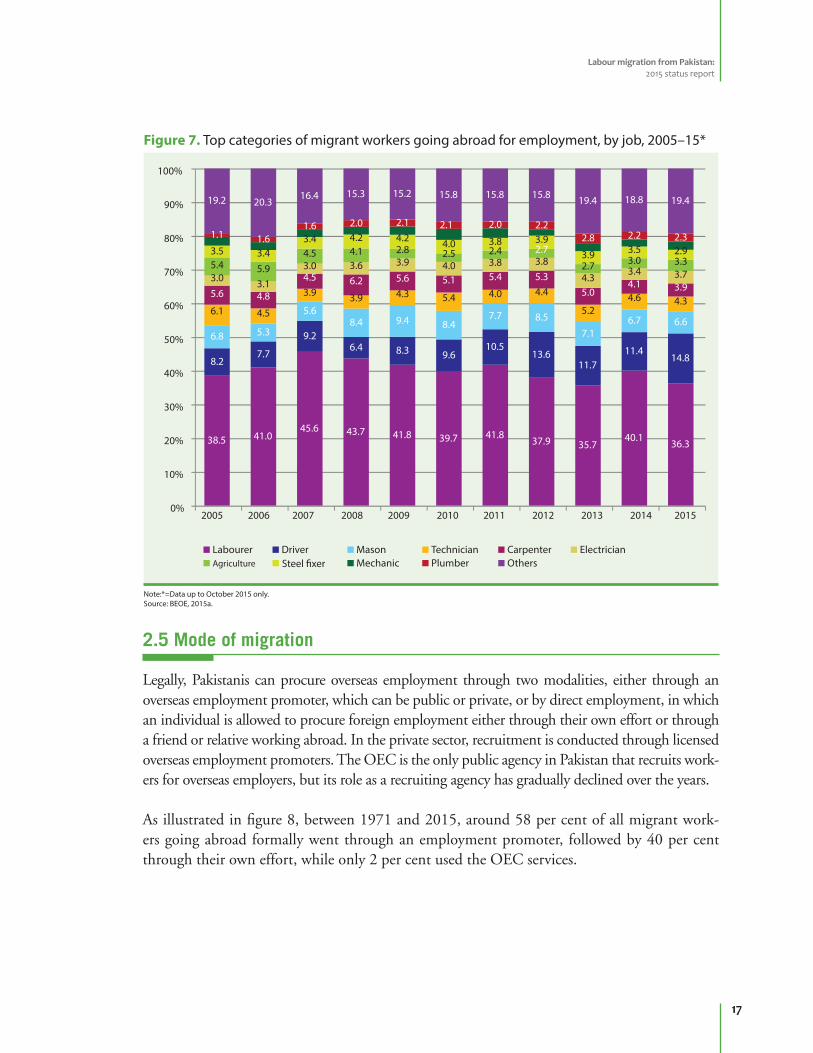
As shown in figure 7, more than 80 per cent of the migrant workers went abroad in ten cat-egories (labourer, driver, mason, technician, carpenter, electrician, agriculturalist, steel fixer, mechanic and plumber). The share of labourers in 2015 was largest (at 36.3 per cent), followed by drivers (at 14.8 per cent), masons (at 6.6 per cent) and technicians (at 4.3 per cent). All these categories are either low skilled or skilled.
Figure 6. Skill composition (%) of migrant workers going abroad for employment, by decade, 1971–2015*
Note:* = Data up to October 2015 only.Source: BEOE, 2015a.
Highly qualified Highly skilled Skilled Semi-skilled Unskilled
Labour migration from Pakistan: 2015 status report
17
2.5 Mode of migration
Legally, Pakistanis can procure overseas employment through two modalities, either through an overseas employment promoter, which can be public or private, or by direct employment, in which an individual is allowed to procure foreign employment either through their own effort or through a friend or relative working abroad. In the private sector, recruitment is conducted through licensed overseas employment promoters. The OEC is the only public agency in Pakistan that recruits work-ers for overseas employers, but its role as a recruiting agency has gradually declined over the years.
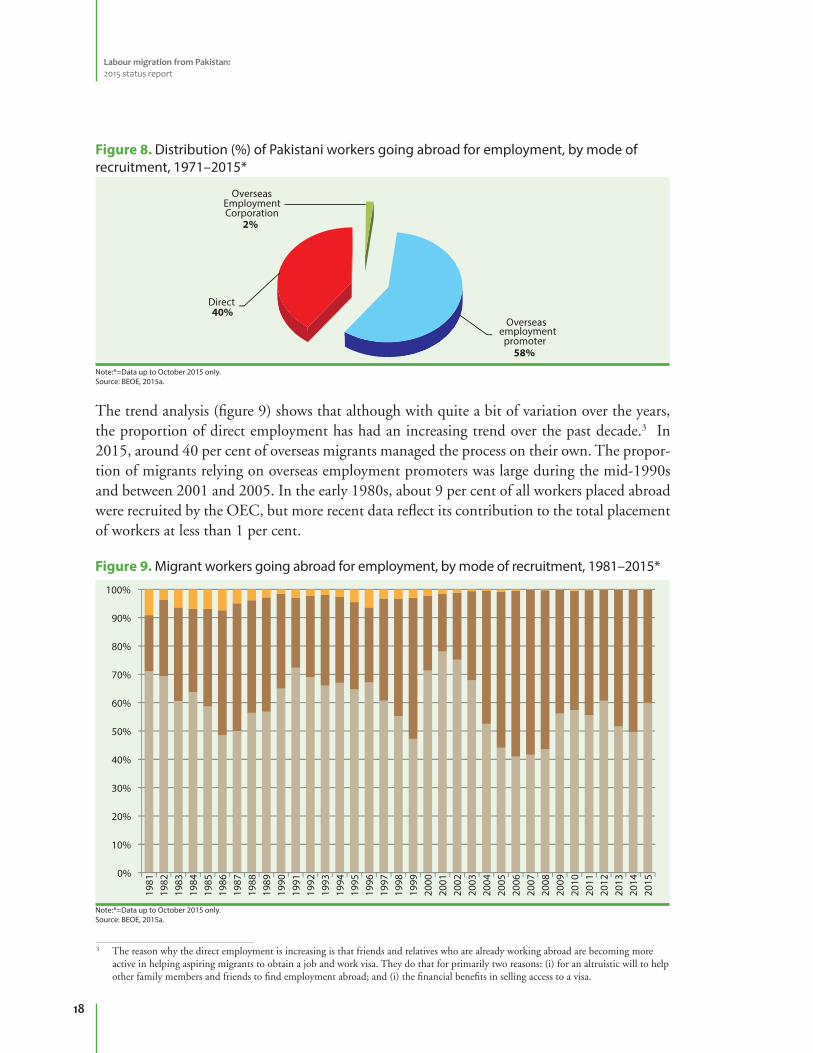
As illustrated in figure 8, between 1971 and 2015, around 58 per cent of all migrant work-ers going abroad formally went through an employment promoter, followed by 40 per cent through their own effort, while only 2 per cent used the OEC services.
Figure 7. Top categories of migrant workers going abroad for employment, by job, 2005–15*
Note:*=Data up to October 2015 only.Source: BEOE, 2015a.
Steel fixer
Labour migration from Pakistan: 2015 status report
18
3 The reason why the direct employment is increasing is that friends and relatives who are already working abroad are becoming more active in helping aspiring migrants to obtain a job and work visa. They do that for primarily two reasons: (i) for an altruistic will to help other family members and friends to find employment abroad; and (i) the financial benefits in selling access to a visa.
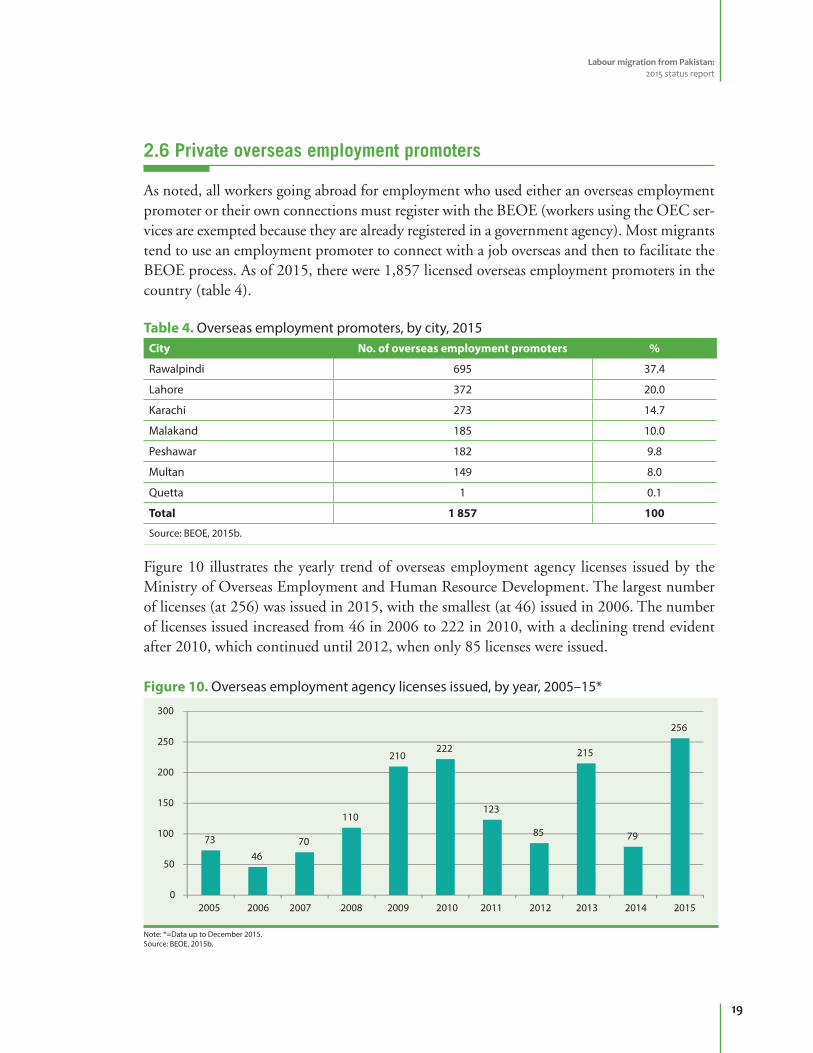
The trend analysis (figure 9) shows that although with quite a bit of variation over the years, the proportion of direct employment has had an increasing trend over the past decade.3 In 2015, around 40 per cent of overseas migrants managed the process on their own. The propor-tion of migrants relying on overseas employment promoters was large during the mid-1990s and between 2001 and 2005. In the early 1980s, about 9 per cent of all workers placed abroad were recruited by the OEC, but more recent data reflect its contribution to the total placement of workers at less than 1 per cent.
Figure 9. Migrant workers going abroad for employment, by mode of recruitment, 1981–2015*
Note:*=Data up to October 2015 only.Source: BEOE, 2015a.
Figure 8. Distribution (%) of Pakistani workers going abroad for employment, by mode of recruitment, 1971–2015*
Note:*=Data up to October 2015 only.Source: BEOE, 2015a.
Labour migration from Pakistan: 2015 status report
19
Figure 10. Overseas employment agency licenses issued, by year, 2005–15*
Note: *=Data up to December 2015.Source: BEOE, 2015b.
2.6 Private overseas employment promoters
As noted, all workers going abroad for employment who used either an overseas employment promoter or their own connections must register with the BEOE (workers using the OEC ser-vices are exempted because they are already registered in a government agency). Most migrants tend to use an employment promoter to connect with a job overseas and then to facilitate the BEOE process. As of 2015, there were 1,857 licensed overseas employment promoters in the country (table 4).
Table 4. Overseas employment promoters, by city, 2015City No. of overseas employment promoters %
Rawalpindi 695 37.4
Lahore 372 20.0
Karachi 273 14.7
Malakand 185 10.0
Peshawar 182 9.8
Multan 149 8.0
Quetta 1 0.1
Total 1 857 100
Source: BEOE, 2015b.
Figure 10 illustrates the yearly trend of overseas employment agency licenses issued by the Ministry of Overseas Employment and Human Resource Development. The largest number of licenses (at 256) was issued in 2015, with the smallest (at 46) issued in 2006. The number of licenses issued increased from 46 in 2006 to 222 in 2010, with a declining trend evident after 2010, which continued until 2012, when only 85 licenses were issued.
Labour migration from Pakistan: 2015 status report
20
Cancellation of a recruitment agency’s licenseThe Government pays special attention to the activities of overseas employment promoters and agents, which are closely monitored and supervised by the Protector of Emigrants.
The Emigration Ordinance, 1979 contains special provisions for complaints by migrant work-ers within and outside Pakistan. A worker can file a complaint against an overseas employment promoter at the Protector of Emigrants Office. Under Rule 28 of the 1979 Emigration Rules, a migrant worker must register a complaint against a promoter within the first six months of starting a job overseas. The complaint matter is referred to the BEOE Director General, BEOE for appropriate action (suspension or cancellation of the licence or otherwise) after a Protector of Emigrants officer investigates the case and finds a valid complaint. The Protector of Emi-grants officer issues a “show cause” notice (under Section 12(3) of the Emigration Ordinance) to the overseas employment promoter, leading to a hearing and a decision on its merits.
The BEOE Director General can cancel the license when the complaint is of a serious nature. The promoter then has the right of appeal within a period of 30 days.
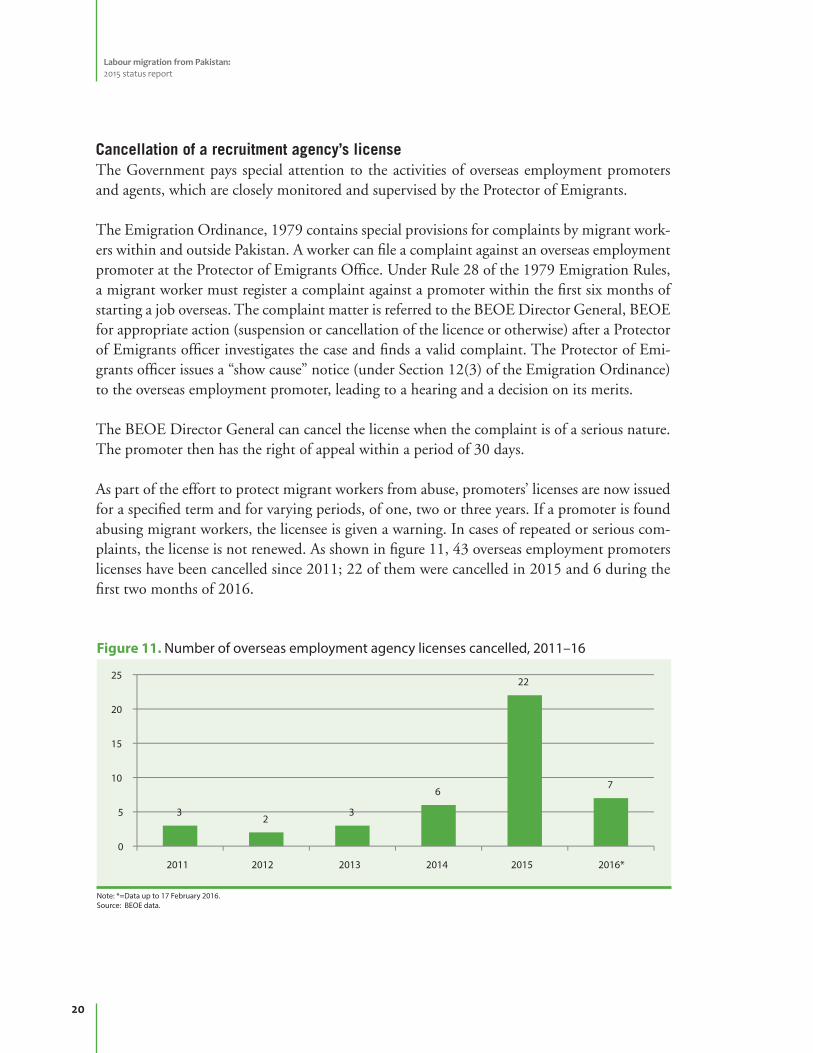
As part of the effort to protect migrant workers from abuse, promoters’ licenses are now issued for a specified term and for varying periods, of one, two or three years. If a promoter is found abusing migrant workers, the licensee is given a warning. In cases of repeated or serious com-plaints, the license is not renewed. As shown in figure 11, 43 overseas employment promoters licenses have been cancelled since 2011; 22 of them were cancelled in 2015 and 6 during the first two months of 2016.
Figure 11. Number of overseas employment agency licenses cancelled, 2011–16
Note: *=Data up to 17 February 2016. Source: BEOE data.
Labour migration from Pakistan: 2015 status report
21
2.7 Irregular migration
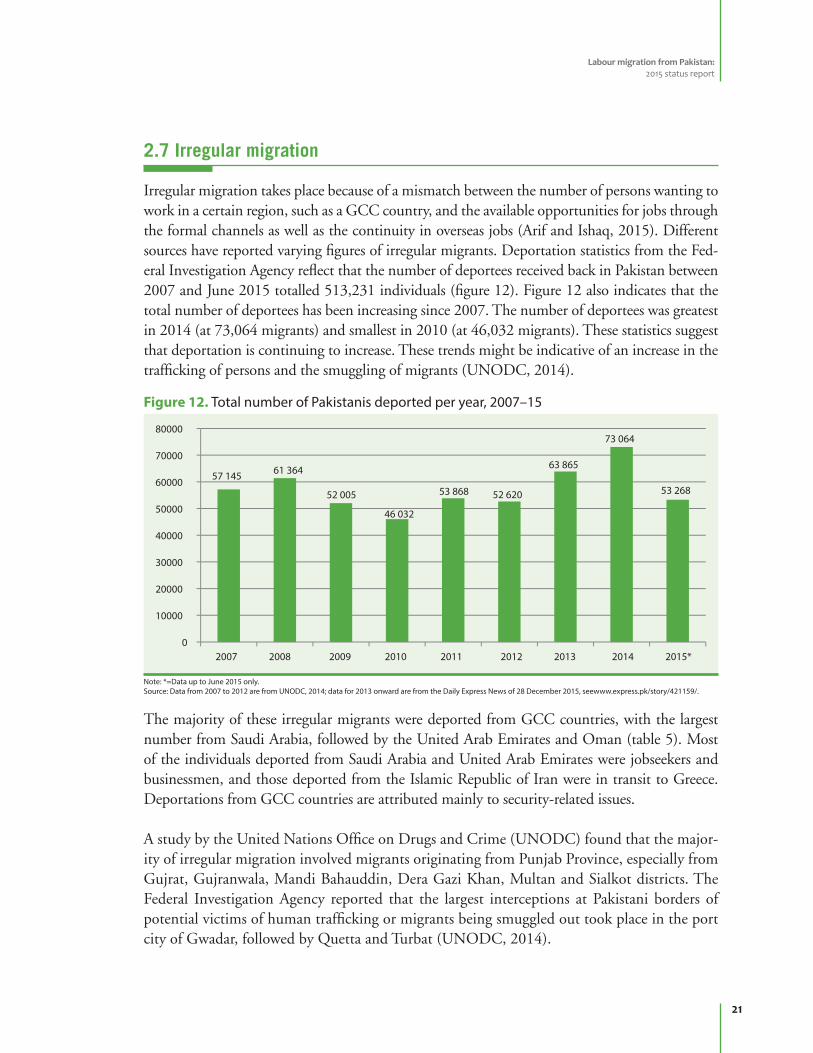
Irregular migration takes place because of a mismatch between the number of persons wanting to work in a certain region, such as a GCC country, and the available opportunities for jobs through the formal channels as well as the continuity in overseas jobs (Arif and Ishaq, 2015). Different sources have reported varying figures of irregular migrants. Deportation statistics from the Fed-eral Investigation Agency reflect that the number of deportees received back in Pakistan between 2007 and June 2015 totalled 513,231 individuals (figure 12). Figure 12 also indicates that the total number of deportees has been increasing since 2007. The number of deportees was greatest in 2014 (at 73,064 migrants) and smallest in 2010 (at 46,032 migrants). These statistics suggest that deportation is continuing to increase. These trends might be indicative of an increase in the trafficking of persons and the smuggling of migrants (UNODC, 2014).
Figure 12. Total number of Pakistanis deported per year, 2007–15
Note: *=Data up to June 2015 only.Source: Data from 2007 to 2012 are from UNODC, 2014; data for 2013 onward are from the Daily Express News of 28 December 2015, seewww.express.pk/story/421159/.
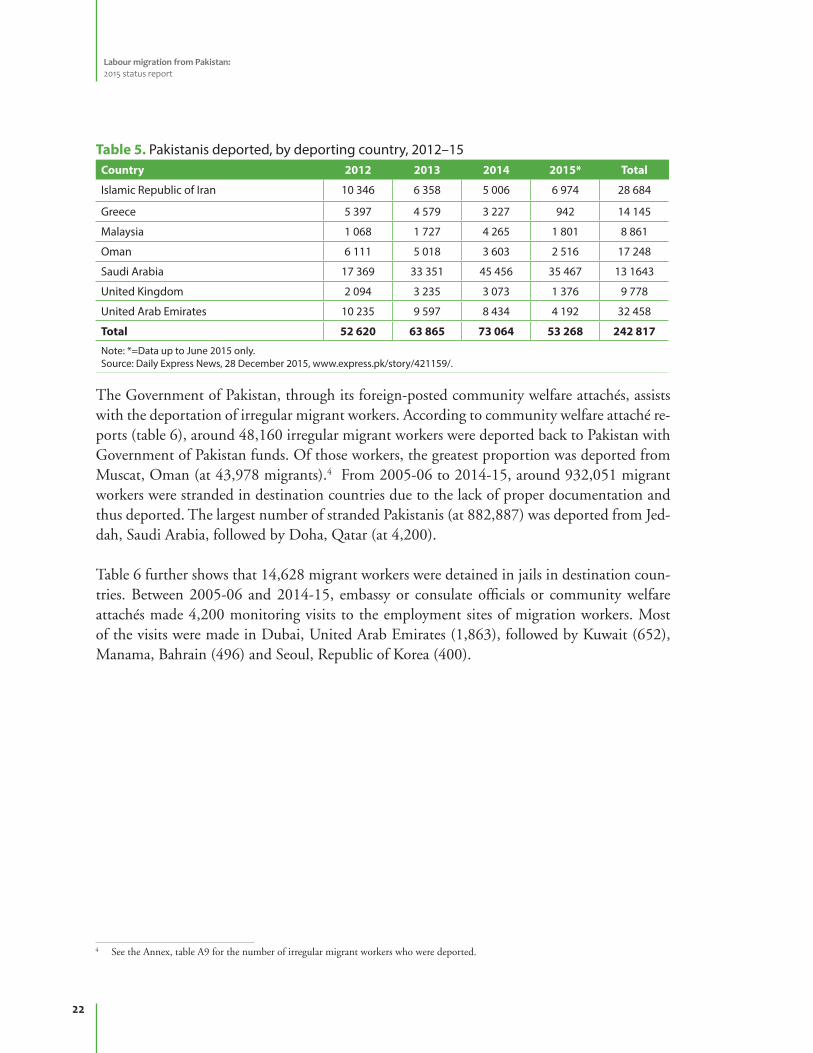
The majority of these irregular migrants were deported from GCC countries, with the largest number from Saudi Arabia, followed by the United Arab Emirates and Oman (table 5). Most of the individuals deported from Saudi Arabia and United Arab Emirates were jobseekers and businessmen, and those deported from the Islamic Republic of Iran were in transit to Greece. Deportations from GCC countries are attributed mainly to security-related issues.
A study by the United Nations Office on Drugs and Crime (UNODC) found that the major-ity of irregular migration involved migrants originating from Punjab Province, especially from Gujrat, Gujranwala, Mandi Bahauddin, Dera Gazi Khan, Multan and Sialkot districts. The Federal Investigation Agency reported that the largest interceptions at Pakistani borders of potential victims of human trafficking or migrants being smuggled out took place in the port city of Gwadar, followed by Quetta and Turbat (UNODC, 2014).
Labour migration from Pakistan: 2015 status report
22
Table 5. Pakistanis deported, by deporting country, 2012–15Country 2012 2013 2014 2015* Total
Islamic Republic of Iran 10 346 6 358 5 006 6 974 28 684
Greece 5 397 4 579 3 227 942 14 145
Malaysia 1 068 1 727 4 265 1 801 8 861
Oman 6 111 5 018 3 603 2 516 17 248
Saudi Arabia 17 369 33 351 45 456 35 467 13 1643
United Kingdom 2 094 3 235 3 073 1 376 9 778
United Arab Emirates 10 235 9 597 8 434 4 192 32 458
Total 52 620 63 865 73 064 53 268 242 817
Note: *=Data up to June 2015 only.Source: Daily Express News, 28 December 2015, www.express.pk/story/421159/.
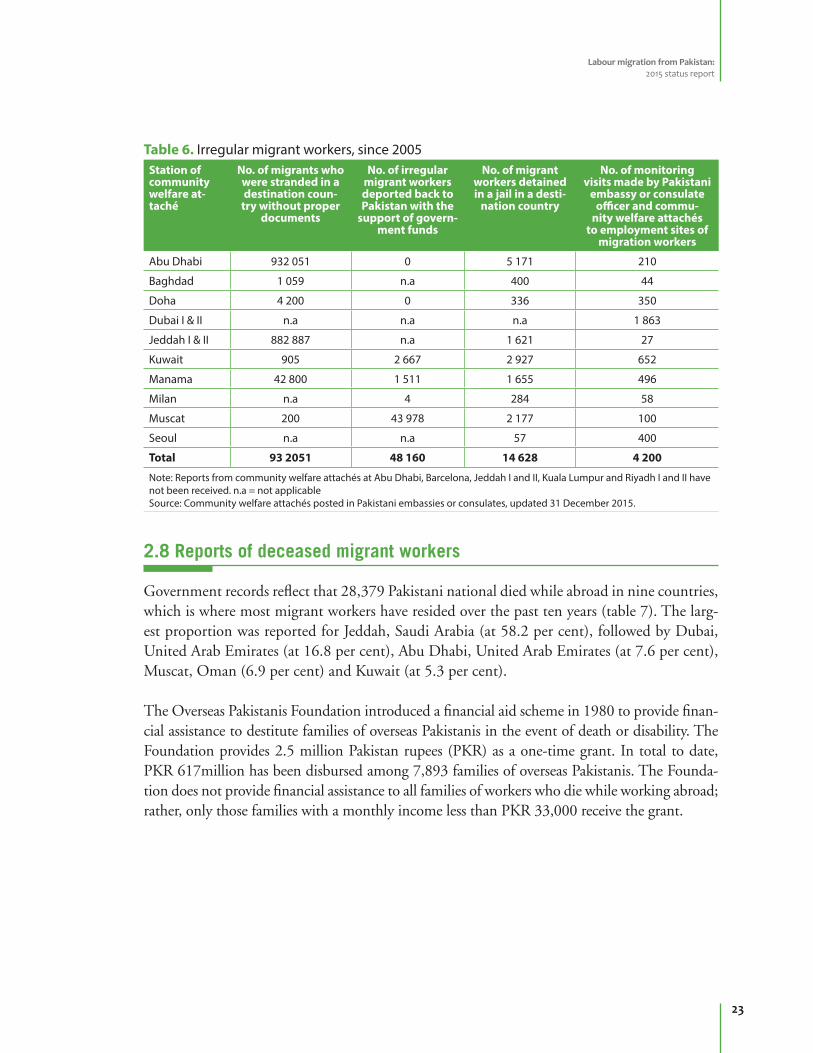
The Government of Pakistan, through its foreign-posted community welfare attachés, assists with the deportation of irregular migrant workers. According to community welfare attaché re-ports (table 6), around 48,160 irregular migrant workers were deported back to Pakistan with Government of Pakistan funds. Of those workers, the greatest proportion was deported from Muscat, Oman (at 43,978 migrants).4 From 2005-06 to 2014-15, around 932,051 migrant workers were stranded in destination countries due to the lack of proper documentation and thus deported. The largest number of stranded Pakistanis (at 882,887) was deported from Jed-dah, Saudi Arabia, followed by Doha, Qatar (at 4,200).
Table 6 further shows that 14,628 migrant workers were detained in jails in destination coun-tries. Between 2005-06 and 2014-15, embassy or consulate officials or community welfare attachés made 4,200 monitoring visits to the employment sites of migration workers. Most of the visits were made in Dubai, United Arab Emirates (1,863), followed by Kuwait (652), Manama, Bahrain (496) and Seoul, Republic of Korea (400).
4 See the Annex, table A9 for the number of irregular migrant workers who were deported.
Labour migration from Pakistan: 2015 status report
23
Table 6. Irregular migrant workers, since 2005Station of community welfare at-taché
No. of migrants who were stranded in a destination coun-
try without proper documents
No. of irregular migrant workers deported back to Pakistan with the
support of govern-ment funds
No. of migrant workers detained in a jail in a desti-
nation country
No. of monitoring visits made by Pakistani
embassy or consulate officer and commu-
nity welfare attachés to employment sites of
migration workers
Abu Dhabi 932 051 0 5 171 210
Baghdad 1 059 n.a 400 44
Doha 4 200 0 336 350
Dubai I & II n.a n.a n.a 1 863
Jeddah I & II 882 887 n.a 1 621 27
Kuwait 905 2 667 2 927 652
Manama 42 800 1 511 1 655 496
Milan n.a 4 284 58
Muscat 200 43 978 2 177 100
Seoul n.a n.a 57 400
Total 93 2051 48 160 14 628 4 200
Note: Reports from community welfare attachés at Abu Dhabi, Barcelona, Jeddah I and II, Kuala Lumpur and Riyadh I and II have not been received. n.a = not applicable Source: Community welfare attachés posted in Pakistani embassies or consulates, updated 31 December 2015.
2.8 Reports of deceased migrant workers
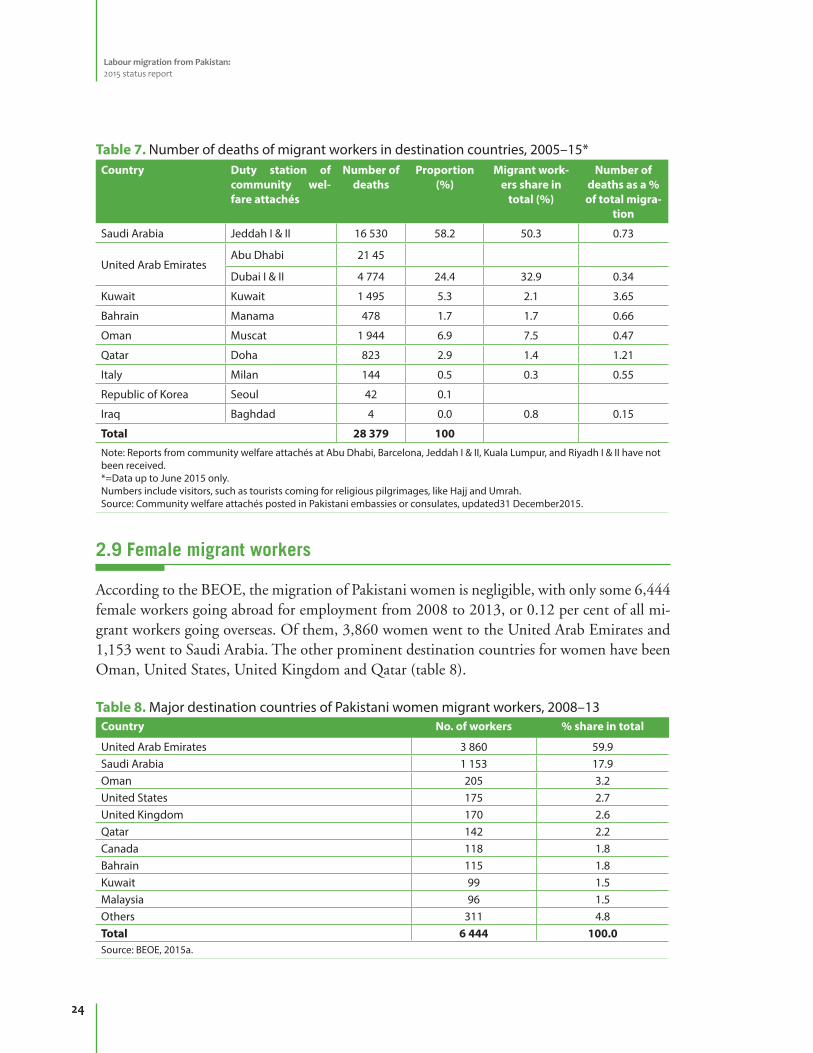
Government records reflect that 28,379 Pakistani national died while abroad in nine countries, which is where most migrant workers have resided over the past ten years (table 7). The larg-est proportion was reported for Jeddah, Saudi Arabia (at 58.2 per cent), followed by Dubai, United Arab Emirates (at 16.8 per cent), Abu Dhabi, United Arab Emirates (at 7.6 per cent), Muscat, Oman (6.9 per cent) and Kuwait (at 5.3 per cent).
The Overseas Pakistanis Foundation introduced a financial aid scheme in 1980 to provide finan-cial assistance to destitute families of overseas Pakistanis in the event of death or disability. The Foundation provides 2.5 million Pakistan rupees (PKR) as a one-time grant. In total to date, PKR 617million has been disbursed among 7,893 families of overseas Pakistanis. The Founda-tion does not provide financial assistance to all families of workers who die while working abroad; rather, only those families with a monthly income less than PKR 33,000 receive the grant.
Labour migration from Pakistan: 2015 status report
24
Table 7. Number of deaths of migrant workers in destination countries, 2005–15*Country Duty station of
community wel-fare attachés
Number of deaths
Proportion (%)
Migrant work-ers share in
total (%)
Number of deaths as a % of total migra-
tion
Saudi Arabia Jeddah I & II 16 530 58.2 50.3 0.73
United Arab EmiratesAbu Dhabi 21 45
Dubai I & II 4 774 24.4 32.9 0.34
Kuwait Kuwait 1 495 5.3 2.1 3.65
Bahrain Manama 478 1.7 1.7 0.66
Oman Muscat 1 944 6.9 7.5 0.47
Qatar Doha 823 2.9 1.4 1.21
Italy Milan 144 0.5 0.3 0.55
Republic of Korea Seoul 42 0.1
Iraq Baghdad 4 0.0 0.8 0.15
Total 28 379 100
Note: Reports from community welfare attachés at Abu Dhabi, Barcelona, Jeddah I & II, Kuala Lumpur, and Riyadh I & II have not been received.*=Data up to June 2015 only.Numbers include visitors, such as tourists coming for religious pilgrimages, like Hajj and Umrah. Source: Community welfare attachés posted in Pakistani embassies or consulates, updated31 December2015.
2.9 Female migrant workers
According to the BEOE, the migration of Pakistani women is negligible, with only some 6,444 female workers going abroad for employment from 2008 to 2013, or 0.12 per cent of all mi-grant workers going overseas. Of them, 3,860 women went to the United Arab Emirates and 1,153 went to Saudi Arabia. The other prominent destination countries for women have been Oman, United States, United Kingdom and Qatar (table 8).
Table 8. Major destination countries of Pakistani women migrant workers, 2008–13Country No. of workers % share in total
United Arab Emirates 3 860 59.9Saudi Arabia 1 153 17.9Oman 205 3.2United States 175 2.7United Kingdom 170 2.6Qatar 142 2.2Canada 118 1.8Bahrain 115 1.8Kuwait 99 1.5Malaysia 96 1.5Others 311 4.8Total 6 444 100.0Source: BEOE, 2015a.

Labour migration from Pakistan: 2015 status report
25
The migration of Pakistani women is limited to a few occupations, primarily in the fields of health services, the finance sector, cosmetology and fashion designing, either due to social and cultural issues or to government permission (domestic work). Of the 6,444 women who migrated for work from 2008 to 2013, 1,437 worked as cleaners or housemaids (22.3 per cent), 753 worked as accountants (11.7 per cent), 662 as saleswomen (10.3 per cent) and the remainder worked as doctors, beauticians or nurses (table 9).
As per the 1979 Emigration Rules, the minimum age for women to seek a job abroad as a housemaid, ayas5 or governess is 35 years. The Government will relax the minimum age limit by five years in certain cases. The official explanation for the age ban is to protect women from abuse and exploitation associated with domestic work. Women continue to migrate for this type of work, though they are limited in number (government officials mentioned during the research for this report that these housemaids usually accompany employers they had worked with in Pakistan who move to another country).
Table 9. Number of Pakistani women migrant workers, by job, 2008–13Job No. workers % share of the total
Cleaner or housemaid 1 437 22.3Accountant 753 11.7Saleswoman 662 10.3Manager or investor 607 9.4Clerk or typist 606 9.4Teacher or professor 462 7.2Doctor 445 6.9Beautician 284 4.4Nurse 272 4.2Baby care 148 2.3Others 768 11.9Total 6 444 100.0Source: BEOE, 2015a.
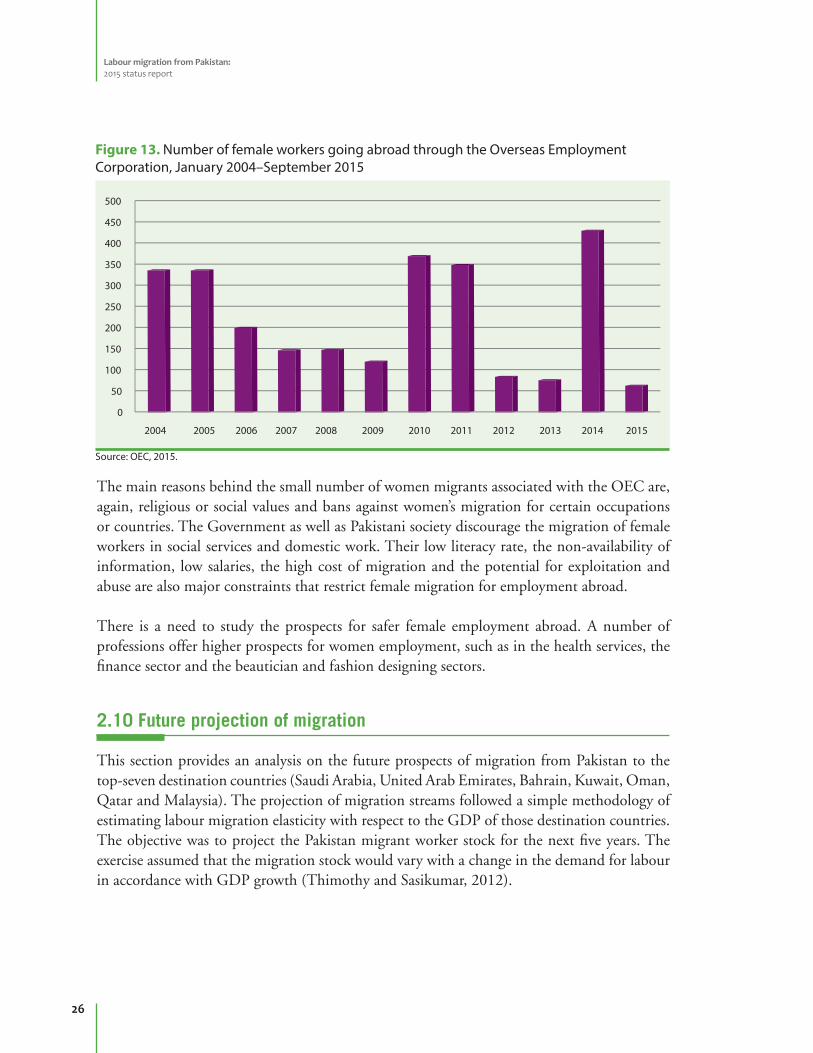
The OEC also facilitates female migration. According to the OEC data for 2004–15, some 2,659 women went abroad for employment (figure 13), with the majority (2,256) going to Saudi Arabia.
5 Aya is an Urdu word commonly used as alternate word for caregiver at home, hospitals and girl hostels.
Labour migration from Pakistan: 2015 status report
26
Figure 13. Number of female workers going abroad through the Overseas Employment Corporation, January 2004–September 2015
Source: OEC, 2015.
The main reasons behind the small number of women migrants associated with the OEC are, again, religious or social values and bans against women’s migration for certain occupations or countries. The Government as well as Pakistani society discourage the migration of female workers in social services and domestic work. Their low literacy rate, the non-availability of information, low salaries, the high cost of migration and the potential for exploitation and abuse are also major constraints that restrict female migration for employment abroad.
There is a need to study the prospects for safer female employment abroad. A number of professions offer higher prospects for women employment, such as in the health services, the finance sector and the beautician and fashion designing sectors.
2.10 Future projection of migration
This section provides an analysis on the future prospects of migration from Pakistan to the top-seven destination countries (Saudi Arabia, United Arab Emirates, Bahrain, Kuwait, Oman, Qatar and Malaysia). The projection of migration streams followed a simple methodology of estimating labour migration elasticity with respect to the GDP of those destination countries. The objective was to project the Pakistan migrant worker stock for the next five years. The exercise assumed that the migration stock would vary with a change in the demand for labour in accordance with GDP growth (Thimothy and Sasikumar, 2012).
Labour migration from Pakistan: 2015 status report
27
The employment elasticity approach to forecasting is extensively discussed in the literature, particularly for short-term projections(see Islam, 2002; Rangarajan, Kaul and Seema, 2007).6
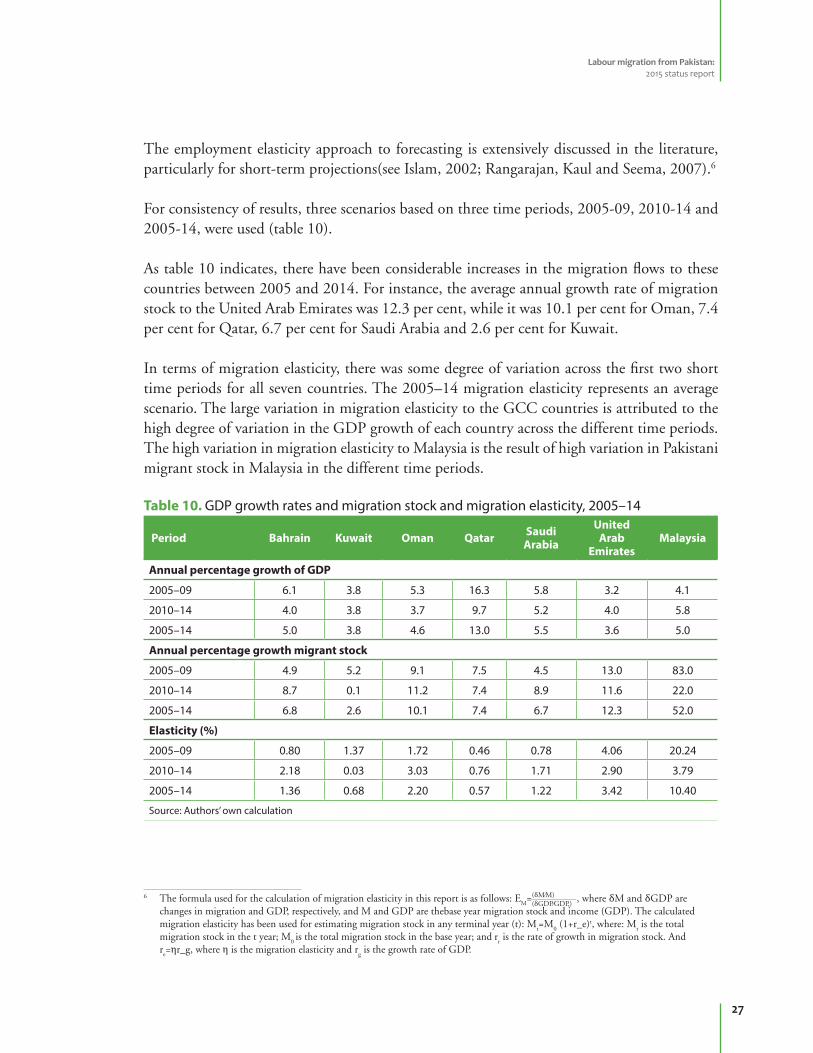
For consistency of results, three scenarios based on three time periods, 2005-09, 2010-14 and 2005-14, were used (table 10).
As table 10 indicates, there have been considerable increases in the migration flows to these countries between 2005 and 2014. For instance, the average annual growth rate of migration stock to the United Arab Emirates was 12.3 per cent, while it was 10.1 per cent for Oman, 7.4 per cent for Qatar, 6.7 per cent for Saudi Arabia and 2.6 per cent for Kuwait.
In terms of migration elasticity, there was some degree of variation across the first two short time periods for all seven countries. The 2005–14 migration elasticity represents an average scenario. The large variation in migration elasticity to the GCC countries is attributed to the high degree of variation in the GDP growth of each country across the different time periods. The high variation in migration elasticity to Malaysia is the result of high variation in Pakistani migrant stock in Malaysia in the different time periods.
Table 10. GDP growth rates and migration stock and migration elasticity, 2005–14
Period Bahrain Kuwait Oman Qatar Saudi Arabia
United Arab
EmiratesMalaysia
Annual percentage growth of GDP
2005–09 6.1 3.8 5.3 16.3 5.8 3.2 4.1
2010–14 4.0 3.8 3.7 9.7 5.2 4.0 5.8
2005–14 5.0 3.8 4.6 13.0 5.5 3.6 5.0
Annual percentage growth migrant stock
2005–09 4.9 5.2 9.1 7.5 4.5 13.0 83.0
2010–14 8.7 0.1 11.2 7.4 8.9 11.6 22.0
2005–14 6.8 2.6 10.1 7.4 6.7 12.3 52.0
Elasticity (%)
2005–09 0.80 1.37 1.72 0.46 0.78 4.06 20.24
2010–14 2.18 0.03 3.03 0.76 1.71 2.90 3.79
2005–14 1.36 0.68 2.20 0.57 1.22 3.42 10.40
Source: Authors’ own calculation
6 The formula used for the calculation of migration elasticity in this report is as follows: EM
=(δM⁄M)(δGDP⁄GDP,)
, where δM and δGDP are changes in migration and GDP, respectively, and M and GDP are thebase year migration stock and income (GDP). The calculated migration elasticity has been used for estimating migration stock in any terminal year (t): M
t=M
0 (1+r_e)t, where: M
t is the total
migration stock in the t year; M0 is the total migration stock in the base year; and r
r is the rate of growth in migration stock. And
re=ηr_g, where η is the migration elasticity and r
g is the growth rate of GDP.
Labour migration from Pakistan: 2015 status report
28
The growth in migration stock in the near future was calculated under all three time-period scenarios to provide estimates of Pakistani migration stock in the seven selected countries. The calculation relied on the migration elasticity reported in table 10 and the projected GDP7 of the seven countries up to 2020.
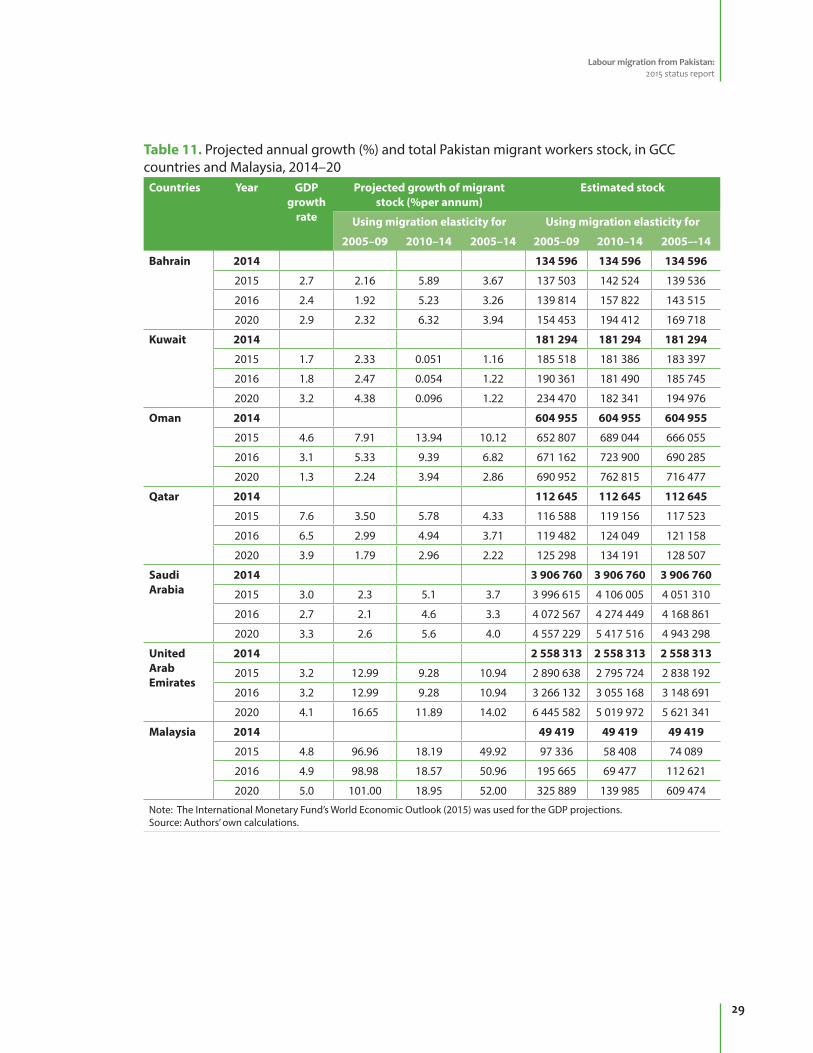
Table 11 shows the annual growth rate of GDP, annual growth rate of migration stock and the migration elasticity. All countries have experienced impressive growth in GDP over the past decades, despite the global financial crisis during 2007–09. The average GDP growth rate for 2005–14 varies, from 3.6 per cent in the United Arab Emirates to 13 per cent in Qatar. Bahrain, Malaysia and Saudi Arabia had similar significant growth in GDP, at 5 per cent, 5 per cent and 5.5 per cent, respectively.
The 2020 estimates indicate that the Pakistani migrant stock will likely vary between 150,000 and 190,000 workers in Bahrain, between 180,000 and 190,000 workers in Kuwait, between 640,000 and 760,000 workers in Oman and between 120,000 and 130,000 workers in Qatar.
As previously noted, the majority of overseas Pakistani migrants currently reside in Saudi Ara-bia and the United Arab Emirates. The 2020 projections indicate that the Pakistani migrant stock will likely vary between 4.5 million and 5.4 million in Saudi Arabia andbetween5 million and 6.4 million in the United Arab Emirates.
There is a high variation in Pakistani migrant stock in Malaysia, possibly due to the country being a popular destination only somewhat recently. A small change in the number of labour migrants to Malaysia, however, reflects high growth in the stock of migrant workers.
7 The data of projected real GDP growth are from the International Monetary Fund’s World Economic Outlook.
Labour migration from Pakistan: 2015 status report
29
Table 11. Projected annual growth (%) and total Pakistan migrant workers stock, in GCC countries and Malaysia, 2014–20
Countries Year GDP growth
rate
Projected growth of migrant stock (%per annum)
Estimated stock
Using migration elasticity for Using migration elasticity for
2005–09 2010–14 2005–14 2005–09 2010–14 2005–-14
Bahrain 2014 134 596 134 596 134 596
2015 2.7 2.16 5.89 3.67 137 503 142 524 139 536
2016 2.4 1.92 5.23 3.26 139 814 157 822 143 515
2020 2.9 2.32 6.32 3.94 154 453 194 412 169 718
Kuwait 2014 181 294 181 294 181 294
2015 1.7 2.33 0.051 1.16 185 518 181 386 183 397
2016 1.8 2.47 0.054 1.22 190 361 181 490 185 745
2020 3.2 4.38 0.096 1.22 234 470 182 341 194 976
Oman 2014 604 955 604 955 604 955
2015 4.6 7.91 13.94 10.12 652 807 689 044 666 055
2016 3.1 5.33 9.39 6.82 671 162 723 900 690 285
2020 1.3 2.24 3.94 2.86 690 952 762 815 716 477
Qatar 2014 112 645 112 645 112 645
2015 7.6 3.50 5.78 4.33 116 588 119 156 117 523
2016 6.5 2.99 4.94 3.71 119 482 124 049 121 158
2020 3.9 1.79 2.96 2.22 125 298 134 191 128 507
Saudi Arabia
2014 3 906 760 3 906 760 3 906 760
2015 3.0 2.3 5.1 3.7 3 996 615 4 106 005 4 051 310
2016 2.7 2.1 4.6 3.3 4 072 567 4 274 449 4 168 861
2020 3.3 2.6 5.6 4.0 4 557 229 5 417 516 4 943 298
United Arab Emirates
2014 2 558 313 2 558 313 2 558 313
2015 3.2 12.99 9.28 10.94 2 890 638 2 795 724 2 838 192
2016 3.2 12.99 9.28 10.94 3 266 132 3 055 168 3 148 691
2020 4.1 16.65 11.89 14.02 6 445 582 5 019 972 5 621 341
Malaysia 2014 49 419 49 419 49 419
2015 4.8 96.96 18.19 49.92 97 336 58 408 74 089
2016 4.9 98.98 18.57 50.96 195 665 69 477 112 621
2020 5.0 101.00 18.95 52.00 325 889 139 985 609 474
Note: The International Monetary Fund’s World Economic Outlook (2015) was used for the GDP projections.Source: Authors’ own calculations.

Labour migration from Pakistan: 2015 status report
30
The projection analysis indicated that the Pakistani migrant stock will likely be nearly 15.5 million in 2020, up from 7.6 million in the 2014 actual number of migrants (figure 14). This indicates an increase of more than 100 per cent under scenario 1 within a span of six years. Migrant workers will total nearly 11.9 million under scenario 2 and nearly 12.4 million under scenario 3 in 2020.
Figure 14. Projected migrant workers for 2020 in GCC countries and Malaysia (millions), based on actual migrant workers since 1970
Source: Author’s calculations, based on data in tables 10 and 11.
These projections are based on the assumption that all economic conditions in the destination countries will remain the same. However, the substantial decline in oil prices during 2014-15 might have negative consequences for migrant workers. Considering the major share that oil revenue constitutes in the GDP of the GCC countries, migration to these countries may in-crease at a slower pace than the projected rate due to the decrease in oil prices.
2.11 Cost of migration for low-skilled workers
A forthcoming ILO report on migration costs (ILO, KNOMAD and LSE) concludes that the average cost for a Pakistani worker to find a job in Saudi Arabia or the United Arab Emirates is PKR358,875($3,489). The average cost of migration to Saudi Arabia is considerably higher, at PKR441,266 ($4,290) than to the United Arab Emirates, at PKR242,542 ($2,358).
The reason for this difference is not clear, though; it could be attributed to the preference of Pakistanis for working in Saudi Arabia where the long-term prospects of finding employment are greater, given the size of the economy and the amount of oil revenues it generates in com-parison with the other GCC countries.
Labour migration from Pakistan: 2015 status report
31
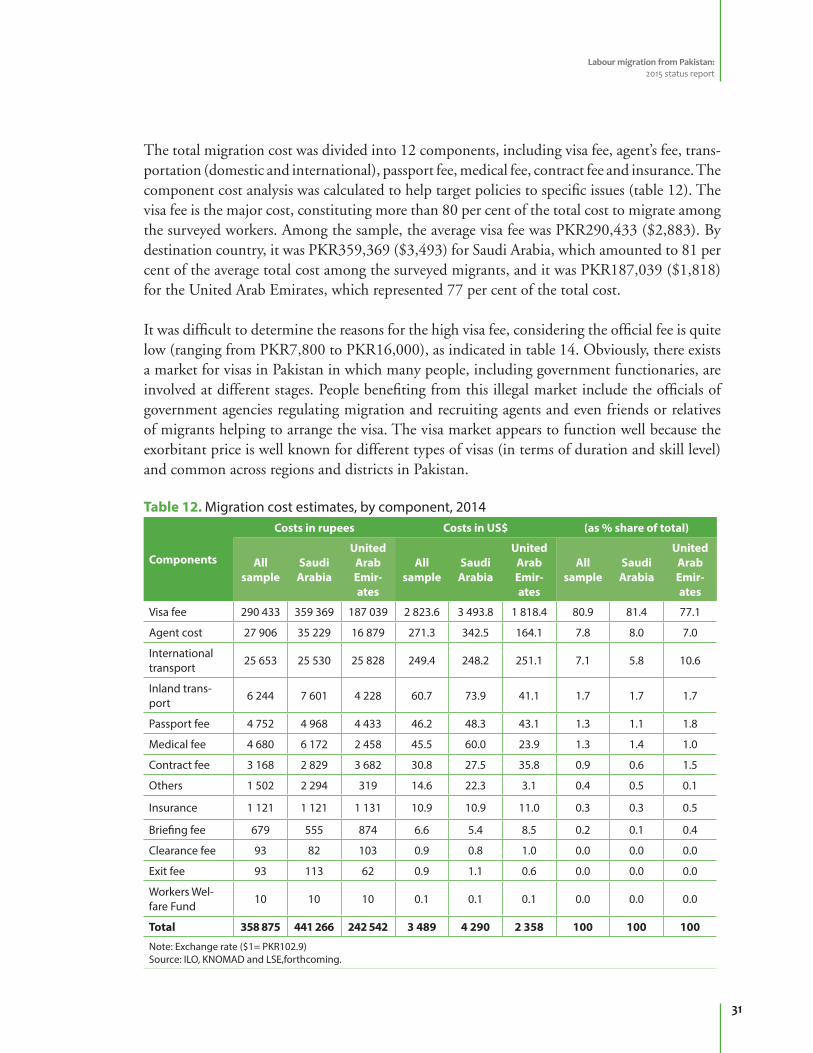
The total migration cost was divided into 12 components, including visa fee, agent’s fee, trans-portation (domestic and international), passport fee, medical fee, contract fee and insurance. The component cost analysis was calculated to help target policies to specific issues (table 12). The visa fee is the major cost, constituting more than 80 per cent of the total cost to migrate among the surveyed workers. Among the sample, the average visa fee was PKR290,433 ($2,883). By destination country, it was PKR359,369 ($3,493) for Saudi Arabia, which amounted to 81 per cent of the average total cost among the surveyed migrants, and it was PKR187,039 ($1,818) for the United Arab Emirates, which represented 77 per cent of the total cost.
It was difficult to determine the reasons for the high visa fee, considering the official fee is quite low (ranging from PKR7,800 to PKR16,000), as indicated in table 14. Obviously, there exists a market for visas in Pakistan in which many people, including government functionaries, are involved at different stages. People benefiting from this illegal market include the officials of government agencies regulating migration and recruiting agents and even friends or relatives of migrants helping to arrange the visa. The visa market appears to function well because the exorbitant price is well known for different types of visas (in terms of duration and skill level) and common across regions and districts in Pakistan.
Table 12. Migration cost estimates, by component, 2014
Components
Costs in rupees Costs in US$ (as % share of total)
All sample
Saudi Arabia
United Arab Emir-ates
All sample
Saudi Arabia
United Arab Emir-ates
All sample
Saudi Arabia
United Arab Emir-ates
Visa fee 290 433 359 369 187 039 2 823.6 3 493.8 1 818.4 80.9 81.4 77.1
Agent cost 27 906 35 229 16 879 271.3 342.5 164.1 7.8 8.0 7.0
International transport
25 653 25 530 25 828 249.4 248.2 251.1 7.1 5.8 10.6
Inland trans-port
6 244 7 601 4 228 60.7 73.9 41.1 1.7 1.7 1.7
Passport fee 4 752 4 968 4 433 46.2 48.3 43.1 1.3 1.1 1.8
Medical fee 4 680 6 172 2 458 45.5 60.0 23.9 1.3 1.4 1.0
Contract fee 3 168 2 829 3 682 30.8 27.5 35.8 0.9 0.6 1.5
Others 1 502 2 294 319 14.6 22.3 3.1 0.4 0.5 0.1
Insurance 1 121 1 121 1 131 10.9 10.9 11.0 0.3 0.3 0.5
Briefing fee 679 555 874 6.6 5.4 8.5 0.2 0.1 0.4
Clearance fee 93 82 103 0.9 0.8 1.0 0.0 0.0 0.0
Exit fee 93 113 62 0.9 1.1 0.6 0.0 0.0 0.0
Workers Wel-fare Fund
10 10 10 0.1 0.1 0.1 0.0 0.0 0.0
Total 358 875 441 266 242 542 3 489 4 290 2 358 100 100 100
Note: Exchange rate ($1= PKR102.9)Source: ILO, KNOMAD and LSE,forthcoming.
Labour migration from Pakistan: 2015 status report
32
The second important component of the overall migration cost is the agent’s fee. The average agent fee was PKR 27,906 ($271) among the surveyed migrants, which constituted 8 per cent of the total cost. The agent’s fee for going to Saudi Arabia was PKR 35,229 ($342), or 8 per cent of the total cost, and for the United Arab Emirates it was PKR 16,879 ($164), or 7 per cent of the total cost. The agent’s fee is typically paid when the visa is obtained through a re-cruiting agency and/or other visa-providing agents. This covers the agent’s fee or the recruiting agency’s fee and may vary person to person, depending upon the availability of information regarding the typical cost of a visa.
The third most important component of the migration cost is international transportation, such as airfare. The average airfare among the surveyed migrants was PKR 25,653 ($249) from Pakistan to the Middle East, which amounted to 7 per cent of the total cost. The average airfare for Saudi Arabia was PKR 25,530 ($248, or 6 per cent of the total cost), and for the United Arab Emirates it was PKR 25,828 ($251, or 11 per cent of the total cost). The other eight components only constituted 6 per cent of the total migration expenses.
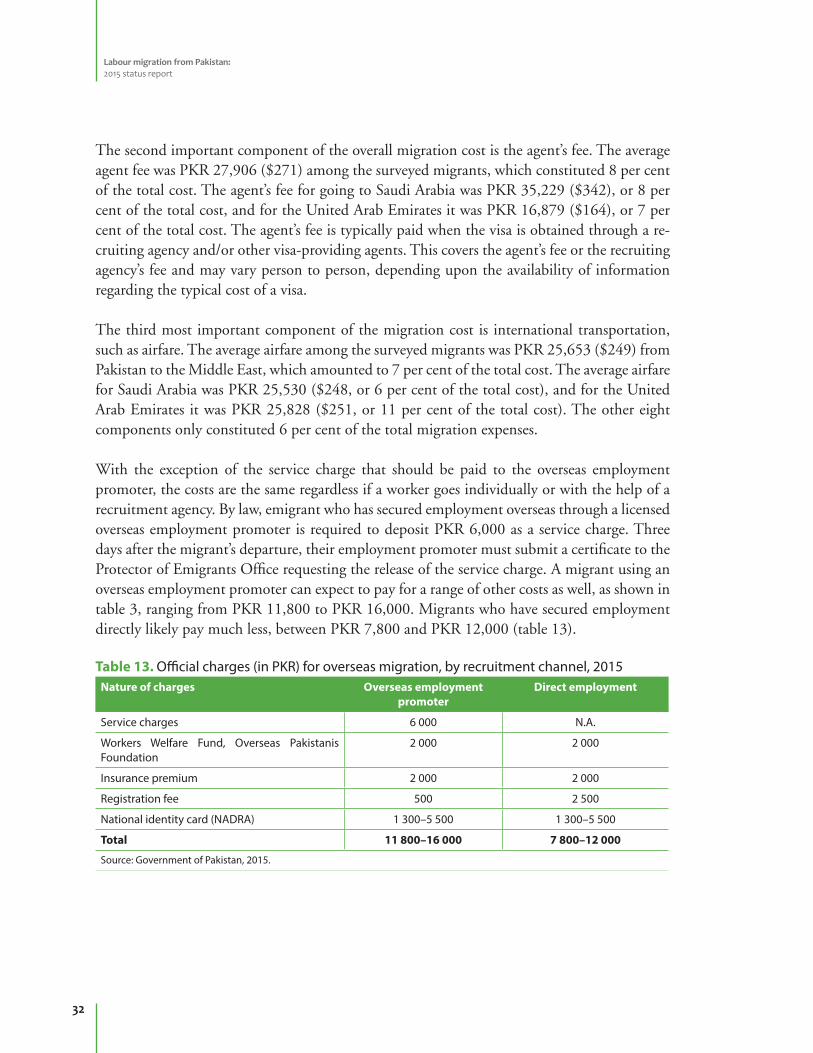
With the exception of the service charge that should be paid to the overseas employment promoter, the costs are the same regardless if a worker goes individually or with the help of a recruitment agency. By law, emigrant who has secured employment overseas through a licensed overseas employment promoter is required to deposit PKR 6,000 as a service charge. Three days after the migrant’s departure, their employment promoter must submit a certificate to the Protector of Emigrants Office requesting the release of the service charge. A migrant using an overseas employment promoter can expect to pay for a range of other costs as well, as shown in table 3, ranging from PKR 11,800 to PKR 16,000. Migrants who have secured employment directly likely pay much less, between PKR 7,800 and PKR 12,000 (table 13).
Table 13. Official charges (in PKR) for overseas migration, by recruitment channel, 2015Nature of charges Overseas employment
promoterDirect employment
Service charges 6 000 N.A.
Workers Welfare Fund, Overseas Pakistanis Foundation
2 000 2 000
Insurance premium 2 000 2 000
Registration fee 500 2 500
National identity card (NADRA) 1 300–5 500 1 300–5 500
Total 11 800–16 000 7 800–12 000
Source: Government of Pakistan, 2015.

Labour migration from Pakistan: 2015 status report
33
Labour migration from Pakistan: 2015 status report
34
Labour migration from Pakistan: 2015 status report
35
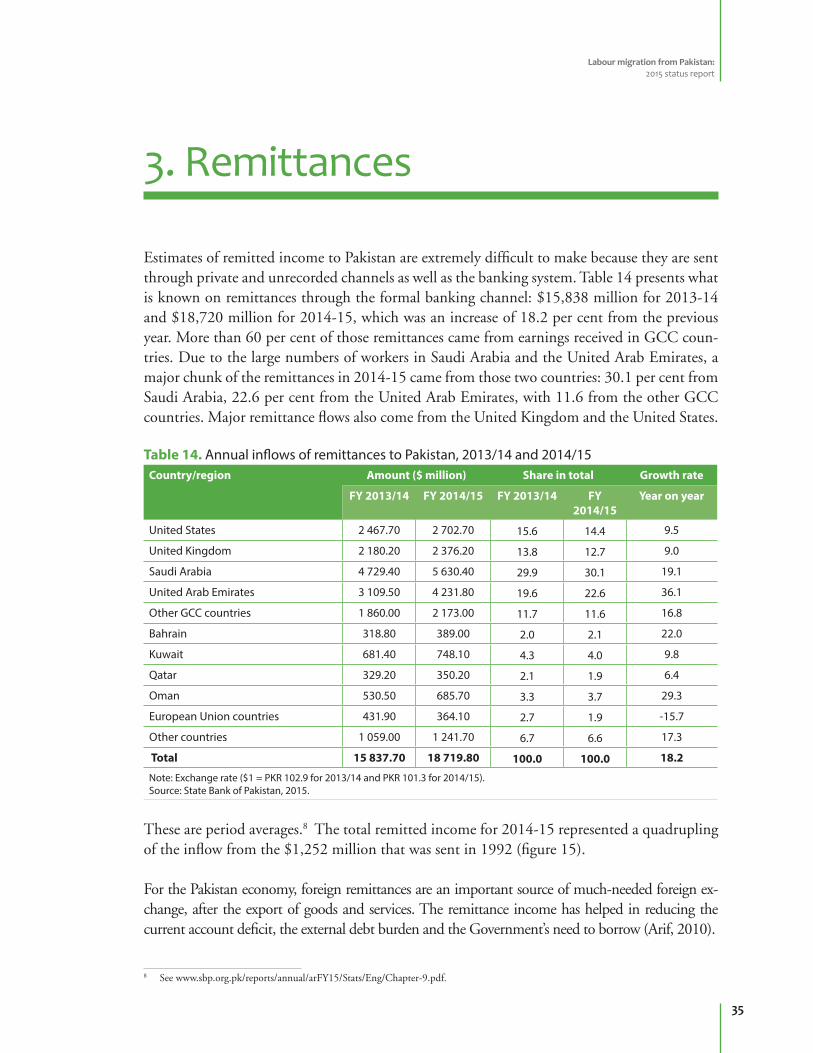
Estimates of remitted income to Pakistan are extremely difficult to make because they are sent through private and unrecorded channels as well as the banking system. Table 14 presents what is known on remittances through the formal banking channel: $15,838 million for 2013-14 and $18,720 million for 2014-15, which was an increase of 18.2 per cent from the previous year. More than 60 per cent of those remittances came from earnings received in GCC coun-tries. Due to the large numbers of workers in Saudi Arabia and the United Arab Emirates, a major chunk of the remittances in 2014-15 came from those two countries: 30.1 per cent from Saudi Arabia, 22.6 per cent from the United Arab Emirates, with 11.6 from the other GCC countries. Major remittance flows also come from the United Kingdom and the United States.
Table 14. Annual inflows of remittances to Pakistan, 2013/14 and 2014/15Country/region Amount ($ million) Share in total Growth rate
FY 2013/14 FY 2014/15 FY 2013/14 FY 2014/15
Year on year
United States 2 467.70 2 702.70 15.6 14.4 9.5
United Kingdom 2 180.20 2 376.20 13.8 12.7 9.0
Saudi Arabia 4 729.40 5 630.40 29.9 30.1 19.1
United Arab Emirates 3 109.50 4 231.80 19.6 22.6 36.1
Other GCC countries 1 860.00 2 173.00 11.7 11.6 16.8
Bahrain 318.80 389.00 2.0 2.1 22.0
Kuwait 681.40 748.10 4.3 4.0 9.8
Qatar 329.20 350.20 2.1 1.9 6.4
Oman 530.50 685.70 3.3 3.7 29.3
European Union countries 431.90 364.10 2.7 1.9 -15.7
Other countries 1 059.00 1 241.70 6.7 6.6 17.3
Total 15 837.70 18 719.80 100.0 100.0 18.2
Note: Exchange rate ($1 = PKR 102.9 for 2013/14 and PKR 101.3 for 2014/15). Source: State Bank of Pakistan, 2015.
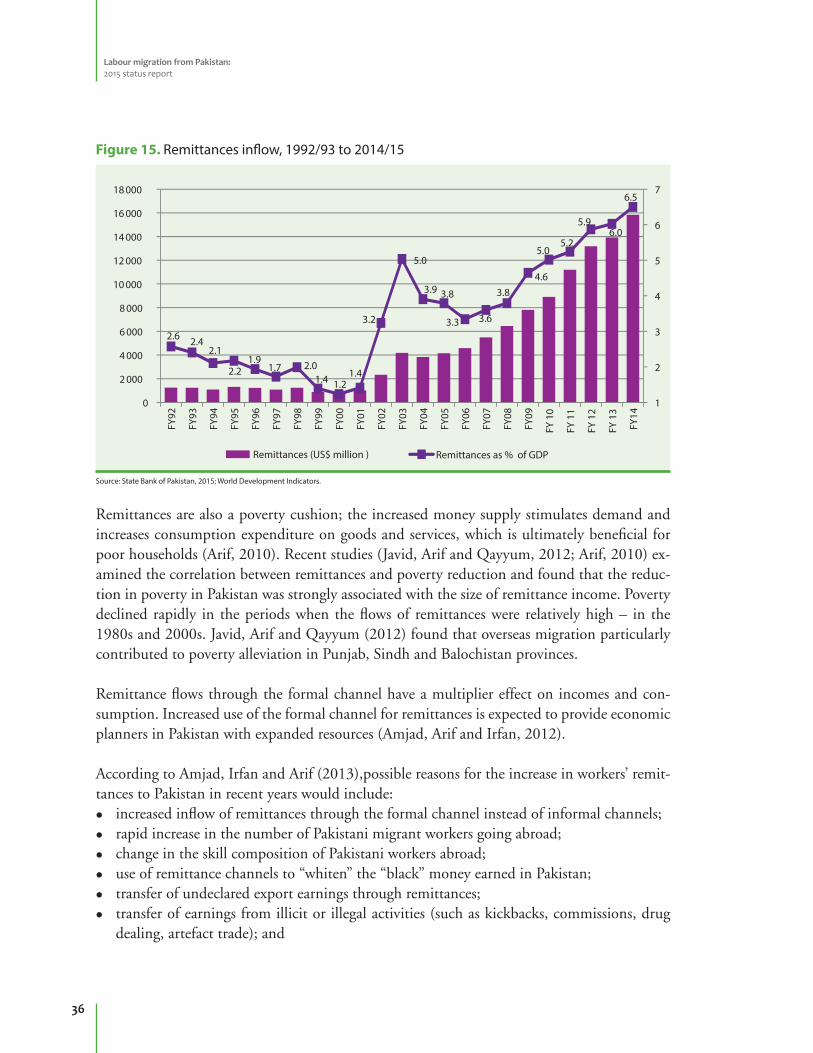
These are period averages.8 The total remitted income for 2014-15 represented a quadrupling of the inflow from the $1,252 million that was sent in 1992 (figure 15).
For the Pakistan economy, foreign remittances are an important source of much-needed foreign ex-change, after the export of goods and services. The remittance income has helped in reducing the current account deficit, the external debt burden and the Government’s need to borrow (Arif, 2010).
8 See www.sbp.org.pk/reports/annual/arFY15/Stats/Eng/Chapter-9.pdf.
3. Remittances
Labour migration from Pakistan: 2015 status report
36
Remittances are also a poverty cushion; the increased money supply stimulates demand and increases consumption expenditure on goods and services, which is ultimately beneficial for poor households (Arif, 2010). Recent studies (Javid, Arif and Qayyum, 2012; Arif, 2010) ex-amined the correlation between remittances and poverty reduction and found that the reduc-tion in poverty in Pakistan was strongly associated with the size of remittance income. Poverty declined rapidly in the periods when the flows of remittances were relatively high – in the 1980s and 2000s. Javid, Arif and Qayyum (2012) found that overseas migration particularly contributed to poverty alleviation in Punjab, Sindh and Balochistan provinces.
Remittance flows through the formal channel have a multiplier effect on incomes and con-sumption. Increased use of the formal channel for remittances is expected to provide economic planners in Pakistan with expanded resources (Amjad, Arif and Irfan, 2012).
According to Amjad, Irfan and Arif (2013),possible reasons for the increase in workers’ remit-tances to Pakistan in recent years would include: increased inflow of remittances through the formal channel instead of informal channels; rapid increase in the number of Pakistani migrant workers going abroad; change in the skill composition of Pakistani workers abroad; use of remittance channels to “whiten” the “black” money earned in Pakistan; transfer of undeclared export earnings through remittances; transfer of earnings from illicit or illegal activities (such as kickbacks, commissions, drug
dealing, artefact trade); and
Figure 15. Remittances inflow, 1992/93 to 2014/15
Source: State Bank of Pakistan, 2015; World Development Indicators.
Remittances (US$ million )
Labour migration from Pakistan: 2015 status report
37
transfer of receipts from the sale of assets abroad (apartments, houses, real estate) acquired through genuine earnings or transfer or through transfers of black-market money or in-come earned through illicit or illegal activities.
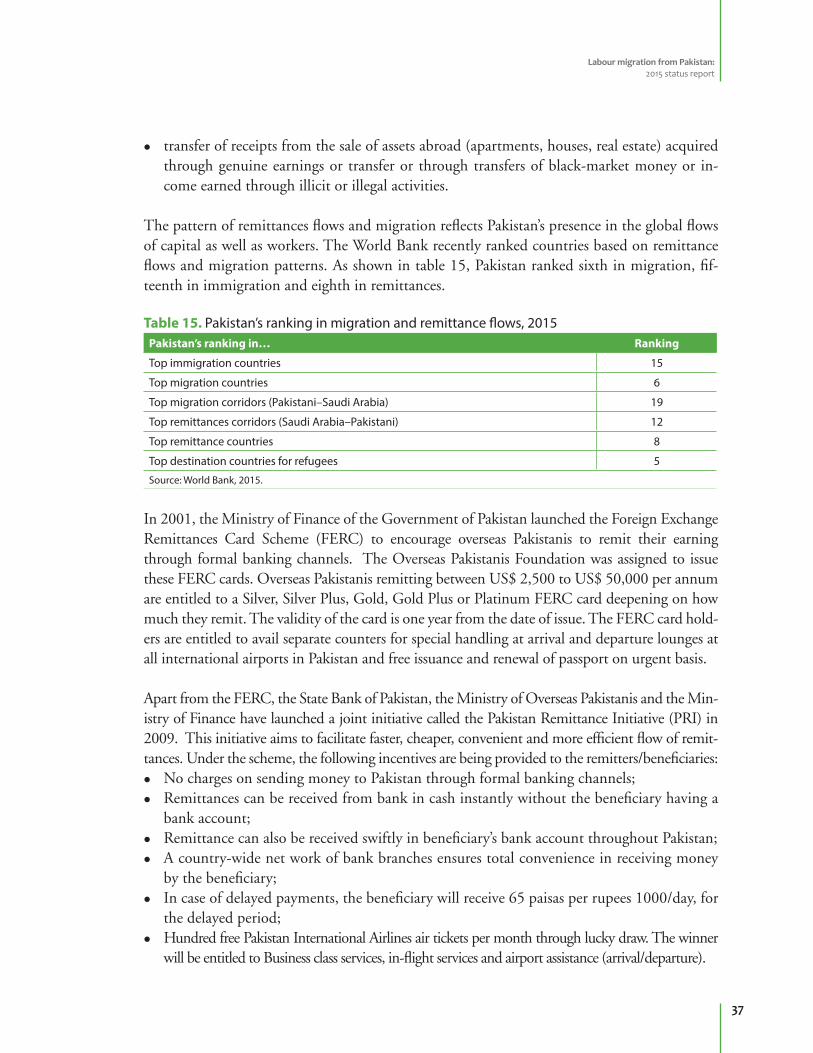
The pattern of remittances flows and migration reflects Pakistan’s presence in the global flows of capital as well as workers. The World Bank recently ranked countries based on remittance flows and migration patterns. As shown in table 15, Pakistan ranked sixth in migration, fif-teenth in immigration and eighth in remittances.
Table 15. Pakistan’s ranking in migration and remittance flows, 2015Pakistan’s ranking in… Ranking
Top immigration countries 15
Top migration countries 6
Top migration corridors (Pakistani–Saudi Arabia) 19
Top remittances corridors (Saudi Arabia–Pakistani) 12
Top remittance countries 8
Top destination countries for refugees 5
Source: World Bank, 2015.
In 2001, the Ministry of Finance of the Government of Pakistan launched the Foreign Exchange Remittances Card Scheme (FERC) to encourage overseas Pakistanis to remit their earning through formal banking channels. The Overseas Pakistanis Foundation was assigned to issue these FERC cards. Overseas Pakistanis remitting between US$ 2,500 to US$ 50,000 per annum are entitled to a Silver, Silver Plus, Gold, Gold Plus or Platinum FERC card deepening on how much they remit. The validity of the card is one year from the date of issue. The FERC card hold-ers are entitled to avail separate counters for special handling at arrival and departure lounges at all international airports in Pakistan and free issuance and renewal of passport on urgent basis.
Apart from the FERC, the State Bank of Pakistan, the Ministry of Overseas Pakistanis and the Min-istry of Finance have launched a joint initiative called the Pakistan Remittance Initiative (PRI) in 2009. This initiative aims to facilitate faster, cheaper, convenient and more efficient flow of remit-tances. Under the scheme, the following incentives are being provided to the remitters/beneficiaries: No charges on sending money to Pakistan through formal banking channels; Remittances can be received from bank in cash instantly without the beneficiary having a
bank account; Remittance can also be received swiftly in beneficiary’s bank account throughout Pakistan; A country-wide net work of bank branches ensures total convenience in receiving money
by the beneficiary; In case of delayed payments, the beneficiary will receive 65 paisas per rupees 1000/day, for
the delayed period; Hundred free Pakistan International Airlines air tickets per month through lucky draw. The winner
will be entitled to Business class services, in-flight services and airport assistance (arrival/departure).

Labour migration from Pakistan: 2015 status report
38
Labour migration from Pakistan: 2015 status report
39
Pakistan has adopted institutional arrangements and legislation necessary for the recruitment and placement of its citizens in an overseas labour market. This section provides an overview of those mechanisms (government as well as private) for promoting migration and helping with the reintegration of workers when they return to Pakistan.
4.1. Institutional framework
It is the sole responsibility of the Government to provide or facilitate proper guidance for migrant workers through law, policies and institutional mechanisms. There is an Emigration Ordinance 1979 and Emigration Rules 1979, yet, there is no official policy regarding overseas Pakistani migrant workers.
To reduce unemployment and eradicate poverty, the Government promotes the placement of Pakistani workers abroad. The Government is proactive not only in retaining markets for its migrant workers but also in sourcing new markets. The Ministry of Overseas Pakistanis and Human Resource Development was established in June 2013 through a merger of two previ-ously separate ministries with a mandate to seek employment opportunities for Pakistanis abroad, work for the welfare of workers and their families (within Pakistan as well as abroad) and coordinate with provincial governments to align the national labour laws with the coun-try’s international obligations on labour standards.
For the promotion of Pakistani workers abroad and for the welfare of overseas migrant work-ers, the Ministry supervises the following agencies and departments with the aim of ensuring decent and respectful employment for migrants: Bureau of Emigration and Overseas Employment Overseas Pakistanis Foundation Overseas Employment Corporation
The Government has taken numerous steps to control and regulate the country’s labour re-cruitment process. Historically, the Emigration Act of 1922 enabled establishment of the National Manpower Council, the Directorate of Seamen’s Welfare and the Protectorate of
4. Institutional arrangements to promote migration
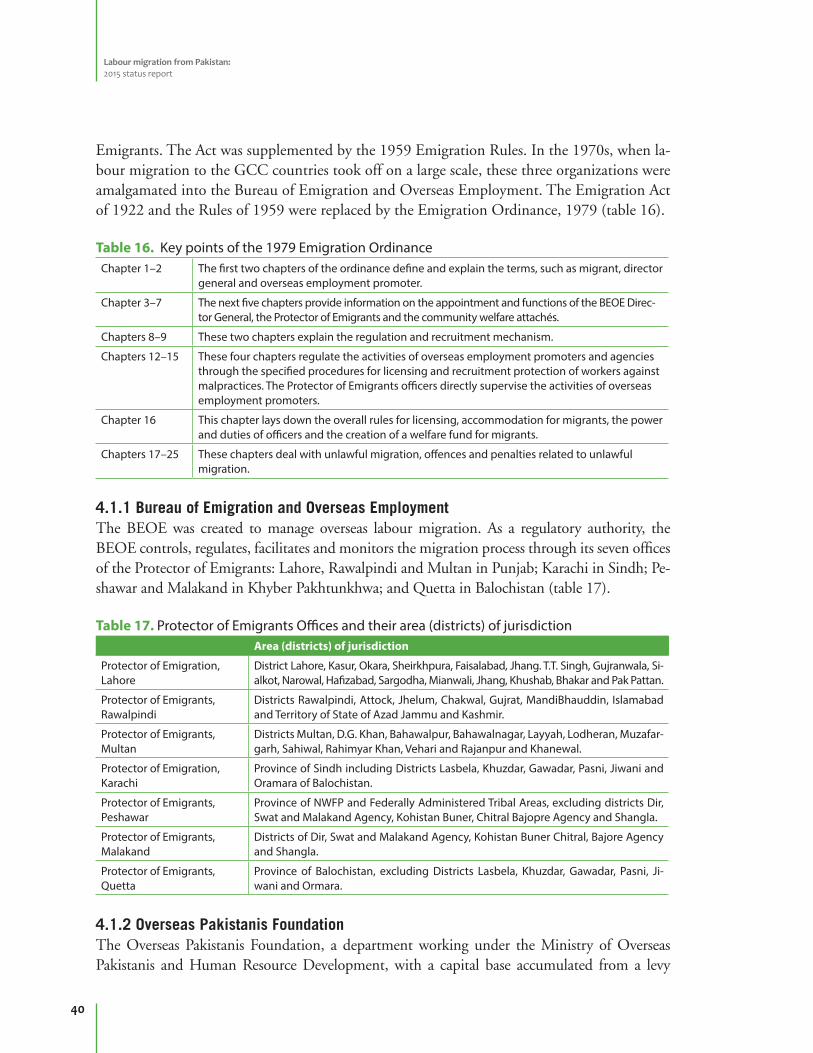
Labour migration from Pakistan: 2015 status report
40
Emigrants. The Act was supplemented by the 1959 Emigration Rules. In the 1970s, when la-bour migration to the GCC countries took off on a large scale, these three organizations were amalgamated into the Bureau of Emigration and Overseas Employment. The Emigration Act of 1922 and the Rules of 1959 were replaced by the Emigration Ordinance, 1979 (table 16).
Table 16. Key points of the 1979 Emigration OrdinanceChapter 1–2 The first two chapters of the ordinance define and explain the terms, such as migrant, director
general and overseas employment promoter.
Chapter 3–7 The next five chapters provide information on the appointment and functions of the BEOE Direc-tor General, the Protector of Emigrants and the community welfare attachés.
Chapters 8–9 These two chapters explain the regulation and recruitment mechanism.
Chapters 12–15 These four chapters regulate the activities of overseas employment promoters and agencies through the specified procedures for licensing and recruitment protection of workers against malpractices. The Protector of Emigrants officers directly supervise the activities of overseas employment promoters.
Chapter 16 This chapter lays down the overall rules for licensing, accommodation for migrants, the power and duties of officers and the creation of a welfare fund for migrants.
Chapters 17–25 These chapters deal with unlawful migration, offences and penalties related to unlawful migration.
4.1.1 Bureau of Emigration and Overseas EmploymentThe BEOE was created to manage overseas labour migration. As a regulatory authority, the BEOE controls, regulates, facilitates and monitors the migration process through its seven offices of the Protector of Emigrants: Lahore, Rawalpindi and Multan in Punjab; Karachi in Sindh; Pe-shawar and Malakand in Khyber Pakhtunkhwa; and Quetta in Balochistan (table 17).
Table 17. Protector of Emigrants Offices and their area (districts) of jurisdictionArea (districts) of jurisdiction
Protector of Emigration, Lahore
District Lahore, Kasur, Okara, Sheirkhpura, Faisalabad, Jhang. T.T. Singh, Gujranwala, Si-alkot, Narowal, Hafizabad, Sargodha, Mianwali, Jhang, Khushab, Bhakar and Pak Pattan.
Protector of Emigrants, Rawalpindi
Districts Rawalpindi, Attock, Jhelum, Chakwal, Gujrat, MandiBhauddin, Islamabad and Territory of State of Azad Jammu and Kashmir.
Protector of Emigrants, Multan
Districts Multan, D.G. Khan, Bahawalpur, Bahawalnagar, Layyah, Lodheran, Muzafar-garh, Sahiwal, Rahimyar Khan, Vehari and Rajanpur and Khanewal.
Protector of Emigration, Karachi
Province of Sindh including Districts Lasbela, Khuzdar, Gawadar, Pasni, Jiwani and Oramara of Balochistan.
Protector of Emigrants, Peshawar
Province of NWFP and Federally Administered Tribal Areas, excluding districts Dir, Swat and Malakand Agency, Kohistan Buner, Chitral Bajopre Agency and Shangla.
Protector of Emigrants, Malakand
Districts of Dir, Swat and Malakand Agency, Kohistan Buner Chitral, Bajore Agency and Shangla.
Protector of Emigrants, Quetta
Province of Balochistan, excluding Districts Lasbela, Khuzdar, Gawadar, Pasni, Ji-wani and Ormara.
4.1.2 Overseas Pakistanis FoundationThe Overseas Pakistanis Foundation, a department working under the Ministry of Overseas Pakistanis and Human Resource Development, with a capital base accumulated from a levy

Labour migration from Pakistan: 2015 status report
41
on Pakistani workers abroad. The Foundation handles many of the government schemes and concessions for overseas Pakistanis, such as the housing schemes for residential development and the establishment of schools and colleges in Pakistan. The Foundation also takes responsibility for the repatriation of a deceased citizen, upon request of a Pakistani embassy or consulate. The Foundation also assists citizens during times of disasters or conflict, such as in Yemen and Libya. 9
4.2 The recruitment process10
As explained in section 2.5, Pakistanis can legally procure overseas employment through two modalities, either through an overseas employment promoter, which can be public or private, or though their own effort (direct employment), usually with help from a friend or relative working abroad.
The OEC is the only public agency in Pakistan that recruits workers for overseas employment. It works under the Ministry of Overseas Pakistani and Human Resource Development and is responsible for government-to-government recruitment. As previously noted, the role of the OEC has gradually declined over the years, and today, less than 1 per cent of all migrant workers are recruited by the OEC. About 60 per cent of all migrant workers find employment abroad through a licensed overseas employment promoter, while some 40 per cent make their own employment arrangement (see figures 9 and 10).
The BEOE has three sets of procedures for workers going abroad, depending on who secured their employment: overseas employment promoter, the OEC or own initiative (direct employ-ment). Generally though, workers (through agent when applicable) submit their passport, their computerized national identity card, their visa, their contract or foreign employment letter and air tickets, pay their fees (as outlined in table 14) and attend a pre-departure briefing in the Protector of Emigrants Office.
To recruit workers in the private sector, foreign employers send a “demand letter” to an over-seas employment promoter mentioning all terms and conditions of a job. Based on a foreign employer’s demand for workers, the overseas employment promoter applies to the nearest Protector of Emigrants Office for approval to process a foreign employer’s request. Generally,
9 During 1999–2000, the Overseas Pakistanis Foundation spent $64,000 to repatriate 224 stranded citizens in Jordan. The Foundation repatriated 335 children who were taken to Gulf countries for camel racing (known as jockey children). The Foundation also repatriated 23 children whose parents were caught in Saudi Arabia while smuggling illegal drugs and were sentenced to death; the children were handed over to relatives. During the political crisis in Libya, 5,996 migrant workers were repatriated in March 2011 through chartered and commercial flights; among them, 1,870 were further provided inland transportation through bus or train tickets to reach their home. In 2014, 2,762 Pakistanis were repatriated from Libya through ten special flights, followed by inland transport assistance for 584 of them. In 2015 during the war in Yemen, 1,037 Pakistanis were evacuated on extraordinary direction of the prime minister of Pakistan through special flights by the Pakistan Navy, followed by bus tickets for 629 of them for their onward travel to their home. See www.opf.org.pk/WRepatriationOfStrandedPakistanis.aspx.
10 This section draws heavily from Arif, 2009. While this report is slightly dated, the findings are still highly valid as there has not been any significant changes in the recruitment procedures since 2009.
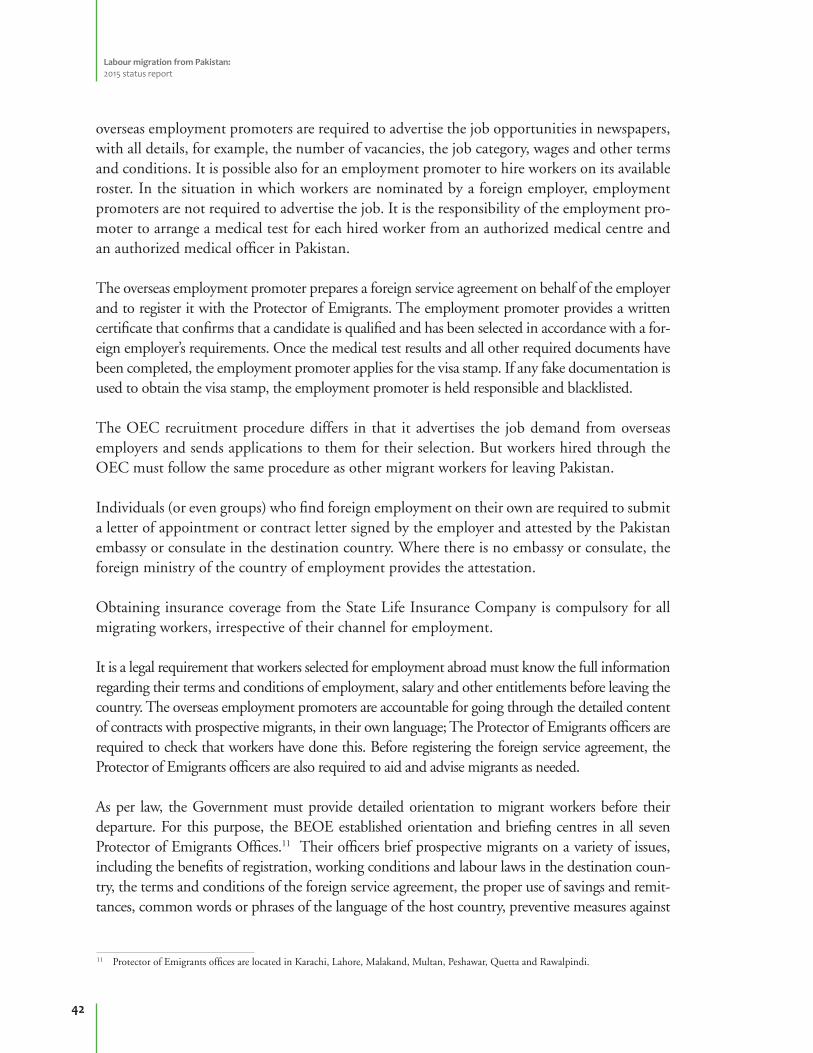
Labour migration from Pakistan: 2015 status report
42
overseas employment promoters are required to advertise the job opportunities in newspapers, with all details, for example, the number of vacancies, the job category, wages and other terms and conditions. It is possible also for an employment promoter to hire workers on its available roster. In the situation in which workers are nominated by a foreign employer, employment promoters are not required to advertise the job. It is the responsibility of the employment pro-moter to arrange a medical test for each hired worker from an authorized medical centre and an authorized medical officer in Pakistan.
The overseas employment promoter prepares a foreign service agreement on behalf of the employer and to register it with the Protector of Emigrants. The employment promoter provides a written certificate that confirms that a candidate is qualified and has been selected in accordance with a for-eign employer’s requirements. Once the medical test results and all other required documents have been completed, the employment promoter applies for the visa stamp. If any fake documentation is used to obtain the visa stamp, the employment promoter is held responsible and blacklisted.
The OEC recruitment procedure differs in that it advertises the job demand from overseas employers and sends applications to them for their selection. But workers hired through the OEC must follow the same procedure as other migrant workers for leaving Pakistan.
Individuals (or even groups) who find foreign employment on their own are required to submit a letter of appointment or contract letter signed by the employer and attested by the Pakistan embassy or consulate in the destination country. Where there is no embassy or consulate, the foreign ministry of the country of employment provides the attestation.
Obtaining insurance coverage from the State Life Insurance Company is compulsory for all migrating workers, irrespective of their channel for employment.
It is a legal requirement that workers selected for employment abroad must know the full information regarding their terms and conditions of employment, salary and other entitlements before leaving the country. The overseas employment promoters are accountable for going through the detailed content of contracts with prospective migrants, in their own language; The Protector of Emigrants officers are required to check that workers have done this. Before registering the foreign service agreement, the Protector of Emigrants officers are also required to aid and advise migrants as needed.
As per law, the Government must provide detailed orientation to migrant workers before their departure. For this purpose, the BEOE established orientation and briefing centres in all seven Protector of Emigrants Offices.11 Their officers brief prospective migrants on a variety of issues, including the benefits of registration, working conditions and labour laws in the destination coun-try, the terms and conditions of the foreign service agreement, the proper use of savings and remit-tances, common words or phrases of the language of the host country, preventive measures against
11 Protector of Emigrants offices are located in Karachi, Lahore, Malakand, Multan, Peshawar, Quetta and Rawalpindi.
Labour migration from Pakistan: 2015 status report
43
12 As of 16 March 2016.13 See www.beoe.gov.pk/ContactUs_CWAs.asp.14 See www.mofa.gov.pk/contento.php. For more details, see Grievance Commissioner Cell for Overseas Pakistani at www.overseas.
federalombudsman.gov.pk/.
HIV infection and caution about drug abuse. Currently,12 only two briefing officers are providing pre-departure orientation at the Protector of Emigrant offices in Lahore and Karachi (both briefing officers are female). Five positions at the Protector of Emigrant offices are still vacant.
4.3 Grievances and redress
There are various arrangements in Pakistan and in the destination countries to address the grievances of migrant workers.
4.3.1 Community welfare attachésTo better manage the welfare of Pakistani expatriates and their dependants in Pakistan, the Government has established offices of community welfare attachés in major destination coun-tries, including Bahrain, Greece, Iraq, Italy, Kuwait, Malaysia, Norway, Oman, Qatar, the Re-public of Korea, Saudi Arabia, the United Arab Emirates, the United Kingdom and the United States.13 These attachés identify employment opportunities for Pakistani workers and look after the interests and welfare of migrants. The community welfare attachés submit monthly reports to the Ministry of Overseas Pakistanis and Human Resource Development covering the number of employers contacted during the month and details on the demand for Pakistani workers, assistance provided to overseas employment promoters in filling that demand, efforts made to obtain demand for overseas employment, complaints received or resolved, the num-ber of death compensation cases handled, the number of irregular migration cases handled, the number of Pakistanis deported, the number of Pakistanis in jail or deportation camps and details of visits made to jails, the number of dead bodies transported to Pakistan, the number of meetings with Pakistani community associations to motivate them to send their savings through legal channels, employment trends of host countries and the efforts made to imple-ment memoranda of understanding (MOUs) on the employment of Pakistani workers.
4.3.2 Federal Ombudsman of PakistanThe Federal Ombudsman of Pakistan established the Grievance Commissioner Cell for Over-seas Pakistanis in the Federal Ombudsman Secretariat.14 The Grievance Commissioner Cell is mandated to address the issues of overseas Pakistanis related to government ministries, depart-ments, organizations or agencies.
4.3.3 Overseas Pakistanis FoundationSome 18,667 complaints have been registered with the Overseas Pakistani Foundation to date, requesting appropriate action. About 17,714 cases have been settled, and the remainder are pending. The Complaint Cell based in Islamabad maintains close liaison with various organi-zations through correspondence as well as personal visits for follow-up and timely action.

Labour migration from Pakistan: 2015 status report
44
Labour migration from Pakistan: 2015 status report
45
5.1 Major achievements
Since the 1970s, a significant flow of economically motivated migrant workers has moved from Pakistan to the rest of the world, especially to GCC countries and Europe. Pakistan’s economy has greatly benefited, not only from the remittance income sent back by these migrant workers but also from the return of newly skilled migrants. To mitigate the country’s intense level of poverty and unemployment through labour migration, many important steps have been initi-ated by the Government through its evolving legal and institutional framework.
Pakistan’s migrating labour force has diverse characteristics, varying from illiterate and semi-skilled to skilled, educated and highly qualified professionals. Because of that diversity, it is a major challenge for policy-makers to formulate innovative strategies for exploring all possible opportunities abroad.
The following highlights some of the recent (2014-15) achievements that have resulted in better-regulated labour migration processes and increased protection of the rights of migrant workers: The total export of workers reached 8,738,219 by October 2015 (since the 1970s), and
774,795 from January 2015 to October 2015, which is a record. By 2015, a number of agreements on labour migration had been signed with destination
countries (in the form of memorandum of understanding), as outlined in Box 2. By 2015, the Ministry of Overseas Pakistani and Human Resource Development operated
19 offices of community welfare attachés in 15 countries for the facilitation and enhance-ment of the welfare of Pakistanis migrants and their dependants.
The Ministry of Overseas Pakistanis and Human Resource Development established a Fed-eral Tripartite Consultation Committee in July 2014. The Committee serves as a platform for debate and consensus-based decision-making on labour issues of national importance.
In May 2015, one-window facilitation desks15 were established at all international airports to address the complaints of Pakistanis and try to resolve them on the spot.
An International Labour Standards and Labour Market Information Unit was established in October 2014, with support from ILO.
15 See www.mofa.gov.pk/documents/ONE_WINDOW%20.pdf.
5. Achievements, challenges and ways forward
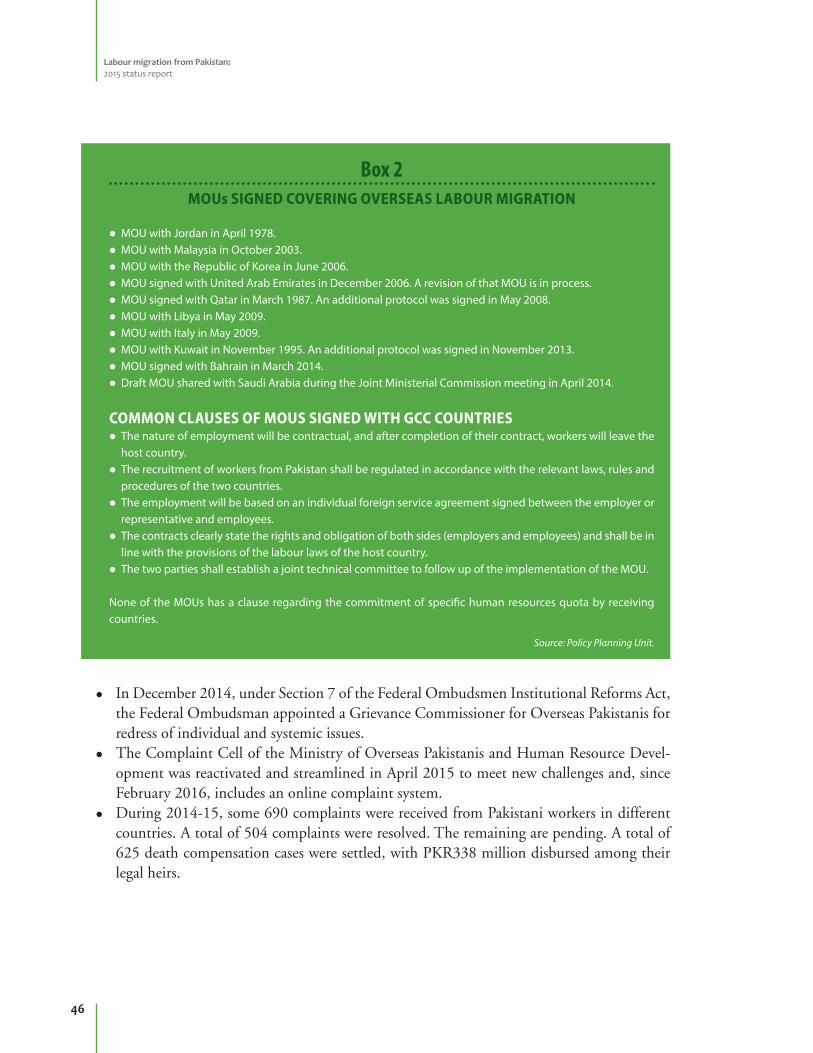
Labour migration from Pakistan: 2015 status report
46
In December 2014, under Section 7 of the Federal Ombudsmen Institutional Reforms Act, the Federal Ombudsman appointed a Grievance Commissioner for Overseas Pakistanis for redress of individual and systemic issues.
The Complaint Cell of the Ministry of Overseas Pakistanis and Human Resource Devel-opment was reactivated and streamlined in April 2015 to meet new challenges and, since February 2016, includes an online complaint system.
During 2014-15, some 690 complaints were received from Pakistani workers in different countries. A total of 504 complaints were resolved. The remaining are pending. A total of 625 death compensation cases were settled, with PKR338 million disbursed among their legal heirs.
Box 2MOUs SIGNED COVERING OVERSEAS LABOUR MIGRATION
MOU with Jordan in April 1978. MOU with Malaysia in October 2003. MOU with the Republic of Korea in June 2006. MOU signed with United Arab Emirates in December 2006. A revision of that MOU is in process. MOU signed with Qatar in March 1987. An additional protocol was signed in May 2008. MOU with Libya in May 2009. MOU with Italy in May 2009. MOU with Kuwait in November 1995. An additional protocol was signed in November 2013. MOU signed with Bahrain in March 2014. Draft MOU shared with Saudi Arabia during the Joint Ministerial Commission meeting in April 2014.
COMMON CLAUSES OF MOUS SIGNED WITH GCC COUNTRIES The nature of employment will be contractual, and after completion of their contract, workers will leave the
host country. The recruitment of workers from Pakistan shall be regulated in accordance with the relevant laws, rules and
procedures of the two countries. The employment will be based on an individual foreign service agreement signed between the employer or
representative and employees. The contracts clearly state the rights and obligation of both sides (employers and employees) and shall be in
line with the provisions of the labour laws of the host country. The two parties shall establish a joint technical committee to follow up of the implementation of the MOU.
None of the MOUs has a clause regarding the commitment of specific human resources quota by receiving countries.
Source: Policy Planning Unit.
Labour migration from Pakistan: 2015 status report
47
5.2 Challenges and ways forward
Based on the coverage of this report, the following section singles out issues associated with migration statistics and the institutional framework related to migration.
5.2.1 Migration statistics Challenges1. There are many government actors holding data that are of relevance to migration: the
Ministry of Overseas Pakistanis and Human Resource Development and its departments, including the BEOE, the OEC and the Overseas Pakistanis Foundation; the Ministry of Interior; the Ministry of Foreign Affairs through its embassies; the Federal Ombuds-man, who handles some of the complaints from migrant workers; and the State Bank of Pakistan, which collects data on remittances. Due to lack of coordination between theses ministries and bodies, migration statistics are incomplete and time-consuming to collect.
2. The BEOE does not publicize sex-disaggregated migration statistics. Sex-disaggregated data are now only available for 2008-13.
3. The definitions, standards and methodologies of data collection of the various ministries and other bodies collecting migration-related data are using different standards and defini-tions. This creates difficulty to compare and analyse data collected from various sources. Data generated by the BEOE, for instance, is based on calendar year, while data generated by the OEC is based on fiscal year, which creates ambiguity when collating their datasets.
4. The BEOE has an almost complete registration of the annual outflow of Pakistani workers going for overseas employment. But it does not record the return flow of workers nor does any other organization. It is thus not possible to estimate the stock of overseas Pakistanis.
5. There is a lack of skills among the Ministry of Overseas Pakistanis and Human Resource Development and related departments in terms of designing tools and collecting, tabu-lating and analysing data to apply results for formulation of programmes and policies.
Ways forward1. There is a need to develop a comprehensive database system, such as a management infor-
mation system covering all types of migration data. The Ministry of Overseas Pakistanis and Human Resource Development should collaborate with all departments and agen-cies dealing with migration, including the BEOE, OEC, POEPA, NADRA, the Overseas Pakistanis Foundation, the Federal Investigation Agency, the Ministry of Interior, etc., to develop a coordination mechanism to institutionalize arrangements to regularly collect data and develop common standards and classifications based on international standards.
Labour migration from Pakistan: 2015 status report
48
2. Better coordination is also required between the producer of data and their users outside the government, such as students, researchers, international agencies, NGOs and other de-velopment partners and media, so that accurate and up-to-date data can be accessed easily.
3. The Ministry of Overseas Pakistanis and Human Resource Development should specify its statistical needs so that it can better formulate evidence-based policies and programmes.
4. Current gaps in data, such as migrant workers’ demographic and socio-economic character-istics, working conditions and age, should be collected by a relevant authority.
5. All data should be sex-disaggregated as a norm. 6. Collecting data on returnees through improved and integrated administrative data collec-
tion will help to understand the needs and requirements of workers for their resettlement and reintegration and would help in designing a support mechanism.
7. There is a need to develop skills among the departments and agencies responsible for data collection on migration as well as the management of that information to improve the qual-ity of data and to identify gaps in existing data required by policy-makers.
8. The BEOE records are kept on paper, with little data computerized. More efforts are need-ed to digitalize the available data to track trends.
5.2.2 Institutional framework Challenges1. There is no approved migration policy in Pakistan. The Ministry of Overseas Pakistanis and
Human Resource Development should develop a national policy for overseas Pakistanis in-cluding migrant workers. In the absence of a national policy, it is difficult to set departmen-tal directions to achieve the objective to promote safe migration, return and reintegration and to improve migration governance.
2. The share of female migrant workers in total labour migration from Pakistan is almost negligible. The major reasons include social and cultural values, lack of information on safe employment opportunities and weak institutional arrangements at home and abroad for their protection.
3. Migrant workers pay an exorbitantly high cost for overseas employment, many times more than what the legal framework stipulates. This is due to weak legal enforcement of the rules and regulations as well as the absence of any formal system of migration financing. The high cost of migration is perpetuated by the involvement of subagents (which are illegal in Pakistan).
4. Prospective migrant workers, migrant workers based overseas and those who have returned have limited or no access to accurate and reliable information related to their rights, du-ties, services available to them and other soft skills that would help them to maximize the benefits from migration.
5. Due to often low literacy rates among prospective migrant workers and a general lack of reliable, updated and easily accessible information, it is difficult for migrant workers (i) to understand the rules and regulations of the whole process of migration; (ii) to understand their rights; (iii) to understand the local laws; and (iv) to be well informed on destinations, the nature of jobs, the required processes and terms and conditions of jobs. Institutional bodies focused on overseas migration are only available in the larger cities, which creates
Labour migration from Pakistan: 2015 status report
49
difficulty in obtaining information for many prospective migrants and their families. These factors all contribute towards increase the vulnerability of migrant workers to exploitation at all stages of their migration cycle.
6. There is a lack of government capacity in Pakistan and abroad (including among commu-nity welfare attachés, pre-departure orientation officers and other staff ) to thus effectively handle pre-departure training, complaints and grievances.
Ways forward1. The national migration policy should be developed and adopted after a comprehensive
round of stakeholder consultations, taking suggestions on how to better compete in the globalized word with your regional competitor in a healthy environment.
2. The Emigration Ordinance and Rules need to be reviewed in light of new developments at the country, regional and international levels and to better address the challenges to the regulation of the recruitment industry and to improve the system for addressing grievances in Pakistan and abroad.
3. The concentration of migrant workers in one destination region can lead to a dangerous depen-dency on the jobs (and remittances) that could easily be affected by economic recession or some future regional conflict. Policy-makers should search for other markets to send Pakistani workers.
4. To promote female employment abroad, new rules are needed. There is a need to train female workers for the professions in which they would feel safe and secure. The Government should sign MOUs with destination countries on the rights and safety of migrant female work-ers. Safe houses should be established in Pakistani embassies and missions. The appointment of female community welfare officers should be considered in selected host countries. The monitoring of working and living conditions of female workers should be institutionalized by Pakistani embassies and consulates, with participation of Pakistani communities. An aware-ness campaign should be launched on the safe channel of female migration.
5. The Ministry of Overseas Pakistanis and Human Resource Development should fill the va-cant positions and should create more positions in the country, particularly in the BEOE and in embassies and consulates abroad to ensure that migrant workers can easily access them.
6. The Government should address the issue of exorbitantly high migration costs to avoid exploitation of workers, especially those who are low skilled. An accountability, monitoring and enforcement mechanism with strict compliance of existing laws and regulations must be put into place to bring down the actual migration cost, in line with the legal framework.
7. Although not allowed by law, subagents have a significant role in the recruitment industry. At the same time, many migrant workers’ complaints are related to subagents. There is a need to understand their function to bring them under legal regulation.
8. There is a need to expand pre-departure training for migrant workers and ensure that it properly takes place. Prospective migrant workers should be able to easily access brochures of useful information to mitigate the potential for exploitation.
9. The Policy Planning Unit capacity should be strengthened so it is capable of establishing an international labour market information system that migrant workers can easily access for information on destination labour markets.

Labour migration from Pakistan: 2015 status report
50
Labour migration from Pakistan: 2015 status report
51
Amjad, R. and Arif, G.M. 2014. Analysing the impact of overseas migration and workers’ remittances in Khyber Pakhtunkhaw (KP): Suggested measures for maximising development benefits. Working Paper (Islamabad, International Growth Center).
Amjad, R., Arif, G.M. and Irfan, M. 2012. Preliminary study: Explaining the ten-fold increase in remittances to Pakistan 2001-2012. PIDE Working Papers (Islamabad, Pakistan Institue of Development Economics).
Amjad, R., Irfan, M. and Arif, G.M. 2013. How to increase formal inflows of remittances: An analysis of the remittance market in Pakistan. Working Paper (Islamabad, Lahore School of Economics, International Growth Center and the Pakistan Institute of Development Economics).
Arif, G.M. 2009. Recruitment of Pakistani workers for overseas employment: Mechanisms, exploitation and vulnerabilities(Geneva, International Labour Organization).
—. M. 2010. Economic and social impacts of remittances on households: The case of Pakistani migrants working in Saudi Arabia (Geneva, International Organization for Migration).
Arif, G.M. and Ishaq, T. 2015. Irregular migration to the Gulf: The case of Pakistan, paper presented at the 2015 Gulf Research Meeting, 24–27 August, University of Cambridge, United Kingdom.
Bureau of Emigration and Overseas Employment. 2015a. Migration statistics of Pakistan 1971-2015 (Islamabad, Govern-ment of Pakistan).
—. 2015b. Overseas employment promoters. Available at: http://beoe.gov.pk/Valid_overseas employment promoters/All_overseas employment promoters_list.asp.
Deutsche Gesellschaft für Internationale Zusammenarbeit (GIZ) GmbH and International Labour Organziation. 2015. La-bour market trends analysis and labour migration from South Asia to Gulf Cooperation Council countries, India and Malaysia (Kathmandu).
International Labour Organization, Global Knowledge Partnership on Migration and Development(KNOMAD) and Lahore School of Economics. 2016. Measuring migration costs for low-skilled migrant workers from Pakistan to Saudi Arabia and United Arab Emirates (Islamabad).
Irfan, M. and Amjad, R. 1984. Poverty in rural Pakistan, in A.R. Khan and E. Lee (eds.): Poverty in rural Asia (Bangkok, International Labour Organization/ARTEP).
Islam, R. 2002. Employment implications of the global economic slowdown 2001: Responding with a social focus (Geneva, Recov-ery and Reconstruction Department, International Labour Office).
Javid, M., Arif, U. and Qayyum, A. 2012. Impact of remittances on economic growth and poverty, in Academic Research Inter-national, Vol. 2, No.1, pp. 433-447.
Kock, U. and Sun, Y. 2011. Remittances in Pakistan: Why have they gone up, and why aren’t they coming down? IMF Working Papers (Islamabad, International Monetary Fund).
Ministry of Finance. 2015. Economic survey of Pakistan 2014-15 (Islamabad, Government of Pakistan).
Overseas Employment Corporation. 2015. Data on overseas employment (Islamabad, Government of Pakistan).
Rangarajan, C., Kaul, I. and Seema, S. 2007. Revisiting employment and growth, in ICRA Bulletin-Money & Finance, Vol. 3, No. 2.
State Bank of Pakistan. 2015. Data on home remittances. Available at: www.sbp.org.pk/ecodata/index2.asp.
Thimothy, R. and Sasikumar, S.K. 2012. Migration of women workers from South Ashia to the Gulf (New Delhi, V.V Giri National Labour Institute and UN Women).
United Nations Office on Drugs and Crime (UNODC). 2014. The socio-economic impact of human trafficking and migrant smuggling in Pakistan (Islamabad).
World Bank. 2015. Migration and remittances factbook 2016, Third edition (Washington, DC).
References
Labour migration from Pakistan: 2015 status report
52
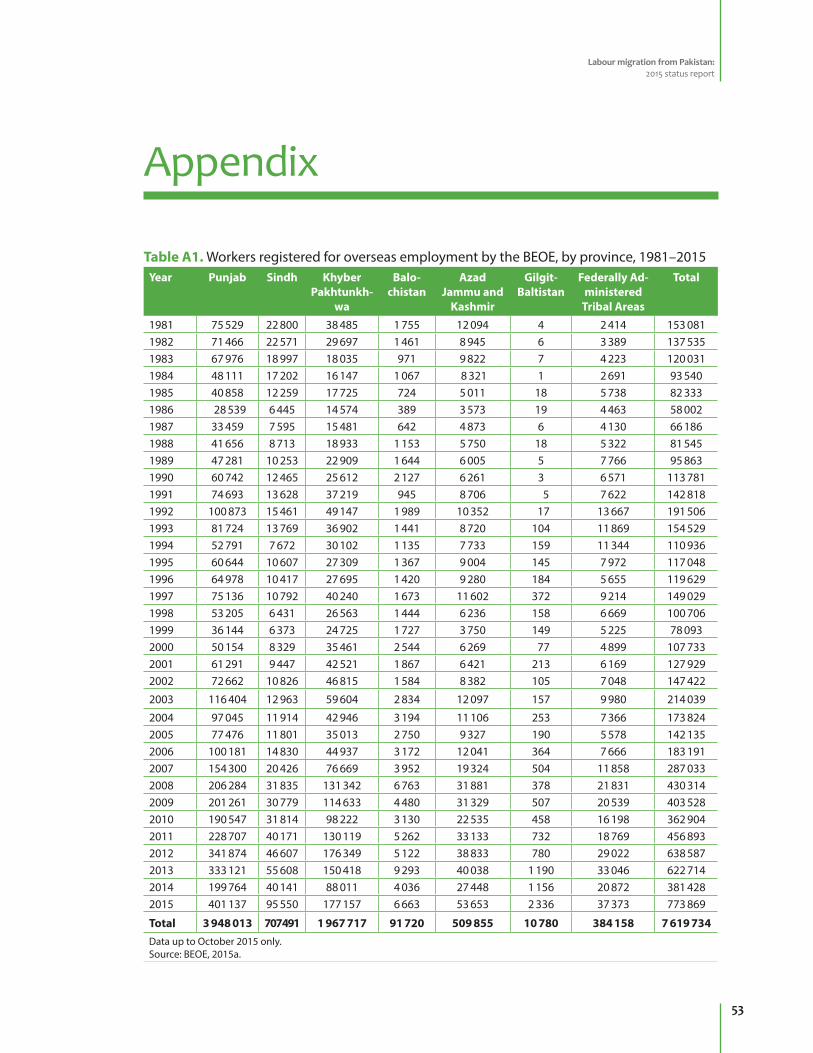
Labour migration from Pakistan: 2015 status report
53
Table A1. Workers registered for overseas employment by the BEOE, by province, 1981–2015Year Punjab Sindh Khyber
Pakhtunkh-wa
Balo-chistan
Azad Jammu and
Kashmir
Gilgit-Baltistan
Federally Ad-ministered
Tribal Areas
Total
1981 75 529 22 800 38 485 1 755 12 094 4 2 414 153 081 1982 71 466 22 571 29 697 1 461 8 945 6 3 389 137 535 1983 67 976 18 997 18 035 971 9 822 7 4 223 120 031 1984 48 111 17 202 16 147 1 067 8 321 1 2 691 93 540 1985 40 858 12 259 17 725 724 5 011 18 5 738 82 333 1986 28 539 6 445 14 574 389 3 573 19 4 463 58 002 1987 33 459 7 595 15 481 642 4 873 6 4 130 66 186 1988 41 656 8 713 18 933 1 153 5 750 18 5 322 81 545 1989 47 281 10 253 22 909 1 644 6 005 5 7 766 95 863 1990 60 742 12 465 25 612 2 127 6 261 3 6 571 113 781 1991 74 693 13 628 37 219 945 8 706 5 7 622 142 818 1992 100 873 15 461 49 147 1 989 10 352 17 13 667 191 506 1993 81 724 13 769 36 902 1 441 8 720 104 11 869 154 529 1994 52 791 7 672 30 102 1 135 7 733 159 11 344 110 936 1995 60 644 10 607 27 309 1 367 9 004 145 7 972 117 048 1996 64 978 10 417 27 695 1 420 9 280 184 5 655 119 629 1997 75 136 10 792 40 240 1 673 11 602 372 9 214 149 029 1998 53 205 6 431 26 563 1 444 6 236 158 6 669 100 706 1999 36 144 6 373 24 725 1 727 3 750 149 5 225 78 093 2000 50 154 8 329 35 461 2 544 6 269 77 4 899 107 733 2001 61 291 9 447 42 521 1 867 6 421 213 6 169 127 929 2002 72 662 10 826 46 815 1 584 8 382 105 7 048 147 422
2003 116 404 12 963 59 604 2 834 12 097 157 9 980 214 039
2004 97 045 11 914 42 946 3 194 11 106 253 7 366 173 824 2005 77 476 11 801 35 013 2 750 9 327 190 5 578 142 135 2006 100 181 14 830 44 937 3 172 12 041 364 7 666 183 191 2007 154 300 20 426 76 669 3 952 19 324 504 11 858 287 033 2008 206 284 31 835 131 342 6 763 31 881 378 21 831 430 314 2009 201 261 30 779 114 633 4 480 31 329 507 20 539 403 528 2010 190 547 31 814 98 222 3 130 22 535 458 16 198 362 904 2011 228 707 40 171 130 119 5 262 33 133 732 18 769 456 893 2012 341 874 46 607 176 349 5 122 38 833 780 29 022 638 587 2013 333 121 55 608 150 418 9 293 40 038 1 190 33 046 622 714 2014 199 764 40 141 88 011 4 036 27 448 1 156 20 872 381 428 2015 401 137 95 550 177 157 6 663 53 653 2 336 37 373 773 869
Total 3 948 013 707 491 1 967 717 91 720 509 855 10 780 384 158 7 619 734 Data up to October 2015 only.Source: BEOE, 2015a.
Appendix
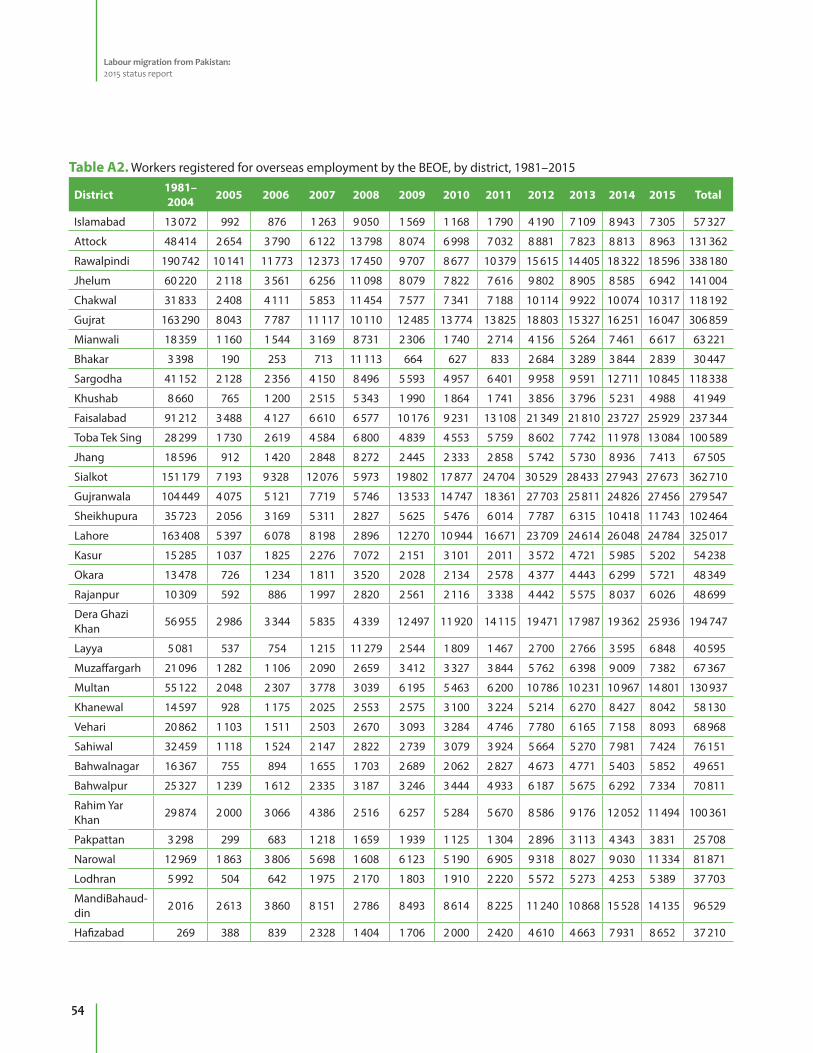
Labour migration from Pakistan: 2015 status report
54
Table A2. Workers registered for overseas employment by the BEOE, by district, 1981–2015
District 1981–2004 2005 2006 2007 2008 2009 2010 2011 2012 2013 2014 2015 Total
Islamabad 13 072 992 876 1 263 9 050 1 569 1 168 1 790 4 190 7 109 8 943 7 305 57 327
Attock 48 414 2 654 3 790 6 122 13 798 8 074 6 998 7 032 8 881 7 823 8 813 8 963 131 362
Rawalpindi 190 742 10 141 11 773 12 373 17 450 9 707 8 677 10 379 15 615 14 405 18 322 18 596 338 180
Jhelum 60 220 2 118 3 561 6 256 11 098 8 079 7 822 7 616 9 802 8 905 8 585 6 942 141 004
Chakwal 31 833 2 408 4 111 5 853 11 454 7 577 7 341 7 188 10 114 9 922 10 074 10 317 118 192
Gujrat 163 290 8 043 7 787 11 117 10 110 12 485 13 774 13 825 18 803 15 327 16 251 16 047 306 859
Mianwali 18 359 1 160 1 544 3 169 8 731 2 306 1 740 2 714 4 156 5 264 7 461 6 617 63 221
Bhakar 3 398 190 253 713 11 113 664 627 833 2 684 3 289 3 844 2 839 30 447
Sargodha 41 152 2 128 2 356 4 150 8 496 5 593 4 957 6 401 9 958 9 591 12 711 10 845 118 338
Khushab 8 660 765 1 200 2 515 5 343 1 990 1 864 1 741 3 856 3 796 5 231 4 988 41 949
Faisalabad 91 212 3 488 4 127 6 610 6 577 10 176 9 231 13 108 21 349 21 810 23 727 25 929 237 344
Toba Tek Sing 28 299 1 730 2 619 4 584 6 800 4 839 4 553 5 759 8 602 7 742 11 978 13 084 100 589
Jhang 18 596 912 1 420 2 848 8 272 2 445 2 333 2 858 5 742 5 730 8 936 7 413 67 505
Sialkot 151 179 7 193 9 328 12 076 5 973 19 802 17 877 24 704 30 529 28 433 27 943 27 673 362 710
Gujranwala 104 449 4 075 5 121 7 719 5 746 13 533 14 747 18 361 27 703 25 811 24 826 27 456 279 547
Sheikhupura 35 723 2 056 3 169 5 311 2 827 5 625 5 476 6 014 7 787 6 315 10 418 11 743 102 464
Lahore 163 408 5 397 6 078 8 198 2 896 12 270 10 944 16 671 23 709 24 614 26 048 24 784 325 017
Kasur 15 285 1 037 1 825 2 276 7 072 2 151 3 101 2 011 3 572 4 721 5 985 5 202 54 238
Okara 13 478 726 1 234 1 811 3 520 2 028 2 134 2 578 4 377 4 443 6 299 5 721 48 349
Rajanpur 10 309 592 886 1 997 2 820 2 561 2 116 3 338 4 442 5 575 8 037 6 026 48 699
Dera Ghazi Khan
56 955 2 986 3 344 5 835 4 339 12 497 11 920 14 115 19 471 17 987 19 362 25 936 194 747
Layya 5 081 537 754 1 215 11 279 2 544 1 809 1 467 2 700 2 766 3 595 6 848 40 595
Muzaffargarh 21 096 1 282 1 106 2 090 2 659 3 412 3 327 3 844 5 762 6 398 9 009 7 382 67 367
Multan 55 122 2 048 2 307 3 778 3 039 6 195 5 463 6 200 10 786 10 231 10 967 14 801 130 937
Khanewal 14 597 928 1 175 2 025 2 553 2 575 3 100 3 224 5 214 6 270 8 427 8 042 58 130
Vehari 20 862 1 103 1 511 2 503 2 670 3 093 3 284 4 746 7 780 6 165 7 158 8 093 68 968
Sahiwal 32 459 1 118 1 524 2 147 2 822 2 739 3 079 3 924 5 664 5 270 7 981 7 424 76 151
Bahwalnagar 16 367 755 894 1 655 1 703 2 689 2 062 2 827 4 673 4 771 5 403 5 852 49 651
Bahwalpur 25 327 1 239 1 612 2 335 3 187 3 246 3 444 4 933 6 187 5 675 6 292 7 334 70 811
Rahim Yar Khan
29 874 2 000 3 066 4 386 2 516 6 257 5 284 5 670 8 586 9 176 12 052 11 494 100 361
Pakpattan 3 298 299 683 1 218 1 659 1 939 1 125 1 304 2 896 3 113 4 343 3 831 25 708
Narowal 12 969 1 863 3 806 5 698 1 608 6 123 5 190 6 905 9 318 8 027 9 030 11 334 81 871
Lodhran 5 992 504 642 1 975 2 170 1 803 1 910 2 220 5 572 5 273 4 253 5 389 37 703
MandiBahaud-din
2 016 2 613 3 860 8 151 2 786 8 493 8 614 8 225 11 240 10 868 15 528 14 135 96 529
Hafizabad 269 388 839 2 328 1 404 1 706 2 000 2 420 4 610 4 663 7 931 8 652 37 210
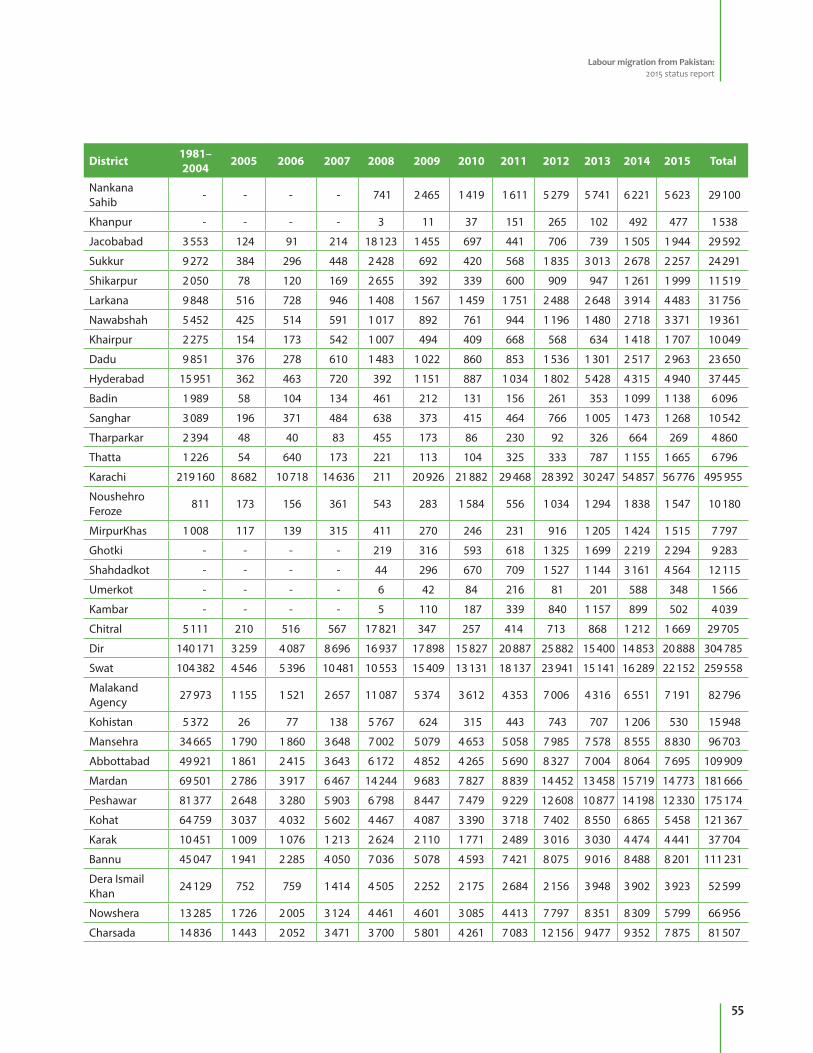
Labour migration from Pakistan: 2015 status report
55
District 1981–2004 2005 2006 2007 2008 2009 2010 2011 2012 2013 2014 2015 Total
Nankana Sahib
- - - - 741 2 465 1 419 1 611 5 279 5 741 6 221 5 623 29 100
Khanpur - - - - 3 11 37 151 265 102 492 477 1 538
Jacobabad 3 553 124 91 214 18 123 1 455 697 441 706 739 1 505 1 944 29 592
Sukkur 9 272 384 296 448 2 428 692 420 568 1 835 3 013 2 678 2 257 24 291
Shikarpur 2 050 78 120 169 2 655 392 339 600 909 947 1 261 1 999 11 519
Larkana 9 848 516 728 946 1 408 1 567 1 459 1 751 2 488 2 648 3 914 4 483 31 756
Nawabshah 5 452 425 514 591 1 017 892 761 944 1 196 1 480 2 718 3 371 19 361
Khairpur 2 275 154 173 542 1 007 494 409 668 568 634 1 418 1 707 10 049
Dadu 9 851 376 278 610 1 483 1 022 860 853 1 536 1 301 2 517 2 963 23 650
Hyderabad 15 951 362 463 720 392 1 151 887 1 034 1 802 5 428 4 315 4 940 37 445
Badin 1 989 58 104 134 461 212 131 156 261 353 1 099 1 138 6 096
Sanghar 3 089 196 371 484 638 373 415 464 766 1 005 1 473 1 268 10 542
Tharparkar 2 394 48 40 83 455 173 86 230 92 326 664 269 4 860
Thatta 1 226 54 640 173 221 113 104 325 333 787 1 155 1 665 6 796
Karachi 219 160 8 682 10 718 14 636 211 20 926 21 882 29 468 28 392 30 247 54 857 56 776 495 955
Noushehro Feroze
811 173 156 361 543 283 1 584 556 1 034 1 294 1 838 1 547 10 180
MirpurKhas 1 008 117 139 315 411 270 246 231 916 1 205 1 424 1 515 7 797
Ghotki - - - - 219 316 593 618 1 325 1 699 2 219 2 294 9 283
Shahdadkot - - - - 44 296 670 709 1 527 1 144 3 161 4 564 12 115
Umerkot - - - - 6 42 84 216 81 201 588 348 1 566
Kambar - - - - 5 110 187 339 840 1 157 899 502 4 039
Chitral 5 111 210 516 567 17 821 347 257 414 713 868 1 212 1 669 29 705
Dir 140 171 3 259 4 087 8 696 16 937 17 898 15 827 20 887 25 882 15 400 14 853 20 888 304 785
Swat 104 382 4 546 5 396 10 481 10 553 15 409 13 131 18 137 23 941 15 141 16 289 22 152 259 558
Malakand Agency
27 973 1 155 1 521 2 657 11 087 5 374 3 612 4 353 7 006 4 316 6 551 7 191 82 796
Kohistan 5 372 26 77 138 5 767 624 315 443 743 707 1 206 530 15 948
Mansehra 34 665 1 790 1 860 3 648 7 002 5 079 4 653 5 058 7 985 7 578 8 555 8 830 96 703
Abbottabad 49 921 1 861 2 415 3 643 6 172 4 852 4 265 5 690 8 327 7 004 8 064 7 695 109 909
Mardan 69 501 2 786 3 917 6 467 14 244 9 683 7 827 8 839 14 452 13 458 15 719 14 773 181 666
Peshawar 81 377 2 648 3 280 5 903 6 798 8 447 7 479 9 229 12 608 10 877 14 198 12 330 175 174
Kohat 64 759 3 037 4 032 5 602 4 467 4 087 3 390 3 718 7 402 8 550 6 865 5 458 121 367
Karak 10 451 1 009 1 076 1 213 2 624 2 110 1 771 2 489 3 016 3 030 4 474 4 441 37 704
Bannu 45 047 1 941 2 285 4 050 7 036 5 078 4 593 7 421 8 075 9 016 8 488 8 201 111 231
Dera Ismail Khan
24 129 752 759 1 414 4 505 2 252 2 175 2 684 2 156 3 948 3 902 3 923 52 599
Nowshera 13 285 1 726 2 005 3 124 4 461 4 601 3 085 4 413 7 797 8 351 8 309 5 799 66 956
Charsada 14 836 1 443 2 052 3 471 3 700 5 801 4 261 7 083 12 156 9 477 9 352 7 875 81 507
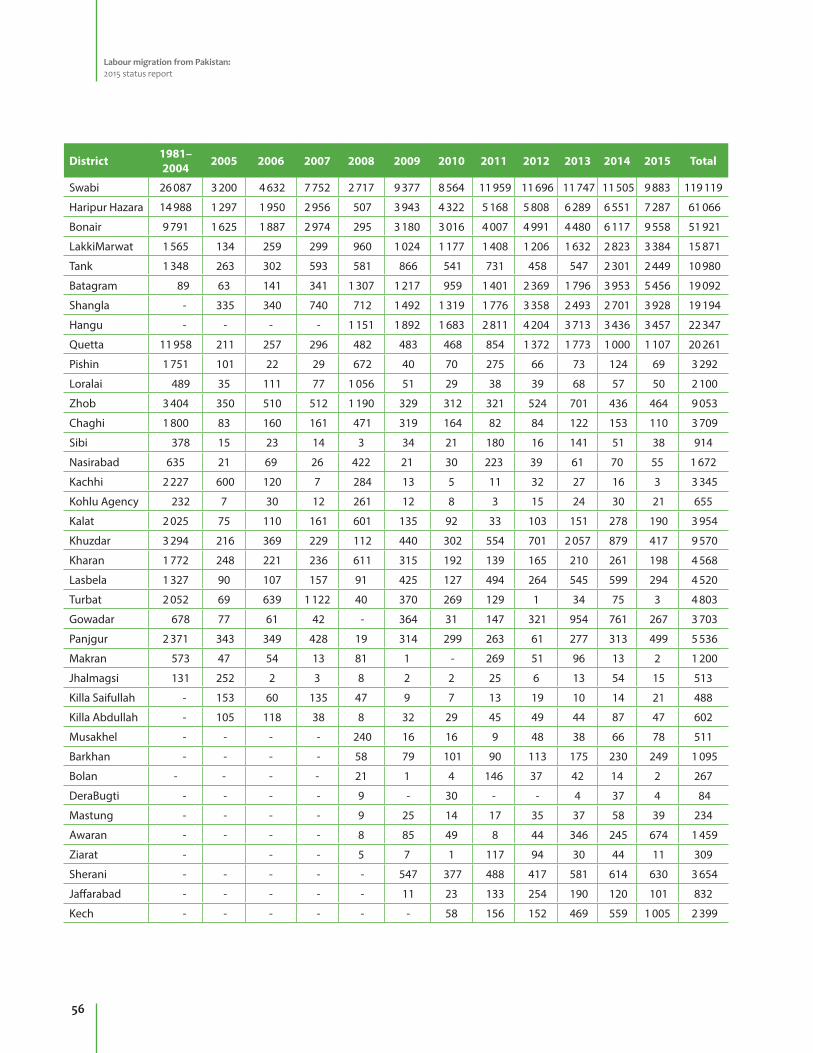
Labour migration from Pakistan: 2015 status report
56
District 1981–2004 2005 2006 2007 2008 2009 2010 2011 2012 2013 2014 2015 Total
Swabi 26 087 3 200 4 632 7 752 2 717 9 377 8 564 11 959 11 696 11 747 11 505 9 883 119 119
Haripur Hazara 14 988 1 297 1 950 2 956 507 3 943 4 322 5 168 5 808 6 289 6 551 7 287 61 066
Bonair 9 791 1 625 1 887 2 974 295 3 180 3 016 4 007 4 991 4 480 6 117 9 558 51 921
LakkiMarwat 1 565 134 259 299 960 1 024 1 177 1 408 1 206 1 632 2 823 3 384 15 871
Tank 1 348 263 302 593 581 866 541 731 458 547 2 301 2 449 10 980
Batagram 89 63 141 341 1 307 1 217 959 1 401 2 369 1 796 3 953 5 456 19 092
Shangla - 335 340 740 712 1 492 1 319 1 776 3 358 2 493 2 701 3 928 19 194
Hangu - - - - 1 151 1 892 1 683 2 811 4 204 3 713 3 436 3 457 22 347
Quetta 11 958 211 257 296 482 483 468 854 1 372 1 773 1 000 1 107 20 261
Pishin 1 751 101 22 29 672 40 70 275 66 73 124 69 3 292
Loralai 489 35 111 77 1 056 51 29 38 39 68 57 50 2 100
Zhob 3 404 350 510 512 1 190 329 312 321 524 701 436 464 9 053
Chaghi 1 800 83 160 161 471 319 164 82 84 122 153 110 3 709
Sibi 378 15 23 14 3 34 21 180 16 141 51 38 914
Nasirabad 635 21 69 26 422 21 30 223 39 61 70 55 1 672
Kachhi 2 227 600 120 7 284 13 5 11 32 27 16 3 3 345
Kohlu Agency 232 7 30 12 261 12 8 3 15 24 30 21 655
Kalat 2 025 75 110 161 601 135 92 33 103 151 278 190 3 954
Khuzdar 3 294 216 369 229 112 440 302 554 701 2 057 879 417 9 570
Kharan 1 772 248 221 236 611 315 192 139 165 210 261 198 4 568
Lasbela 1 327 90 107 157 91 425 127 494 264 545 599 294 4 520
Turbat 2 052 69 639 1 122 40 370 269 129 1 34 75 3 4 803
Gowadar 678 77 61 42 - 364 31 147 321 954 761 267 3 703
Panjgur 2 371 343 349 428 19 314 299 263 61 277 313 499 5 536
Makran 573 47 54 13 81 1 - 269 51 96 13 2 1 200
Jhalmagsi 131 252 2 3 8 2 2 25 6 13 54 15 513
Killa Saifullah - 153 60 135 47 9 7 13 19 10 14 21 488
Killa Abdullah - 105 118 38 8 32 29 45 49 44 87 47 602
Musakhel - - - - 240 16 16 9 48 38 66 78 511
Barkhan - - - - 58 79 101 90 113 175 230 249 1 095
Bolan - - - - 21 1 4 146 37 42 14 2 267
DeraBugti - - - - 9 - 30 - - 4 37 4 84
Mastung - - - - 9 25 14 17 35 37 58 39 234
Awaran - - - - 8 85 49 8 44 346 245 674 1 459
Ziarat - - - 5 7 1 117 94 30 44 11 309
Sherani - - - - - 547 377 488 417 581 614 630 3 654
Jaffarabad - - - - - 11 23 133 254 190 120 101 832
Kech - - - - - - 58 156 152 469 559 1 005 2 399
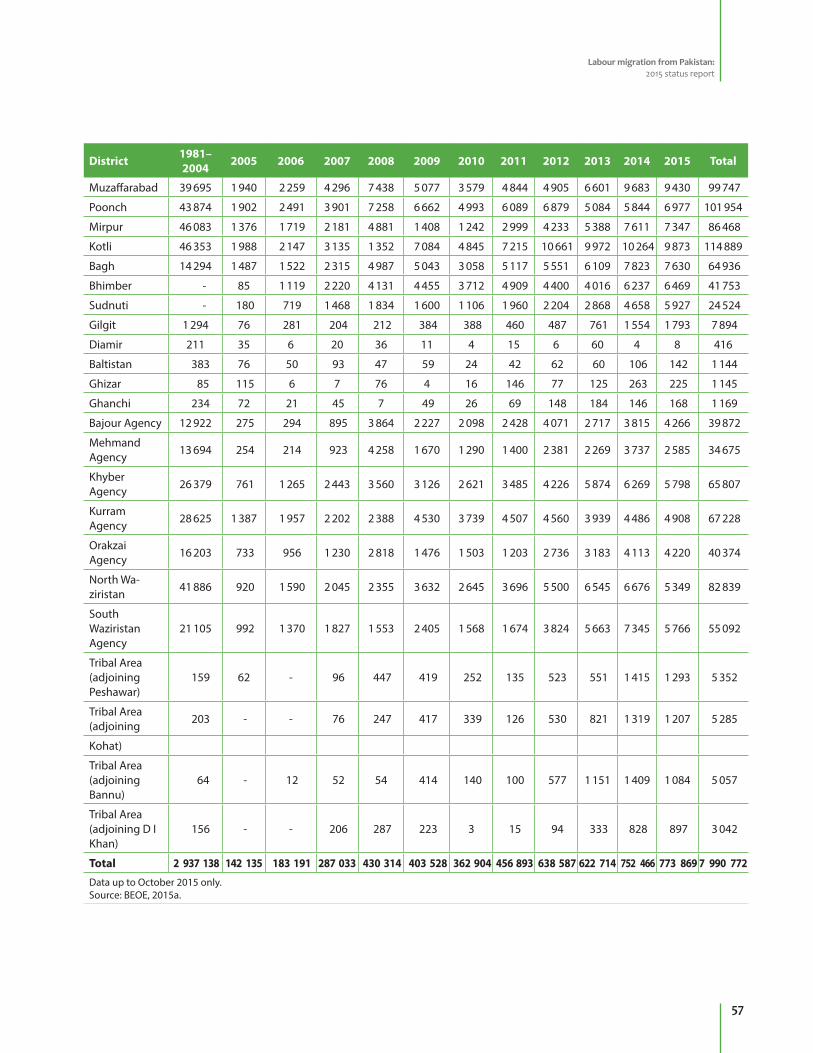
Labour migration from Pakistan: 2015 status report
57
District 1981–2004 2005 2006 2007 2008 2009 2010 2011 2012 2013 2014 2015 Total
Muzaffarabad 39 695 1 940 2 259 4 296 7 438 5 077 3 579 4 844 4 905 6 601 9 683 9 430 99 747
Poonch 43 874 1 902 2 491 3 901 7 258 6 662 4 993 6 089 6 879 5 084 5 844 6 977 101 954
Mirpur 46 083 1 376 1 719 2 181 4 881 1 408 1 242 2 999 4 233 5 388 7 611 7 347 86 468
Kotli 46 353 1 988 2 147 3 135 1 352 7 084 4 845 7 215 10 661 9 972 10 264 9 873 114 889
Bagh 14 294 1 487 1 522 2 315 4 987 5 043 3 058 5 117 5 551 6 109 7 823 7 630 64 936
Bhimber - 85 1 119 2 220 4 131 4 455 3 712 4 909 4 400 4 016 6 237 6 469 41 753
Sudnuti - 180 719 1 468 1 834 1 600 1 106 1 960 2 204 2 868 4 658 5 927 24 524
Gilgit 1 294 76 281 204 212 384 388 460 487 761 1 554 1 793 7 894
Diamir 211 35 6 20 36 11 4 15 6 60 4 8 416
Baltistan 383 76 50 93 47 59 24 42 62 60 106 142 1 144
Ghizar 85 115 6 7 76 4 16 146 77 125 263 225 1 145
Ghanchi 234 72 21 45 7 49 26 69 148 184 146 168 1 169
Bajour Agency 12 922 275 294 895 3 864 2 227 2 098 2 428 4 071 2 717 3 815 4 266 39 872
Mehmand Agency
13 694 254 214 923 4 258 1 670 1 290 1 400 2 381 2 269 3 737 2 585 34 675
Khyber Agency
26 379 761 1 265 2 443 3 560 3 126 2 621 3 485 4 226 5 874 6 269 5 798 65 807
Kurram Agency
28 625 1 387 1 957 2 202 2 388 4 530 3 739 4 507 4 560 3 939 4 486 4 908 67 228
Orakzai Agency
16 203 733 956 1 230 2 818 1 476 1 503 1 203 2 736 3 183 4 113 4 220 40 374
North Wa-ziristan
41 886 920 1 590 2 045 2 355 3 632 2 645 3 696 5 500 6 545 6 676 5 349 82 839
South Waziristan Agency
21 105 992 1 370 1 827 1 553 2 405 1 568 1 674 3 824 5 663 7 345 5 766 55 092
Tribal Area (adjoining Peshawar)
159 62 - 96 447 419 252 135 523 551 1 415 1 293 5 352
Tribal Area (adjoining
203 - - 76 247 417 339 126 530 821 1 319 1 207 5 285
Kohat)
Tribal Area (adjoining Bannu)
64 - 12 52 54 414 140 100 577 1 151 1 409 1 084 5 057
Tribal Area (adjoining D I Khan)
156 - - 206 287 223 3 15 94 333 828 897 3 042
Total 2 937 138 142 135 183 191 287 033 430 314 403 528 362 904 456 893 638 587 622 714 752 466 773 869 7 990 772
Data up to October 2015 only.Source: BEOE, 2015a.
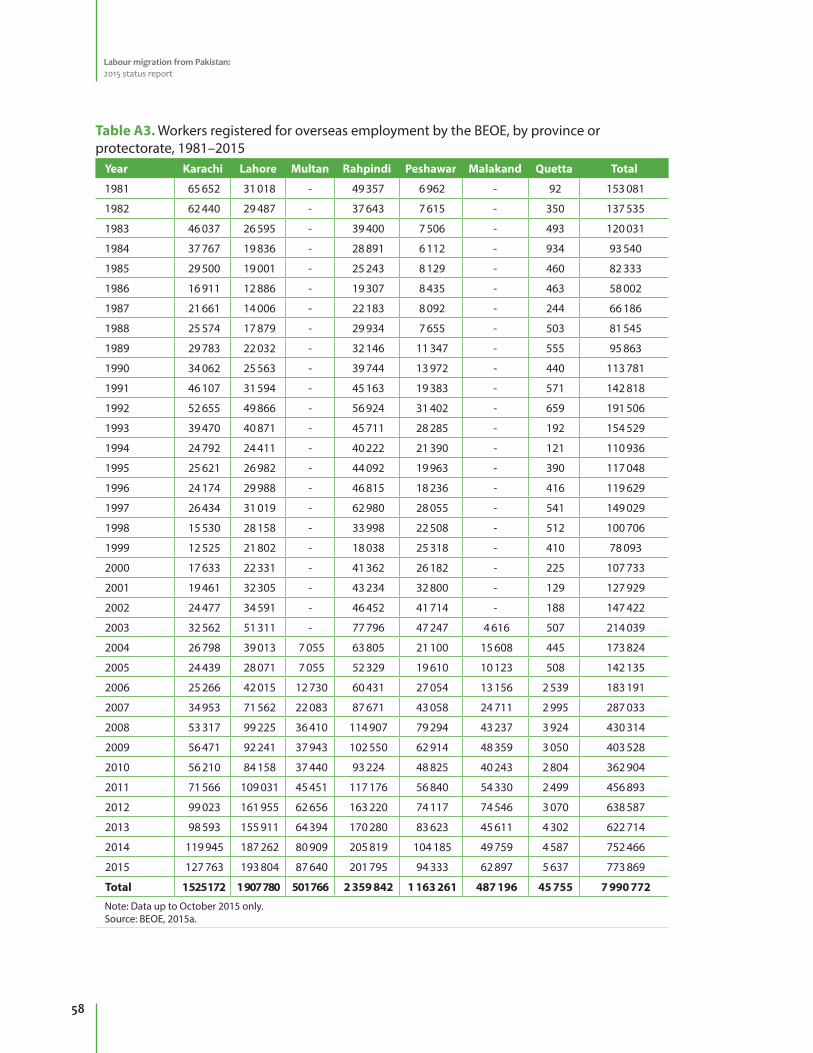
Labour migration from Pakistan: 2015 status report
58
Table A3. Workers registered for overseas employment by the BEOE, by province or protectorate, 1981–2015
Year Karachi Lahore Multan Rahpindi Peshawar Malakand Quetta Total
1981 65 652 31 018 - 49 357 6 962 - 92 153 081
1982 62 440 29 487 - 37 643 7 615 - 350 137 535
1983 46 037 26 595 - 39 400 7 506 - 493 120 031
1984 37 767 19 836 - 28 891 6 112 - 934 93 540
1985 29 500 19 001 - 25 243 8 129 - 460 82 333
1986 16 911 12 886 - 19 307 8 435 - 463 58 002
1987 21 661 14 006 - 22 183 8 092 - 244 66 186
1988 25 574 17 879 - 29 934 7 655 - 503 81 545
1989 29 783 22 032 - 32 146 11 347 - 555 95 863
1990 34 062 25 563 - 39 744 13 972 - 440 113 781
1991 46 107 31 594 - 45 163 19 383 - 571 142 818
1992 52 655 49 866 - 56 924 31 402 - 659 191 506
1993 39 470 40 871 - 45 711 28 285 - 192 154 529
1994 24 792 24 411 - 40 222 21 390 - 121 110 936
1995 25 621 26 982 - 44 092 19 963 - 390 117 048
1996 24 174 29 988 - 46 815 18 236 - 416 119 629
1997 26 434 31 019 - 62 980 28 055 - 541 149 029
1998 15 530 28 158 - 33 998 22 508 - 512 100 706
1999 12 525 21 802 - 18 038 25 318 - 410 78 093
2000 17 633 22 331 - 41 362 26 182 - 225 107 733
2001 19 461 32 305 - 43 234 32 800 - 129 127 929
2002 24 477 34 591 - 46 452 41 714 - 188 147 422
2003 32 562 51 311 - 77 796 47 247 4 616 507 214 039
2004 26 798 39 013 7 055 63 805 21 100 15 608 445 173 824
2005 24 439 28 071 7 055 52 329 19 610 10 123 508 142 135
2006 25 266 42 015 12 730 60 431 27 054 13 156 2 539 183 191
2007 34 953 71 562 22 083 87 671 43 058 24 711 2 995 287 033
2008 53 317 99 225 36 410 114 907 79 294 43 237 3 924 430 314
2009 56 471 92 241 37 943 102 550 62 914 48 359 3 050 403 528
2010 56 210 84 158 37 440 93 224 48 825 40 243 2 804 362 904
2011 71 566 109 031 45 451 117 176 56 840 54 330 2 499 456 893
2012 99 023 161 955 62 656 163 220 74 117 74 546 3 070 638 587
2013 98 593 155 911 64 394 170 280 83 623 45 611 4 302 622 714
2014 119 945 187 262 80 909 205 819 104 185 49 759 4 587 752 466
2015 127 763 193 804 87 640 201 795 94 333 62 897 5 637 773 869
Total 1 525 172 1 907 780 501 766 2 359 842 1 163 261 487 196 45 755 7 990 772
Note: Data up to October 2015 only.Source: BEOE, 2015a.
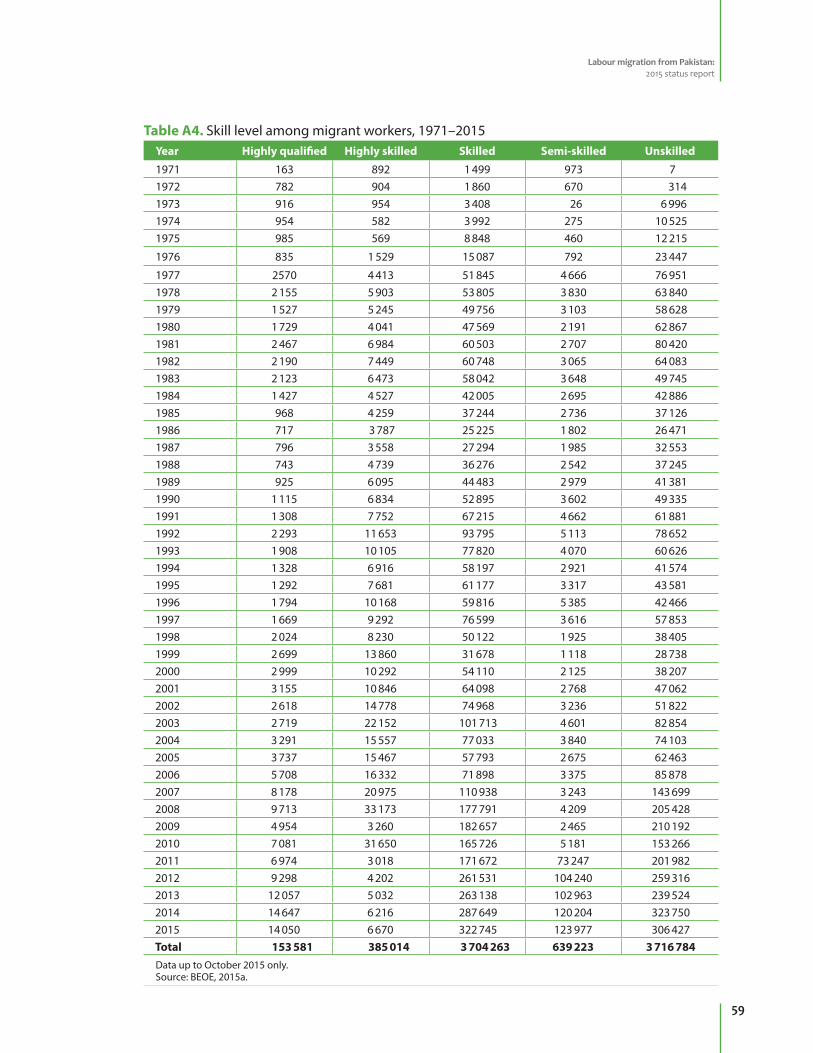
Labour migration from Pakistan: 2015 status report
59
Table A4. Skill level among migrant workers, 1971–2015Year Highly qualified Highly skilled Skilled Semi-skilled Unskilled1971 163 892 1 499 973 7 1972 782 904 1 860 670 314 1973 916 954 3 408 26 6 996 1974 954 582 3 992 275 10 525 1975 985 569 8 848 460 12 215
1976 835 1 529 15 087 792 23 447
1977 2570 4 413 51 845 4 666 76 951 1978 2 155 5 903 53 805 3 830 63 840 1979 1 527 5 245 49 756 3 103 58 628 1980 1 729 4 041 47 569 2 191 62 867 1981 2 467 6 984 60 503 2 707 80 420 1982 2 190 7 449 60 748 3 065 64 083 1983 2 123 6 473 58 042 3 648 49 745 1984 1 427 4 527 42 005 2 695 42 886 1985 968 4 259 37 244 2 736 37 126 1986 717 3 787 25 225 1 802 26 471 1987 796 3 558 27 294 1 985 32 553 1988 743 4 739 36 276 2 542 37 245 1989 925 6 095 44 483 2 979 41 381 1990 1 115 6 834 52 895 3 602 49 335 1991 1 308 7 752 67 215 4 662 61 881 1992 2 293 11 653 93 795 5 113 78 652 1993 1 908 10 105 77 820 4 070 60 626 1994 1 328 6 916 58 197 2 921 41 574 1995 1 292 7 681 61 177 3 317 43 581 1996 1 794 10 168 59 816 5 385 42 466 1997 1 669 9 292 76 599 3 616 57 853 1998 2 024 8 230 50 122 1 925 38 405 1999 2 699 13 860 31 678 1 118 28 738 2000 2 999 10 292 54 110 2 125 38 207 2001 3 155 10 846 64 098 2 768 47 062 2002 2 618 14 778 74 968 3 236 51 822 2003 2 719 22 152 101 713 4 601 82 854 2004 3 291 15 557 77 033 3 840 74 103 2005 3 737 15 467 57 793 2 675 62 463 2006 5 708 16 332 71 898 3 375 85 878 2007 8 178 20 975 110 938 3 243 143 699 2008 9 713 33 173 177 791 4 209 205 428 2009 4 954 3 260 182 657 2 465 210 192 2010 7 081 31 650 165 726 5 181 153 266 2011 6 974 3 018 171 672 73 247 201 982 2012 9 298 4 202 261 531 104 240 259 316 2013 12 057 5 032 263 138 102 963 239 524 2014 14 647 6 216 287 649 120 204 323 750 2015 14 050 6 670 322 745 123 977 306 427 Total 153 581 385 014 3 704 263 639 223 3 716 784 Data up to October 2015 only.Source: BEOE, 2015a.
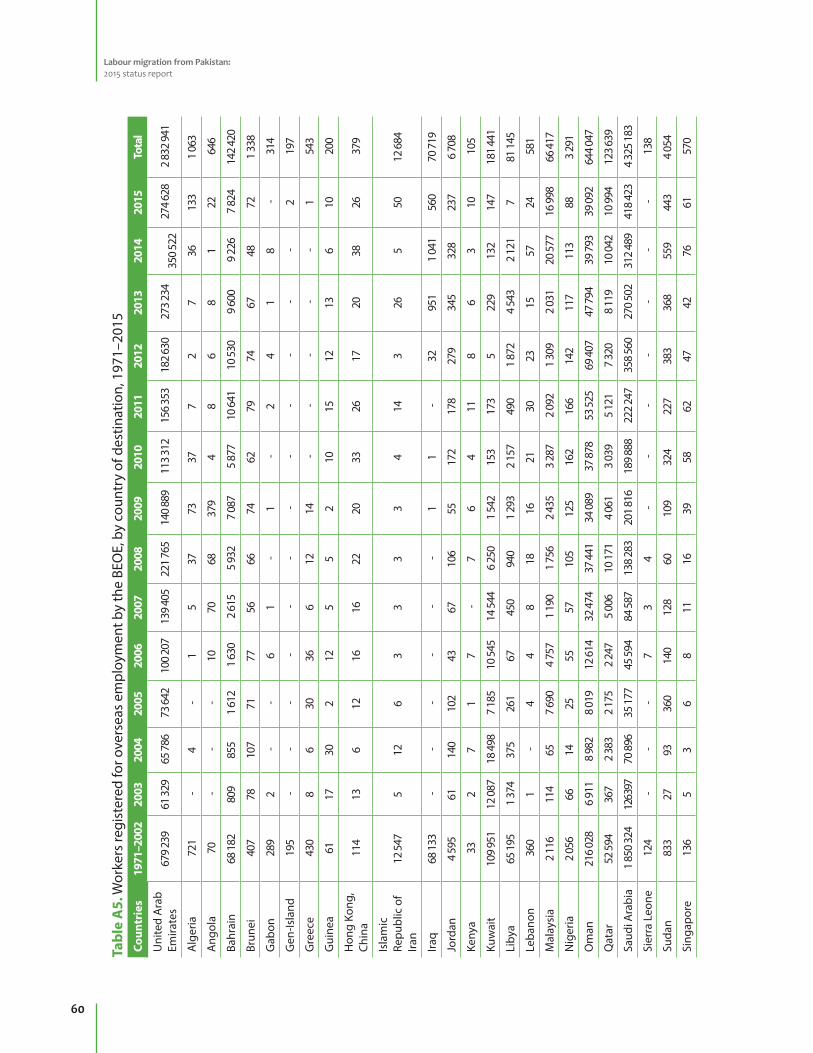
Labour migration from Pakistan: 2015 status report
60
Tabl
e A
5. W
orke
rs re
gist
ered
for o
vers
eas
empl
oym
ent b
y th
e BE
OE,
by
coun
try
of d
estin
atio
n, 1
971–
2015
Coun
trie
s 19
71–2
002
2003
2004
2005
2006
2007
2008
2009
2010
2011
2012
2013
2014
2015
Tota
l
Uni
ted
Ara
b Em
irate
s67
9 23
9 61
329
6
5 78
6 7
3 64
2 10
0 20
7 13
9 40
5 22
1 76
5 1
40 8
89
113
312
1
56 3
53
182
630
2
73 2
34
35
0 52
2 2
74 6
28
2 8
32 9
41
Alg
eria
721
-
4 -
1 5
37
73
37
7 2
7 36
13
3 1
063
Ang
ola
70
- -
- 10
70
68
37
9 4
8 6
8 1
22
646
Bahr
ain
68 1
82
809
855
1 6
12
1 6
30
2 6
15
5 9
32
7 0
87
5 8
77
10
641
10
530
9 6
00
9 2
26
7 8
24
142
420
Brun
ei 4
07
78
107
71
77
56
66
74
62
79
74
67
48
72
1 33
8
Gab
on 2
89
2 -
- 6
1 -
1 -
2 4
1 8
- 3
14
Gen
-Isla
nd 1
95
- -
- -
- -
- -
- -
- -
2 1
97
Gre
ece
430
8
6 30
36
6
12
14
- -
- -
- 1
543
Gui
nea
61
17
30
2 12
5
5 2
10
15
12
13
6 10
2
00
Hon
g Ko
ng,
Chin
a 1
14
13
6 12
16
16
22
20
33
26
17
20
38
26
3
79
Isla
mic
Re
publ
ic o
f Ira
n12
547
5
12
6 3
3 3
3 4
14
3 26
5
50
12 6
84
Iraq
68 1
33
- -
- -
- -
1 1
- 32
95
1 1
041
56
0 70
719
Jord
an4
595
61
140
102
43
67
106
55
172
178
279
345
328
237
6 70
8
Keny
a 3
3 2
7 1
7 -
7 6
4 11
8
6 3
10
105
Kuw
ait
109
951
12 0
87
18
498
7 1
85
10
545
14
544
6 2
50
1 5
42
153
173
5 22
9 13
2 14
7 18
1 44
1
Liby
a65
195
1
374
37
5 26
1 67
45
0 94
0 1
293
2
157
49
0 1
872
4
543
2
121
7
81 1
45
Leba
non
360
1
- 4
4 8
18
16
21
30
23
15
57
24
581
Mal
aysi
a2
116
114
65
7 6
90
4 7
57
1 1
90
1 7
56
2 4
35
3 2
87
2 0
92
1 3
09
2 0
31
20
577
16
998
66 4
17
Nig
eria
2 05
6 66
14
25
55
57
10
5 12
5 16
2 16
6 14
2 11
7 11
3 88
3
291
Om
an21
6 02
8 6
911
8
982
8
019
1
2 61
4 3
2 47
4 3
7 44
1 3
4 08
9 3
7 87
8 5
3 52
5 6
9 40
7 4
7 79
4 3
9 79
3 3
9 09
2 64
4 04
7
Qat
ar52
594
36
7 2
383
2
175
2
247
5
006
1
0 17
1 4
061
3
039
5
121
7
320
8
119
1
0 04
2 1
0 99
4 12
3 63
9
Saud
i Ara
bia
1 8
50 3
24
126 3
97
70
896
35
177
45
594
84
587
138
283
2
01 8
16
189
888
2
22 2
47
358
560
2
70 5
02
312
489
418
423
4
325
183
Sier
ra L
eone
124
-
- -
7 3
4 -
- -
- -
- -
138
Suda
n 8
33
27
93
360
140
128
60
109
324
227
383
368
559
443
4 05
4
Sing
apor
e 1
36
5 3
6 8
11
16
39
58
62
47
42
76
61
570
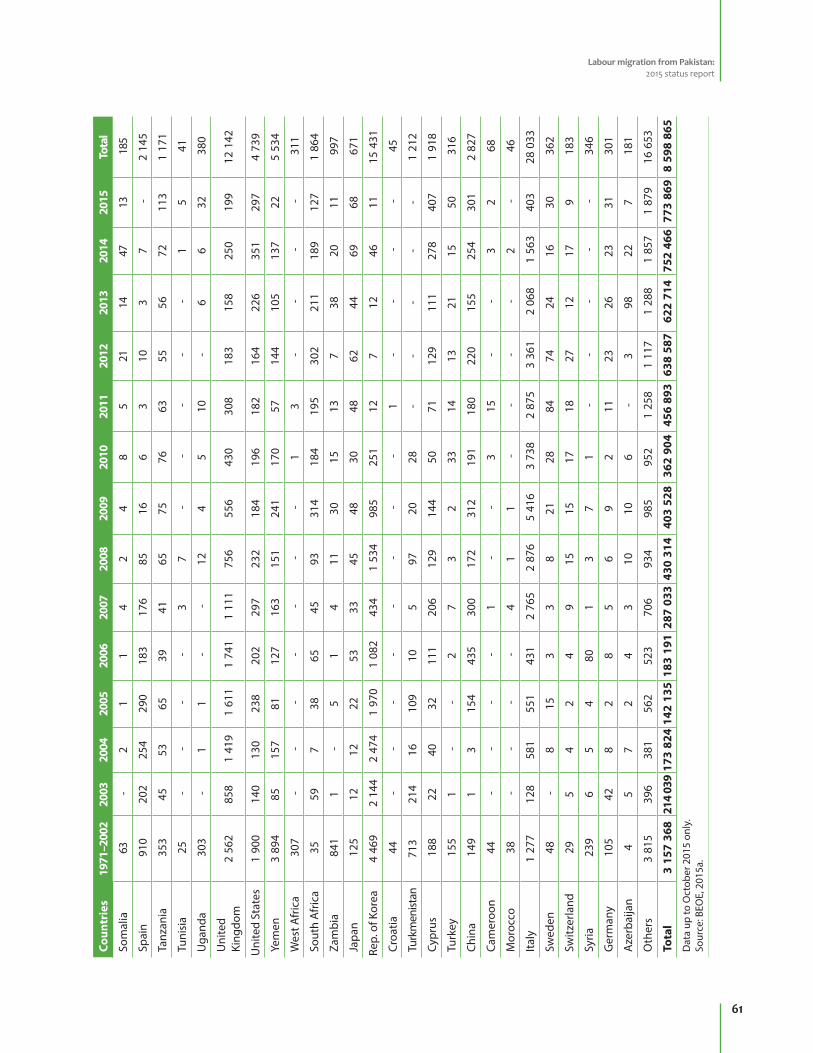
Labour migration from Pakistan: 2015 status report
61
Coun
trie
s 19
71–2
002
2003
2004
2005
2006
2007
2008
2009
2010
2011
2012
2013
2014
2015
Tota
l
Som
alia
63
- 2
1 1
4 2
4 8
5 21
14
47
13
1
85
Spai
n 9
10
202
254
290
183
176
85
16
6 3
10
3 7
- 2
145
Tanz
ania
353
45
53
65
39
41
65
75
76
63
55
56
72
11
3 1
171
Tuni
sia
25
- -
- -
3 7
- -
- -
- 1
5 4
1
Uga
nda
303
-
1 1
- -
12
4 5
10
- 6
6 32
3
80
Uni
ted
King
dom
2 5
62
858
1 4
19
1 6
11
1 7
41
1 1
11
756
556
430
308
183
158
250
199
12 1
42
Uni
ted
Stat
es1
900
14
0 13
0 23
8 20
2 29
7 23
2 18
4 19
6 18
2 16
4 22
6 35
1 29
7 4
739
Yem
en3
894
85
15
7 81
12
7 16
3 15
1 24
1 17
0 57
14
4 10
5 13
7 22
5
534
Wes
t Afr
ica
307
-
- -
- -
- -
1 3
- -
- -
311
Sout
h A
fric
a 3
5 59
7
38
65
45
93
314
184
195
302
211
189
127
1 8
64
Zam
bia
841
1
- 5
1 4
11
30
15
13
7 38
20
11
9
97
Japa
n 1
25
12
12
22
53
33
45
48
30
48
62
44
69
68
671
Rep.
of K
orea
4 4
69
2 1
44
2 4
74
1 9
70
1 0
82
434
1 5
34
985
251
12
7 12
46
11
15
431
Croa
tia 4
4 -
- -
- -
- -
- 1
- -
- -
45
Turk
men
istan
713
214
16
109
10
5 97
20
28
-
- -
- -
1 2
12
Cypr
us 1
88
22
40
32
111
206
129
144
50
71
129
111
278
407
1 9
18
Turk
ey 1
55
1 -
- 2
7 3
2 33
14
13
21
15
50
3
16
Chin
a 1
49
1 3
154
435
300
172
312
191
180
220
155
254
301
2 8
27
Cam
eroo
n 4
4 -
- -
- 1
- -
3 15
-
- 3
2 6
8
Mor
occo
38
- -
- -
4 1
1 -
- -
- 2
- 4
6
Italy
1 2
77
128
581
551
431
2 7
65
2 8
76
5 4
16
3 7
38
2 8
75
3 3
61
2 0
68
1 5
63
403
28 0
33
Swed
en 4
8 -
8 15
3
3 8
21
28
84
74
24
16
30
362
Switz
erla
nd 2
9 5
4 2
4 9
15
15
17
18
27
12
17
9 1
83
Syria
239
6
5 4
80
1 3
7 1
- -
- -
- 3
46
Ger
man
y 1
05
42
8 2
8 5
6 9
2 11
23
26
23
31
3
01
Aze
rbai
jan
4
5 7
2 4
3 10
10
6
- 3
98
22
7 1
81
Oth
ers
3 8
15
396
381
562
523
706
934
985
952
1 2
58
1 1
17
1 2
88
1 8
57
1 8
79
16 6
53
Tota
l 3
157
368
214
039
173
824
142
135
183
191
287
033
430
314
40
3 5
28
362
904
45
6 8
93
638
587
6
22 7
14
752
466
773
869
8
598
865
Dat
a up
to O
ctob
er 2
015
only
.So
urce
: BEO
E, 2
015a
.
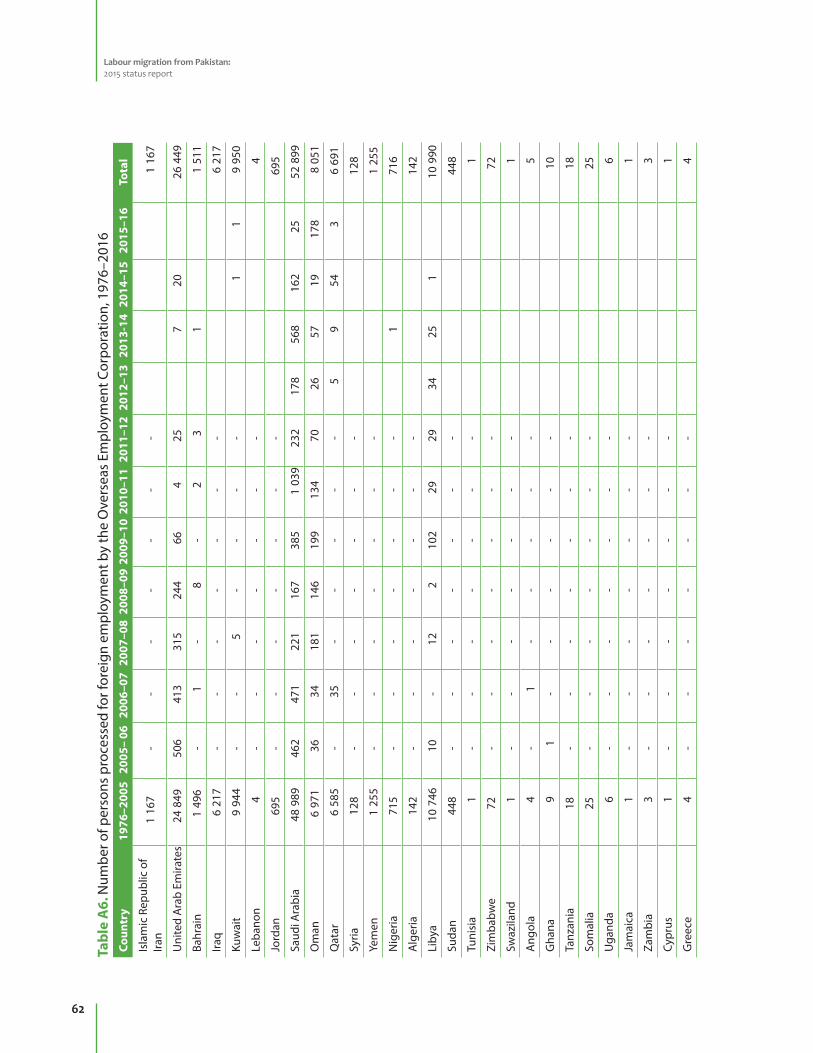
Labour migration from Pakistan: 2015 status report
62
Tabl
e A
6. N
umbe
r of p
erso
ns p
roce
ssed
for f
orei
gn e
mpl
oym
ent b
y th
e O
vers
eas
Empl
oym
ent C
orpo
ratio
n, 1
976–
2016
Coun
try
1976
–200
520
05–
0620
06–0
720
07–0
820
08–0
920
09–1
020
10–1
120
11–1
220
12–1
320
13-1
420
14–1
520
15–1
6To
tal
Isla
mic
Rep
ublic
of
Iran
1 1
67
- -
- -
- -
-
1 1
67
Uni
ted
Ara
b Em
irate
s
24
849
5
06
413
3
15
244
66
4
25
7
20
26
449
Bahr
ain
1 4
96
-
1
-
8
-
2
3
1
1 5
11
Iraq
6 2
17
- -
- -
- -
-
6 2
17
Kuw
ait
9 9
44
- -
5
-
- -
-
1
1
9 9
50
Leba
non
4
- -
- -
- -
-
4
Jord
an
695
-
- -
- -
- -
6
95
Saud
i Ara
bia
4
8 9
89
462
4
71
221
1
67
385
1
039
2
32
178
5
68
162
25
52
899
Om
an
6
971
36
34
1
81
146
1
99
134
70
26
57
19
1
78
8
051
Qat
ar
6
585
-
35
-
- -
- -
5
9
54
3
6
691
Syria
1
28
- -
- -
- -
-
128
Yem
en
1
255
-
- -
- -
- -
1
255
Nig
eria
7
15
- -
- -
- -
-
1
716
Alg
eria
1
42
- -
- -
- -
-
142
Liby
a
10
746
10
-
12
2
1
02
29
29
34
25
1
10
990
Suda
n
448
-
- -
- -
- -
4
48
Tuni
sia
1
- -
- -
- -
-
1
Zim
babw
e
72
-
- -
- -
- -
72
Swaz
iland
1
- -
- -
- -
-
1
Ang
ola
4
-
1
- -
- -
-
5
Gha
na
9
1
- -
- -
- -
10
Tanz
ania
18
- -
- -
- -
-
1
8
Som
alia
25
- -
- -
- -
-
2
5
Uga
nda
6
- -
- -
- -
-
6
Jam
aica
1
- -
- -
- -
-
1
Zam
bia
3
- -
- -
- -
-
3
Cypr
us
1 -
- -
- -
- -
1
Gre
ece
4
- -
- -
- -
-
4
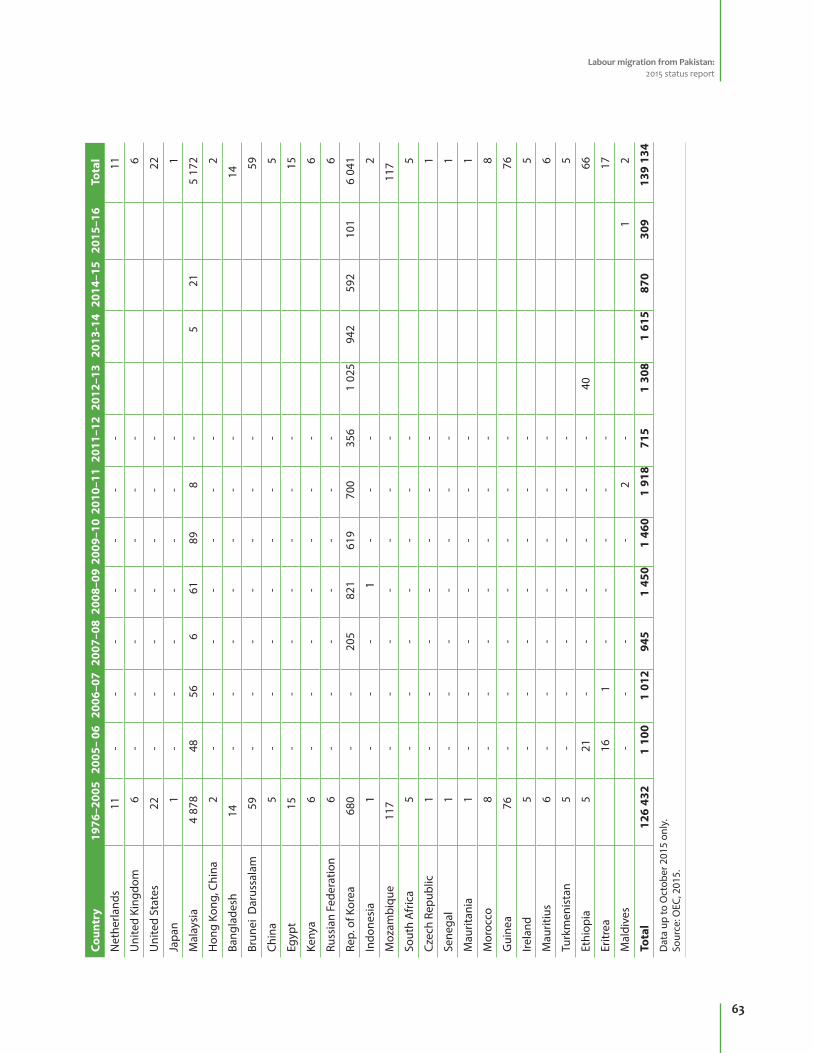
Labour migration from Pakistan: 2015 status report
63
Coun
try
1976
–200
520
05–
0620
06–0
720
07–0
820
08–0
920
09–1
020
10–1
120
11–1
220
12–1
320
13-1
420
14–1
520
15–1
6To
tal
Net
herla
nds
11
- -
- -
- -
-
1
1
Uni
ted
King
dom
6
- -
- -
- -
-
6
Uni
ted
Stat
es
22
-
- -
- -
- -
22
Japa
n
1 -
- -
- -
- -
1
Mal
aysi
a 4
878
48
56
6
61
89
8
-
5
21
5 1
72
Hon
g Ko
ng, C
hina
2
- -
- -
- -
-
2
Bang
lade
sh
14
- -
- -
- -
-
14
Brun
ei D
arus
sala
m
59
-
- -
- -
- -
59
Chin
a
5 -
- -
- -
- -
5
Egyp
t
15
-
- -
- -
- -
15
Keny
a
6 -
- -
- -
- -
6
Russ
ian
Fede
ratio
n
6 -
- -
- -
- -
6
Rep.
of K
orea
6
80
- -
205
8
21
619
7
00
356
1
025
9
42
592
1
01
6 0
41
Indo
nesi
a
1 -
- -
1
-
- -
2
Moz
ambi
que
117
- -
- -
- -
-
11
7
Sout
h A
fric
a
5 -
- -
- -
- -
5
Czec
h Re
publ
ic
1 -
- -
- -
- -
1
Sene
gal
1
- -
- -
- -
-
1
Mau
ritan
ia
1 -
- -
- -
- -
1
Mor
occo
8
- -
- -
- -
-
8
Gui
nea
76
- -
- -
- -
-
7
6
Irela
nd
5 -
- -
- -
- -
5
Mau
ritiu
s
6 -
- -
- -
- -
6
Turk
men
ista
n
5 -
- -
- -
- -
5
Ethi
opia
5
21
- -
- -
- -
40
66
Eritr
ea
16
1
-
- -
- -
17
Mal
dive
s
- -
-
-
2
-
1
2
Tota
l 1
26 4
32
1 1
00
1
012
9
45
1 4
50
1
460
1 9
18
715
1
308
1 6
15
870
3
09
1
39 1
34
Dat
a up
to O
ctob
er 2
015
only
.So
urce
: OEC
, 201
5.

Labour migration from Pakistan: 2015 status report
64
Table A7.Number of persons sent abroad for employment through the Overseas Employment Corporation, by sex, 2004–15
Years Male Female Total Female migrants as % of total migrants
Male migrants as % of total migrants
2004 704 336 1 040 32.3 47.7
2005 858 336 1 194 28.1 39.2
2006 883 200 1 083 18.5 22.7
2007 527 147 674 21.8 27.9
2008 1 380 148 1 528 9.7 10.7
2009 806 120 926 13.0 14.9
2010 1 411 370 1 781 20.8 26.2
2011 989 349 1 338 26.1 35.3
2012 930 84 1 014 8.3 9.0
2013 1 381 76 1 457 5.2 5.5
2014 945 430 1 375 31.3 45.5
2015 800 63 863 7.3 7.9
2004-2015 11 614 2 659 14 273 18.6 22.9 Data up to October 2015 only.Source: OEC, 2015.
Table A8. Number of female workers sent abroad for employment through Overseas Employment Corporation, January 2004–September 2015
2004 2005 2006 2007 2008 2009 2010 2011 2012 2013 2014 2015 Total
Kuwait - - - 1 - - - - - - - - 1
Libya 7 6 - - - - - - - - - - 13
Oman 12 7 10 27 26 78 71 42 3 5 25 12 318
Qatar - 1 9 1 - - - - - 3 23 3 40
Saudi Arabia
314 308 179 115 121 34 299 307 81 68 382 48 2 256
United Arab Emirates
2 14 2 3 1 - - - - - - - 22
Malaysia 1 - - - - 7 - - - - - - 8
Indonesia - - - - - 1 - - - - - - 1
Total 336 336 200 147 148 120 370 349 84 76 430 63 2 659
Data up to October 2015 only.Source: OEC, 2015.
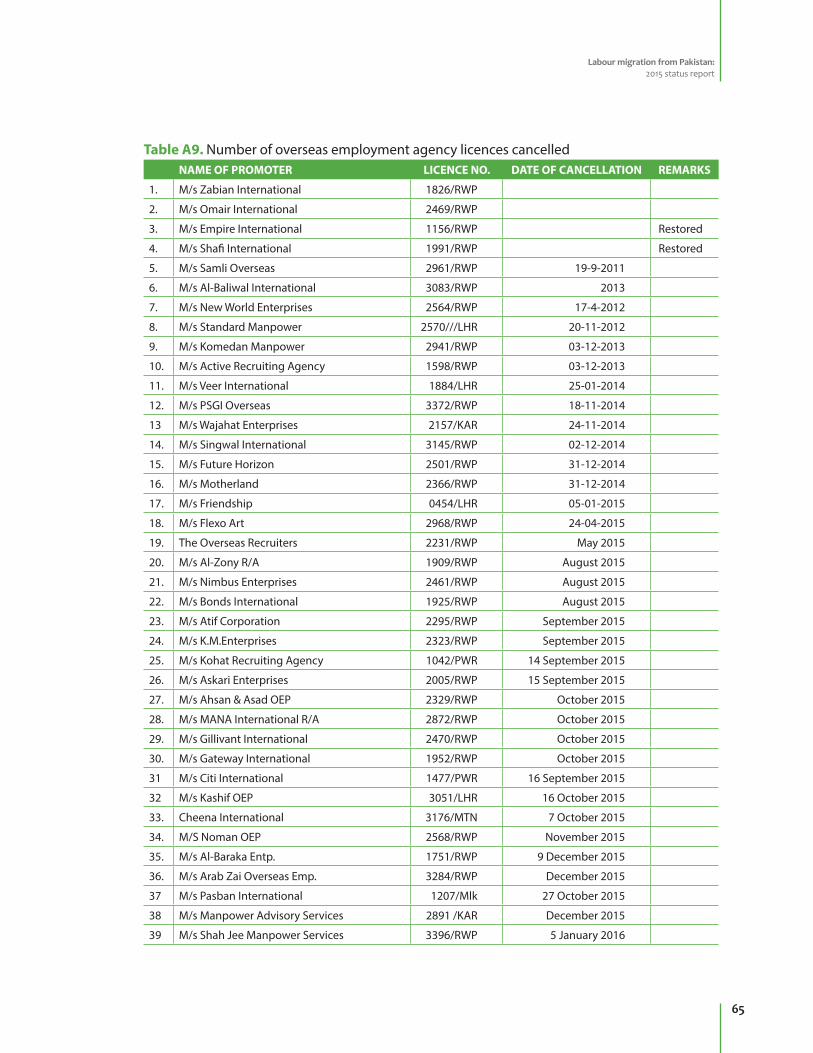
Labour migration from Pakistan: 2015 status report
65
Table A9. Number of overseas employment agency licences cancelled NAME OF PROMOTER LICENCE NO. DATE OF CANCELLATION REMARKS
1. M/s Zabian International 1826/RWP
2. M/s Omair International 2469/RWP
3. M/s Empire International 1156/RWP Restored
4. M/s Shafi International 1991/RWP Restored
5. M/s Samli Overseas 2961/RWP 19-9-2011
6. M/s Al-Baliwal International 3083/RWP 2013
7. M/s New World Enterprises 2564/RWP 17-4-2012
8. M/s Standard Manpower 2570///LHR 20-11-2012
9. M/s Komedan Manpower 2941/RWP 03-12-2013
10. M/s Active Recruiting Agency 1598/RWP 03-12-2013
11. M/s Veer International 1884/LHR 25-01-2014
12. M/s PSGI Overseas 3372/RWP 18-11-2014
13 M/s Wajahat Enterprises 2157/KAR 24-11-2014
14. M/s Singwal International 3145/RWP 02-12-2014
15. M/s Future Horizon 2501/RWP 31-12-2014
16. M/s Motherland 2366/RWP 31-12-2014
17. M/s Friendship 0454/LHR 05-01-2015
18. M/s Flexo Art 2968/RWP 24-04-2015
19. The Overseas Recruiters 2231/RWP May 2015
20. M/s Al-Zony R/A 1909/RWP August 2015
21. M/s Nimbus Enterprises 2461/RWP August 2015
22. M/s Bonds International 1925/RWP August 2015
23. M/s Atif Corporation 2295/RWP September 2015
24. M/s K.M.Enterprises 2323/RWP September 2015
25. M/s Kohat Recruiting Agency 1042/PWR 14 September 2015
26. M/s Askari Enterprises 2005/RWP 15 September 2015
27. M/s Ahsan & Asad OEP 2329/RWP October 2015
28. M/s MANA International R/A 2872/RWP October 2015
29. M/s Gillivant International 2470/RWP October 2015
30. M/s Gateway International 1952/RWP October 2015
31 M/s Citi International 1477/PWR 16 September 2015
32 M/s Kashif OEP 3051/LHR 16 October 2015
33. Cheena International 3176/MTN 7 October 2015
34. M/S Noman OEP 2568/RWP November 2015
35. M/s Al-Baraka Entp. 1751/RWP 9 December 2015
36. M/s Arab Zai Overseas Emp. 3284/RWP December 2015
37 M/s Pasban International 1207/Mlk 27 October 2015
38 M/s Manpower Advisory Services 2891 /KAR December 2015
39 M/s Shah Jee Manpower Services 3396/RWP 5 January 2016
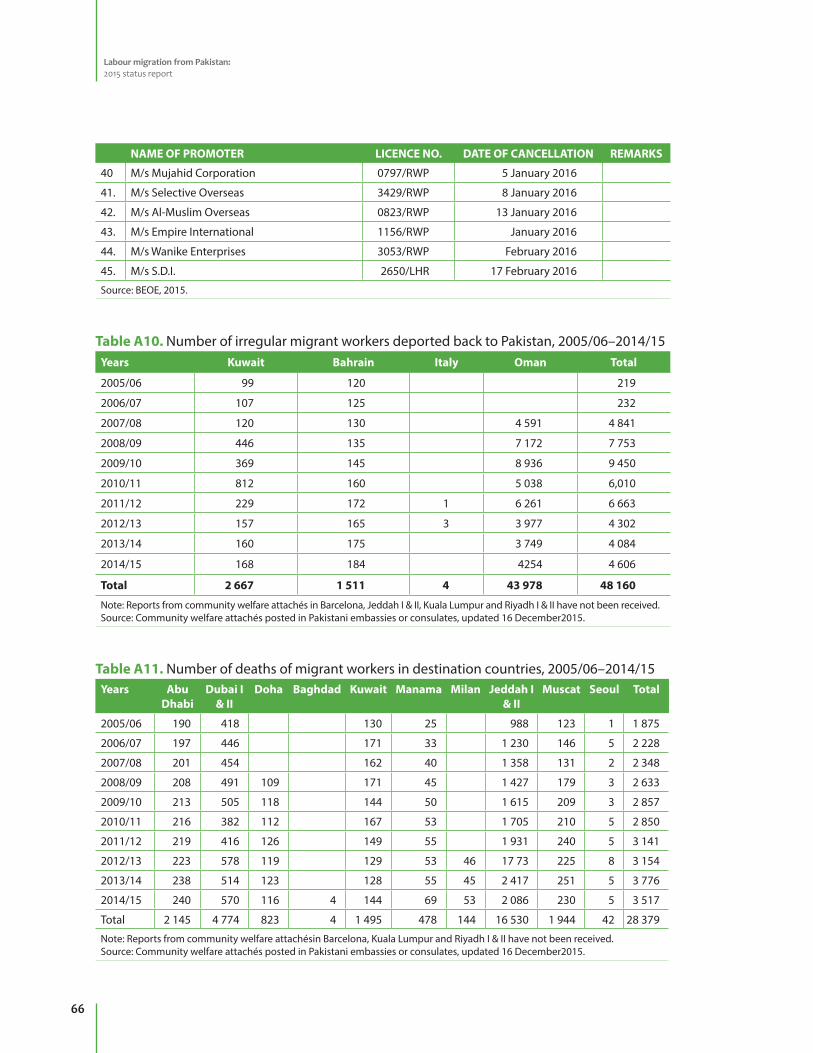
Labour migration from Pakistan: 2015 status report
66
NAME OF PROMOTER LICENCE NO. DATE OF CANCELLATION REMARKS
40 M/s Mujahid Corporation 0797/RWP 5 January 2016
41. M/s Selective Overseas 3429/RWP 8 January 2016
42. M/s Al-Muslim Overseas 0823/RWP 13 January 2016
43. M/s Empire International 1156/RWP January 2016
44. M/s Wanike Enterprises 3053/RWP February 2016
45. M/s S.D.I. 2650/LHR 17 February 2016
Source: BEOE, 2015.
Table A10. Number of irregular migrant workers deported back to Pakistan, 2005/06–2014/15Years Kuwait Bahrain Italy Oman Total
2005/06 99 120 219
2006/07 107 125 232
2007/08 120 130 4 591 4 841
2008/09 446 135 7 172 7 753
2009/10 369 145 8 936 9 450
2010/11 812 160 5 038 6,010
2011/12 229 172 1 6 261 6 663
2012/13 157 165 3 3 977 4 302
2013/14 160 175 3 749 4 084
2014/15 168 184 4254 4 606
Total 2 667 1 511 4 43 978 48 160
Note: Reports from community welfare attachés in Barcelona, Jeddah I & II, Kuala Lumpur and Riyadh I & II have not been received.Source: Community welfare attachés posted in Pakistani embassies or consulates, updated 16 December2015.
Table A11. Number of deaths of migrant workers in destination countries, 2005/06–2014/15Years Abu
DhabiDubai I
& IIDoha Baghdad Kuwait Manama Milan Jeddah I
& IIMuscat Seoul Total
2005/06 190 418 130 25 988 123 1 1 875
2006/07 197 446 171 33 1 230 146 5 2 228
2007/08 201 454 162 40 1 358 131 2 2 348
2008/09 208 491 109 171 45 1 427 179 3 2 633
2009/10 213 505 118 144 50 1 615 209 3 2 857
2010/11 216 382 112 167 53 1 705 210 5 2 850
2011/12 219 416 126 149 55 1 931 240 5 3 141
2012/13 223 578 119 129 53 46 17 73 225 8 3 154
2013/14 238 514 123 128 55 45 2 417 251 5 3 776
2014/15 240 570 116 4 144 69 53 2 086 230 5 3 517
Total 2 145 4 774 823 4 1 495 478 144 16 530 1 944 42 28 379
Note: Reports from community welfare attachésin Barcelona, Kuala Lumpur and Riyadh I & II have not been received.Source: Community welfare attachés posted in Pakistani embassies or consulates, updated 16 December2015.
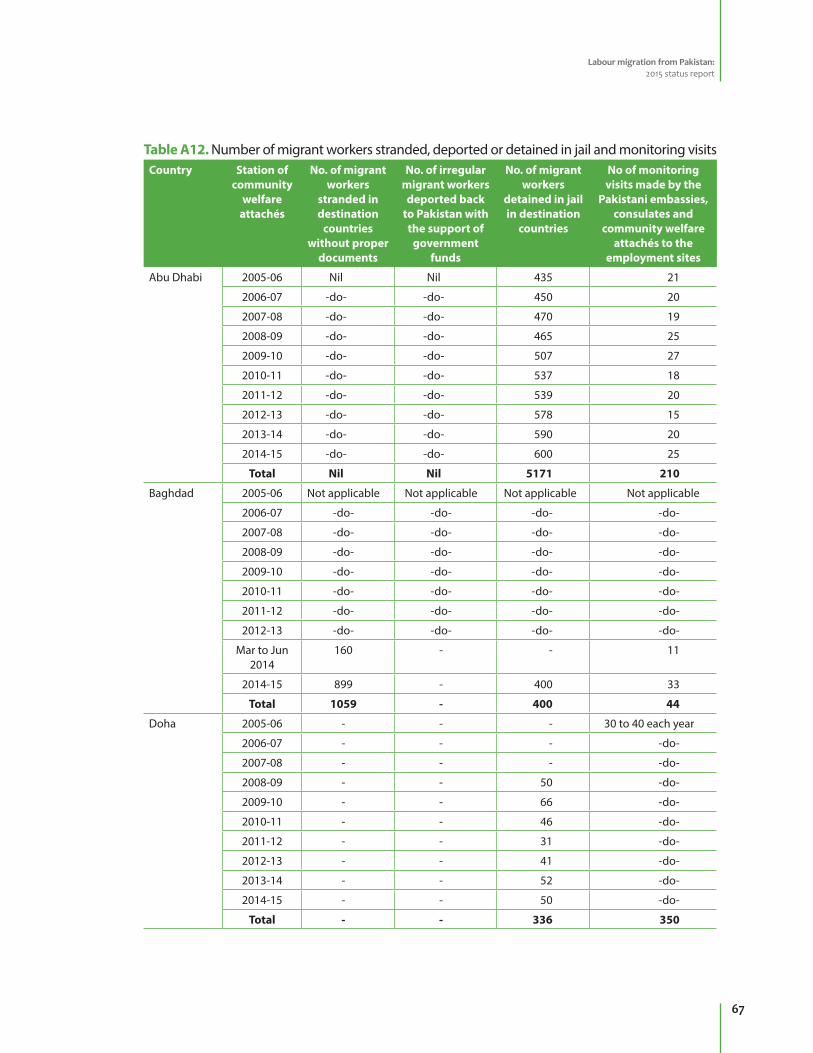
Labour migration from Pakistan: 2015 status report
67
Table A12. Number of migrant workers stranded, deported or detained in jail and monitoring visitsCountry Station of
community welfare
attachés
No. of migrant workers
stranded in destination
countries without proper
documents
No. of irregular migrant workers
deported back to Pakistan with the support of
government funds
No. of migrant workers
detained in jail in destination
countries
No of monitoring visits made by the
Pakistani embassies, consulates and
community welfare attachés to the
employment sites
Abu Dhabi 2005-06 Nil Nil 435 21
2006-07 -do- -do- 450 20
2007-08 -do- -do- 470 19
2008-09 -do- -do- 465 25
2009-10 -do- -do- 507 27
2010-11 -do- -do- 537 18
2011-12 -do- -do- 539 20
2012-13 -do- -do- 578 15
2013-14 -do- -do- 590 20
2014-15 -do- -do- 600 25
Total Nil Nil 5171 210
Baghdad 2005-06 Not applicable Not applicable Not applicable Not applicable
2006-07 -do- -do- -do- -do-
2007-08 -do- -do- -do- -do-
2008-09 -do- -do- -do- -do-
2009-10 -do- -do- -do- -do-
2010-11 -do- -do- -do- -do-
2011-12 -do- -do- -do- -do-
2012-13 -do- -do- -do- -do-
Mar to Jun 2014
160 - - 11
2014-15 899 - 400 33
Total 1059 - 400 44
Doha 2005-06 - - - 30 to 40 each year
2006-07 - - - -do-
2007-08 - - - -do-
2008-09 - - 50 -do-
2009-10 - - 66 -do-
2010-11 - - 46 -do-
2011-12 - - 31 -do-
2012-13 - - 41 -do-
2013-14 - - 52 -do-
2014-15 - - 50 -do-
Total - - 336 350
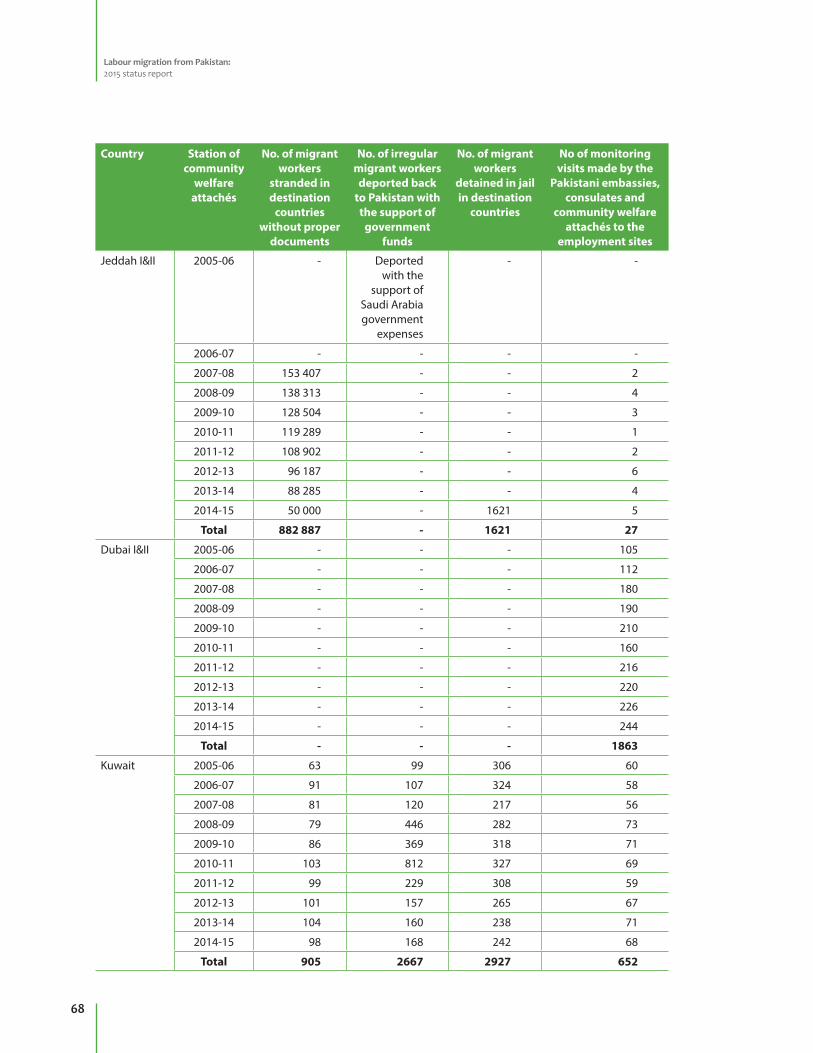
Labour migration from Pakistan: 2015 status report
68
Country Station of community
welfare attachés
No. of migrant workers
stranded in destination
countries without proper
documents
No. of irregular migrant workers
deported back to Pakistan with the support of
government funds
No. of migrant workers
detained in jail in destination
countries
No of monitoring visits made by the
Pakistani embassies, consulates and
community welfare attachés to the
employment sites
Jeddah I&II 2005-06 - Deported with the
support of Saudi Arabia government
expenses
- -
2006-07 - - - -
2007-08 153 407 - - 2
2008-09 138 313 - - 4
2009-10 128 504 - - 3
2010-11 119 289 - - 1
2011-12 108 902 - - 2
2012-13 96 187 - - 6
2013-14 88 285 - - 4
2014-15 50 000 - 1621 5
Total 882 887 - 1621 27
Dubai I&II 2005-06 - - - 105
2006-07 - - - 112
2007-08 - - - 180
2008-09 - - - 190
2009-10 - - - 210
2010-11 - - - 160
2011-12 - - - 216
2012-13 - - - 220
2013-14 - - - 226
2014-15 - - - 244
Total - - - 1863
Kuwait 2005-06 63 99 306 60
2006-07 91 107 324 58
2007-08 81 120 217 56
2008-09 79 446 282 73
2009-10 86 369 318 71
2010-11 103 812 327 69
2011-12 99 229 308 59
2012-13 101 157 265 67
2013-14 104 160 238 71
2014-15 98 168 242 68
Total 905 2667 2927 652
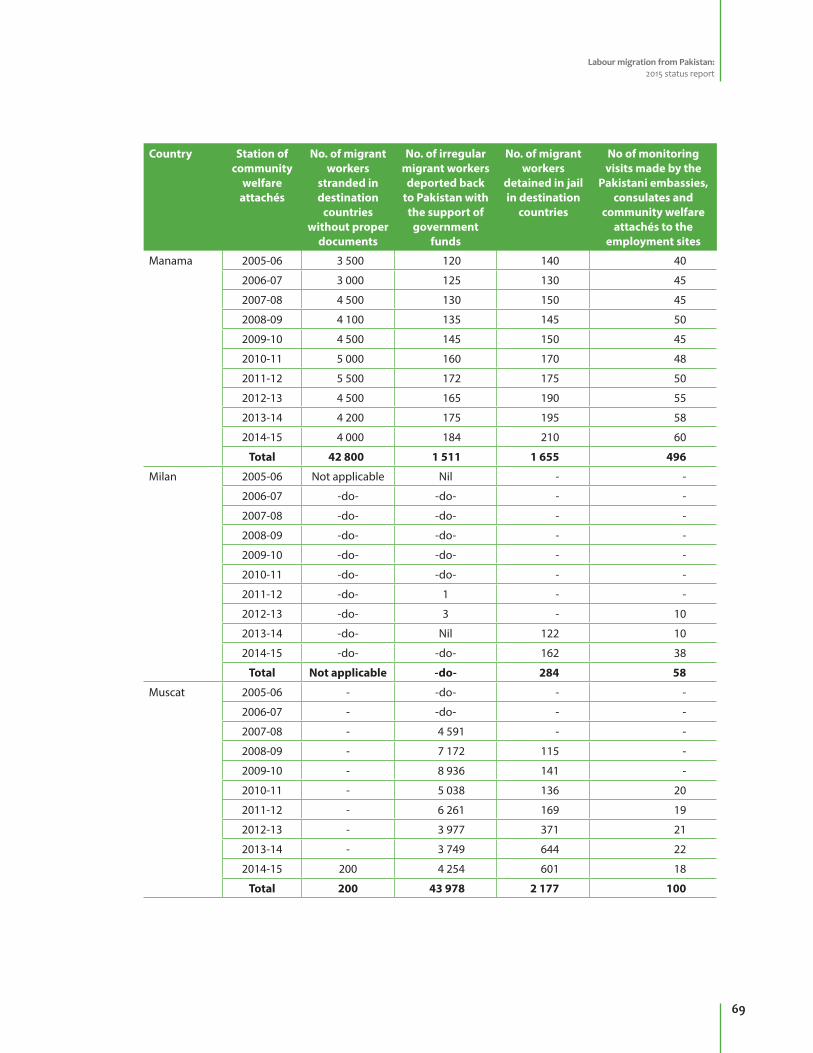
Labour migration from Pakistan: 2015 status report
69
Country Station of community
welfare attachés
No. of migrant workers
stranded in destination
countries without proper
documents
No. of irregular migrant workers
deported back to Pakistan with the support of
government funds
No. of migrant workers
detained in jail in destination
countries
No of monitoring visits made by the
Pakistani embassies, consulates and
community welfare attachés to the
employment sites
Manama 2005-06 3 500 120 140 40
2006-07 3 000 125 130 45
2007-08 4 500 130 150 45
2008-09 4 100 135 145 50
2009-10 4 500 145 150 45
2010-11 5 000 160 170 48
2011-12 5 500 172 175 50
2012-13 4 500 165 190 55
2013-14 4 200 175 195 58
2014-15 4 000 184 210 60
Total 42 800 1 511 1 655 496
Milan 2005-06 Not applicable Nil - -
2006-07 -do- -do- - -
2007-08 -do- -do- - -
2008-09 -do- -do- - -
2009-10 -do- -do- - -
2010-11 -do- -do- - -
2011-12 -do- 1 - -
2012-13 -do- 3 - 10
2013-14 -do- Nil 122 10
2014-15 -do- -do- 162 38
Total Not applicable -do- 284 58
Muscat 2005-06 - -do- - -
2006-07 - -do- - -
2007-08 - 4 591 - -
2008-09 - 7 172 115 -
2009-10 - 8 936 141 -
2010-11 - 5 038 136 20
2011-12 - 6 261 169 19
2012-13 - 3 977 371 21
2013-14 - 3 749 644 22
2014-15 200 4 254 601 18
Total 200 43 978 2 177 100
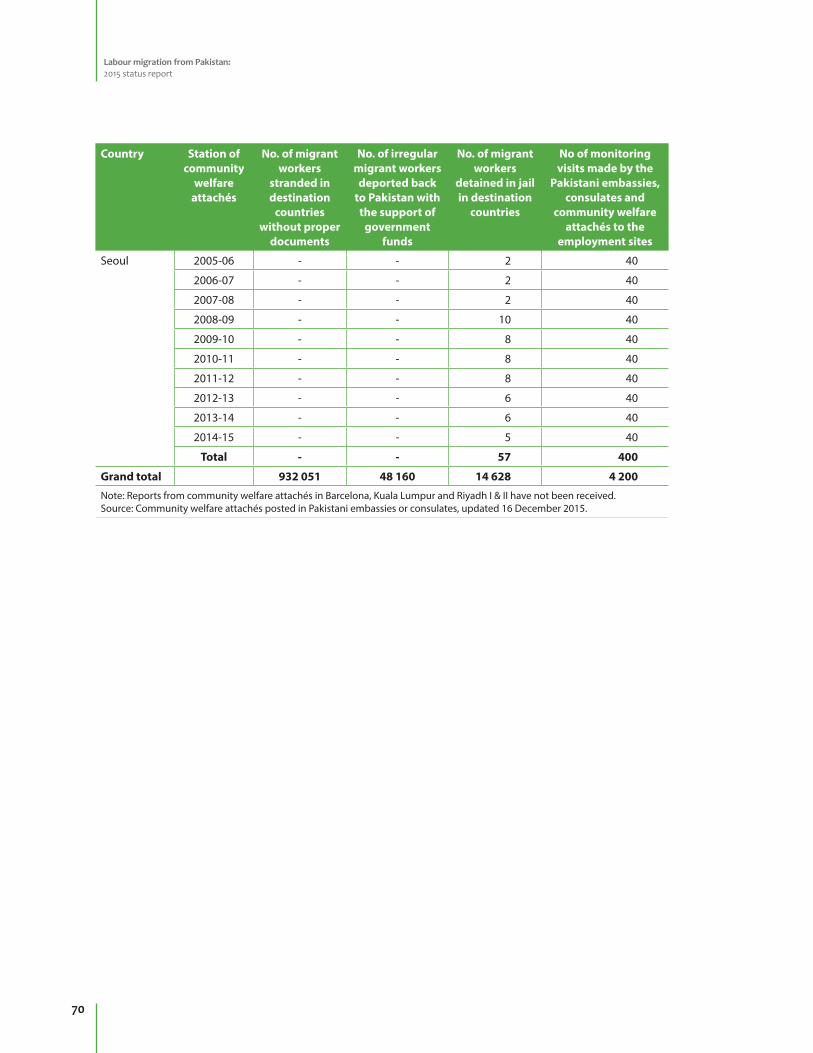
Labour migration from Pakistan: 2015 status report
70
Country Station of community
welfare attachés
No. of migrant workers
stranded in destination
countries without proper
documents
No. of irregular migrant workers
deported back to Pakistan with the support of
government funds
No. of migrant workers
detained in jail in destination
countries
No of monitoring visits made by the
Pakistani embassies, consulates and
community welfare attachés to the
employment sites
Seoul 2005-06 - - 2 40
2006-07 - - 2 40
2007-08 - - 2 40
2008-09 - - 10 40
2009-10 - - 8 40
2010-11 - - 8 40
2011-12 - - 8 40
2012-13 - - 6 40
2013-14 - - 6 40
2014-15 - - 5 40
Total - - 57 400
Grand total 932 051 48 160 14 628 4 200
Note: Reports from community welfare attachés in Barcelona, Kuala Lumpur and Riyadh I & II have not been received.Source: Community welfare attachés posted in Pakistani embassies or consulates, updated 16 December 2015.

Labour migration from Pakistan: 2015 status report
71
Labour migration from Pakistan: 2015 status report
Since the mid-1970s, when dramatically rising oil prices led to an economic boom in the oil-rich countries of the Gulf region, large-scale temporary and circular foreign worker migration has accommodated the associated labour needs. Pakistani workers have been a large presence in that movement but also to other opportunities in all regions of the world. After India, Pakistan is the largest labour sending country of workers in South Asia. Over the past four decades, more than 8 million Pakistanis moved abroad through the formal channel for employment.
While there are a number of actors that generates migration related statistics in Pakistan, this report is the first attempt to consolidate all such data with the aim to analyse and present trends. It also presents government-led achievements in the area of improved labour migration governance and provides recommendations on how labour migration governance can be strengthened through policy, programmes and projects based on statistical evidence.
This report is the first in what is anticipated to be a series of yearly migration status reports to be launched by the Ministry of Overseas Pakistanis and Human Resource Development.
This report is developed with the support of the South Asia Labour Migration Governance project.
The project is funded by the European Union.
Promoting safe migration and protecting migrant workers