Labor Productivity in Israeldanib/israel/SNR2013-Productivity(Eng).pdf · Labor Productivity in...
23
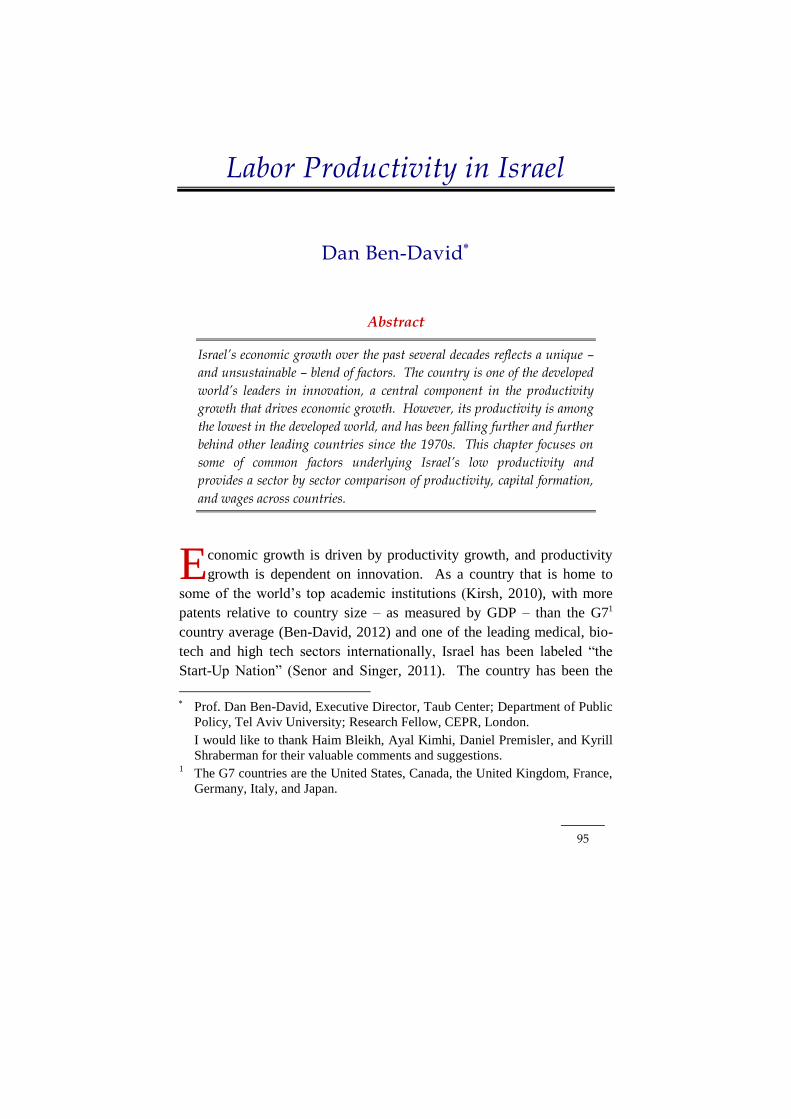
95 Labor Productivity in Israel Dan Ben-David Abstract Israel’s economic growth over the past several decades reflects a unique – and unsustainable – blend of factors. The country is one of the developed world’s leaders in innovation, a central component in the productivity growth that drives economic growth. However, its productivity is among the lowest in the developed world, and has been falling further and further behind other leading countries since the 1970s. This chapter focuses on some of common factors underlying Israel’s low productivity and provides a sector by sector comparison of productivity, capital formation, and wages across countries. conomic growth is driven by productivity growth, and productivity growth is dependent on innovation. As a country that is home to some of the world’s top academic institutions (Kirsh, 2010), with more patents relative to country size – as measured by GDP – than the G7 1 country average (Ben-David, 2012) and one of the leading medical, bio- tech and high tech sectors internationally, Israel has been labeled “the Start-Up Nation” (Senor and Singer, 2011). The country has been the Prof. Dan Ben-David, Executive Director, Taub Center; Department of Public Policy, Tel Aviv University; Research Fellow, CEPR, London. I would like to thank Haim Bleikh, Ayal Kimhi, Daniel Premisler, and Kyrill Shraberman for their valuable comments and suggestions. 1 The G7 countries are the United States, Canada, the United Kingdom, France, Germany, Italy, and Japan. E
Transcript of Labor Productivity in Israeldanib/israel/SNR2013-Productivity(Eng).pdf · Labor Productivity in...
95
Labor Productivity in Israel
Dan Ben-David
Abstract
Israel’s economic growth over the past several decades reflects a unique –
and unsustainable – blend of factors. The country is one of the developed
world’s leaders in innovation, a central component in the productivity
growth that drives economic growth. However, its productivity is among
the lowest in the developed world, and has been falling further and further
behind other leading countries since the 1970s. This chapter focuses on
some of common factors underlying Israel’s low productivity and
provides a sector by sector comparison of productivity, capital formation,
and wages across countries.
conomic growth is driven by productivity growth, and productivity
growth is dependent on innovation. As a country that is home to
some of the world’s top academic institutions (Kirsh, 2010), with more
patents relative to country size – as measured by GDP – than the G71
country average (Ben-David, 2012) and one of the leading medical, bio-
tech and high tech sectors internationally, Israel has been labeled “the
Start-Up Nation” (Senor and Singer, 2011). The country has been the
Prof. Dan Ben-David, Executive Director, Taub Center; Department of Public
Policy, Tel Aviv University; Research Fellow, CEPR, London.
I would like to thank Haim Bleikh, Ayal Kimhi, Daniel Premisler, and Kyrill
Shraberman for their valuable comments and suggestions. 1 The G7 countries are the United States, Canada, the United Kingdom, France,
Germany, Italy, and Japan.
E

96 State of the Nation Report 2013
recipient of venture capital at a level higher than that of any other OECD
country relative to GDP, together with large increases in foreign direct
investments between 1990 and the onset of the recent world-wide
recession (Ben-David, 2012).
1. Productivity, Employment, and Living Standards: An International Comparison
While innovation is a necessary condition for productivity growth, it is
not a sufficient condition. The importance of labor productivity, as
measured by GDP per hour worked, can be seen in Figure 1, which
compares 2012 living standards in all of the OECD countries with some
of the primary determinants of these living standards. In all of these
comparisons, Israel is the base country in the graph (i.e., Israel = 100).
The horizontal axis depicts GDP per capita – reflecting national living
standards – in each of the countries relative to Israel. As can be seen in
the figure, the majority of OECD countries have higher levels of income
than Israel. The vertical axis measures three different GDP determinants.
Rates of employment among prime working age adults aged 35-54 are
higher in nearly all of the countries than in Israel. On the other hand, the
number of hours worked per employed person in the large majority of
these countries is lower than in Israel. Neither one of these measures
appears to be directly related to the level of GDP per capita. The
relationship between the third determinant, labor productivity, and GDP
per capita is readily visible in the figure. The higher the labor
productivity, the higher GDP per person tends to be. In a sense, the
evidence in Figure 1 suggests that when a greater share of the population
is employed and when labor productivity is higher, then each employed
person can work fewer hours while average living standards in the
country will nonetheless be higher.

Labor Productivity in Israel 97
Little has changed with regard to Israel’s relative position in terms of
employment, hours, and productivity since 1997, as can be seen in a
similar graph in earlier work by Ben-David (2003b). In the area of
productivity, Israel has been – and continues to be – facing a major
problem.
Figure 1
Living standards and the labor force, 2012
32 OECD countries relative to Israel
Source: Dan Ben-David, 2003b (updated)
Data: OECD
25
50
75
100
125
150
175
200
225
250
50 75 100 125 150 175 200 225
Employment rates (ages 35-54)
Output per hour (labor productivity)
Work hours per employed person
Norw
ay
Sw
itzerland
United S
tate
s
Austr
alia
Irela
nd
Austr
iaN
eth
erlands
Sw
eden
Denm
ark
Canada
Germ
any
Belg
ium
Fin
land
Icela
nd
United K
ingdom
Fra
nce
Japan
Italy
Spain
New
Zeala
nd
Kore
a
Slo
venia
Czech R
epublic
Slo
vak R
epublic
Gre
ece
Port
ugal
Esto
nia
Chile
Hungary
Pola
nd
Mexic
oT
urk
ey
Isra
el
Israel
Israel = 100
98 State of the Nation Report 2013
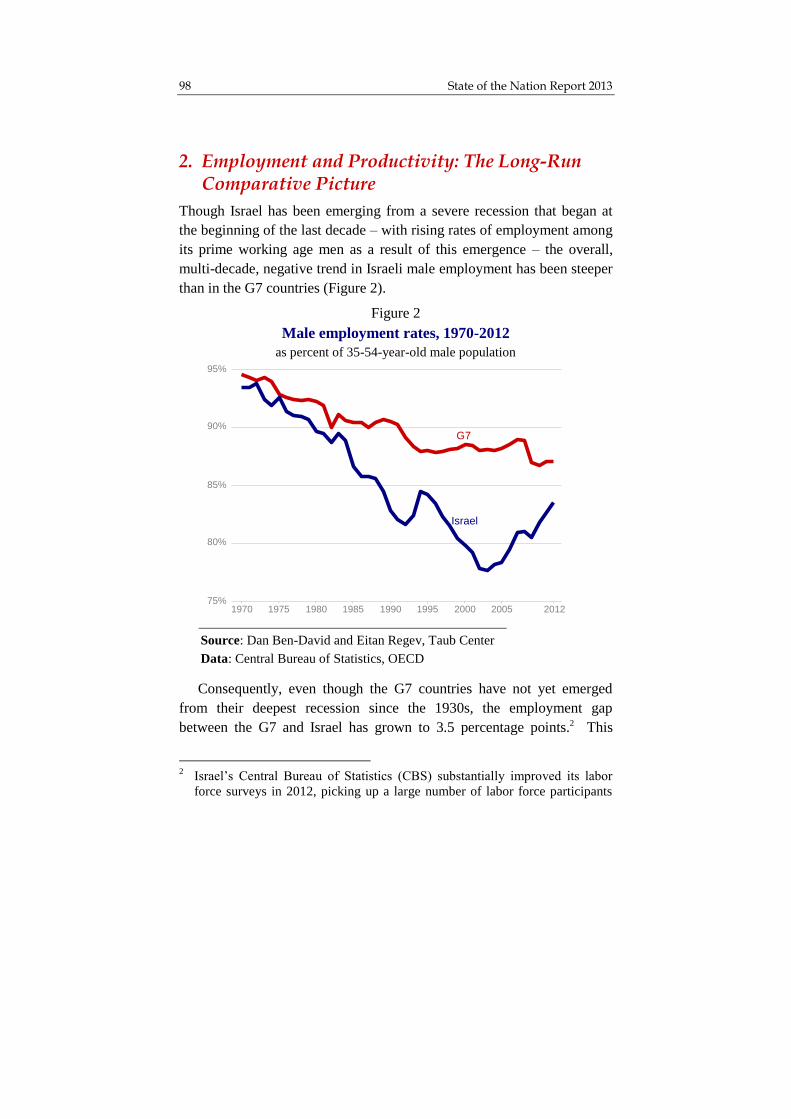
2. Employment and Productivity: The Long-Run Comparative Picture
Though Israel has been emerging from a severe recession that began at
the beginning of the last decade – with rising rates of employment among
its prime working age men as a result of this emergence – the overall,
multi-decade, negative trend in Israeli male employment has been steeper
than in the G7 countries (Figure 2).
Consequently, even though the G7 countries have not yet emerged
from their deepest recession since the 1930s, the employment gap
between the G7 and Israel has grown to 3.5 percentage points.2 This
2 Israel’s Central Bureau of Statistics (CBS) substantially improved its labor
force surveys in 2012, picking up a large number of labor force participants
Figure 2
Male employment rates, 1970-2012
as percent of 35-54-year-old male population
Source: Dan Ben-David and Eitan Regev, Taub Center
Data: Central Bureau of Statistics, OECD
75%
80%
85%
90%
95%
G7
Israel
1970 1975 1980 1985 1990 1995 2000 2005 2012
Labor Productivity in Israel 99
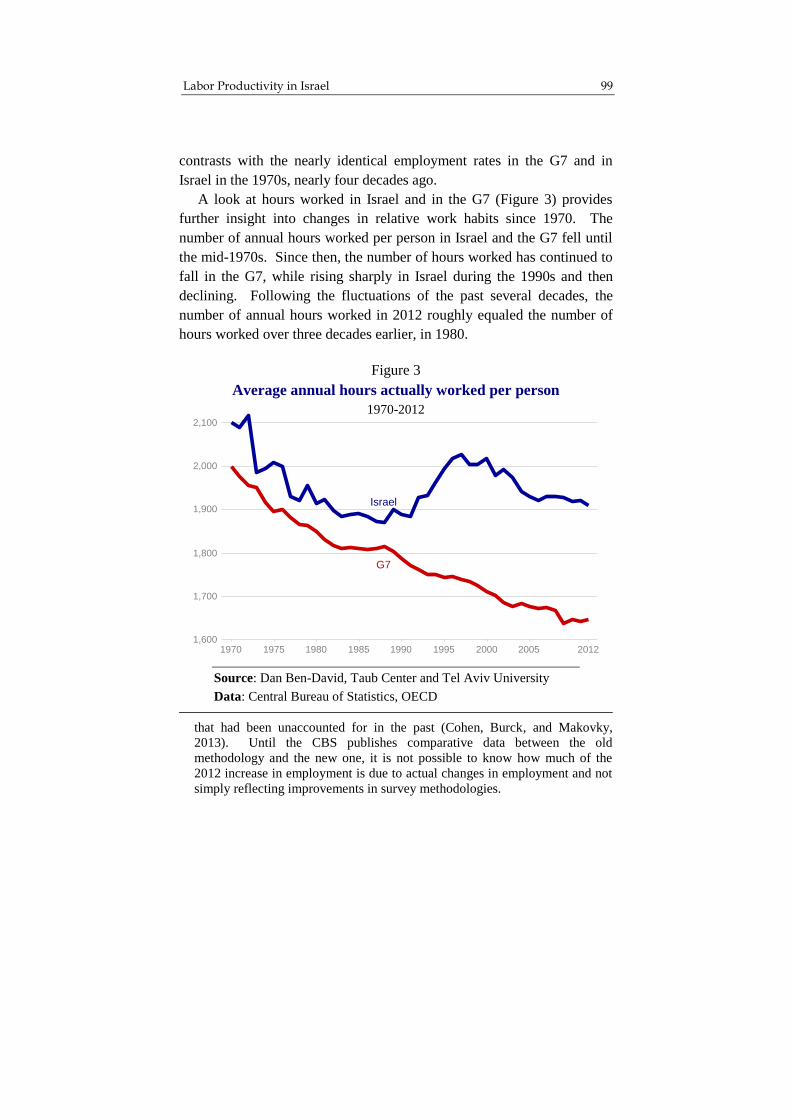
Source: Dan Ben-David, Taub Center and Tel Aviv University
Data: Central Bureau of Statistics, OECD
Figure 3
Average annual hours actually worked per person
1970-2012
1,600
1,700
1,800
1,900
2,000
2,100
1970 1975 1980 1985 1990 1995 2000 2005 2012
Israel
G7
contrasts with the nearly identical employment rates in the G7 and in
Israel in the 1970s, nearly four decades ago.
A look at hours worked in Israel and in the G7 (Figure 3) provides
further insight into changes in relative work habits since 1970. The
number of annual hours worked per person in Israel and the G7 fell until
the mid-1970s. Since then, the number of hours worked has continued to
fall in the G7, while rising sharply in Israel during the 1990s and then
declining. Following the fluctuations of the past several decades, the
number of annual hours worked in 2012 roughly equaled the number of
hours worked over three decades earlier, in 1980.
that had been unaccounted for in the past (Cohen, Burck, and Makovky,
2013). Until the CBS publishes comparative data between the old
methodology and the new one, it is not possible to know how much of the
2012 increase in employment is due to actual changes in employment and not
simply reflecting improvements in survey methodologies.
100 State of the Nation Report 2013
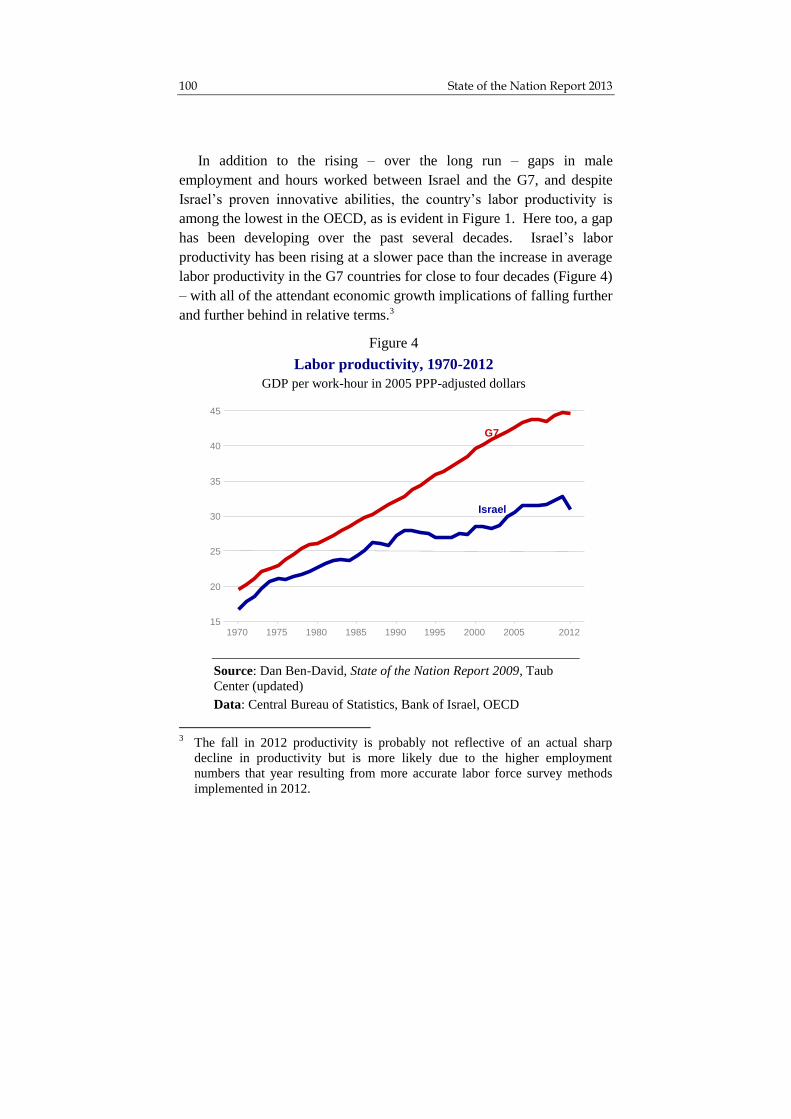
In addition to the rising – over the long run – gaps in male
employment and hours worked between Israel and the G7, and despite
Israel’s proven innovative abilities, the country’s labor productivity is
among the lowest in the OECD, as is evident in Figure 1. Here too, a gap
has been developing over the past several decades. Israel’s labor
productivity has been rising at a slower pace than the increase in average
labor productivity in the G7 countries for close to four decades (Figure 4)
– with all of the attendant economic growth implications of falling further
and further behind in relative terms.3
3 The fall in 2012 productivity is probably not reflective of an actual sharp
decline in productivity but is more likely due to the higher employment
numbers that year resulting from more accurate labor force survey methods
implemented in 2012.
Figure 4
Labor productivity, 1970-2012
GDP per work-hour in 2005 PPP-adjusted dollars
Source: Dan Ben-David, State of the Nation Report 2009, Taub
Center (updated)
Data: Central Bureau of Statistics, Bank of Israel, OECD
15
20
25
30
35
40
45
1970 1975 1980 1985 1990 1995 2000 2005 2012
G7
Israel
Labor Productivity in Israel 101
3. Some Common Factors Underlying Israel’s Low Productivity
The productivity problem is widespread in Israel, as will be shown below,
and while there are undoubtedly factors that are idiosyncratic to different
business sectors that influence this outcome, there are also a number of
economy-wide issues that are related.4 The problematic level of the
country’s human and physical capital infrastructures has been
documented in Ben-David (e.g., 2003 and 2012). For example, the
achievements of Israeli children in core curriculum subjects (such as
mathematics, science, and reading) on international exams have been
consistently below each of 25 relevant OECD countries since the late
1990s (and it is possible that this has been the case for quite a bit before
then as well, though no representative national samples exist prior to
1999). This is compounded by the fact that even these exams do not
include ultra-Orthodox boys, and many of the ultra-Orthodox girls, who
do not study core educational material at all and today comprise 20
percent of Israel’s primary school pupils.5 The education provided to
4 The fact that the share of Israel’s shadow economy is one of the highest in the
developed world (see Ben-David, 2011) means that there is a considerable
amount of unreported economic activity in the country. However, this would
presumably be reflected not only in a numerator (GDP) that should be larger,
but also in a denominator (hours worked) that would likely be larger as well –
so it is not obvious what kind of an effect this would have on productivity. In
any event, unless the shadow economy share is changing over time, then this
should be reflected primarily as a level effect and should not have much of an
impact on the slope of the productivity path over time. 5 The recent TIMSS examination in 2011 indicates an 11.4 percent
improvement in mathematics achievement since the previous exam was
administered in 2007. A total of 4,699 eighth graders participated in the 2011
TIMSS exam. Also in 2011, an annual nationwide mathematics exam called
MEITZAV was administered to 44,002 pupils – nearly all of the country’s
eighth graders. This exam was not given in 2007, so there is no way to
compare overall improvement over this period. However, the exam was given
in 2008 and there was a 4.4 percent improvement between 2008 and 2011.
The MEITZAV exam was given again in 2012 – and the eighth graders’ math
102 State of the Nation Report 2013
Arab Israeli children yields achievements not only below all of the
developed countries, but also below many third world countries.
Ultra-Orthodox Jews and Arab Israelis comprise almost half of the
country’s primary school pupils, and these are not the only children in
Israel receiving one of the worst basic educations in the Western world.
During the decade between 2000 and 2010, there were enrollment
increases of 37 percent in Arab Israeli schools and 57 percent in ultra-
Orthodox schools that far exceeded the enrollment growth in the state-
religious schools (11 percent) and in the state secular schools
(0.3 percent). The current distribution of enrollment levels combined
with the changes in enrollment that occurred over the past decade place
Israel’s overall human capital infrastructure at an increasingly lower
relative level than that in other developed countries. Even if a share of
the more gifted children continue on to university, the foundation of high-
quality human capital that will subsequently be available in the labor
market will be far less than the potential.
An influx of large numbers of relatively uneducated and unskilled
foreign workers – at one point reaching a high of one out of every eight
workers in Israel’s business sector – only exacerbates the issue of low
human capital in the labor market (Ben-David, 2010). Unlike many
Western countries that need a young workforce to supplement their aging
societies, Israel has an unusually young population compared to most
developed countries. The relatively low skill level of a large portion of
this local population eliminates the need for inundating the economy with
additional workers from abroad who are similarly poorly educated.
Nevertheless, large numbers of foreign workers continue to receive work
permits in the country.
In addition, the country’s transportation infrastructure has been
neglected for decades. As shown in Ben-David (2012), the congestion on
Israel’s roads as measured by the number of vehicles per kilometer road
achievements returned to their 2008 levels, leaving a big question mark as to
the meaning of the improvement that lasted only until 2011, the year of the
TIMSS exam.

Labor Productivity in Israel 103
is 2.6 times the OECD average. At the same time, the number of vehicles
per person is only half the OECD average, giving an indication of how
out of balance the transportation infrastructure is with the country’s
needs. The more congestion on the roads, the more resources – drivers,
trucks, etc. – are needed to transport the same products. The use of rail in
Israel is even more limited in comparison with developed countries.
Insufficient capital investment in roads and rail is a major inhibitor of
productivity growth.
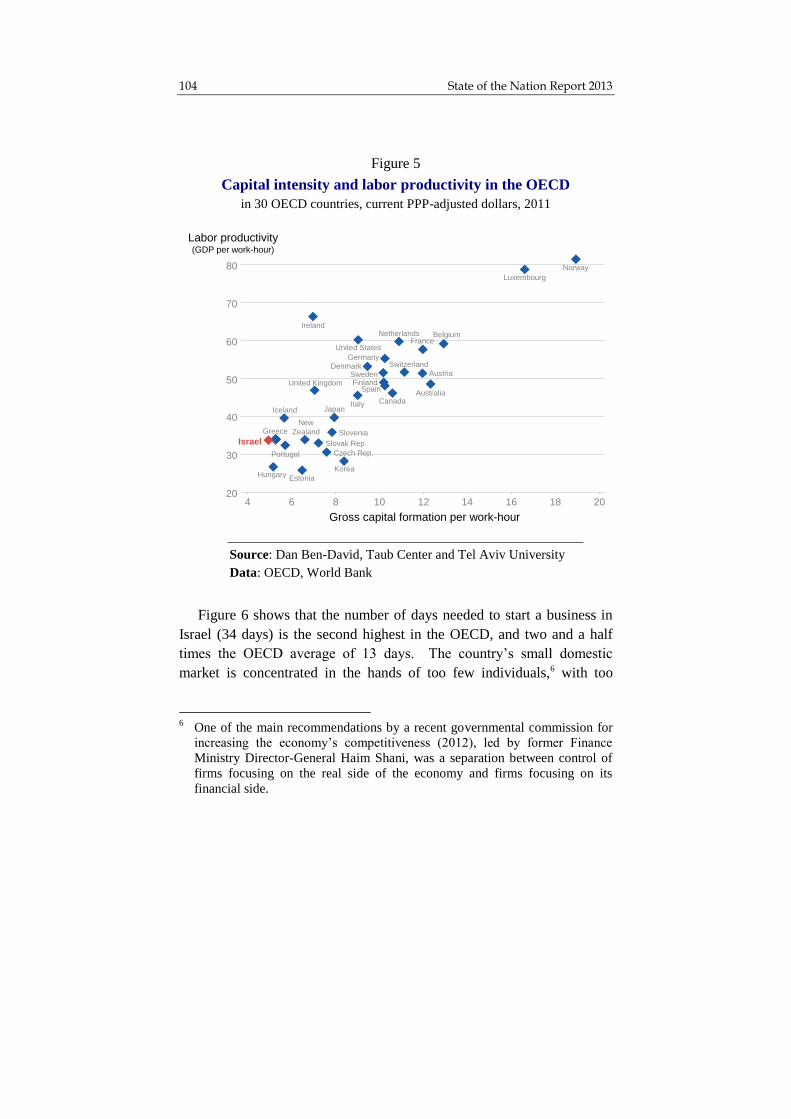
The positive relationship between capital formation, in general, and
labor productivity is reflected in Figure 5. Israel’s capital formation is on
the low end of the OECD. So it should come as no surprise that a country
with relatively low national levels of physical and human capital is
exhibiting problematic productivity growth at the national level. Add to
this a very cumbersome governmental bureaucracy and the implication is
that even more resources need to be diverted away from actual production
of goods and services.
104 State of the Nation Report 2013
Figure 6 shows that the number of days needed to start a business in
Israel (34 days) is the second highest in the OECD, and two and a half
times the OECD average of 13 days. The country’s small domestic
market is concentrated in the hands of too few individuals,6 with too
6 One of the main recommendations by a recent governmental commission for
increasing the economy’s competitiveness (2012), led by former Finance
Ministry Director-General Haim Shani, was a separation between control of
firms focusing on the real side of the economy and firms focusing on its
financial side.
Figure 5
Capital intensity and labor productivity in the OECD
in 30 OECD countries, current PPP-adjusted dollars, 2011
Source: Dan Ben-David, Taub Center and Tel Aviv University
Data: OECD, World Bank
4 6 8 10 12 14 16 18 20
Gross capital formation per work-hour
20
30
40
50
60
70
80
Labor productivity(GDP per work-hour)
Israel
United States
United Kingdom
Switzerland
Sweden
Spain
Slovenia
Slovak Rep.
Portugal
Norway
New
Zealand
Netherlands
Luxembourg
Korea
JapanItaly
Ireland
Iceland
Hungary
Greece
Germany
France
Finland
Estonia
Denmark
Czech Rep.
Canada
Belgium
Austria
Australia

Labor Productivity in Israel 105
much regulation,7 and insufficient competition – a crucial factor in
spurring physical and human capital investments necessary for
productivity growth. All of these factors combine to yield higher
domestic prices that reduce the economic viability and attractiveness of
Israel’s economic environment even more.
7 Following the summer protests in 2011, the government’s Commission for
Economic and Social Change, headed by Prof. Manuel Trajtenberg,
recommended a number of changes in government policies regarding
regulation and enforcement aimed at increasing the level of competitiveness
in the economy and lowering prices.
Figure 6
Number of days needed to start a business in 2010
in all 34 OECD countries
* Luxembourg data is from 2009
Source: Dan Ben-David, Taub Center and Tel Aviv University
Data: World Bank
New Zealand
4734
32
28
27
24
23
20
19
1816
15
15
14
1413
13
13
13
10
107
7
7
6
66
6
65
54
4
21
Australia
Hungary
Belgium
Iceland
Canada
United States
Turkey
Slovenia
Portugal
Denmark
Norway
FranceEstonia
Netherlands
Italy
OECD
United Kingdom
Mexico
Ireland
Korea
Finland
Sweden
Czech Republic
Slovak Republic
Germany
Greece
Switzerland
Japan
Luxembourg*
Chile
Austria
Poland
Israel
Spain
106 State of the Nation Report 2013
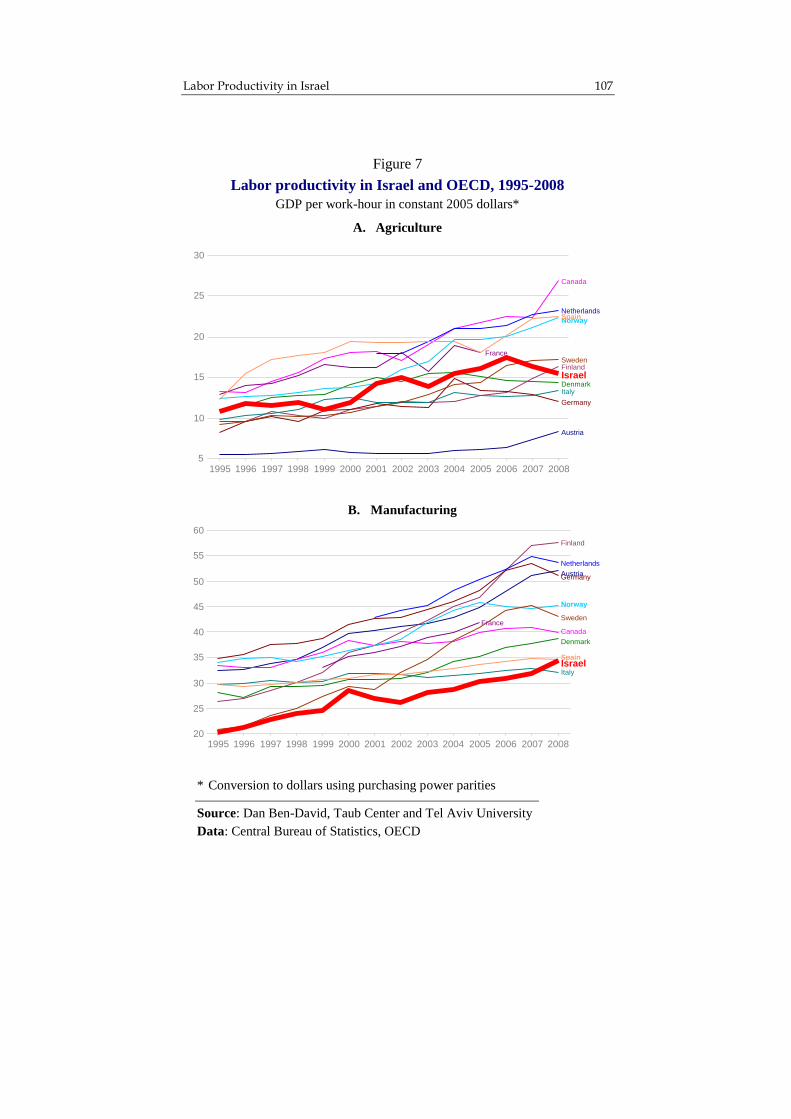
4. A Sector by Sector Productivity Comparison Across Countries
A sector by sector comparison with the OECD countries that have
comparable data on labor productivity reveals a similar – and problematic
– picture.8 In 1995, labor productivity in agriculture (Figure 7, panel A),
one of the historical jewels in Israel’s crown, was roughly in the middle
of the OECD countries. Since then, labor productivity in agriculture has
risen, though Israel remained in the middle range of the OECD countries
in 2008.
In manufacturing (panel B), which includes high tech as well as more
traditional industries, labor productivity was below the OECD countries
for nearly all of the years since 1995. By 2008, Israel had exceeded only
Italy and remained below the other countries. Labor productivity in
financial intermediation, real estate, renting, and other business activities
(panel C) went from second to last place in 1995 to being tied for last
place in 2008. In the areas of wholesale and retail trade, repairs,
transport, hotels and restaurants, Israel’s labor productivity was below all
of the OECD countries in panel D in 1995, and even further below all of
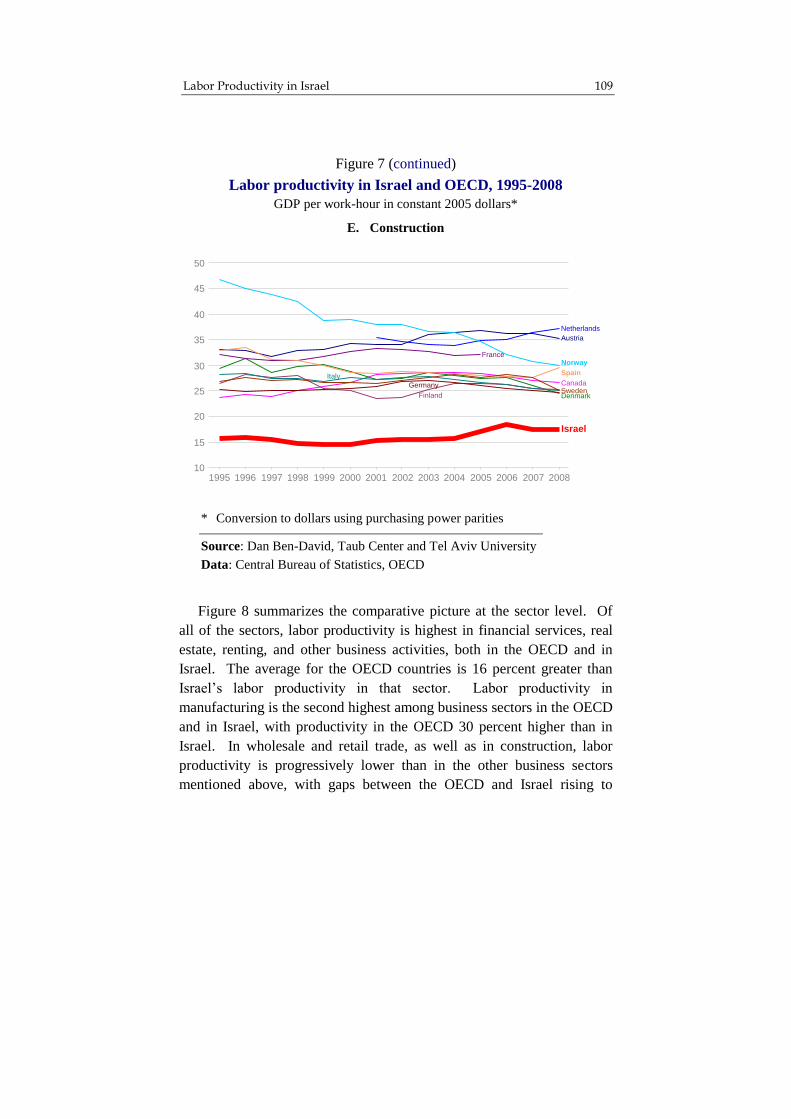
these countries in 2008. In construction, a sector with very large numbers
of unskilled foreign workers, labor productivity has been much lower,
and remained much lower, than in the OECD countries appearing in
panel E since 1995.
8 The within-sector comparison across countries is done here for all countries
including Israel for which the OECD provides sectoral data and it uses
national purchasing power parities. It would have been preferable, and more
accurate, to conduct these comparisons using purchasing power parities by
business sectors – but these are not available.
Labor Productivity in Israel 107
B. Manufacturing
1995 1996 1997 1998 1999 2000 2001 2002 2003 2004 2005 2006 2007 20085
10
15
20
25
30
Austria
Canada
Denmark
Finland
France
Germany
Italy
Netherlands
NorwaySpain
Sweden
Israel
Figure 7
Labor productivity in Israel and OECD, 1995-2008
GDP per work-hour in constant 2005 dollars*
A. Agriculture
1995 1996 1997 1998 1999 2000 2001 2002 2003 2004 2005 2006 2007 200820
25
30
35
40
45
50
55
60
Austria
Canada
Denmark
Finland
France
Germany
Italy
Netherlands
Norway
Spain
Sweden
Israel
* Conversion to dollars using purchasing power parities
Source: Dan Ben-David, Taub Center and Tel Aviv University
Data: Central Bureau of Statistics, OECD

108 State of the Nation Report 2013
Figure 7 (continued)
Labor productivity in Israel and OECD, 1995-2008
GDP per work-hour in constant 2005 dollars*
C. Financial intermediation; real estate, renting and
business activities
1995 1996 1997 1998 1999 2000 2001 2002 2003 2004 2005 2006 2007 200845
50
55
60
65
70
75
80
85
Austria
CanadaDenmark
Finland
FranceGermany
Italy
Netherlands
Norway
Spain
Sweden
Israel
45
1995 1996 1997 1998 1999 2000 2001 2002 2003 2004 2005 2006 2007 200815
20
25
30
35
40
Austria
Canada
DenmarkFinland
France
Germany
Italy
NetherlandsNorway
Spain
Sweden
Israel
D. Wholesale and retail trade, repairs; hotels and
restaurants; transport
* Conversion to dollars using purchasing power parities
Source: Dan Ben-David, Taub Center and Tel Aviv University
Data: Central Bureau of Statistics, OECD
Labor Productivity in Israel 109
Figure 8 summarizes the comparative picture at the sector level. Of
all of the sectors, labor productivity is highest in financial services, real
estate, renting, and other business activities, both in the OECD and in
Israel. The average for the OECD countries is 16 percent greater than
Israel’s labor productivity in that sector. Labor productivity in
manufacturing is the second highest among business sectors in the OECD
and in Israel, with productivity in the OECD 30 percent higher than in
Israel. In wholesale and retail trade, as well as in construction, labor
productivity is progressively lower than in the other business sectors
mentioned above, with gaps between the OECD and Israel rising to
Figure 7 (continued)
Labor productivity in Israel and OECD, 1995-2008
GDP per work-hour in constant 2005 dollars*
E. Construction
1995 1996 1997 1998 1999 2000 2001 2002 2003 2004 2005 2006 2007 200810
15
20
25
30
35
40
45
50
Austria
Canada
DenmarkFinland
Germany
Italy
Netherlands
Norway
Spain
Sweden
Israel
France
* Conversion to dollars using purchasing power parities
Source: Dan Ben-David, Taub Center and Tel Aviv University
Data: Central Bureau of Statistics, OECD

110 State of the Nation Report 2013
roughly 60 percent. In agriculture, where Israel is the most similar to the
OECD, labor productivity is the lowest of all the branches.
Figure 8
Labor productivity in Israel and OECD*, 2008
GDP per work-hour in constant 2005 dollars**
* Average for Austria, Canada, Denmark, Finland, France, Germany,
Italy, Netherlands, Norway, Spain, and Sweden
** Conversion to dollars using purchasing power parities
Source: Dan Ben-David, Taub Center and Tel Aviv University
Data: Central Bureau of Statistics, OECD
63.6
OECD
54.8
Israel
44.7
OECD
34.5
Israel
32.2
OECD
20.5
Israel
28.2
OECD
17.5
Israel
17.7
OECD
15.5
Israel
Financial intermediation;
real estate, renting and
business activities
Wholesale and retail
trade, repairs; hotels and
restaurants; transport
Manufacturing Construction Agriculture

Labor Productivity in Israel 111
5. Capital Formation, Productivity, and Wages at the Sectoral Level
The relationship between gross capital formation per hour worked and
labor productivity across sectors within Israel (Figure 9) is similar to the
positive relationship depicted between the two variables across countries
in Figure 5. The more capital, the greater the labor productivity is in a
given sector.
Figure 9
Capital intensity and labor productivity in Israel, 2008
in shekels
Source: Dan Ben-David, Taub Center and Tel Aviv University
Data: Central Bureau of Statistics, OECD
0
50
100
150
200
250
Labor productivity(GDP per hour)
0 10 20 30 40 50 60
Gross capital formation per work-hour
Agriculture
Manufacturing
Construction
Wholesale and retail
trade, repairs; hotels
and restaurants;
transport
Financial intermediation;
real estate, renting and
business activities
112 State of the Nation Report 2013
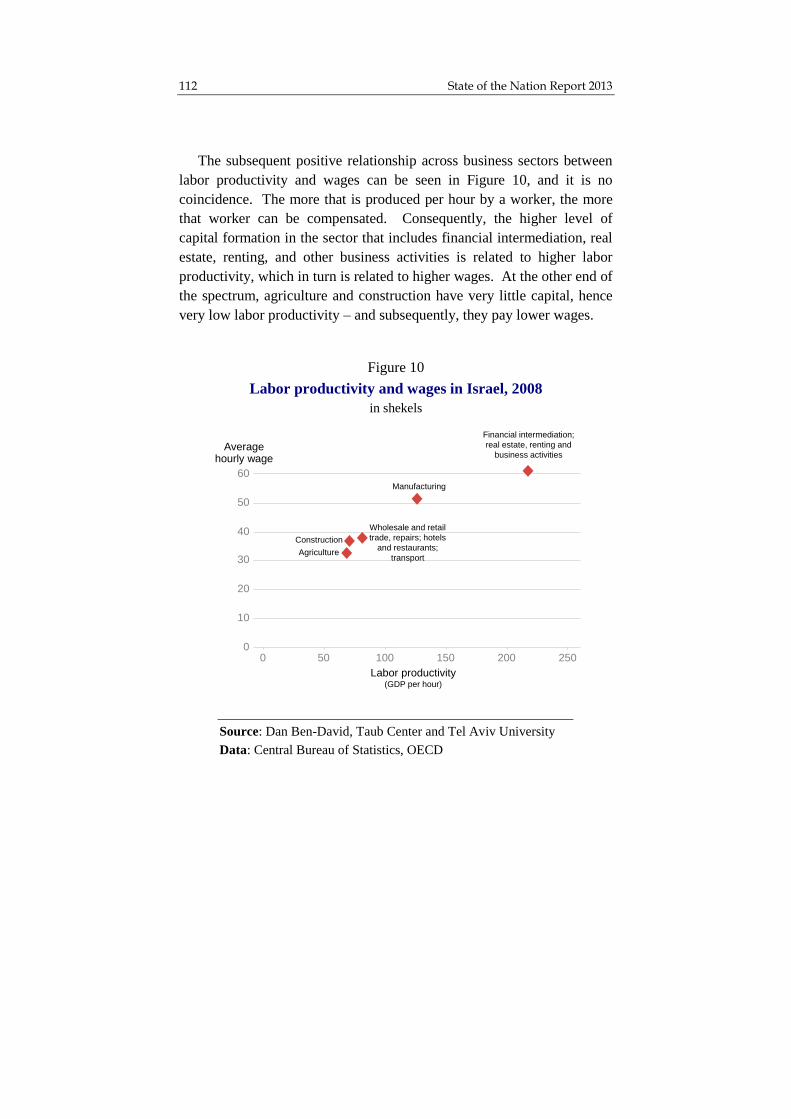
The subsequent positive relationship across business sectors between
labor productivity and wages can be seen in Figure 10, and it is no
coincidence. The more that is produced per hour by a worker, the more
that worker can be compensated. Consequently, the higher level of
capital formation in the sector that includes financial intermediation, real
estate, renting, and other business activities is related to higher labor
productivity, which in turn is related to higher wages. At the other end of
the spectrum, agriculture and construction have very little capital, hence
very low labor productivity – and subsequently, they pay lower wages.
Figure 10
Labor productivity and wages in Israel, 2008
in shekels
Source: Dan Ben-David, Taub Center and Tel Aviv University
Data: Central Bureau of Statistics, OECD
Averagehourly wage
0
10
20
30
40
50
60
Labor productivity(GDP per hour)
0 50 100 150 200 250
Agriculture
Manufacturing
Construction
Wholesale and retail
trade, repairs; hotels
and restaurants;
transport
Financial intermediation;
real estate, renting and
business activities

Labor Productivity in Israel 113
6. Conclusions
As one might surmise, the more educated the individual, the greater the
opportunities abroad, the higher the rate of potential emigration – and that
is certainly the case among Israelis (Gould and Moav, 2007). Among the
most mobile group, university professors, Israel’s brain drain is
unparalleled among developed countries (Ben-David, 2008, and “The
State of Israel’s Universities and Its Researchers” in this report). To be
able to pay competitive salaries to individuals vital to its future –
engineers, physicians, academic researchers, that is, those who can easily
relocate from one country to another – the country must be able to
generate productivity at levels that are equal to or above those in other
developed countries. In light of the exceptional caliber of talent currently
available at the pinnacle of Israel’s human capital pyramid, this is not an
insurmountable obstacle.
But having the best and brightest at the top is not sufficient. The
human capital pyramid’s foundations need to be broadened and
strengthened considerably. That can be done if the country overhauls its
education system, upgrading its core curriculum and ensuring that it is
provided at a high level in all of the country’s schools to all of its varied
populations. Such an overhaul also needs to include a major change in
the way that the country selects, trains, and compensates its teachers, and
in the way that the extremely cumbersome and inefficient Ministry of
Education is run and managed.
In addition to boosting its human capital infrastructure, Israel needs to
substantially improve its transportation infrastructure. The current state
of its roads and rails provides a sad commentary on the country’s national
priorities. It is unconscionable neglect that has led a nation with only half
the vehicles per capita to more than two and a half times the congestion
of the OECD average. The increase in transportation infrastructure
investment during the past decade has been to a level similar to the
OECD average (Ben-David, 2012), so that the gap is not expected to

114 State of the Nation Report 2013
continue to rise – but current investment levels are also insufficient for
closing the gap.
Increasing competition is crucial for creating the pressure to invest
and innovate, to create better products and services at lower cost. Current
barriers to competition include high bureaucratic entry and exit costs for
firms wishing to do business in Israel. Although protective regulation has
been reduced, it continues to exist and to take a toll.
The provision of high-quality social services is an important goal and
a hallmark of modernity. The ability to provide such services at the
highest levels is very dependent on the relative wealth of a country.
There is a tradeoff between wanting to provide as good and as plentiful a
service to the public as possible, and not raising taxes to a point that
makes the country less competitive, inhibiting its productivity growth
and, ultimately, its rate of economic growth – which in turn will reduce
the nation’s ability to provide such services.
A country wishing to improve its quality of life must focus on the
basics. It is no coincidence that the primary contributors to productivity
growth are also the major elements underlying core treatment of poverty
and income inequality. An improved educational system and physical
infrastructure are vital for providing individuals currently in Israel’s
social periphery with the tools and conditions to lift themselves and their
children out of the poverty cycle. As these individuals gain the necessary
skills, they contribute directly to the country’s overall capacity to
assimilate and implement new ideas – the key to innovation, and the heart
of productivity improvements.
Israel currently has all of the knowledge, know-how and resources
needed to move to new socioeconomic trajectories that will bring it closer
to the leading developed countries. But it needs to find the leadership
and political wherewithal to initiate the policy changes that will in turn
yield the structural, long-run, socioeconomic changes that Israel needs to
excel, to flourish, to retain its best and brightest, and to attract its young
professionals to return.

Labor Productivity in Israel 115
References
English
Ben-David, Dan (2008), Brain Drained, CEPR Discussion Paper No. 6717.
Ben-David, Dan (2010), “Israel’s Labor Market – Today, in the Past and in
Comparison with the West,” in Ben-David, Dan (ed.), State of the Nation:
Society, Economy and Policy 2009, Taub Center for Social Policy Studies
in Israel, pp. 213-275.
Ben-David, Dan (2011), “Public Spending in Israel over the Long Run,” in
Ben-David, Dan (ed.), State of the Nation: Society, Economy and Policy
2010, Taub Center for Social Policy Studies in Israel, pp. 87-90.
Ben-David, Dan (2012), “The Start-Up Nation’s Threat from Within,” in
Dan Ben-David (ed.), State of the Nation: Society, Economy and Policy
2011-2012, Taub Center for Social Policy Studies in Israel, pp. 17-93.
Senor, Dan and Saul Singer (2009), Start-Up Nation: The Story of Israel's
Economic Miracle, Hachette Book Group.
Hebrew
Ben-David, Dan (2003a), “A Socio-Economic Perspective of Israel's
Educational System in an Era of Globalization,” Quarterly Journal of
Economics, pp. 47-72.
Ben-David, Dan (2003b), “Israel's Work Force from an International
Perspective,” Quarterly Journal of Economics, pp. 73-90.
Cohen, Noam, Luisa Burck, and Itzchak Makovky (2013), Examining the
Increase in Unemployment in the Transition to a Monthly Labour Force
Survey, Working Paper 78, Central Bureau of Statistics.
Gould, Eric and Omer Moav (2007), “Israel's Brain Drain,” Israel Quarterly
Journal of Economics, pp. 1-22.
Kirsh, Uri (2011), Estimating the Excellence of Israel’s Universities,
Working Paper, Shmuel Neeman Institute, Technion.