Evaluating Labor Productivity in Food...
32
Evaluating Labor Productivity in Food Retailing Timothy A. Park 313C Conner Hall Department of Agricultural & Applied Economics University of Georgia Athens, GA 30602-7509 [email protected] Selected Paper prepared for presentation at the American Agricultural Economics Association Annual Meeting, Portland, OR, July 29-August 1, 2007 Copyright 2007 by Timothy Park. All rights reserved. Readers may make verbatim copies of this document for non-commercial purposes by any means, provided that this copyright notice appears on all such copies.
Transcript of Evaluating Labor Productivity in Food...
Evaluating Labor Productivity in Food Retailing
Timothy A. Park 313C Conner Hall
Department of Agricultural & Applied Economics University of Georgia
Athens, GA [email protected]
Selected Paper prepared for presentation at the American Agricultural EconomicsAssociation Annual Meeting, Portland, OR, July 29-August 1, 2007
Copyright 2007 by Timothy Park. All rights reserved. Readers may make verbatim copies ofthis document for non-commercial purposes by any means, provided that this copyright noticeappears on all such copies.
Evaluating Labor Productivity in Food Retailing
Abstract:
New store formats including competition from supercenters (driven by Wal-Mart), warehouse
clubs, and mass merchandisers have emerged as a major threat to traditional grocery chains. A
key issue in the food retailing sector is to understand how the earnings of employees respond to
the evolution of new retail store formats and store organizational characteristics. The elasticity
of complementarity for food retailers measures how changes in store size affect use of full-time
and part-time employees. The evidence for constant returns to scale suggests that the Hicks
elasticity of complementarity is the appropriate measure to assess input substitutability for food
retailers. As store size increases the marginal value of labor rises and firms hire more part-time
employees, along with a smaller increase in full-time workers.
Key words: elasticity of complementarity, employee compensation, food retailing, inverse price
elasticities
Evaluating Labor Productivity in Food Retailing
Introduction
The retail food industry has undergone significant changes since the 1980s as
supermarkets responded to increased competition from alternative retail formats and changes in
consumer shopping habits. Supermarkets have evolved from small, independently owned full-
service establishments to large, administratively centralized, horizontally and sometimes even
vertically integrated self-service chains. Competition from warehouse clubs, mass
merchandisers, supercenters, and convenience stores has intensified, forcing supermarkets to
reevaluate many of the ways in which they conducted their business operations.
Wal-Mart, the world’s largest retailer, has perfected the supercenter format to become the
leading firm in the grocery industry. From a base of only 10 in 1993, Wal-Mart built over 1,400
supercenters (as of January 2005), with company plans indicating that this store format will
expand by 200 new stores every year for the next five years. The supercenter format is identified
as the major threat to traditional grocery chains as close to 80 percent of supermarket managers
listed competition from this store format as their major concern (National Grocers Association,
2004-2005 Points of Impact Survey).
Food retailing and marketing researchers have examined the impact of supercenter entry
on pricing strategies and profitability of incumbent supermarkets. The effects of changing
product market competition on retailing employment trends have been addressed by Basker who
found that Wal-Mart entry has a positive short-run effect on county retail employment that
diminishes over time. While recognizing that Wal-Mart supercenters compete directly with food
retailers, Basker does not make an attempt to quantify identify their direct effects on grocers.
Davis et al. highlighted how human resource practices of food retailers shift in response to
2
product market competition and new store formats but lack detailed store level information that
is exploited in our analysis.
Retailers are increasingly concerned about the link between workforce decisions and store
level performance measures such as value added. Industry publications comment on the “people
gap” in food retailing that leads managers to “focus on today’s operating efficiencies at the
expense of tomorrow’s front-line work force” (Major, 2003). Human resource managers have
suggested that the industry is not attracting the right mix of workers and will have to face
significant turnover rates and increasing pressure on margins in future years.
The retail food industry recognizes the key role that employee benefits and incentives
play in retaining employees and encouraging entry by prospective workers. The 2003 Employee
Benefits Study noted that a wide array of daily activities offered by successful supermarkets
including cashiering, bagging, stocking, pricing, merchandising and buying rely on performance
by well-trained employees (Food Marketing Institute, 2003). While industry publications
identify the scope and variety of benefits offered by food retailers and assess costs of benefits
offered by food retail and distribution industries, our objective is to show how employee benefits
and incentives impact store level performance.
A production function approach based on a performance measure for supermarket
operations is integrated with workforce characteristics and employee benefits and incentives
offered by food retailers. The elasticity of complementarity measures the effect of a change in a
relative input quantity (such as labor) on the relative input price and flows directly from the
estimation of a production function where input quantities are exogenous and input prices are
endogenous. Substitution measures between inputs in food retailing are derived and the factors
3
that influence relative factor prices are assessed. Data for the study are from the Supermarket
Panel conducted by The Food Industry Center (TFIC) at the University of Minnesota. The Panel
is an annual survey of supermarkets where store managers provide information on store
characteristics, operations, and performance. An empirical model is specified and data collection
procedures, characteristics of the Panel and results from the econometric model are presented.
Discussion of the implications along with directions for future research conclude the paper.
The elasticity of complementarity is the appropriate measure to assess key policy and
competitive developments facing an industry such as food retailing. The impact of a tax
incentive to encourage the supply of capital or hire specific types of workers depends on the
Hicks elasticity. Seidman showed that a tax incentive to stimulate the use of capital benefits
low-skilled labor if the two inputs are complements by the Hicks elasticity, highlighting the
empirical relevance of this measure. Regulatory strategies to deal with large-scale retail facilities
(“big-box retailers”) typically include municipal zoning ordinances which rely on size and height
limitations on stores, conditional use restrictions, impact assessments and development fees, and
design guidelines for buildings, landscaping, and road access. The effects of these ordinances on
relative factor prices for store square footage and employees are appropriately analyzed using the
production framework proposed here.
Most of the findings on labor substitution patterns examine workers characterized by
demographic groups such as age-race-sex groups. Grant and Hamermesh examined groups such
as youths, adult blacks, white women, and white men. Berger differentiated workers by sex
along with years of schooling and years of experience. The model we develop focuses on the use
of full-time and part-time workers, an important characteristic of the retail workforce.
4
Analysis of the Food Retailing Firm
A key issue in the food retailing sector is to understand how the earnings of employees
respond to the evolution of new retail store formats and store organizational characteristics.
Hicks partial elasticities are designed to assess the response of relative factor prices to exogenous
changes in relative factor quantities and to measure returns to factors of production such as
earnings of employee groups.
The impacts of innovative store formats that have influenced food retailing can be
measured using the elasticity of complementarity. Wal-Mart has introduced the Neighborhood
Market as a new store format which “has the potential to revolutionize United States retailing in
the coming decade just as powerfully as discount stores did in the 1980s and supercenters are
doing in the 1990s” (Discount Store News). Neighborhood Markets are about one quarter the
size of typical supercenters (or about 40,000 sq. ft), stocking about one fifth of the items
(between 20,000 to 23,000 items) and represent a modern version of the neighborhood grocery.
The emphasis is on consumer convenience with ease of entry for quick shopping and features
fresh produce, dairy, and dry grocery departments, general merchandise, a one-hour photo center
and a drive-through pharmacy. Big-box retailers including Wal-Mart, Target, CostCo, and Home
Depot, are developing multi-level store formats to penetrate urban areas while combating sprawl
and complying with strict zoning guidelines.
Consider a firm operating in perfectly competitive product and factor markets with a
production function based on a vector of inputs x which are transformed into a measure of store
performance y (or output) described by the production function y = F(x). Facing nonrandom
input prices the firm seeks to minimize cost for a given output level. The Hicks elasticity of
5
(2)
(1)
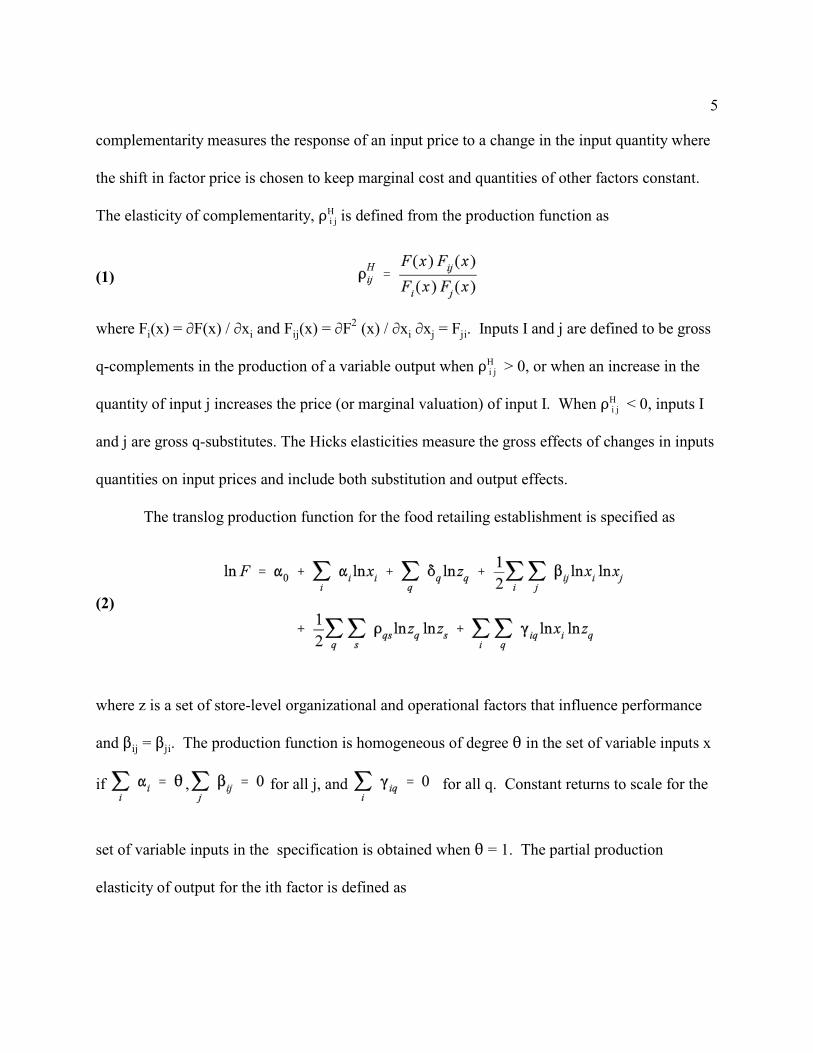
complementarity measures the response of an input price to a change in the input quantity where
the shift in factor price is chosen to keep marginal cost and quantities of other factors constant.
i jThe elasticity of complementarity, D is defined from the production function as H
i i ij i j jiwhere F (x) = MF(x) / Mx and F (x) = MF (x) / Mx Mx = F . Inputs I and j are defined to be gross2
i jq-complements in the production of a variable output when D > 0, or when an increase in theH
i jquantity of input j increases the price (or marginal valuation) of input I. When D < 0, inputs IH
and j are gross q-substitutes. The Hicks elasticities measure the gross effects of changes in inputs
quantities on input prices and include both substitution and output effects.
The translog production function for the food retailing establishment is specified as
where z is a set of store-level organizational and operational factors that influence performance
ij jiand $ = $ . The production function is homogeneous of degree 2 in the set of variable inputs x
if , for all j, and for all q. Constant returns to scale for the
set of variable inputs in the specification is obtained when 2 = 1. The partial production
elasticity of output for the ith factor is defined as

6
(3)
(4)
(5)
(6)
and the elasticity of scale is the sum of the partial production elasticities for the variable inputs,
. The Hicks elasticities can be computed from the translog production function as
ijUncompensated quantity elasticities 0 , or inverse price elasticities, are calculated along with
iythe inverse output elasticities, 0 in the empirical results. The inverse price elasticities are
The inverse price elasticities measure the change in price of a factor (such as full-time labor)
given a one percent change in the quantity of a factor (such as store size). The inverse output
elasticities from the translog model are
Sato and Koizumi demonstrated that the elasticity of complementarity can be related to
7
(7)
(8)
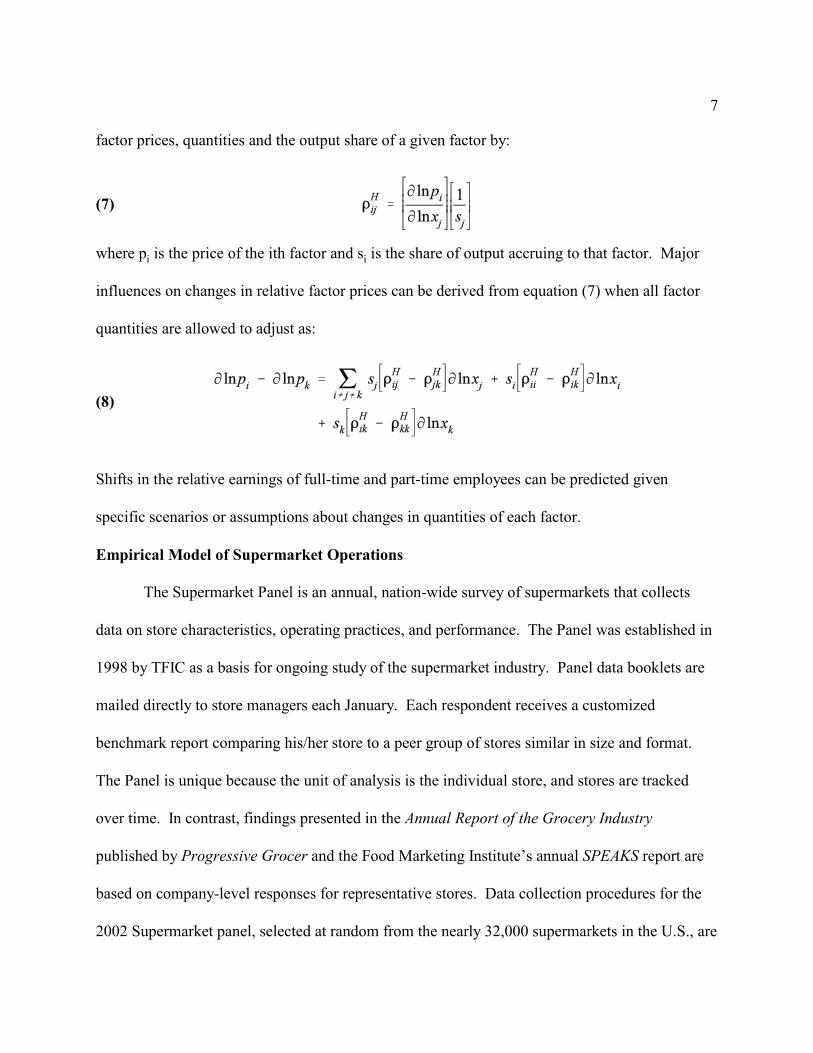
factor prices, quantities and the output share of a given factor by:
i iwhere p is the price of the ith factor and s is the share of output accruing to that factor. Major
influences on changes in relative factor prices can be derived from equation (7) when all factor
quantities are allowed to adjust as:
Shifts in the relative earnings of full-time and part-time employees can be predicted given
specific scenarios or assumptions about changes in quantities of each factor.
Empirical Model of Supermarket Operations
The Supermarket Panel is an annual, nation-wide survey of supermarkets that collects
data on store characteristics, operating practices, and performance. The Panel was established in
1998 by TFIC as a basis for ongoing study of the supermarket industry. Panel data booklets are
mailed directly to store managers each January. Each respondent receives a customized
benchmark report comparing his/her store to a peer group of stores similar in size and format.
The Panel is unique because the unit of analysis is the individual store, and stores are tracked
over time. In contrast, findings presented in the Annual Report of the Grocery Industry
published by Progressive Grocer and the Food Marketing Institute’s annual SPEAKS report are
based on company-level responses for representative stores. Data collection procedures for the
2002 Supermarket panel, selected at random from the nearly 32,000 supermarkets in the U.S., are
8
described in detail by King, Jacobson, and Seltzer and the variables for the model are presented
in table 1.
The translog production function for the food retail establishment is based on value added
as the output measure along with measures of the operational and environmental constraints
facing the supermarket. Store performance depends on variable inputs for store size (SSize), the
hiring of full-time labor (FTHrs) and part-time labor hours (PTHrs). The store-level
qorganizational and operational factors (z ) that influence performance are discussed below. A
stochastic error term, assumed to reflect errors in optimizing behavior, is added to the production
function in equation (2). Estimation proceeds by maximum likelihood, assuming that the error
term is an independently and identically distributed normal random variable.
The output measure for the retail store is weekly gross margin or value-added, defined as
weekly sales minus the cost of goods sold. Baily and Solow suggest that value-added generated
by retailers is the best measure of retailing output. They note that the value-added measure of
output reflects the amount of retail services that are provided, such as the variety of merchandise
provided, convenience of store location, availability of checkout and food department personnel,
along with the availability of in-store services.
Results from summary income statements of conventional supermarkets confirm a close
relationship between value-added measures and labor productivity at the store level. The Food
Marketing Institute reported that the most profitable food retailers invested a higher percentage
of expenses in personnel compared to lower performing supermarkets, even though overall
expenses for the top performers were lower than those for the least profitable stores. Payroll as a
percentage of total expenses was at 47.5 percent for the most profitable stores and 41.9 percent
9
for the least profitable stores. High performing stores use managerial skills and operational
methods to control overall expenses more effectively and to maintain high gross margins.
The two inputs considered in this analysis are store selling area and weekly labor hours.
Store selling area is a rough measure of the capital used in a retail operation. Store energy costs
and other major capital inputs, such as refrigeration equipment and lighting, shelving and display
cases, and front-end checkout equipment are highly correlated with store selling area.
The impact of workforce quality and composition on retail performance is measured by
the store’s use of full-time and part-time workers. The labor inputs are full-time labor hours
(FTHrs) and part-time labor hours (PTHrs). Oi noted that reliance on part-time workers is an
indicator of the skill mix of the retail work force. Increases in the ratio of part-time to full-time
employees are driven partly by larger store sizes. But larger stores also pay higher wages than
smaller stores because their employees supply more work effort. The result is that wages of part-
time workers are higher at larger supermarkets compared to smaller stores.
Larger stores must hire more clerks and these employees are more productive because
they waste less time in waiting for customers. Full-time workers also benefit from higher wages
at larger supermarkets. The key relationship to note is the size-wage premium: wages of part-
time workers rise faster than wages of full-time workers as stores get bigger. Oi concluded that
productivity gains associated with sales volumes in food retailing are relatively greater for part-
time employees. The empirical model allows us to evaluate the relative impact of full-time and
part-time employees on store performance as measured by value added.
To test whether the benefits and the incentive packages offered to employees influence
value added at the store level, a variable for these measures was formed. The Supermarket Panel

10
recorded information on the typical compensation package for full-time and part-time workers
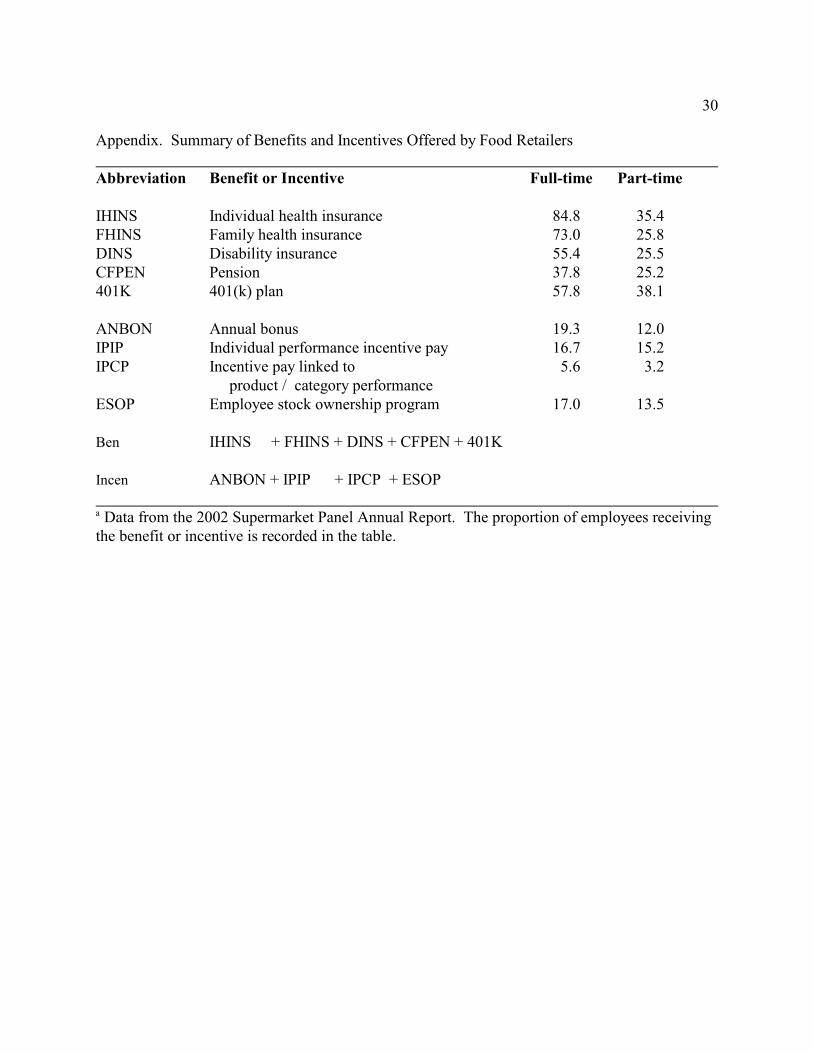
where the category of full-time workers excluded department heads and store managers. Benefits
included individual health insurance, family health insurance, disability insurance, company
funded pension, and a 401(k) plan. The menu of incentives offered by the firm indicated whether
the firm offers an annual bonus, uses individual performance incentive pay, incentive pay based
on product or category performance, and the presence of an employee stock ownership plan.
The benefits variable for full-time (FTBen) and part-time (PTBen) employees was
constructed as the number of benefits provided by the establishment (from 1 to 5). The
incentives measure for full-time (FTIncen) and part-time (PTIncen) employees was a count of the
incentives offered (from 1 to 4). Our measures here are consistent with yet also more
comprehensive than research (Decressin et al. and Brown and Medoff) on benefits offerings by
firms which utilizes dichotomous indicators for whether firms provide benefits such as pensions,
welfare plans (health, life, supplemental employment, and disability insurance) or fringe benefit
plans.
On average full-time employees received 3 of the 5 listed benefits and 0.59 of the 4
incentives, with part-time employees recording lower scores on both indicators. Four benefits
measures were received by over 50 percent of full-time employees: individual health insurance,
family health insurance, disability insurance, the 401(k) plan. There were no incentives provided
to more than half of full-time employees and none of the benefits or incentives was available to
more than 50 percent of the part-time employees. The difference between benefits offered to
full-time and part-time employees is dramatic and reinforces the importance of examining how
these workers influence store performance. A large proportion (45 percent) of part-time
11
employees receive no benefits, matched by a similar proportion (46 percent) of full-time
employees who receive four or more (maximum of 5) of the benefits.
The data confirm a clear correlation between store size and the provision of benefits and
incentives for both full-time and part-time employees. Offerings of benefits and incentives tend
to increase for both types of employees as store size increases. Stores with floorspace between
45,000 and 60,000 square feet offer the most benefits and incentives for full-time workers and
the largest stores (over 60,000 square feet) provide the most extensive benefit set for part-time
workers.
Characteristics of the organizations that own and operate stores may also impact gross
margin and four characteristics are featured in the model. First, membership in a larger group
(Gsize) may boost productivity through multistore economies in procurement and advertising and
through centralization of some managerial functions. Hoppe commented on the empirical
regularity that large firms tend to adopt new technology sooner than small firms as the larger
firms expect a greater rate of return from adoption.
The role of multiplant economies in the adoption and diffusion of technological
innovations in food retailing chains also influences technology adoption decisions. Multiplant
firms may attain savings in nonproduction costs such as transportation, distribution and inventory
control while taking advantage of the economies of massed reserves along with information
sharing between plants. Jensen demonstrated how economies of multiplant operations influence
the relationship between firm size and technology adoption. If learning costs of new technology
are greater for a large firm, the small firm can lead in adoption. However, if the profit increase
accruing to the large firm with multiplant operations are large enough, the learning cost effect is
12
overcome and the large firm is more likely to lead in technology adoption. Food retailing chains
may benefit from multiplant economies in the adoption and diffusion of technological
innovations and generate savings in nonproduction costs such as transportation, distribution and
inventory control while taking advantage of the economies of massed reserves along with
information sharing between establishments.
A second organizational descriptor is a binary variable equal to zero if the store is
wholesaler supplied and one if the store is part of a self-distributing group (SelfDist). Stores and
distribution centers are under common ownership in self-distributing chains, facilitating
coordination between these two segments of the retail supply chain and enhancing productivity
gains. Stores in self-distributing groups, which account for about 37 percent of the sampled
stores, report a value added figure that is over 2.5 times higher than that recorded by wholesaler
supplied stores. Sales per square foot measures are about 25 percent higher ($8.92 vs. $7.19).
Stores in self-distributing groups provide higher levels of benefits and incentives for both full-
time and part-time workers.
Unionization is a third organizational factor that may affect productivity if having a
unionized workforce is associated with significant differences in worker skills and/or workforce
stability. A binary variable equal to one if at least a quarter of the workforce is covered by a
collective bargaining agreement (Union) and zero otherwise is also included in the empirical
model, resulting in about 23 percent of the stores identified as unionized. Unionized stores
register high performance for the value added measure, with a dollar amount that is over 2 times
higher than non-unionized stores. The sales per square foot measure for unionized stores is about
32 percent higher than in non-unionized stores. Hirsch reported a strong negative relationship
13
between union coverage at the firm level and company earnings and market value for
manufacturing firm, supporting the theory that unions appropriate a share of the returns that
accrue to profit-enhancing firms. Food retailing establishments display a different pattern and it
will be interesting to see if a positive relationship between unionization and value added is
observed after controlling for key store level variables.
Distribution service levels are closely related to store format, the fourth measure of store
organization. King, Jacobson, and Seltzer report considerable variation in median store
characteristics and performance measures for stores grouped by format. The model examines
whether these format effects can be accounted for by systematic differences in input levels and
other productivity shifters across formats. Binary variables for these format categories are
included in the empirical model. Stores in the Supermarket Panel are grouped into four mutually
exclusive, exhaustive format categories based on store size and distribution service offerings.
The store format categories include conventional stores, food/drug combinations, supercenters,
and warehouse / super warehouse formats (Convl, FoodDrug, Scenter, Superstore).
Estimation Results
Discussion of the model results centers around two main issues. First, the key factors that
influence retail store performance along with the estimated partial production elasticities and
measures of returns to scale are presented. Second, the implications of the elasticities of
complementarity for evaluating use of store inputs by food retailers are assessed.
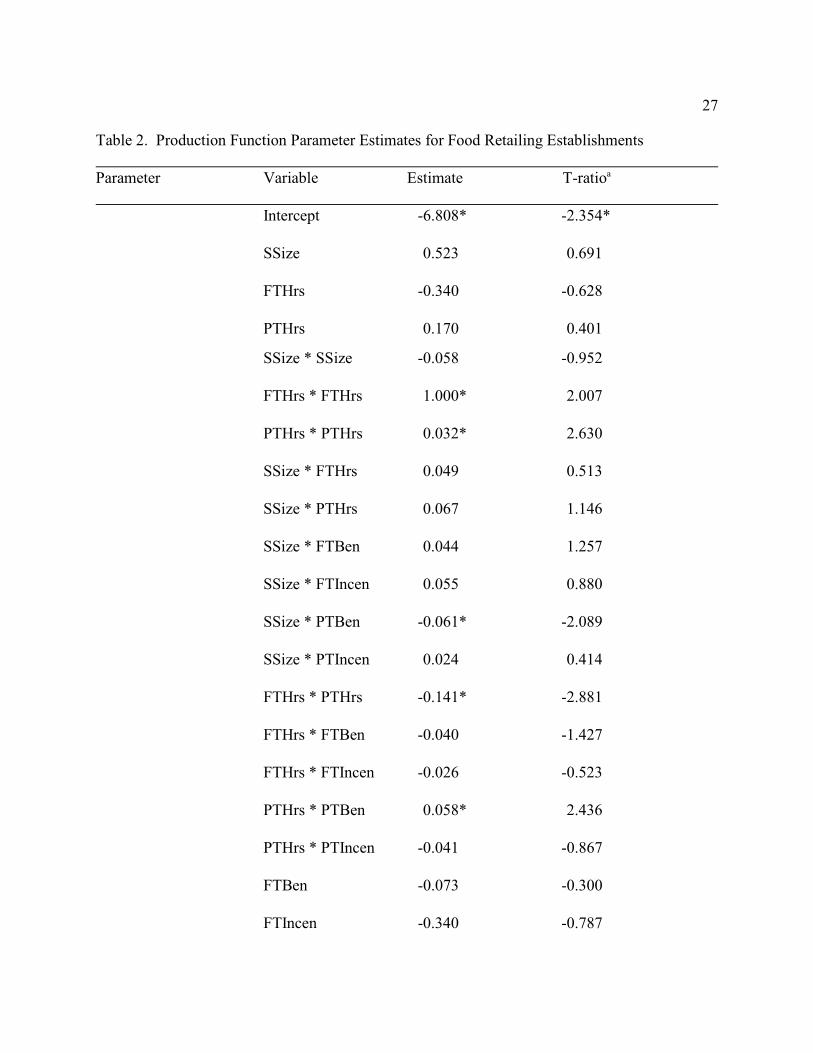
Coefficient estimates and asymptotic standard errors based on heteroscedasticity robust
standard errors for the translog model are presented in table 2. The empirical analysis follows
Berger, Grant and Hamermesh, and Kim which relied on the ordinary least squares model in their
14
applications. King and Park also provide support for the estimation approach in modeling
productivity in supermarket operations. Benefits and incentive packages are closely linked to the
size of the store along with staffing decisions leading us to specify interactions between
variables. The four store-level organizational and operational factors (group size, membership in
a self-distributing group, unionization, and four store format indicators) enter the specification as
factors that shift value added directly.
We examine whether the production function for food retailing is consistent with
homotheticity which implies that the marginal rate of technical substitution is homogeneous of
degree zero in inputs by testing whether . Restrictions required for a homogeneous
production along with linear homogeneity are also tested. Both the homotheticity and
homogeneity restrictions apply to the set of variable inputs considered in the model: store size,
full-time and part-time labor.
Hausman exogeneity tests of the benefits and incentives measures for full time and part
time employees were conducted. Instruments included training hours for new hires in cashiers
and other positions, hours of training for key employees (store managers, grocery department
managers, and scanning coordinators) along with store adoption of information technologies for
data sharing, decision sharing technologies and practices, and technologies supporting product
assortment, pricing, and merchandising decisions. The exogeneity hypothesis for the benefits
and incentives variables was not rejected.
The coefficients associated with the store categories indicate how supermarket
performance across each format compares with the average supermarket in the sample. The null
15
hypothesis that the format effects (conventional, food/drug combination, supercenter, and
warehouse / super warehouse) are jointly equal to zero is not rejected as the calculated P value2
3of 0.256 was below the critical value P of 7.81 at the 95 percent confidence level. The store2
format variables were subsequently excluded from the model. The Points of Impact Retail
Operations Survey compiles average gross profits across different store formats such as
conventional supermarkets, upscale, discount, and superstores, both upscale and conventional
(National Grocers Association). The findings are useful for retail industry analysts as they
suggest that after controlling for inputs such as store size and labor use (including benefits and
incentives) store formats are not a significant component influencing observed value added.
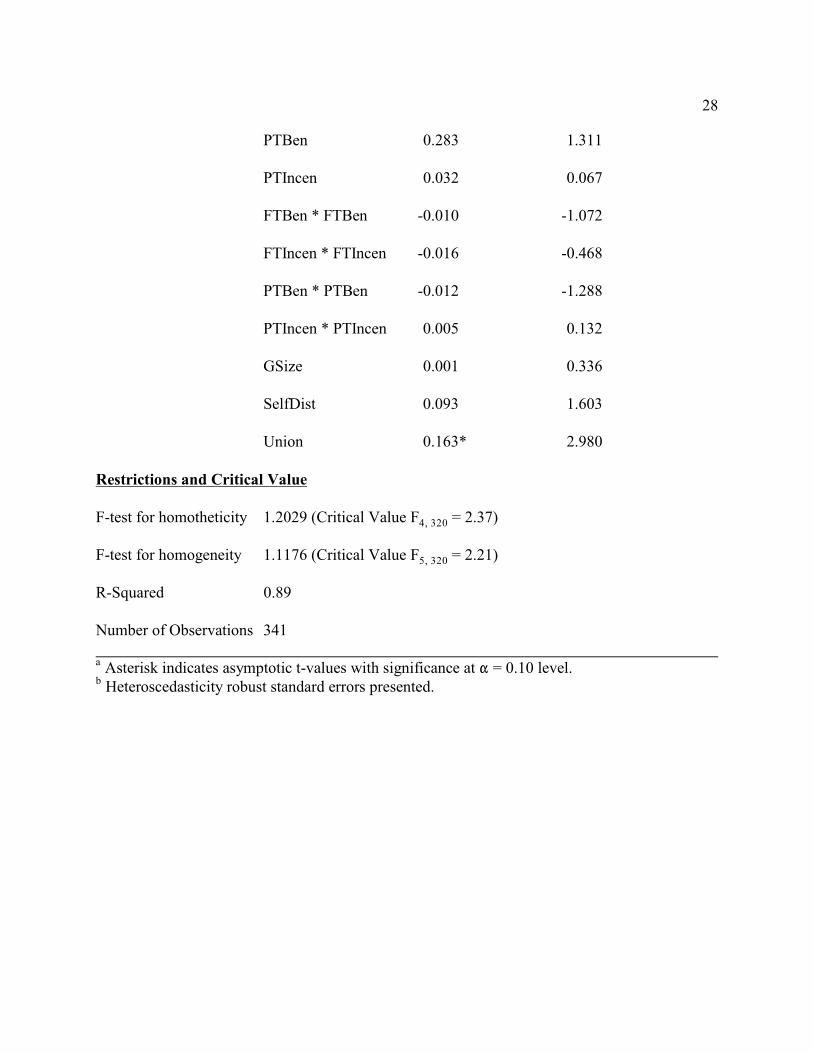
The calculated returns to scale measure is 1.013 which is not significantly higher than
one, implying essentially constant returns to scale for the set of variable inputs (store space, full-
time and part-time labor). From the likelihood ratio tests presented in table 2, the production
function for the food retailing establishments does not reject the constant returns to scale
restriction. The Hicks elasticity of complementarity is a theoretically valid measure to examine
input substitution patterns for the food retailing establishments. Using an aggregate cost function
for U.S. retail food stores based on value added at retail and three inputs including intermediate
services, capital, and labor, Ratchford found slightly decreasing returns to scale. Our results for
returns to scale align with those reported by Betancourt and Malanoski who found constant
returns to scale with respect to output for a sample of U.S. supermarkets. Oi’s proposition on
economies of scale in which large stores are driven by lower operating costs are not confirmed by
these results.
Labor expenses account for the largest proportion of operating expenses so food retailers
16
are naturally interested in evaluating the impact of labor on value-added at the store level. Wage
and benefits for store labor account for the largest component of operating expenses at about 53
percent of operating expenses. Occupancy (excluding utilities) ranks second with an 11 percent
share of operating expenses, followed by advertising and promotion at 7 percent (Food
Marketing Institute). From the translog model the partial production elasticities measure the
change in store value-added in response to one percent increase in labor used. The elasticity for
full-time employees (0.43) is about 13 percent higher than that for part-time employees (0.38).
Elasticities for the three inputs including store size (0.20) are each significantly different from
zero.
The effect for membership in a self-distributing group indicates that these stores attain a
value added which is about 9.7 percent higher than wholesaler supplied stores, using Kennedy’s
(1981) procedure to measure the impact of a dichotomous variable on the logarithm of value
added. Retail analysts link the effectiveness of Wal-Mart’s supercenters to its superior self-
distribution network while Kmart's competitive disadvantages have been attributed in part to its
lack of a self-distribution system. Self-distribution is recognized by retail analysts as a method to
reduce supply chain costs and achieve greater efficiency, allowing stores to expand margins,
improve in-stock availability and enhance store productivity.
Part-time employees in self-distributing chains are more productive than their
counterparts in wholesaler supplied operations. The productivity of labor (both full-time and
part-time) is about 16 percent higher in stores in self-distributing chains at 0.89 as compared with
0.77 for wholesaler supplied stores. The result is that self-distributing stores are able to generate
greater changes in value added for each unit of labor employed.
17
The union workforce binary variable showed a significant effect in improving margins by
about 17.7 percent. Unionization has a positive impact on value-added providing strong
evidence that there are productivity gains associated with having a union workforce. This result
suggests some justification for higher wages for union workers, since the marginal product of
labor, given the levels of selling area and total labor hours, are higher in stores with a union
workforce. Farber and Saks noted that most analytical work on unions has concluded that unions
generally raise the mean and lower the dispersion of the wage distribution within firms. Shifts in
the intrafirm distribution of earnings due to unionization typically benefit workers at the lower
end of the firm’s payscale. In the Supermarket Panel, the average wage bill for union
establishments was about 10 percent higher than nonunion food retailers while the standard
deviation of wages between the union establishments was 66 percent lower than nonunion stores.
The wage effects associated with unionization rates apparently have a positive impact on the
value-added of food retailers.
Retailers providing an expanded set of benefits to full-time employees show higher
performance as the impact of benefits on store level value added is statistically significant. The
impact of benefits on value added is evaluated in an elasticity calculation, accounting for the
interaction of the benefits variable with other explanatory variables in the model. An additional
employee benefit offered to both full-time and part-time employees adds about 4.0 percent to
store level value added.
Empirical work in labor economics has documented a positive association between wages
and benefits conditional on workforce characteristics. However, the result that firms offering
expanded benefits to their workforce attain better performance is a new finding which aligns with
18
emerging results from the labor economics literature. Decressin et al. show that firms offering
benefits are more likely to survive than firms that do not offer benefits, even after controlling for
workforce and firm characteristics. The results for the food retailing establishments do not show
that value added is positively influenced by an expanded incentive package for either full-time or
part-time workers. Retail managers can readily use these results to identify the optimal set of
benefits and incentives to provide employees with direct implications for improving store
performance.
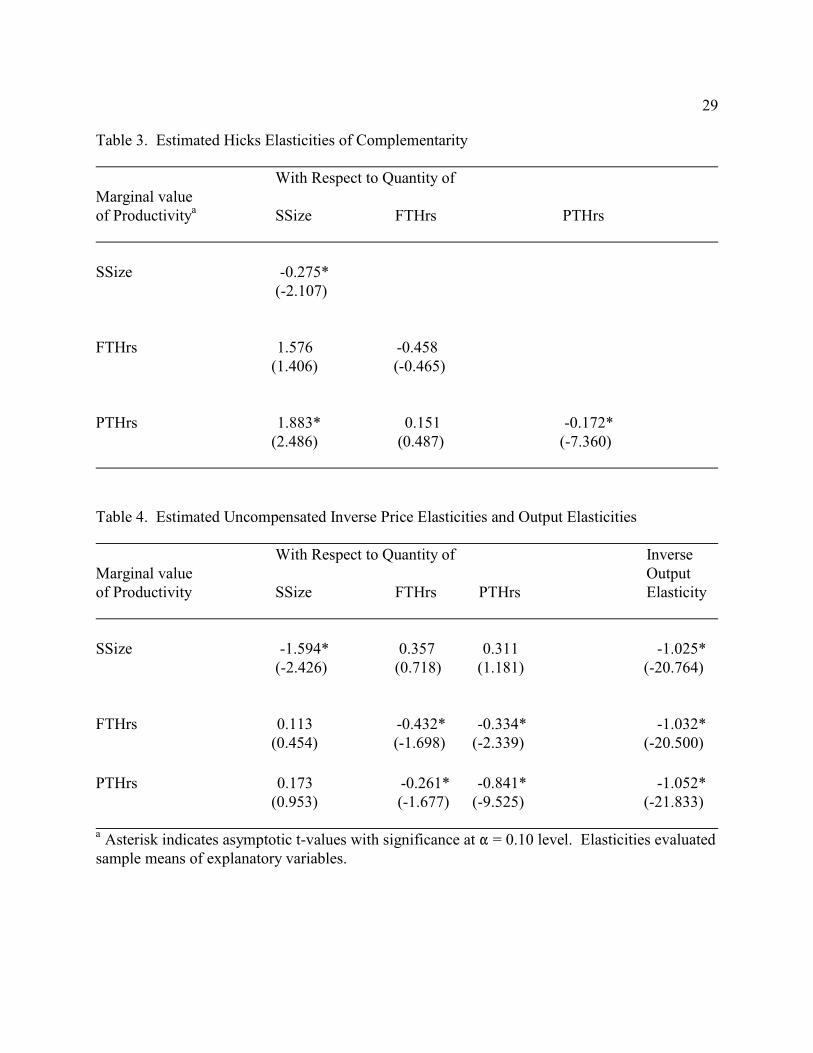
The own elasticities of complementarity calculated at the mean values of the explanatory
variables (table 3) are all negative, as required for a well-behaved production function. A positive
elasticity between store size and part-time employees indicates that as store size increases the
marginal value of labor rises and firms hire more part-time employees so these inputs are q-
complements. Store size and full-time workers are also q-complements although the effect is not
as large as that for the part-time workforce and are not statistically significant.
Inverse price elasticities and the inverse output elasticities evaluated at the means of the
explanatory variables are reported in table 4. The price elasticity shows that a one percent
increase in store size decreases the marginal cost of space by 1.59 percent while increasing the
marginal value of productivity (MVP), or the marginal revenue product, for both part-time and
full-time workers. The own-quantity inverse price elasticities for employees are small, indicating
that increases in the number of workers hired result in wage declines of less than 1 percent for
both full-time and part-time employees (assuming flexible wages). Adjustments in payments to
part-time employees are larger than those to full-time workers. Store size has no significant effect
on MVP of either full-time or part-time workers.
19
The expanded use of part-time workers leads to decreases in the valuation of full-time
workers at the store level leading to reduced employment of full-time workers. Negative signs for
the estimated inverse output elasticities imply that as value added expands the store places a
lower value on additional units of the input. Changes in store value added have a similar effects
across each of the inputs.
The findings suggest that in evaluating labor market policies in food retailing,
distinguishing between full-time and part-time employees is critical. Incorporating an expanded
set of worker characteristics based on demographic groups may also be important but utilizing
information on workforce scheduling (full-time vs. part-time workers) reflects a key store level
decision available to managers in the retail sector. Store size (capital) and both the labor groups
used in the model are complements. Incentives that encourage retailers to expand employment by
full-time and part-time workers will raise the marginal product, and therefore the rate of return to
capital.
Interpreting Labor Adjustment at the Store Level
Additional information about labor adjustment can be gained by using the decomposition
in equation (8) to predict the adjustments in wages for full-time and part-time employees in
response to changes in store size. Consider the development of the Neighborhood Market
concept by Wal-Mart which promotes a smaller store size (limited to about 40,000 sq. ft.). The
scenario is based on the partial elasticities of complementarity in table 3 along with partial
production elasticities.
Changes in factor quantities for the scenario are derived from the Supermarket Panel
using mean store size and employee hours for stores which match the profile of Neighborhood
20
Markets. Stores that are operating below the 40,000 sq. ft. mark are assumed to adjust their
inputs to match the Neighborhood Markets format. The predicted decrease in the relative
FTHrs PTHrsearnings of full-time versus part-time workers, or )ln(P / P ), is -0.213. Expanded
employment of full-time workers has a positive effect on the adjustment in wages (0.168), but are
outweighed by reductions in relative wages due to larger stores (-0.082) and lower demand for
part-time employees (-0.299). Survey data from the Supermarket Panel allow a comparison of
the relative use of full-time versus part-time labor in the two stores formats (less than 40,000 sq.
ft. and those above 40,000 sq. ft). The ratio of full-time to part-time labor in stores below the
40,000 sq. ft. mark is 80 percent and shrinks to 37 percent for stores sizes consistent with the
Neighborhood Market concept. Larger stores employ more of both types of workers but shift to a
greater reliance on part-timers.
The Hicks elasticity and the decomposition allow us to evaluate changes in relative
earnings which are a key tool monitored by store managers and the factors driving shifts in
relative wages. An advantage of the production function approach which generates Hicks
elasticities of complementarities is its flexibility in analyzing the impact of evolving trends in
food retailing, particularly changes in relative factor prices.
Discussion and Conclusion
Retail managers are frequently interested in relating store level performance to specific
management or human resource strategies. Berman and Evans outlined strategies available to
retailers to enhance net profit margin (related to our value added measure) and mentioned store
level adjustments such as lowering labor costs, reducing costs by emphasizing self-service, or
selling exclusive product lines. These strategies will involve changes in store size and the
21
intensity and relative use of full-time and part-time employees which can be assessed using the
production function approach the Hicks elasticities of complementarity.
This study presents results from a production function analysis of supermarket operations,
using a unique data set from a national survey of supermarkets. We place particular emphasis on
modeling returns to scale and elasticities of complementarity using a flexible functional form,
linking these measures to store-level workforce decisions on benefits and incentives. The results
confirm that the Hicks elasticity of complementarity is an appropriate measure to assess input
substitutability for food retailers since the production function exhibits constant returns to scale.
The empirical work documents that food retailing firms which offer an expanded set of
benefits (such as individual health insurance, family health insurance, disability insurance,
company funded pension, or a 401(k) plan) attain better performance. These findings address an
important distinction in the menu of benefits offered to the retail workforce as part-time workers
receive very restricted benefits compared to full-time employees. Retailers providing an
expanded benefits set achieve higher performance, a finding which aligns with emerging results
from the labor economics literature. Retail managers could use these results to focus on
identifying the optimal set of benefits for employees in order to improve store performance.
The detailed information on benefits and incentives available in the Supermarket Panel
highlights the value of store level data from food retailers collected with industry cooperation.
Additional analysis can be conducted to establish whether the optimal menu of benefits and
incentives differs across size of store or should be adjusted for specific store formats. The
detailed disaggregate data from the Supermarket Panel also indicates whether the benefits and
incentives are provided to store managers, department heads, full-time workers, and part-time
22
workers. This information could be exploited to assess the differential effects across groups of
workers and the impact of aligning benefits packages so that different employee groups receive a
similar package of benefits.
Future work will expand the sample size by using updated versions of the Supermarket
Panel. A primary goal will be to assess learning effects associated with changes in workforce
composition between full-time and part-time employees, adjustments in benefits, and the role of
turnover using data from multiple years. Finally, we plan to devote added attention to exploring
the factors that underlie the strong productivity gains associated with membership in a self-
distributing group, since questions about the importance of vertical coordination between stores
and distribution centers will be critical to understanding the structural evolution of supermarkets.
23
References
Baily, M.N. and R.M. Solow. 2001 “International Productivity Comparisons Built from the Firm
Level.” Journal of Economic Perspectives 15:151-172.
Basker, E. 2005. “Job Creation or Destruction? Labor-Market Effects of Wal-Mart Expansion.”
Review of Economics and Statistics 87:174-183.
Berger, M.C. 1983. “Changes in Labor Force Composition and Male Earnings.” Journal of
Human Resources 18:177-196.
Berman, B. and J.R. Evans. 2001. Retail Management: A Strategic Approach. Upper Saddle
River, N.J.: Prentice-Hall, Inc.
Betancourt, R. and M. Malanoski. 1999. “An Estimable Model of Supermarket Behavior: Prices,
Distribution Services and Some Effects of Competition.” Empirica 26:55-73.
Brown, C. and J.L. Medoff. 2003. “Firm Age and Wages.” Journal of Labor Economics 21:677-
697.
Davis, E. M. Freedman, J. Lane, B. McCall, N. Nestoriak, T.A. Park. 2006. “Product Market
Competition and Human Resource Practices: An Analysis of the Retail Food Sector.”
Social Science Research Network, http://ssrn.com/abstract=717403.
Decressin, A., J. Lane, K. McCue, M Harrison Stinson. 2004. “Employer-Provided Benefit
Plans, Workforce Composition and Firm Outcomes.” LEHD Technical Paper No. TP-
2003-06 . http://ssrn.com/abstract=638482.
Discount Store News. 1999. “New Market' to Bridge the Gap - Wal-Mart's Neighborhood
Market Grocery Stores.”
www.findarticles.com/p/articles/mi_m3092/is_1999_Oct/ai_57578919.
24
Farber, H.S. and D.H. Saks. 1980. “Why Workers Want Unions: The Role of Relative Wages
and Job Characteristics.” Journal of Political Economy 88:349-369.
Food Marketing Institute. 2003. “2003 Employee Benefits Study.” Food Marketing Institute,
Washington, D.C.
Food Marketing Institute. 2002. “Key Industry Facts.” Washington, DC: The Food Marketing
Institute. (www.fmi.org/facts_figs/keyfacts/storesize.htm).
Grant, J. and D. Hamermesh. 1981. “Labor Market Competition Among Youths, White Women
and Others.” Review of Economics and Statistics 63:354-360.
Hausman, J.A. 1978. “Specification Tests in Econometrics.” Econometrica 46:1251-71.
Hirsch, B.T. 1991. “Union Coverage and Profitability Among U.S. Firms.” Review of Economics
and Statistics 73:69-77.
Hoppe, H.C. 2002. “The Timing of New Technology Adoption: Theoretical Models and
Empirical Evidence.” The Manchester School 70:56-76.
Jensen, R.A. 2004. “Multiplant Firms and Innovation Adoption and Diffusion.” Southern
Economic Journal 70:661-671.
Kennedy, P.E. 1981. “Estimation with Correctly Interpreted Dummy Variables in
Semilogarithmic Equations.” American Economic Review 71:801.
Kim, H.Y. 2000. “The Antonelli Versus Hicks Elasticity of Complementarity and Inverse Input
Demand Systems.” Australian Economic Papers 39:245-261.
King, R.P., E.M. Jacobson, and J.M. Seltzer. 2002. The 2002 Supermarket Panel: Annual
Report. The Food Industry Center, Department of Applied Economics, University of
Minnesota.
25
King, R.P. and T.A. Park. 2004 . “Modeling Productivity in Supermarket Operations.” Journal
of Food Distribution Research 35:42-55.
Major, M. 2003. “The People Gap.” Progressive Grocer 82:245-261.
.National Grocers Association. “Points of Impact FMS Retail Operations Survey 2004-2005.”
http://www.nationalgrocers.org/nga.art/FinSur2004-5.PDF
Oi, W. 1992. “Productivity in the Distributive Trades: the Shopper and the Economics of Massed
Reserves” in Output Measurement in the Service Sector, edited by Z. Griliches. Chicago:
University of Chicago Press.
Ratchford, B.T. 2003. “Has the Productivity of Retail Food Stores Really Declined?” Journal of
Retailing 79:171-182.
Sato, R. and Koizumi, T. 1973. “On the Elasticities of Substitution and Complementarity.”
Oxford Economic Papers 25:44-56.
Seidman, L.S. 1989. “Complements and Substitutes: The Importance of Minding p’s and q’s.”
Southern Economic Journal 56:183-190.
26
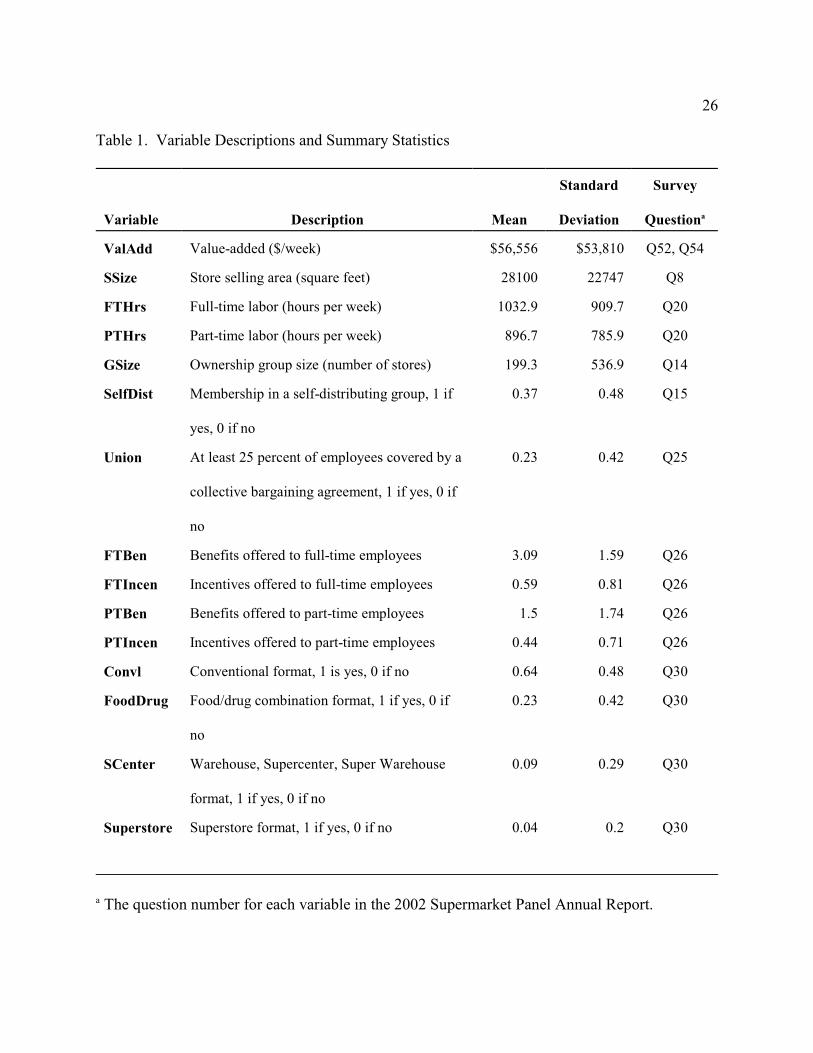
Table 1. Variable Descriptions and Summary Statistics
Variable Description Mean
Standard
Deviation
Survey
Questiona
ValAdd Value-added ($/week) $56,556 $53,810 Q52, Q54
SSize Store selling area (square feet) 28100 22747 Q8
FTHrs Full-time labor (hours per week) 1032.9 909.7 Q20
PTHrs Part-time labor (hours per week) 896.7 785.9 Q20
GSize Ownership group size (number of stores) 199.3 536.9 Q14
SelfDist Membership in a self-distributing group, 1 if
yes, 0 if no
0.37 0.48 Q15
Union At least 25 percent of employees covered by a
collective bargaining agreement, 1 if yes, 0 if
no
0.23 0.42 Q25
FTBen Benefits offered to full-time employees 3.09 1.59 Q26
FTIncen Incentives offered to full-time employees 0.59 0.81 Q26
PTBen Benefits offered to part-time employees 1.5 1.74 Q26
PTIncen Incentives offered to part-time employees 0.44 0.71 Q26
Convl Conventional format, 1 is yes, 0 if no 0.64 0.48 Q30
FoodDrug Food/drug combination format, 1 if yes, 0 if
no
0.23 0.42 Q30
SCenter Warehouse, Supercenter, Super Warehouse
format, 1 if yes, 0 if no
0.09 0.29 Q30
Superstore Superstore format, 1 if yes, 0 if no 0.04 0.2 Q30
The question number for each variable in the 2002 Supermarket Panel Annual Report.a
27
Table 2. Production Function Parameter Estimates for Food Retailing Establishments
Parameter Variable Estimate T-ratioa
Intercept -6.808* -2.354*
SSize 0.523 0.691
FTHrs -0.340 -0.628
PTHrs 0.170 0.401
SSize * SSize -0.058 -0.952
FTHrs * FTHrs 1.000* 2.007
PTHrs * PTHrs 0.032* 2.630
SSize * FTHrs 0.049 0.513
SSize * PTHrs 0.067 1.146
SSize * FTBen 0.044 1.257
SSize * FTIncen 0.055 0.880
SSize * PTBen -0.061* -2.089
SSize * PTIncen 0.024 0.414
FTHrs * PTHrs -0.141* -2.881
FTHrs * FTBen -0.040 -1.427
FTHrs * FTIncen -0.026 -0.523
PTHrs * PTBen 0.058* 2.436
PTHrs * PTIncen -0.041 -0.867
FTBen -0.073 -0.300
FTIncen -0.340 -0.787
28
PTBen 0.283 1.311
PTIncen 0.032 0.067
FTBen * FTBen -0.010 -1.072
FTIncen * FTIncen -0.016 -0.468
PTBen * PTBen -0.012 -1.288
PTIncen * PTIncen 0.005 0.132
GSize 0.001 0.336
SelfDist 0.093 1.603
Union 0.163* 2.980
Restrictions and Critical Value
4, 320F-test for homotheticity 1.2029 (Critical Value F = 2.37)
5, 320F-test for homogeneity 1.1176 (Critical Value F = 2.21)
R-Squared 0.89
Number of Observations 341
Asterisk indicates asymptotic t-values with significance at " = 0.10 level. a
Heteroscedasticity robust standard errors presented. b
29
Table 3. Estimated Hicks Elasticities of Complementarity
With Respect to Quantity ofMarginal value of Productivity SSize FTHrs PTHrsa
SSize -0.275* (-2.107)
FTHrs 1.576 -0.458 (1.406) (-0.465)
PTHrs 1.883* 0.151 -0.172* (2.486) (0.487) (-7.360)
Table 4. Estimated Uncompensated Inverse Price Elasticities and Output Elasticities
With Respect to Quantity of InverseMarginal value Outputof Productivity SSize FTHrs PTHrs Elasticity
SSize -1.594* 0.357 0.311 -1.025* (-2.426) (0.718) (1.181) (-20.764)
FTHrs 0.113 -0.432* -0.334* -1.032* (0.454) (-1.698) (-2.339) (-20.500)
PTHrs 0.173 - 0 . 2 6 1 * -0.841* -1.052* (0.953) ( - 1 . 6 7 7 ) (-9.525) (-21.833)
Asterisk indicates asymptotic t-values with significance at " = 0.10 level. Elasticities evaluateda
sample means of explanatory variables.
30
Appendix. Summary of Benefits and Incentives Offered by Food Retailers
Abbreviation Benefit or Incentive Full-time Part-time
IHINS Individual health insurance 84.8 35.4FHINS Family health insurance 73.0 25.8DINS Disability insurance 55.4 25.5CFPEN Pension 37.8 25.2401K 401(k) plan 57.8 38.1
ANBON Annual bonus 19.3 12.0IPIP Individual performance incentive pay 16.7 15.2IPCP Incentive pay linked to 5.6 3.2
product / category performance ESOP Employee stock ownership program 17.0 13.5
Ben IHINS + FHINS + DINS + CFPEN + 401K
Incen ANBON + IPIP + IPCP + ESOP
Data from the 2002 Supermarket Panel Annual Report. The proportion of employees receivinga
the benefit or incentive is recorded in the table.