![blog. · Web viewANSWER: B ANSWER: C [CI`(H2O)4C1(NO2)]CI COON HOOC-CH2\N_CCH~_CH___N/H Ml ` | ` \' ' CH2 CH2 -COOH HOOC' HOOC`.."CHZ CH2"COOH \ I /N-CH2-CH2-N\ HOOC""CH2 CH2-COOH](https://static.fdocuments.us/doc/165x107/5ab561c67f8b9a0f058cbd1a/blog-viewanswer-b-answer-c-cih2o4c1no2ci-coon-hooc-ch2ncchchnh.jpg)
LA Health Profiles, CH2
16
Health Status Measurements of health status include self-perceived health status, body weight, and prevalence of chronic diseases such as asthma, diabetes, and hypertension. 15
Transcript of LA Health Profiles, CH2

Health Status
Measurements of health status
include self-perceived health
status, body weight, and
prevalence of chronic diseases
such as asthma, diabetes,
and hypertension.
15

Perceptions of Health StatusSelf-assessed health is a broad indicator of health andwell being which incorporates a variety of physical,emotional, and personal components of health.Several studies have shown that self-assessed health isa valid and reliable indicator of a person’s overallhealth status1 and a powerful predictor of mortality2
and changes in physical functioning.3 It may alsodetermine the perceived need and demand for healthcare and other health-related services.
What did the survey measure?
Health StatusRespondents (18 and older) rated their physicalhealth as excellent, very good, good, fair, or poor.
Findings about self-perceivedhealth status
➜ Percentages of Los Angeles County residents whoassess their health as “poor” or “fair” are highestamong:
➜ Those with lower incomes, defined by thepercent of federal poverty level.
➜ Latinos (30%) and Asians (27%), followed byAfrican-Americans (18%), and whites (12%).
➜ A higher proportion of females (24%) perceivetheir health as “poor” or “fair” than domales (17%).
➜ Of those uninsured, 29% perceive their health as“poor” or “fair.”
➜ Twenty-seven percent of adults with no regularsource of care perceive their health as “poor” or“fair.”
Note: For more detailed data on self-perceived health status at the county, serviceplanning area, and health district levels, please refer to Appendices B-4, C-1through C-8.
1. Tissue T. Another look at self-rated health among the elderly. J Gerontol, 1972;27:91-94.
2. Idler El, Benyamini Y. Self-rated health and mortality: A review of twenty-seven communitystudies. Journal of Health and Social Behavior, 1997;38:21-37.
3. Ilder El, Kasal SV. Self-ratings of health: do they also predict change in functional ability?J Gerontol B Psychol Sci Soc Sci., 1995;50B(6):S344-53.
0 10 20 30 40 50 60 70 80
14%
15%
22%
25%
12%
32%
24%
18%
21%
21%
29%
27%
28%
22%
31%
29%
26%
27%
Percentage of Adult Smokers
Antelope Valley
San Fernando Valley
San Gabriel Valley
Metro
West
South
East
South Bay
County
� Fair/Poor$
� Good
Self-Perceived Health Status Of AdultsBy Service Planning Area, 1997
Fig 2.1
• For a family of four, the 1997 federal poverty level is $16,050 a year and 200% of poverty is$32,100.
0 10 20 30 40
13%
27%
40%!
Percentage of Adults
Above 200% FPL
100%–200% FPL
Below 100% FPL$
Fair or Poor Health StatusBy Poverty Level, 1997
Fig 2.2
16

Persons who are overweight are at increased risk for avariety of medical conditions including heart disease,stroke, diabetes mellitus, arthritis, gallbladder disease,and certain types of cancer.4 Being overweight isassociated with an increased risk of death amongmiddle-aged and older adults.5
What did the survey measure?
Body Mass IndexCalculated from self-reported height (feet andinches) x weight (pounds) according to thefollowing formula: 703 x weight (lbs.)/height (in.)2.
OverweightMildly to moderately overweight corresponds to aBMI equal to or greater than 25 but less than 30.Severely overweight corresponds to a BMI equalto or greater than 30.
Perceptions of WeightRespondents (18 and older) are asked whetherthey consider themselves to be overweight,underweight, or about average for their height.
Findings about weight status
➜ Overall, 14% of adults in Los Angeles County areseverely overweight.
➜ The prevalence of severe overweight varies slightlyby gender.
➜ African-Americans (22%) and Latinos (17%) havethe highest proportion of severely overweightadults, followed by whites (12%) and Asians (4%).
➜ The prevalence of severe overweight increases withadvancing age, from 9% in 18–29 year olds to 18%in adults 50 years and older.
➜ Those who perceive their health as “poor” to “fair”have a higher prevalence of severe overweight (22%)compared to those who perceive their health as“very good” to “excellent” (10%).
➜ This prevalence is also higher in persons with lessthan a high school education (22%) than in thosewho have completed college (10%).
Note: For more detailed data on self-perceived health status at the county, servicesplanning area, and health district levels, please refer to Appendices B-4, C-1through C-8.
Overweight
0 10 20 30 40 50 60 70 80
36%
34%
35%
30%
30%
36%
39%
35%
34%
13%
11%
14%
13%
9%
25%
18%
13%
14%
Percentage of Adult Smokers
Antelope Valley
San Fernando Valley
San Gabriel Valley
Metro
West
South
East
South Bay
County
� Mild/Moderate$
Overweight$
� Severely$
Overweight
Weight Status Of AdultsBy Service Planning Area, 1997
4. Pi-Suyner FX. Medical hazards of obesity. Ann Intern Med, 1993;119:655-660.
5. Stevens J, Jianwen C, Pamuk ER, et al. The effect of age on the association between body-massindex and mortality. New England Journal of Medicine, 1998;338:1-7.
Fig 2.3
17

6. Department of Health Services, Los Angeles County, Data Collection and Analysis Unit.
What did the survey measure?
Chronic ConditionsSelf-reported conditions: diabetes, high bloodpressure or hypertension, and arthritis.
Asthma (in children, 0–17 only)Reported by the parent or legal guardian of childin the household.
Current Receipt of Medical Treatmentfor Chronic Conditions
Respondents answered whether they are currentlybeing treated by a physician for each of the aboveconditions.
Diabetes
Diabetes mellitus is a condition characterized by highlevels of blood glucose resulting from defects in insulinsecretion, insulin action, or both. In 1997, diabeteswas the eighth leading cause of death in Los AngelesCounty and accounted for nearly 13 deaths per100,000 population.6
Findings about Diabetes
➜ Diabetes prevalence is highest among African-Americans (9%) followed by Latinos (6%),whites and Asians (5%).
➜ Diabetes is more prevalent in adults 50 years andolder (13%).
➜ Those with less than a high school educationhave a higher prevalence of diabetes (8%)compared to college graduates (4%).
Note: For more detailed data on diabetes at the county, service planning area, and healthdistrict levels, please refer to Appendices B-4, C-1 through C-8.
0 10 20 30 40
5%
5%
6%
6%
5%
9%
5%
5%
6%
g f
Antelope$
Valley
San Fernando$
Valley
San Gabriel$
Valley
Metro
West
South
East
South Bay
County
Adults With DiabetesBy Service Planning Area, 1997
Chronic Conditions
Fig 2.4
0 10 20 30 40 50
5%
9%
6%
5%
g f
White
African-$
American
Latino
Asian
Adults With DiabetesBy Race/Ethnicity, 1997
Fig 2.5
18

Hypertension
Hypertension, or high-blood pressure, is a risk factorfor heart disease and stroke, the first and thirdleading causes of death in Los Angeles County in1997.6 The risk of stroke and heart disease can bereduced with the effective management ofhypertension, which can be accomplished throughmedicine, diet, and physical activity.
Findings about Hypertension
➜ Females (18%) have a higher prevalence ofhypertension than males (14%).
➜ Prevalence of hypertension is highest amongAfrican-Americans (28%) and whites (17%)followed by Asians (14%) and Latinos (12%).
➜ Hypertension prevalence varies little by familyincome.
➜ Hypertension prevalence increases withadvancing age, from 4% in 18–29 years old to35% in adults aged 50 and older.
0 10 20 30 40
10%
15%
18%
14%
13%
22%
16%
16%
16%
g f
Antelope$
Valley
San Fernando$
Valley
San Gabriel$
Valley
Metro
West
South
East
South Bay
County
Adults With HypertensionBy Service Planning Area, 1997
➜ Those with less than a high school educationhave a higher prevalence of hypertension (19%)than college graduates (13%).
Note: For more detailed data on diabetes at the county, service planning area, and healthdistrict levels, please refer to Appendices B-4, C-1 through C-8.
Arthritis
The word arthritis means joint inflammation and isassociated with more than 100 diseases that can causepain, stiffness, and swelling in the joints. Thesediseases may affect not only the joints but also otherparts of the body, including important supportingstructures such as muscles, bones, tendons, andligaments, as well as some internal organs. More than40 million Americans suffer from some form ofarthritis, and many have chronic pain that limits dailyactivity and may negatively impact quality of life.7
7. Humphrey N. CDC calls arthritis the epidemic of the future. VUMC Reporter, VanderbiltUniversity Medical Center, 1994;4(25):1,3.
0 10 20 30 40 50
17%
28%
12%
14%
g f
White
African-$
American
Latino
Asian
Adults With HypertensionBy Race/Ethnicity, 1997
Fig 2.7
Fig 2.6
19
Chronic Conditions continued
Findings about Arthritis
➜ Arthritis varies significantly by gender. Twenty-two percent of females have arthritis compared to13% of males.
➜ Whites (22%) and African-Americans (22%)have the highest prevalence of arthritis comparedto Asians (15%) and Latinos (12%).
➜ Forty percent of adults aged 50 years and olderhave arthritis compared to 3% of 18–29 yearolds, 7% of 30–39 year olds and 17% of40–49 year olds.
➜ Adults with less than a high school educationhave a higher prevalence of arthritis (21%) thancollege graduates (14%).
Note: For more detailed data on diabetes at the county, service planning area, and healthdistrict levels, please refer to Appendices B-4, C-1 through C-8.
0 10 20 30 40
21%
16%
20%
14%
15%
21%
18%
17%
18%
g f
Antelope$
Valley
San Fernando$
Valley
San Gabriel$
Valley
Metro
West
South
East
South Bay
County
Adults With ArthritisBy Service Planning Area, 1997
Fig 2.8
0 10 20 30 40 50
22%
22%
12%
15%
g f
White
African-$
American
Latino
Asian
Adults With ArthritisBy Race/Ethnicity, 1997
Fig 2.9
20
* Prevalence for noted subgroup is based on small numbers (fewer than 30 respondents in thesubgroup).
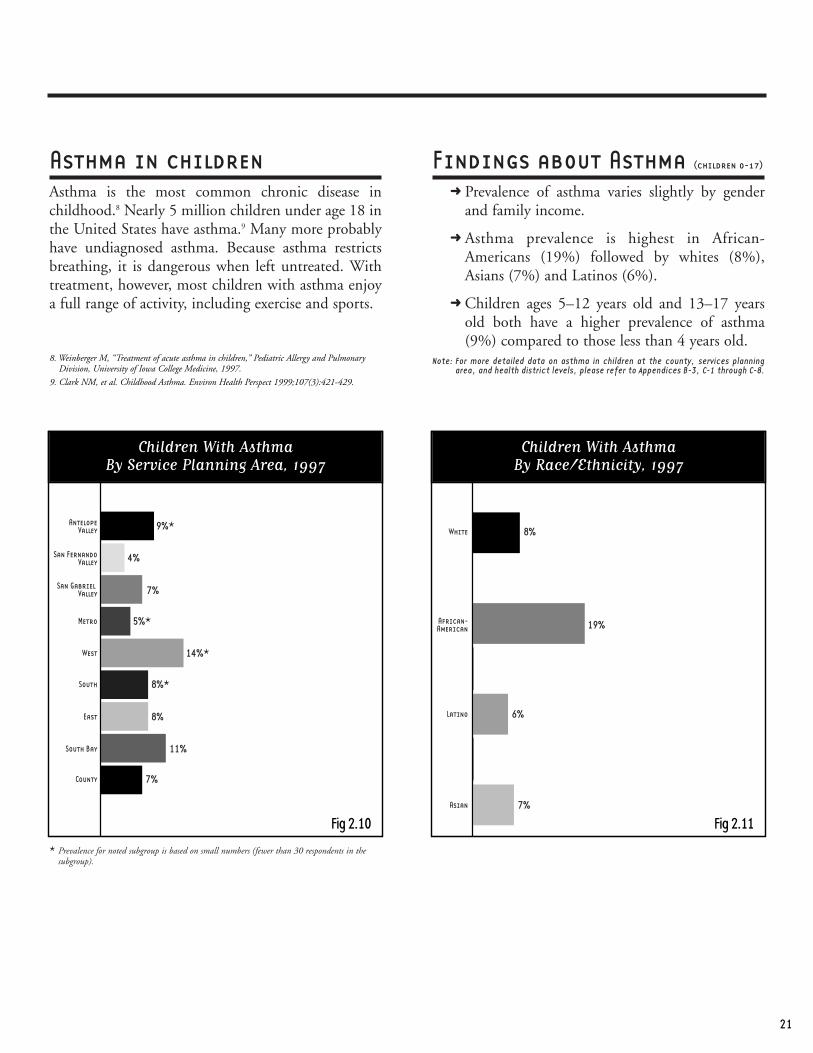
Asthma in children
Asthma is the most common chronic disease inchildhood.8 Nearly 5 million children under age 18 inthe United States have asthma.9 Many more probablyhave undiagnosed asthma. Because asthma restrictsbreathing, it is dangerous when left untreated. Withtreatment, however, most children with asthma enjoya full range of activity, including exercise and sports.
Findings about Asthma (children 0-17)
➜ Prevalence of asthma varies slightly by genderand family income.
➜ Asthma prevalence is highest in African-Americans (19%) followed by whites (8%),Asians (7%) and Latinos (6%).
➜ Children ages 5–12 years old and 13–17 yearsold both have a higher prevalence of asthma(9%) compared to those less than 4 years old.
Note: For more detailed data on asthma in children at the county, services planningarea, and health district levels, please refer to Appendices B-3, C-1 through C-8.
0 10 20 30 40
9%*
4%
7%
5%*
14%*
8%*
8%
11%
7%
g f
Antelope$
Valley
San Fernando$
Valley
San Gabriel $
Valley
Metro
West
South
East
South Bay
County
Children With AsthmaBy Service Planning Area, 1997
8. Weinberger M, “Treatment of acute asthma in children,” Pediatric Allergy and PulmonaryDivision, University of Iowa College Medicine, 1997.
9. Clark NM, et al. Childhood Asthma. Environ Health Perspect 1999;107(3):421-429.
Fig 2.10
0 10 20 30 40 50
8%
19%
6%
7%
g f
White
African-$
American
Latino
Asian
Children With AsthmaBy Race/Ethnicity, 1997
Fig 2.11
21

* Prevalence for noted subgroup is based on small numbers (fewer than 30 respondents in the subgroup).
0 20 40 60 80
65%
21%*
14%*
g f
Fair/Poor
Very Good/$
Excellent
Good0 20 40 60 80
13%*
36%
51%
g f
Not$
Overweight
Severely$
Overweight
Mild/Moderate$
Overweight
Self-Perceived Health Status Weight Status
Health Status By Select Characteristics, 1997Antelope Valley
Fig 2.12a Fig 2.12b
SPA1
22

* Prevalence for noted subgroup is based on small numbers (fewer than 30 respondents in the subgroup).
0 10 20 30 40
12%
18%
10%
20%
35%
9%
8%*
24%
24%
10%
12%
17%
20%
g f
Males
Females
Whites
African$
Americans
Latinos
Asians
18–29 Years
30–39 Years
40-49 Years
50 Years and Older
Above 200% FPL
100%–200% FPL
Below 100% FPL
0 10 20 30 40
11%
12%
17%
16%
10%
11%
8%*
16%
1%*
6%*
10%
15%
16%
g f
Males
Females
Whites
Below 100% FPL
100%-200% FPL
Above 200% FPL
African$
Americans
Latinos
Asians
18–29 Years
30–39 Years
40-49 Years
50 Years and Older
San Fernando ValleyHealth Status By Select Characteristics, 1997
Fig 2.13c Fig 2.13d• For a family of four, the 1997 federal poverty level is $16,050 a year and 200% of poverty is
$32,100.• Weight status is determined on body mass index (BMI). BMI is calculated using the weight
and height of the respondent. Mildly to moderately overweight corresponds to a BMI equal toor greater than 25 but less but less than 30. Severely overweight corresponds to a BMI equal toor greater than 30.
Fair Or Poor Health StatusOf Adults 18 Years And Older
Severely Overweight Adults
0 20 40 60 80
57%
29%
15%
g f
Fair/Poor
Very Good/$
Excellent
Good0 20 40 60 80
11%
34%
54%
g f
Not$
Overweight
Severely$
Overweight
Mild/Moderate$
Overweight
Self-Perceived Health Status Weight Status
Fig 2.13a Fig 2.13b
SPA2
23

* Prevalence for noted subgroup is based on small numbers (fewer than 30 respondents in the subgroup).
0 10 20 30 40
19%
25%
15%
29%
41%
16%
22%*
25%
30%
18%
20%
21%
28%
g f
Males
Females
Whites
African$
Americans
Latinos
Asians
18–29 Years
30–39 Years
40-49 Years
50 Years and Older
Above 200% FPL
100%–200% FPL
Below 100% FPL
0 10 20 30 40
14%
14%
19%
14%
13%
16%
23%*
16%
4%*
8%*
12%
14%
19%
g f
Males
Females
Whites
Below 100% FPL
100%-200% FPL
Above 200% FPL
African$
Americans
Latinos
Asians
18–29 Years
30–39 Years
40-49 Years
50 Years and Older
Fair Or Poor Health StatusOf Adults 18 Years And Older
Severely Overweight Adults
Fig 2.14c Fig 2.14d• Weight status is determined on body mass index (BMI). BMI is calculated using the weight
and height of the respondent. Mildly to moderately overweight corresponds to a BMI equal toor greater than 25 but less but less than 30. Severely overweight corresponds to a BMI equal toor greater than 30.
Health Status By Select Characteristics, 1997San Gabriel Valley
• For a family of four, the 1997 federal poverty level is $16,050 a year and 200% of poverty is$32,100.
0 20 40 60 80
51%
27%
22%
g f
Fair/Poor
Very Good/$
Excellent
Good0 20 40 60 80
14%
35%
51%
g f
Not$
Overweight
Severely$
Overweight
Mild/Moderate$
Overweight
Self-Perceived Health Status Weight Status
Fig 2.14a Fig 2.14b
SPA3
24

0 10 20 30 40 50
20%
31%
14%
33%
41%
8%
22%*
36%
29%
22%
24%
27%
28%
g f
Males
Females
Whites
African$
Americans
Latinos
Asians
18–29 Years
30–39 Years
40-49 Years
50 Years and Older
Above 200% FPL
100%–200% FPL
Below 100% FPL
0 10 20 30 40
11%
15%
22%
17%
7%
7%*
14%*
19%
6%*
10%*
16%
14%
12%
g f
Males
Females
Whites
Below 100% FPL
100%-200% FPL
Above 200% FPL
African$
Americans
Latinos
Asians
18–29 Years
30–39 Years
40-49 Years
50 Years and Older
Fair Or Poor Health StatusOf Adults 18 Years And Older
Severely Overweight Adults
Health Status By Select Characteristics, 1997 Metro
Fig 2.15c Fig 2.15d• For a family of four, the 1997 federal poverty level is $16,050 a year and 200% of poverty is
$32,100.• Weight status is determined on body mass index (BMI). BMI is calculated using the weight
and height of the respondent. Mildly to moderately overweight corresponds to a BMI equal toor greater than 25 but less but less than 30. Severely overweight corresponds to a BMI equal toor greater than 30.
0 20 40 60 80
47%
28%
25%
g f
Fair/Poor
Very Good/$
Excellent
Good0 20 40 60 80
13%
30%
57%
g f
Not$
Overweight
Severely$
Overweight
Mild/Moderate$
Overweight
Self-Perceived Health Status Weight Status
Fig 2.15a Fig 2.15b
SPA4
25

Health Status By Select Characteristics, 1997West
0 20 40 60 80
66%
22%
13%
g f
Fair/Poor
Very Good/$
Excellent
Good0 20 40 60 80
9%
30%
61%
g f
Not$
Overweight
Severely$
Overweight
Mild/Moderate$
Overweight
Self-Perceived Health Status Weight Status
Fig 2.16a Fig 2.16b
SPA5
26

* Prevalence for noted subgroup is based on small numbers (fewer than 30 respondents in the subgroup).
0 10 20 30 40
27%
35%
22%
29%
43%
22%*
22%
41%
16%*
27%
37%
36%
37%
Males
Females
Whites
African$
Americans
Latinos
Asians
18–29 Years
30–39 Years
40-49 Years
50 Years and Older
Above 200% FPL
100%–200% FPL
Below 100% FPL
0 10 20 30 40
23%
27%
24%
32%
20%
6%*
32%
23%
5%*
18%
23%
27%
37%
g f
Males
Females
Whites
Below 100% FPL
100%-200% FPL
Above 200% FPL
African$
Americans
Latinos
Asians
18–29 Years
30–39 Years
40-49 Years
50 Years and Older
Fair Or Poor Health StatusOf Adults 18 Years And Older
Severely Overweight Adults
Health Status By Select Characteristics, 1997 South
Fig 2.17c Fig 2.17d• For a family of four, the 1997 federal poverty level is $16,050 a year and 200% of poverty is
$32,100.• Weight status is determined on body mass index (BMI). BMI is calculated using the weight
and height of the respondent. Mildly to moderately overweight corresponds to a BMI equal toor greater than 25 but less but less than 30. Severely overweight corresponds to a BMI equal toor greater than 30.
0 20 40 60 80
37%
31%
32%
g f
Fair/Poor
Very Good/$
Excellent
Good0 20 40 60 80
25%
36%
39%
g f
Not$
Overweight
Severely$
Overweight
Mild/Moderate$
Overweight
Self-Perceived Health Status Weight Status
Fig 2.17a Fig 2.17b
SPA6
27
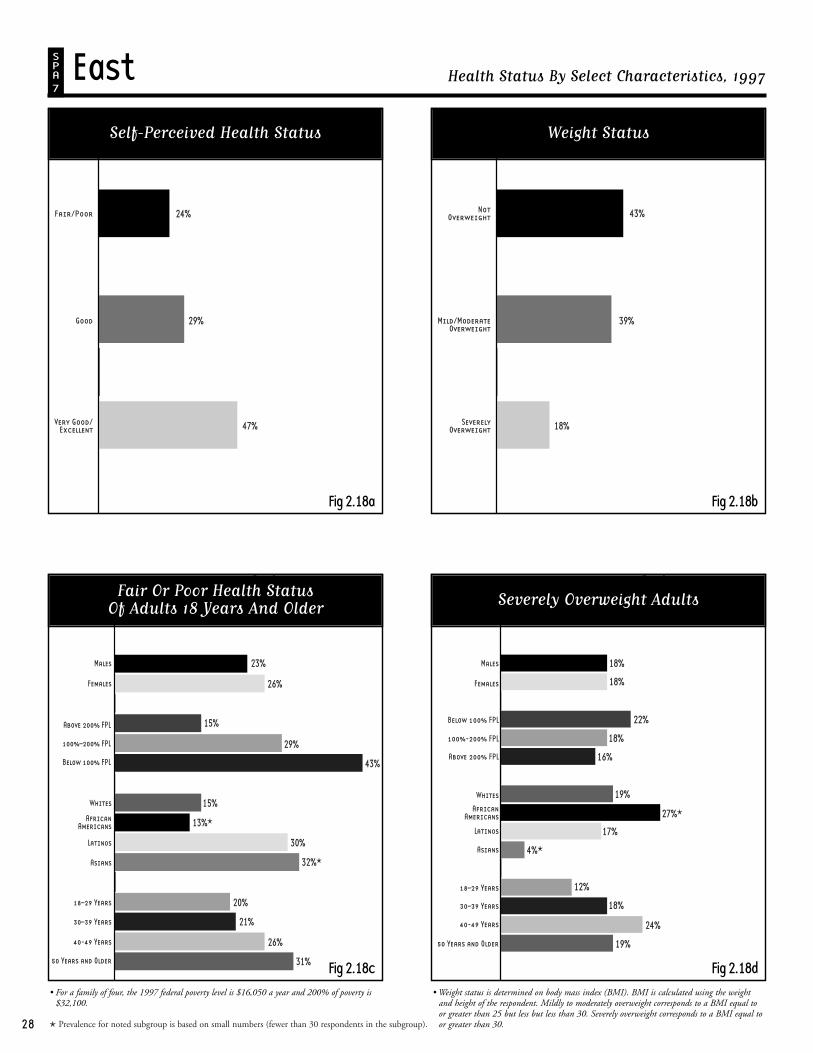
* Prevalence for noted subgroup is based on small numbers (fewer than 30 respondents in the subgroup).
0 10 20 30 40
23%
26%
15%
29%
43%
15%
13%*
30%
32%*
20%
21%
26%
31%
g f
Males
Females
Whites
African$
Americans
Latinos
Asians
18–29 Years
30–39 Years
40-49 Years
50 Years and Older
Above 200% FPL
100%–200% FPL
Below 100% FPL
0 10 20 30 40
18%
18%
22%
18%
16%
19%
27%*
17%
4%*
12%
18%
24%
19%
g f
Males
Females
Whites
Below 100% FPL
100%-200% FPL
Above 200% FPL
African$
Americans
Latinos
Asians
18–29 Years
30–39 Years
40-49 Years
50 Years and Older
Fair Or Poor Health StatusOf Adults 18 Years And Older
Severely Overweight Adults
Health Status By Select Characteristics, 1997East
Fig 2.18c Fig 2.18d• For a family of four, the 1997 federal poverty level is $16,050 a year and 200% of poverty is
$32,100.• Weight status is determined on body mass index (BMI). BMI is calculated using the weight
and height of the respondent. Mildly to moderately overweight corresponds to a BMI equal toor greater than 25 but less but less than 30. Severely overweight corresponds to a BMI equal toor greater than 30.
0 20 40 60 80
47%
29%
24%
g f
Fair/Poor
Very Good/$
Excellent
Good0 20 40 60 80
18%
39%
43%
g f
Not$
Overweight
Severely$
Overweight
Mild/Moderate$
Overweight
Self-Perceived Health Status Weight Status
Fig 2.18a Fig 2.18b
SPA7
28

* Prevalence for noted subgroup is based on small numbers (fewer than 30 respondents in the subgroup).
0 10 20 30 40
15%
21%
12%
25%
38%
12%
18%
26%
22%*
12%
18%
26%
22%
g f
Males
Females
Whites
African$
Americans
Latinos
Asians
18–29 Years
30–39 Years
40-49 Years
50 Years and Older
Above 200% FPL
100%–200% FPL
Below 100% FPL
0 10 20 30 40
13%
13%
16%
16%
12%
12%
18%
15%
4%*
11%
13%
15%
15%
g f
Males
Females
Whites
Below 100% FPL
100%-200% FPL
Above 200% FPL
African$
Americans
Latinos
Asians
18–29 Years
30–39 Years
40-49 Years
50 Years and Older
Fair Or Poor Health StatusOf Adults 18 Years And Older
Severely Overweight Adults
Health Status By Select Characteristics, 1997 South Bay
Fig 2.19c Fig 2.19d• For a family of four, the 1997 federal poverty level is $16,050 a year and 200% of poverty is
$32,100.• Weight status is determined on body mass index (BMI). BMI is calculated using the weight
and height of the respondent. Mildly to moderately overweight corresponds to a BMI equal toor greater than 25 but less but less than 30. Severely overweight corresponds to a BMI equal toor greater than 30.
0 20 40 60 80
56%
26%
18%
g f
Fair/Poor
Very Good/$
Excellent
Good0 20 40 60 80
13%
35%
52%
g f
Not$
Overweight
Severely$
Overweight
Mild/Moderate$
Overweight
Self-Perceived Health Status Weight Status
Fig 2.19a Fig 2.19b
SPA8
29

30


![Synthesis of Novel Electrically Conducting Polymers: Potential ... · PPh3 + Br(CH2). CO2Me ..... > [Ph3P--CH2(CH2). i CO2Me]*Br* [phaP--CH2(CH2)n__CO2Mel*Br -Z--BuL>_phaP=CH (C H2)n_i](https://static.fdocuments.us/doc/165x107/5ebc39ab077be8135d1c1d2a/synthesis-of-novel-electrically-conducting-polymers-potential-pph3-brch2.jpg)