l A-±3491 AN ELECTROCHEMICAL AND RAMAN ... · STIS DTIC GRA&I W4 TAB JusI r1oti0. Distributlon/ I...
35
A-±3491 AN ELECTROCHEMICAL AND RAMAN SPECTROELECTROCHEMICAL l " INVESTIGATION OF UNDE.. (U) UTAH UNIY SALT LAKE CITY DEPT OF CHEMISTRY S PONS ET AL. 39 JUL 86 TR-79 UNCLRSSIjF M4-6-K-47 9 3 4 FIG 7/2 NL EIhmhhhh
Transcript of l A-±3491 AN ELECTROCHEMICAL AND RAMAN ... · STIS DTIC GRA&I W4 TAB JusI r1oti0. Distributlon/ I...

A-±3491 AN ELECTROCHEMICAL AND RAMAN SPECTROELECTROCHEMICAL
l "
INVESTIGATION OF UNDE.. (U) UTAH UNIY SALT LAKE CITYDEPT OF CHEMISTRY S PONS ET AL. 39 JUL 86 TR-79
UNCLRSSIjF M4-6-K-47 9 3 4 FIG 7/2 NL
EIhmhhhh

*11~ US
asii I., * dmgI'll'I11111 1. 6
-,,y 'C(g""PI TEST CHART
MAVOt.AL 9UREAU OF STAP6CANg 1*63 7 A
Nf
pZ

OFFICE OF NAVAL RESEARCH
Contract N00014-83-K-0470-PO0003
Task No. NR 359-718
0TECHNICAL REPORT # 79
An Electrochemical and Raman Spectroelectrochemical Investigationof Underpotentially Deposited Silver on a Gold Substrate
By
Stanley Pons. J. Li, J. Liang
DTICS ELECTE
APR 14 41988
Prepared for Publication in AP 4
Langmuir
University of UtahDepartment of Chemistry
Salt Lake City, Utah 84112
July 30, 1986
Reproduction in whole or In part is permitted forany purpose of the United States Government.
This document has been approved for public releaseand sale; its distribution is unlimited.
j48

SECU04111 CLASSIrICA10O% OF TH4IS PAt (w'.t. t,..preperf
REPORT DOCUMENTATION PAGE RA U*RC1N__
!. !0iAT NU~bitm 2. GOVT ACCCSSIONd 14U. 3. i4CCipIa.ti rs CATALOG. PiumnRi -
4. ITL (sa~utfie) . TYPE Of REPORT a PCI3ioo covEuiv
Investigation of Underpotentially Deposited Silveri Technical Report# .7
on a Gold Substrate 6. PERFOR.%41NG ORG. REPOAT HU*ABE
7. AUTiqOiMg) D. CONTREACT OA1 GRANT HU-M6LflC.)
Stanley Pons. J. Li, J. Liang 14OO0l4-83-K-O47O-POQO3
9. PE11F~cIMINGORGANIZATIO4. ?4AmE AND 0.0DRESS 10. PROL.AUk ELCMENT. PROJECT. TASKAREA 6, wOv4K UNIT NUMetERS
University of UtahDepartment of Chemistry Task No.- ,NR 359-718Salt Lake City,_UT_ 84112
It. coNiTROLLING OFFiCE HAMt AND ADDRESS 22. REPORT DATE
Office of Naval Research ...Jul 30O1986Chemistry Program - Chemistry Code 472 is. bU.ABsfl OF PAGES
Arlington, Viroinia 22217 ti, ~ oiii. i. CRT LS.(S'l ~o14. MO)NITORING AGEN~CY NAME A AoORESSf,1 ajit.,..nt IIncass Cotolnffi)1% EU IedAS o #i eot
IS. DECLASIICATOP&IOW-.SRAOiNG
SCmEOVLE
16. CiS*7riaurTION STATEMENT (of thin Report)
'This document has been approved for public release and sale; its distributionunlimi ted.
17. DISTRIBUTION STATEMENT (at the obstroct .flt..d in DSoCA 20. It dliimproI train Report)
IS. SUPPLEMENTARY NOTES
It. KEY WORDS (Conotn... a- reverse side It neco...ry and identity by block n- brv)
IR spectroelectrochemistry
20. A91TRACT (Conlrnwe oA reverse &Ode 11 n@essry and identity by block nua~br)
Electrochemical and spectroelectrochemical data indicate that underpotentially* deposited silver adatoms on gold substrates are photolyzed to form silver meta
clusters.
*DD 1473 EDITION Of I IIDV 9 IS ORISOLETrEr
AN ELECTROCHEMICAL AND RANAN SPECTRODELECTROCHENICALINVESTIGATION OF UNDERPOTENTIALLY DEPOSITED SILVER ON
A GOLD SUBSTRATE
Jianguo Li, Jim Liang. and Stanley Pons*
Department of ChemistryThe University of Utah
Salt Lake City, UT, 84112
*To whom correspondence should be addressed.

ABSTRACT
Electrochemical and spectroelectrochemical data indicate thatunderpotentially deposited silver adatoms on gold substrates are photolyzed toform silver metal clusters. The surface gold-gold stretch and gold-silverstretch bands are observed, as well as the surface chloride complex stretch. Thechloride complex interacts with ions in the solution phase giving rise to shiftsin the metal-chloride stretching vibrational frequency as a function of theapplied electrode potential. However, the metal-metal bands are more dependenton the electric field at the electrode surface.
Aooession For
STIS GRA&I W4DTIC TAB
JusI r1oti0.
Distributlon/
I ailability Codj
jvail &n4/or1ps Special

INTRODUCTION
The study of the interaction of adsorbates and surface complexes with
the electric field at the electrode surface and with the solvent/ electrolyte in
-the electrical double layer is central to the understanding of the structure and
character of the electrode solution interface. In situ spectroelectrochemical
techniques coupled to conventional electrochemical methods provide much
information about the structure and energetics of this interface. Surface
infrared and surface enhanced Raman studies are now well established techniques
in those Investigations. Many workers now feel that the nature of the SERS
phenomenon does not cloud the chemical interpretation of the spectra, at least to
a first approximation; DSERS (diminished surface enhanced Raman scattering) and
SUERS (surface unenhanced Raman scattering) apparently yield the same results (in
terms of frequency and relative intensities) as does SERS; the major differences
being simply the decreased intensities these latter techniques. It is also
important to now compare directly the results of Raman and surface infrared
spectroscopy, since the two methods are governed by different sets of selection
rules, and must therefore provide complementary information of the vibrational
structure of the interfacial region.
Studies of surface interactions are facilitated when the surface
coverage of the adsorbate is carefully controlled. One way to accomplish this is
the relatively simple technique of underpotentlal deposition of a metal on the
electrode surface. On commonly studied system is silver underpotential
deposition on gold substrates. In this work. we investigate the effects of
surface pretreatment on the adsorption of. and the role of the photolytic
excitation frequency on the surface chemistry of silver adatoms on gold.
2
EXPERIMENTAL
Silver nitrate (certified reagent) and perchloric acid (70% reagent)
were obtained from Fisher Scientific and were used as received. Potassium
chloride (AR, Mallinckrodt) and acetonitrile (HPLC Distilled in Glass. Burdick
and Jackson) were used as received. Lithium perchlorate (anhydrous reagent.
Aldrich Chemical) was dried in vacuo at 150°C for 24 hours, and stored in vacuo
prior to use. Water was triply distilled.
The reference electrode for the experiments in acetonitrile was a
silver/ silver ion type (O.01M silver nitrate and 0.10M tetrabutylammonium
fluoroborate In acetonitrile). It was isolated from the working solution by a
compartment which was terminated by a Luggin capillary tip which was located
close to the working electrode. The reference electrode for the measurements in
aqueous solution was a standard calomel (SCE) type which was similarly isolated.
A 3.5mm diameter gold disk electrode was used for all electrochemical
measurements, and a 10mm gold disk was used for all spectroelectrochemical
experiments. The electrodes were mounted in a Teflon housing. The
electrochemical cell was a three compartment type designed such that all three
electrodes were isolated. The spectroelectrochemical cell was of a type standard
for reflection SERS or ref]ection infrared measurements. The position of the
electrode with respect to the optical window or the Luggin capillary could be
adjusted. The cells were cleaned in boiling sulfuric/ nitric acid, rinsed, and
steamed with boiling triply distilled water before use.
The gold electrodes were mechanically polished successively with 1.0-.
0.3-, and 0.05 um alumina on a balsa wood base to a mirror finish. They were
then cleaned In an ultrasonic bath containing triply distilled water. Prior to

3
some measurements, the electrodes were then activated, by cycling them in an
aqueous solution of IM potassium perchlorate from -1.0 to + .1V vs. SCE. The
electrodes were electrochemically roughened in some experiments by the method of
Gao et al (1) by voltammetry for 30 cycles from -0.1 to +1.1 V vs. SCE in a
solution of 0.iM potassium chloride at 100 mV s- 1 potential sweep rate. After
this roughening treatment, the surface had a matte, nonuniform brownish
appearance. The electrodes were finally rinsed with triply distilled water (and
dried in a vacuum oven prior to use in the anhydrous acetonitrile solutions).
When making spectroelectrochemical measurements, the cell was fitted
with a quartz window. The cell was mounted on a three dimensional and two
rotational micromanipulator stages. The laser incidence angle could be varied.
and the laser spot could be scanned across the electrode surface. The incidence
angle was maintained at 570 so that the beam reflected from the surfaces of the
cell window and the electrode surface could be excluded from the spectrometer
collection optics.
The Raman system for the surface enhanced scattering experiments
consisted of a Spex 1401 double monochromator. The instrument had an 1800 lines
mm- holographic gratings. The spectrometer and detector were interfaced to a
Nicolet 1180 computer system for spectrometer control, data acquisition.
analysis, and graphic plotting. Laser excitation was provided by a Coherent
Radiation Innova 90 krypton ion laser, and a Spectra Physics 165 argon ion laser.
In this work, the excitation wavelengths used were 647.1, 568.2. 514.5, and 488.0
nm. Laser power was typically between 60 and 140 mW. The spectral bandpasses
were 4cm ~ 1 for the 647.1 and 568.2 nm excitations and 5cm-* for the 514.5 and
488.0 nm excitations. Detection was by a Ga-As photocathode C31034
photomultiplier tube which was cooled by a thermoelectric refrigerator (Products

4
for Research, Inc.). Scatter ng data was acquir.-I at 2cm -' intervals with a 0.5s
integration interval. Spectra were finally obtained b recovery from the
computer. The spectrometer was calibrated with carbon tetrachloride using the
647.1 and 568.2 nm excitation wavelengths. There were less than Icm- , errors at
each excitation for the characteristic bands for carbon tetrachloride.
RESULTS AND DISCUSSION
The activated smooth and rouzhened fold electrode surface.
The electrochemical behavior of the roughened gold surface is very
similar to that of the activated, smoothly polished gold surface, although its
appearance is different in terms of color and reflectivity. Comparisons of the
cyclic voltammetry and differential capacity curves measured in aqueous 0.1M
potassium chloride and IN perchloric acid, and IN lithium perchiorate
acetonitrile solution show no significant differences for each electrode. The
roughness factors are also apparently similar from estimates made from the
differential capacitance data. As we shall see, however, the SERS intensity from
on the roughened gold surface is 3-5 times larger than on the polished mirror
surface.
Silver underpotential deposition on gold from aqueous solution
The cyclic voltammetry for silver underpotential deposition on a polished gold
electrode from a 0.02M silver nitrate solution in IM perchloric acid (Figure 1)
is similar to those reported by Schmidt and Stuki for silver underpotential
"

.LlI1J V V WMW
5
deposition from a 2.6 x 1O-SM silver ion solution in 0.5M sulfuric acid [2] and
by Lorenz et al [3] for silver underpotential deposition from 3.2 x 1O-4M silver
nitrate in 1M perchloric acid. Lorenz reported two deposition peaks at 0.83 and
1.2V vs. the SCE, with a bulk deposition potential at 0.578V. In this work, the
underpotential deposition peak was observed at 0.67V, and the stripping peak at
0.69V. The underpotential deposition current and the stripping current are
proportional to the voltammetric potential sweep rate. The bulk silver
deposition potential was observed to begin at 0.55V. On an anodic sweep. a wave
is observed starting at +0.95V due to oxidation of the gold surface. For
comparison, all of the experiments were run in the absence of silver ion. No
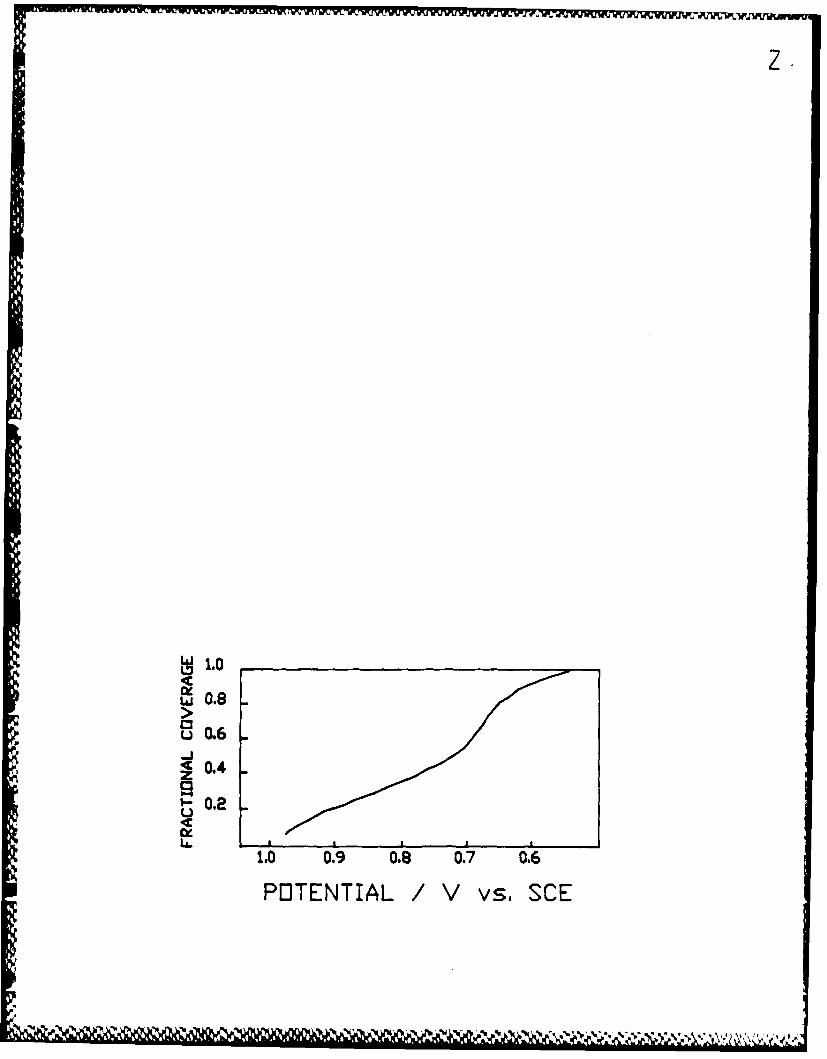
peaks were observed over the same range of potentials. The deposition isotherm
(Figure 2) shows a dip at around 0.7V. The charge under the underpotential
deposition peaks corresponds to 235 UC/cM 2 at 100% monolayer coverage. Results
for the roughened gold surface were virtually identical.
Results of the Raman experiments in the aqueous system
Roughened gold electrodes with underpotentially deposited silver
Red (647.1 nm) excitation
The Raman scattering was measured on the gold electrode system in the
absence of and in the presence of silver ion (Figure 3). In the absence of
silver ion, bands were observed at 165 and 245cm-. When silver adatoms had been
underpotentially deposited onto the gold electrode, an additional band was
observed at 90cm - . The band could be resolved from the background scattering
when the electrode potentials were made more negative than about 0.9V. The band.
once resolved, has a virtually constant magnitude as the potential is made more

6
negative. The intensity of and the frequency of the band at 165cm -' was
independent of the electrode potential. This band is also observed on the dry
activated smooth or roughened gold electrode measured ex situ to the cell. The
band at 245cm-1 is dependent on the electrode potential (Figure 4).
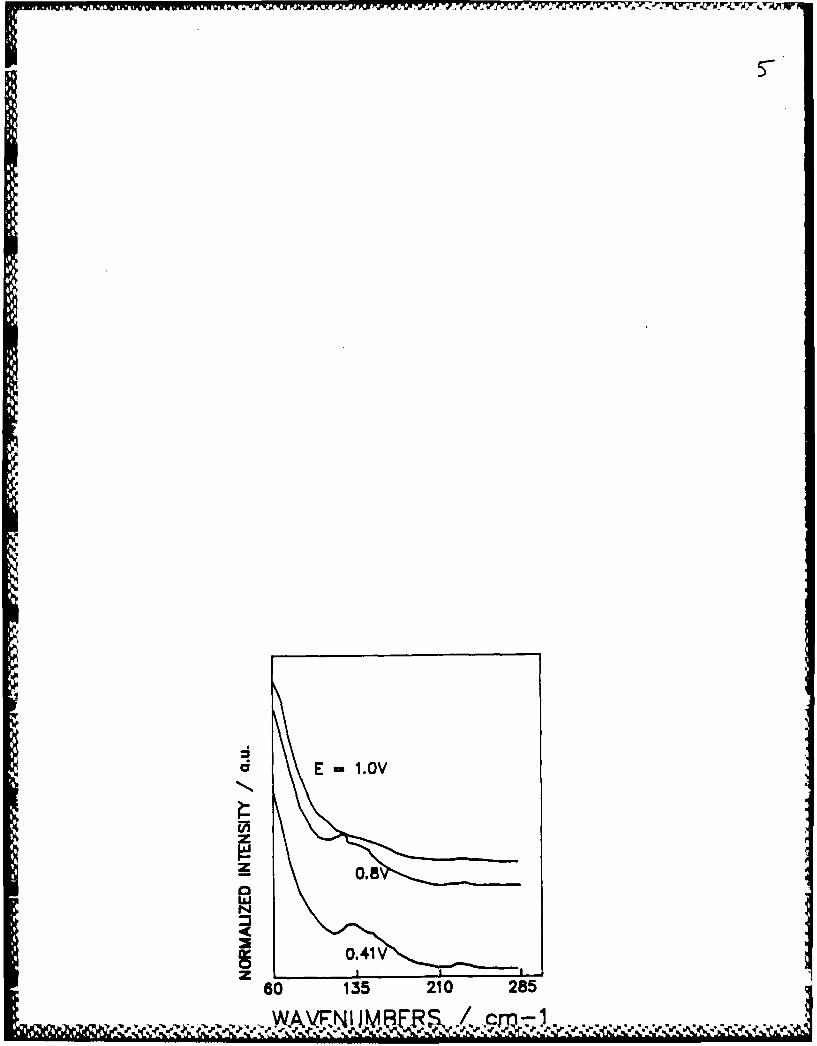
Yellow (568.2 nm) excitation
When in potential regions where silver deposition occurs, a band at
128cm- 1 is observed in solutions containing silver ion (Figure 5). This band
cannot be detected if silver ion is absent. Compared to the result with the
647.1nm excitation, the intensity of' the Au-Cl stretch band is very small. A
band at 233cm- can also be detected with this excitation at the electrode in
both solutions containing and not containing silver. In addition, this band is
present at the dry roughened gold surface, but not at the dry polished gold
surface.
Green (514.5nm) and blue (488nm) excitations
A very broad weak band at about 185cm-:, which is likely scattered
light from the window, Is observed with the 514.4nm excitation on the electrodes.
No bands at all are observed from the electrodes with 488nm excitation.
Raman results for silver underpotentially deposited on the activated Smooth gold
electrodes
The results for the visibly smooth gold electrode were essentialiy identical to
7
those for the roughened surface, except that the scattering Intensities were at
least an order of magnitude smaller.
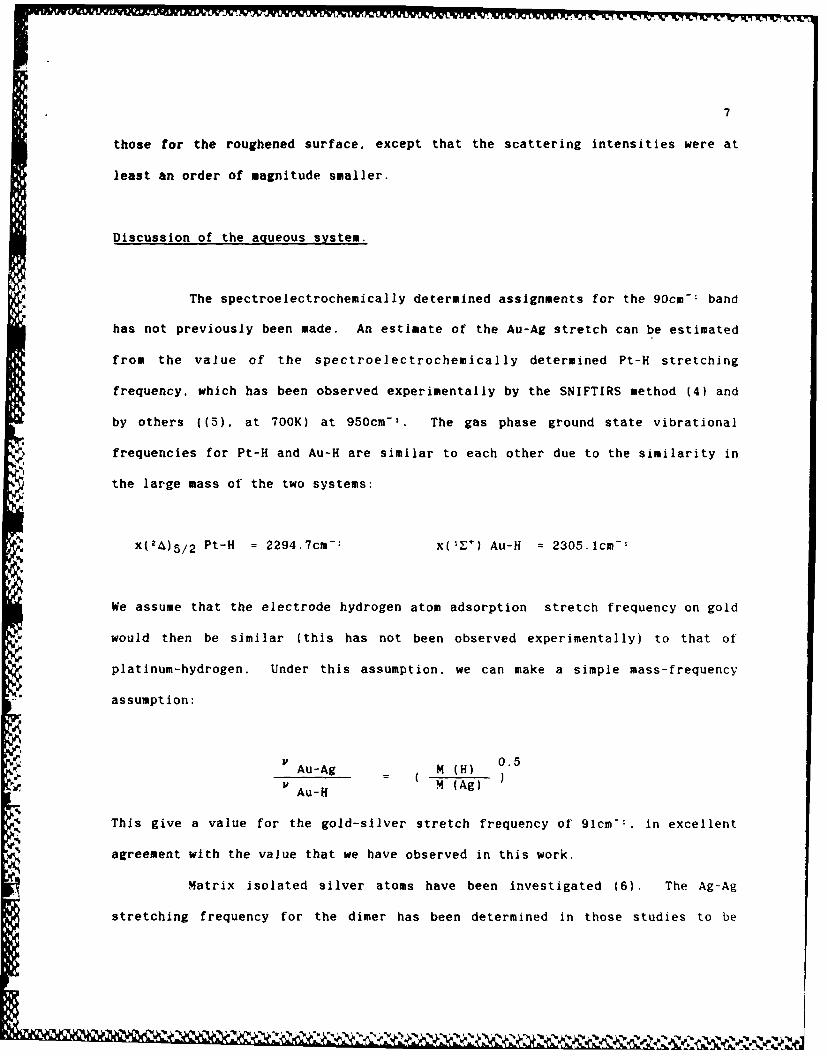
Discussion of the aqueous system.
The spectroelectrochemically determined assignments for the 90cm-: band
has not previously been made. An estimate of the Au-Ag stretch can be estimated
from the value of the spectroelectrochemically determined Pt-H stretching
frequency, which has been observed experimentally by the SNIFTIRS method (4) and
by others ((5), at 700K) at 950cm - . The gas phase ground state vibrational
frequencies for Pt-H and Au-H are similar to each other due to the similarity in
the large mass of the two systems:
X(2 4) 5 /2 Pt-H = 2294.7cm-1 x(1V*) Au-H = 2305.1cm -
We assume that the electrode hydrogen atom adsorption stretch frequency on gold
would then be similar (this has not been observed experimentally) to that of
platinum-hydrogen. Under this assumption, we can make a simple mass-frequency
assumption:
PAu-Ag = M (H) 0.5
Y Au-H M (Ag)
This give a value for the gold-silver stretch frequency of 9lcm-1. in excellent
agreement with the value that we have observed in this work.
Matrix isolated silver atoms have been investigated (6). The Ag-Ag
stretching frequency for the dimer has been determined in those studies to be
8
194cm -1 . We ha%-. not been able to observe this band in this work. presumably
because it is most likely buried beneath the strong Au-Au 165cm -' band. Bulk Ag-
Ag phase would be very close to the Au-Au band; gas phase metal stretch
frequencies for gold and silver are 200 and 198cm -1 respectively.
We have previously observed (7) that a 145cm -' band is due to the
surface atom Au-Au stretch. In that work the system was investigated using the
SNIFTIRS infrared spectroelectrochemical method. The observed potential
dependency of that band in both experiments is similar. The two experiments
differed in the respect that the infrared work was performed in non-aqueous
conditions in a potential region some 2V more negative. In the previous work, it
was observed that the intensity of the Au-Au band decreased in magnitude as
lithium was deposited on the surface of the gold. Silver deposition on gold in
the Raman experiment did not show such a marked decrease in intensity: this
effect has been observed many times in surface Raman experiments. We conclude
that the band at 165cm - ' reported in this work is of the same origin.
The Au-Cl stretch band was reported by Gao et al (1) to be centered
265cm-. The SERS electrodes in this work were roughened in KCI solution, anu
then returned to perchlorate solutions for the underpotential deposition
solutions. We have undoubtedly transferred the gold-chloride complex to the
Raman cell in this operation. The interaction of specifically adsorbed hydrogen
cation with the surface chloride would be expected to decrease the vibrational
frequency of the surface complex by decreasing the local electron density of the
Au-CI bond. The 245cm - 1 band observed in this work is also seen in chloride
solutions containing no perchlorate. The roughened SERS gold electrode in
potassium chloride solution showed a band at 25Ocm-; we assign the 245cm-1 band
to be the Au-Cl surface complex stretch mode.
r I 4 p
9
The intensity of the 245cm -' band was observed to decrease as
underpotential deposition of silver was in progress. This observation is in
agreement with the data of Guy et al (8) who observed a decrease in the Raman
intensity as Pb was underpotentlally deposited on silver, and Kester (9) who
observed a similar result when depositing thallium on silver.
The bands observed with red excitation, eg 165 and 245cm - 1 cannot be clearly
detected with excitation radiation of shorter wavelengths due to the absorption
of the excitation radiation by the gold electrode (10). Reflectance data show
that the onset of absorbance by gold is at 2.1eV (590nm). SERS data (11) show
that the Raman scattering intensity from pure gold under 514.5 and 488nm
excitations are very small. It is therefore reasonable to assume that we could
not detect the surface complexes easily with the short wavelength excitations.
The band at 128cm- 1 results most likely from the photolysis of silver
adatoms on the gold surface. Takamura (11) has previously reported degradation
of the electroreflectance signal for deposits of silver on gold. Silver atom
aggregation initiated by photolysis has been reported in other experiments
(6,12). It is possible that silver adatoms on the gold surface aggregate under
the yellow light illumination to Agn . with n>2.

10
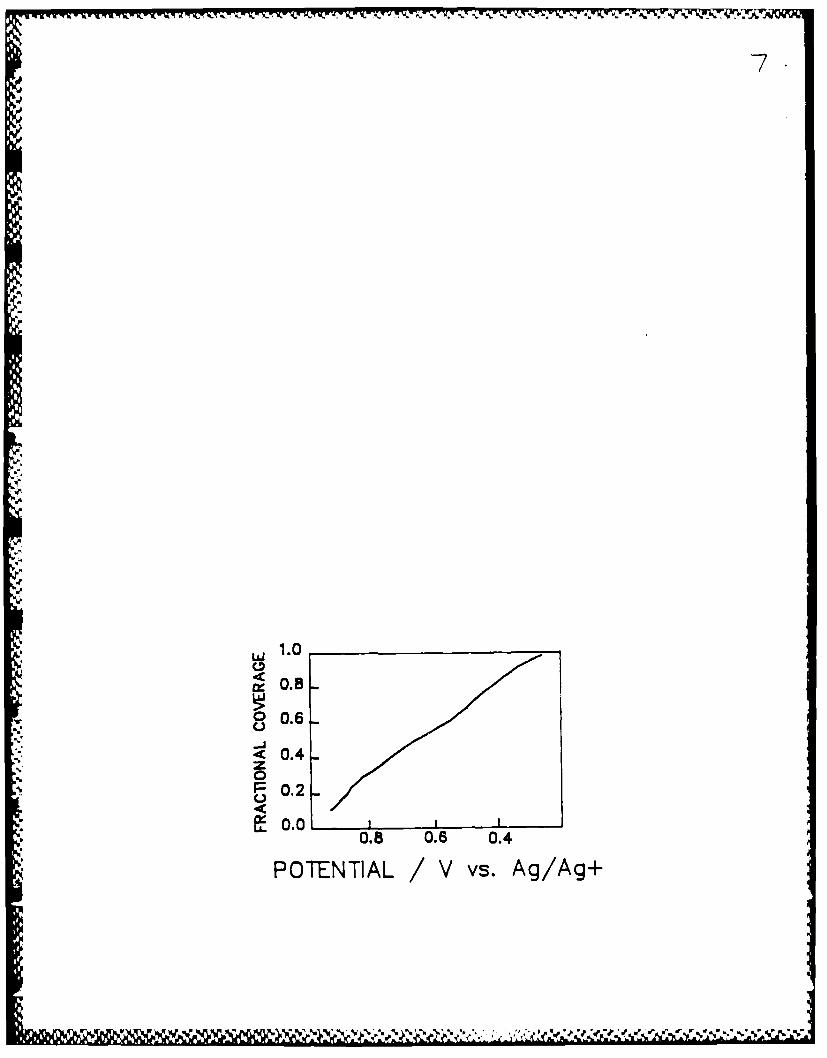
Silver underpotential deposition on gold from acetonitrile solutions
The cyclic voltammetry for a gold electrode in 0.O1M silver nitrate and
IM lithium perchlorate in acetonitrile solution shows three cathodic peaks (0.59.
*i 0.42. and 0.22V vs the silver/silver ion reference), and on the reverse sweep.
four anodic peaks (0.25. 0.42, 0.60. and 0.7oV. Figure 6). The peak currents of
all of these peaks are proportional to the sweep rate indicating adsorptioni
desorption phenomena. Kolb et al (13] have reported the underpotential
deposition of silver adatoms on gold. but did not publish the voltammetry or the
adsorption isotherms. We observe that the isotherm for silver underpotential
deposition on gold from acetonitrile is approximately linear with the electrode
potential (Figure 7). The charge at full coverage is 200aC cm-2 . The
underpotential deposition characteristics of the roughened gold electrode are
virtually identical to the activated smooth gold electrode.
Results of the Raman experiments in the acetonitrile system
The surface enhanced Raman scattering spectra were recorded for the
activated smooth and roughened gold electrodes as a function of laser excitation
frequency and electrode potential. The spectra were again recorded in the
presence of and in the absence of silver. The results for both electrodes were
the same as those In the aqueous solutions (vide supra), except that the 245cm-
band (Au-Cl) on the roughened electrode was much weaker and was not significantly
dependent on the magnitude the electrode potential. The silver cluster band
& (128cm -1) is resolved from Au-Au stretch band (165cm-1). Again. the 165cm-:
band is most likely buried in the tail of the 128 and 135cm-1 bands.
~ - A '

Discussion of the acetonitrile system
The results imply that the chemistry and energetics of the surface adatoms is
essentially the same in both solvent systems. The interactions of ions and
solvent molecules in the electrical double layer with the adatoms are thus
probably small, and the shift in frequency of the metal Au-Ag stretch is most
likely due to a field effect. The Au-Cl stretch, however, is not observed to
shift with potential in the acetonitrile solvent as it does in the aqueous
system. This is the expected result if the shift were due to a chemical effect
involving the activity of hydrogen in the electrical double layer. In fact, the
double layer in this solvent is known to be diffuse (14). so that the activity of
the perchlorate at the plane of the chloride complex will be smaller than it is
in the aqueous solution.
I!

AMWVU~rvw )V
12
ACKNOWLEDGEMENTS
The authors thank the Office of Naval Research for support of this
work.

13
REFERENCES1. P. Gao. M.L. Patterson. M.A. Tadayzoni, and N.J. Weaver. Langnuir. 1. 173
(1985).
2. E. Schmidt and S. Stucki. J. Electroanal. Chem. 39. 63 (1972).
3. W.J. Lorenz, I. Mountzls, and E. Schmidt, J. Electroanal. Chem. 33. 121(1971).
4. J. Li and S. Pons, unpublished results.
5. J.P. Candy, P. Fouilloux, and N. Primet. Surface Science 72, 167 (1978).
6. W. Schultz .H.U. Becker. R. Minkwitz. and K. Manzel. Chem. Phys.. Lett. 55,59 (1978).
7. 3. Li. M.D. Morse. J.J. Smith, 3. Daschbach, and S. Pons, J. Electroanal.CHem.. in press.
8. A.L. Guy. B. Bergami, and J.E. Pemberton, Surface Science 150. 226 (1985).
9. J.J. Kester. J.Chem. Phys. 78, 7466 (1983).
10. J. Feinlab, Phys. Rev. Lett.. 16. 1200 (1966). T. Takamura. K. Takamura. W.Nippe. and E. Yeager, J. Electrochem. Soc.. 117. 626 (1970).
11. T. Takamura and Y. Sato. J. Electroanal. Chem., 47. 245 (1973).
12. S.A. Mitchell and G.O. Ozin. J. Phys. Chem., 88, 1425. (1984); M.D. Baker.G.A. Ozin. and J. Godber. J. Phys. Chem. 89, 305, (1985).
13. D.M. Kolb, N. Przasnyskl. and H. Gerlscher, J. Electroanal. Chem. 54. 25(1974).
14. 0.A. Petrii and 1.G. Khomchenko, J. Electroanal. Chem. 106. 277 (1980).
I
14
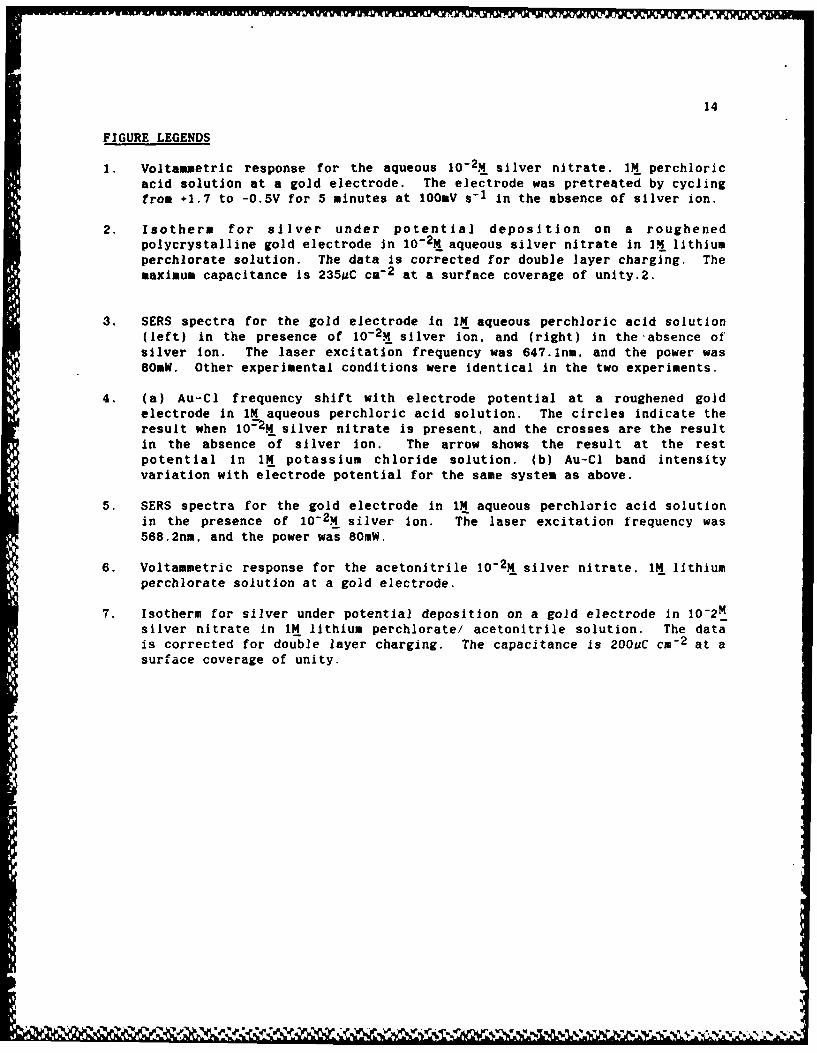
FIGURE LEGENDS
1. Voltammetric response for the aqueous 10-2M silver nitrate. IN perchloric
acid solution at a gold electrode. The electrode was pretreated by cyclingfrom +1.7 to -O.5V for 5 minutes at 1OOmV s- 1 In the absence of silver ion.
2. Isotherm for silver under potential deposition on a roughenedpolycrystalline gold electrode in 10-2M aqueous silver nitrate in IN lithium
perchlorate solution. The data Is corrected for double layer charging. Themaximum capacitance is 235aC cg- 2 at a surface coverage of unity.2.
3. SERS spectra for the gold electrode in IN aqueous perchloric acid solution(left) in the presence of 10-2M silver ion. and (right) in the-absence of
silver Ion. The laser excitation frequency was 647.1nm. and the power was80mW. Other experimental conditions were identical In the two experiments.
4. (a) Au-Cl frequency shift with electrode potential at a roughened gold
electrode In 1N aqueous perchloric acid solution. The circles indicate theresult when 10= 2M silver nitrate is present, and the crosses are the resultIn the absence of silver ion. The arrow shows the result at the restpotential In 1N potassium chloride solution. (b) Au-Cl band intensityvariation with electrode potential for the same system as above.
5. SERS spectra for the gold electrode in 1N aqueous perchloric acid solution
in the presence of 10-2M silver Ion. The laser excitation frequency was568.2nm. and the power was 80mW.
6. Voltammetric response for the acetonitrile 10-2M silver nitrate. 1N lithiumperchlorate solution at a gold electrode.
7. Isotherm for silver under potential deposition on a gold electrode in 10-2 M
silver nitrate in 1N lithium perchlorate/ acetonitrile solution. The datais corrected for double layer charging. The capacitance is 200uC cm -2 at a
surface coverage of unity.
. ..

IluA
Z 10 mV s-iLU 20
304050
0.5 0.6 0.7 0.5 0.9 1.0
POTENTIAL /V
1.0
LJ0.8
u .6
0.4z'-0.2
L&.
1.0 0.9 0.8 0.7 0.6
POTENTIAL /V vs. SCE

z
z
Z s013 210 285 135 210 285z
WAVENUMBERS /cm-i

270-
260-
0
250- 0x x0
240-
1.0 0l8 0.6 0.4 0.2
E/ V vs. SCE

1.0 0 0 000
0.8NO SILVER PRESENT
0.6 00
>- 0,4
..
:1:
0 .6.
" 0.6 0
0.4 0.01M SILVER ION 0
0
0.2.
0.0 - ,1.0 0.8 0.6 0.4 0.2
E / V vs. SCE
zz OI
0.1
z60 135 210 285

20.
x: 3040
0.0 0.2 0.4 0.6
POTENTIAL /V
1.0
0.2.0.0
"000.8 0.6 0.4
POTENTIAL V vs. Ag/Ag+
/'V W ~S'** . ~ ~ s ~ I %
DL/413/83/01
GEN/413-2
TECHNICAL REPORT DISTRIBUTION LIST, GEN
No. No.Copies Ccoies
Office of Naval Research 2 Dr. David YoungAttn: Code 413 Code 334800 N. Quincy Street NORDAArlington, Virginia 22217 NSTL, Mississippi 39529
Dr. Bernard Douda 1 Naval Weapons CenterNaval Weapons Support Center Attn: Dr. Ron AtkinsCode 5042 Chemistry DivisionCrane, Indiana 47522 China Lake, California 93555
Commander, Naval Air Systems 1 Scientific AdvisorComnand Commandant of the Marine Corps
Attn: Code 310C (H. Rosenwasser) Code RD-iWashington, D.C. 20360 Washington, D.C. 20380
Naval Civil Engineering Laboratory 1 U.S. Army Research OfficeAttn: Dr. R. W. Drisko Attn: CRD-AA-IPPort Hueneme, California 93401 P.O. Box 12211
Research Triangle Park, NJC 77C
Defense Technical Information Center 12 Mr. John BoyleBuilding 5, Caneron Station Materials BranchAlexandria, Virginia 22314 Naval Ship Engineering Center
Philadelphia, Pennsylvania 19712
DTNSRDC 1 Naval Ocean Systes CenterAttn: Dr. G. Bosmajian Attn: Dr. S. YamamotoApplied Chemistry Division Marine Sciences DivisionAnnapolis, Maryland 21401 San Diego, California 91232
Dr. William TollesSuperintendent 1Chemistry Division, Ccde 6100" Naval Research Laboratory
Washington, D.C. 20375
Is

OL/413/83/01
359/413-2
ABSTRACTS DISTRIBUTION LIST, 359/627
Dr. Paul Delahay Dr. E. YeagerDepartment of Chemistry Department of ChemistryNew York University Case Western Reserve UniversityNew York, New York 10003 Cleveland, Ohio 44106
Dr. P. J. Hendra Dr. C. E. MuellerDepartment of Chemistry The Electrochemistry BranchUniversity of Southampton Naval Surface Weapons CenterSouthampton S09 5NH White Oak LaboratoryUnited Kingdom Silver Spring, Maryland 20910
Dr. J. Driscoll Dr. Sam PeroneLockheed Palo Alto Research Chemistry & Materials
Laboratory Science Department3251 Hanover Street Lawrence Livermore National LaboratoryPalo Alto, California 94304 Livermore, California 94550
Dr. 0. N. Bennion Dr. Royce W. MurrayDepartment of Chemical Engineering Department of ChemistryBrigham Young University University of North CarolinaProvo, Utah 84602 Chapel Hill, North Carolina 27514
Dr. R. A. Marcus Dr. B. BrummerDepartment of Chemistry EIC IncorporatedCalifornia Institute of Technology 111 Downey StreetPasadena, California 91125 Norwood, Massachusetts 02062
Dr. J. J. Auborn Dr. Adam HellerBell Laboratories Bell LaboratoriesMurray Hill, New Jersey 07974 Murray Hill, New Jersey 07974
Dr. Joseph Singer, Code 302-1 Dr. A. B. EllisNASA-Lewis Chemistry Department21000 Brookpark Road University of WisconsinCleveland, Ohio 44135 Madison, Wisconsin 53706
Dr. P. P. Schmidt LibraryDepartment of Chemistry Duracell, Inc.Oakland University Burlington, Massachusetts 01803Rochester, Michigan 48063
Dr. Manfred Breiter Electrochimica CorporationInstitut fur Technische Elektrochemie 20 Kelly CourtTechnischen Universitat Wien Menlo Park, California 94025-14189 Getreidemarkt, 1160 WienAUSTRI A
'* 'V FIN

-" 0L/413/83/01
359/413-2
ABSTRACTS DISTRIBUTION LIST, 359/627
Dr. M. Wrighton Dr. M. M. NicholsonChemistry Department Electronics Research CenterMassachusetts Institute Rockwell International
of Technology 3370 Miraloma AvenueCambridge, Massachusett 02139 Anaheim, California
Dr. B. Stanle ns Dr. Michael J. WeaverDepartmen Chemistry Department of ChemistryUnive ty of Utah Purdue UniversitySa Lake City, Utah 84112 West Lafayette, Indiana 47907
Donald E. Mains Dr. R. David RauhNaval Weapons Support Center ETC Laboratories, Irc.Electrochemical Power Sources Division 1Il Downey StreetCrane, Indiana 47522 Norwood, Massachusetts 02062
S. Ruby Dr. Aaron WoldDOE (STOR) Department of ChemistryRoom 5E036 Forrestal Bldg., CE-14 Brown UniversityWashington, D.C. 20595 Providence, Rhode Island 02192
Dr. A. J. Bard Dr. Martin FleischmannDepartment of Chemistry Department of ChemistryUniversity of Texas University of SouthamptonAustin, Texas 78712 Southampton S09 5NH ENGLAND
Dr. Janet Osteryoung Dr. R. A. OsteryoungDepartment of Chemistry Department of ChemistryState University of New York State University of New YorkBuffalo, New York 14214 Buffalo, New York 14214
Dr. Donald W. Ernst Dr. John WilkesNaval Surface Weapons Center Air Force Office of ScientificCode R-33 ResearchWhite Oak Laboratory Bolling AFBSilver Spring, Maryland 20910 Washington, D.C. 20332
Mr. James R. Moden Dr. R. NowakNaval Underwater Systems Center Naval Research LaboratoryCode 3632 Code 6171Newport, Rhode Island 02840 Washington, D.C. 20375
Dr. Bernard Spielvogel Dr. 0. F. ShriverU.S. Army Research Office Department of ChemistryP.O. Box 12211 Northwestern UniversityResearch Triangle Park, NC 27709 Evanston, Illinois 60201
Dr. Aaron FletcherNaval Weapons CenterCode 3852China Lake, California 93555

DL/413/83/01359/413-2
ABSTRACTS DISTRIBUTION LIST, 359/627
Dr. Hector 0. Abruna Or. D. H. WhitmoreDepartment of Chemistry Department of Materials ScienceCornell University Northwestern UniversityIthaca, New York 14853 Evanston, Illinois 60201
Dr. A. B. P. Lever Dr. Alan BewickChemistry Department Department of ChemistryYork University The University of SouthamptonDownsview, Ontario M3J1P3 Southampton, S09 5NH ENGLAND
Dr. Stanislaw Szpak Dr. E. AndersonNaval Ocean Systems Center NAVSEA-56Z33 NC #4Code 633, Bayside 2541 Jefferson Davis HighwaySan Diego, California 95152 Arlington, Virginia 20362
Dr. Gregory Farrington Dr. Bruce DunnDepartment of Materials Science Department of Engineering &and Engineering Applied Science
University of Pennsylvania University of CaliforniaPhiladelphia, Pennsylvania 19104 Los Angeles, California 90024
M. L. Robertson Dr. Elton CairnsManager, Electrochemical Erergy & Environment Division
and Power Sources Division Lawrence Berkeley LaboratoryNaval Weapons Support Center University of CaliforniaCrane, Indiana 47522 Berkeley, California 94720
Dr. T. Marks Dr. Richard PollardDepartment of Chemistry Department of Chemical EngineeringNorthwestern University University of HoustonEvanston, Illinois 60201 Houston, Texas 77004
Dr. Micha Tomkiewicz Dr. M. PhilpottDepartment of Physics IBM CorporationBrooklyn College 5600 Cattle RoadBrooklyn, New York 11210 San Jose, California 95193
Dr. Lesser Blum Dr. Donald SandstromDepartment of Physics Boeing Aerospace Co.University of Puerto Rico P.O. Box 3999Rio Piedras, Puerto Rico 00931 Seattle, Washington 98124
Dr. Joseph Gordon, II Dr. Carl KannewurfIBM Corporation Department of Electrical Engineering5600 Cattle Road and Computer ScienceSan Jose, California 95193 Northwestern University
Evanston, Illinois 60201Dr. Nathan LewisDepartment of Chemistry Dr. Joel HarrisStanford University Department of ChemistryStanford, California 94305 University of Utah
Salt Lake City, Utah 84112
.L/413/83/01359/413-2
ABSTRACTS DISTRIBUTION LIST, 359/627
Dr. Robert Somoano Dr. Edward FletcherJet Propulsion Laboratory Department of Mechanical EngineeringCalifornia Institute of Technology University of MinnesotaPasadena, California 91103 Minneapolis, Minnesota 55455
Dr. Johann A. Joebstl Dr. John FontanellaUSA Mobility Equipment R&D Comand Department of PhysicsDROME-EC U.S. Naval AcademyFort Belvoir, Virginia 22060 Annapolis, Maryland 21402
Dr. Judith H. Ambrus Dr. Martha GreenblattNASA Headquarters Department of ChemistryM.S. RTS-6 Rutgers UniversityWashington, D.C. 20546 New Brunswick, New Jersey 08903
Dr. Albert R. Landgrebe Dr. John WassonU.S. Department of Energy Syntheco, Inc.M.S. 68025 Forrestal Building Rte 6 - Industrial Pike RoadWashington, D.C. 20595 Gastonia, North Carolina 28052
Dr. J. J. Brophy Dr. Walter RothDepartment of Physics Department of PhysicsUniversity of Utah State University of New YorkSalt Lake City, Utah 84112 Albany, New York 12222
Dr. Charles Martin Dr. Anthony SammellsDepartment of Chemistry Eltron Research Inc.Texas A&M University 4260 Westbrook Drive, Suite 111College Station, Texas 77843 Aurora, Illinois 60505
Dr. H. Tachikawa Dr. C. A. AngellDepartment of Chemistry Department of ChemistryJackson State University Purdue UniversityJackson, Mississippi 39217 West Lafayette, Indiana 47907
Dr. Theodore Beck Dr. Thomas DavisElectrochemical Technology Corp. Polymer Science and Standards3935 Leary Way N.W. DivisionSeattle, Washington 98107 National Bureau of Standards
Washington, D.C. 20234Dr. Farrell LytleBoeing Engineering and Ms. Wendy Parkhurst
Construction Engineers Naval Surface Weapons Center R-33P.O. Box 3707 R-33Seattle, Washington 98124 Silver Spring, Maryland 20910
Dr. Robert GotschollU.S. Department of Energy4S G-226Washington, D.C. 20545
DL/413/83/01
359/413-2
ABSTRACTS DISTRIBUTION LIST, 359/627
Dr. John Owen Dr. 0. StafsuddDepartment of Chemistry and Department of Electrical Engineering
Applied Chemistry University of CaliforniaUniversity of Salford Los Angeles, California 90024Salford M5 4WT ENGLAND
Dr. Boone Ovens Dr. S. G. GreenbaumDepartment of Chemical Engineering Department of Physics
and Materials Science Hunter College of CUNYUniversity of Minnesota New York, New York 10021Minneapolis, Minnesota 55455
Dr. J. 0. Thomas Dr. Menahem AndermanUniversity of Uppsala W.R. Grace & Co.Institute of Chemistry Columbia, Maryland 20144Box 531S-751 21 Uppsala, Sweden
Ia

H 97b
-tW W
VIN.--v-,-y--~, ? .