KSA EXPORT POTENTIAL - sidf.gov.sasidf.gov.sa/En/MediaCenter/ResearchandStudies... · to the KSA...
22
Marketing Studies & Consultancy Division (MSCD) Export Consultancy Unit (ECU) ______________________________________________________________ Export Study KSA EXPORT POTENTIAL Shawal, 1427H (October, 2006)
Transcript of KSA EXPORT POTENTIAL - sidf.gov.sasidf.gov.sa/En/MediaCenter/ResearchandStudies... · to the KSA...
Marketing Studies & Consultancy Division (MSCD)
Export Consultancy Unit (ECU) ______________________________________________________________
Export Study
KSA EXPORT POTENTIAL
Shawal, 1427H (October, 2006)
��
1
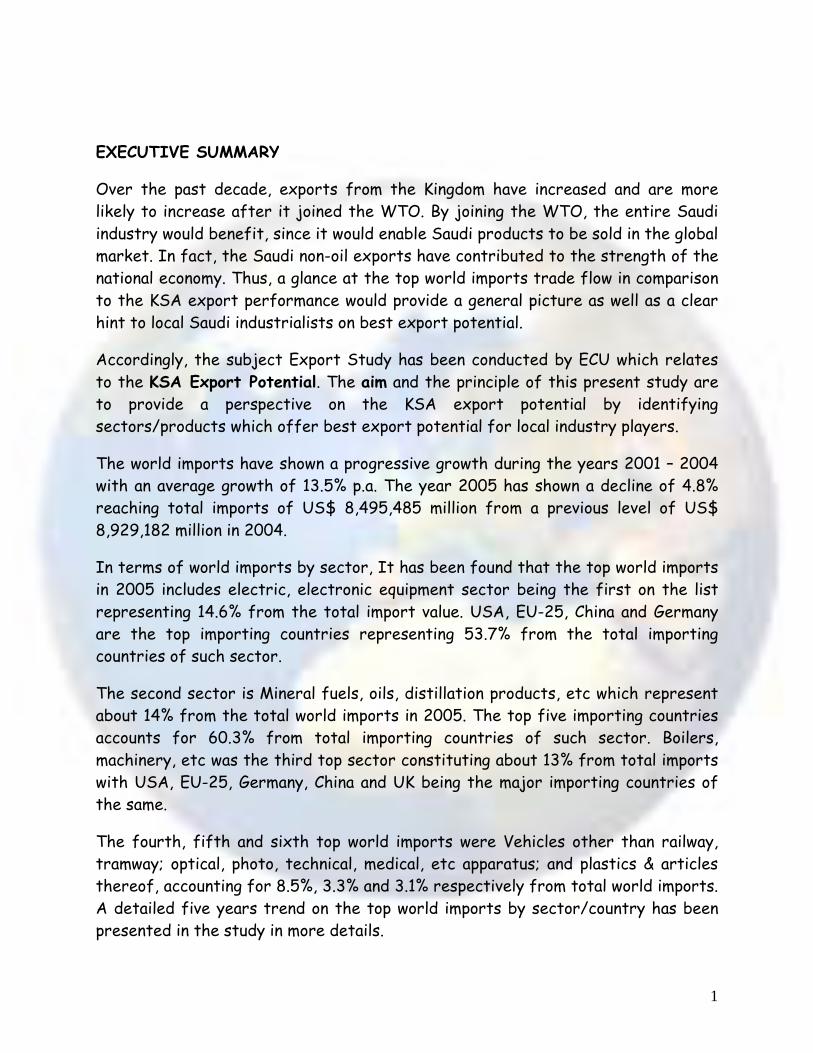
EXECUTIVE SUMMARY
Over the past decade, exports from the Kingdom have increased and are more likely to increase after it joined the WTO. By joining the WTO, the entire Saudi industry would benefit, since it would enable Saudi products to be sold in the global market. In fact, the Saudi non-oil exports have contributed to the strength of the national economy. Thus, a glance at the top world imports trade flow in comparison to the KSA export performance would provide a general picture as well as a clear hint to local Saudi industrialists on best export potential.
Accordingly, the subject Export Study has been conducted by ECU which relates to the KSA Export Potential. The aim and the principle of this present study are to provide a perspective on the KSA export potential by identifying sectors/products which offer best export potential for local industry players.
The world imports have shown a progressive growth during the years 2001 � 2004 with an average growth of 13.5% p.a. The year 2005 has shown a decline of 4.8% reaching total imports of US$ 8,495,485 million from a previous level of US$ 8,929,182 million in 2004.
In terms of world imports by sector, It has been found that the top world imports in 2005 includes electric, electronic equipment sector being the first on the list representing 14.6% from the total import value. USA, EU-25, China and Germany are the top importing countries representing 53.7% from the total importing countries of such sector.
The second sector is Mineral fuels, oils, distillation products, etc which represent about 14% from the total world imports in 2005. The top five importing countries accounts for 60.3% from total importing countries of such sector. Boilers, machinery, etc was the third top sector constituting about 13% from total imports with USA, EU-25, Germany, China and UK being the major importing countries of the same.
The fourth, fifth and sixth top world imports were Vehicles other than railway, tramway; optical, photo, technical, medical, etc apparatus; and plastics & articles thereof, accounting for 8.5%, 3.3% and 3.1% respectively from total world imports. A detailed five years trend on the top world imports by sector/country has been presented in the study in more details.

2
In terms of the world imports by product sector/country in 2005, the study has identified 36 products sectors for all the top world imported sectors mentioned previously.
With regard to the KSA total exports, the total exports have shown a progressive growth during the past five years. It has grown from SR 290,553 million in 2000 to SR 677,144 million in 2005 by an average growth of 20.3% per annum. In 2005, total KSA exports have grown by 43.3% from a previous level of SR 472,491 million in 2004. In terms of KSA export partners in 2004, USA is the first KSA export market with total value of SR 81.3 billion. USA market accounts for 17.2% from total KSA exports.
On the other hand, KSA non-oil exports have shown a progressive growth during the past five years with an average growth of 21.4% per annum. The non-oil exports during 2005 reached SR 60,000 million from a level of SR 23,371 million in 2000.
The total Saudi non-oil exports have increased by 26.2% in 2005 from a level of SR 47,566 million in 2004. This increase can be attributed to the manufacturers/exporters realization of expanding their geographical presence at the International markets.
The top ten non-oil export commodities are within the sectors of plastic & articles thereof; organic chemicals; fertilizers; and electrical machinery & equipment & parts thereof. The total KSA non-oil exports in the first half of 2005 reached SR 27,298 million.
CONCLUSION
The recent boom in oil prices, coupled with an equally impressive increase in exports, has strengthened the foreign orientation of the Saudi economy. The non-oil manufacturing sector in the Kingdom achieved substantial growth, approximately 8.9% in 2005. The industrial sector has contributed to a great extent in the growth of an increasing volume of Saudi exports to international markets. In this regard, the plastic, chemicals, fertilizers and electrical machinery & equipment, has achieved remarkable success in the penetration of international markets. However, considerable expansion is expected in the Saudi industrial sector to service both local as well as international markets, where greater opportunities for

3
improving the status of the Saudi industry have become available following the KSA joining to WTO.
RECOMMENDATION
Based on the aforementioned, it is recommended that KSA exporters, particularly the identified local manufacturers, to consider in their future export plan the highlighted figures of the top world imports by sector/product in section 6. These analyzed figures could act as a base for future expansions or new market penetration.
Furthermore, the KSA producers are encouraged to contact local export insurance and credit institutions in order to utilize the available facilities for export credit and the insurance programs cover for higher risk countries. Additionally, the Saudi Export Program (SEP), operated by the Saudi Fund for Development (SFD) in Riyadh, is in a position to assist potential KSA exporters to expand their export activities and assist them to increase their sales volumes to more countries while trying to minimize risk.

KSA EXPORT POTENTIAL 1. INTRODUCTION .........................................................1
2. STUDY CONTENTS ......................................................1
3. RESEARCH OBJECTIVES ................................................1
4. DATA COLLECTION METHODS AND SOURCES ......................2
5. THE TOP WORLD IMPORTS BY SECTOR/COUNTRY .................2
6. THE TOP WORLD IMPORTS BY PRODUCT/COUNTRY................7
7. KSA EXPORT PERFORMANCE ......................................... 13
8. CONCLUSION........................................................... 17
9. RECOMMENDATION................................................. 17

1
1. INTRODUCTION
Over the past decade, exports from the Kingdom have increased and are more likely to increase after it joined the WTO. By joining the WTO, the entire Saudi industry would benefit, since it would enable Saudi products to be sold in the global market. In fact, the Saudi non-oil exports have contributed to the strength of the national economy. Thus, a glance at the top world imports trade flow in comparison to the KSA export performance would provide a general picture as well as a clear hint to local Saudi industrialists on best export potential.
The subject Export Study has been conducted by ECU which relates to the KSA Export Potential. The aim and the principle of this present study are to provide a perspective on the KSA export potential by identifying sectors/products which offer best export potential for local industry players.
2. STUDY CONTENTS
The content of the study include the following major topics:-
- The top world imports by sector/country. - The top world imports by product/country. - KSA export performance.
3. RESEARCH OBJECTIVES
The study intends to achieve the following research objectives:-
- To determine the top world imports by sector/country, including the harmonized coding, sector name, value in million US$, % of value from total and the top five importing countries for each sector.
- To determine the top world imports by product sector/country, including the harmonized coding, product sector name, value in million US$ and the top five importing & exporting countries for each product sector.
- To measure the KSA export performance for the previous years (2000 � 2005) and identify the top exported sectors. Thus, exploring the competitiveness of the Saudi exports.
- To identify the SIDF financed projects in comparison to the top world imported sectors providing a general roadmap for local interested industrialists.
2
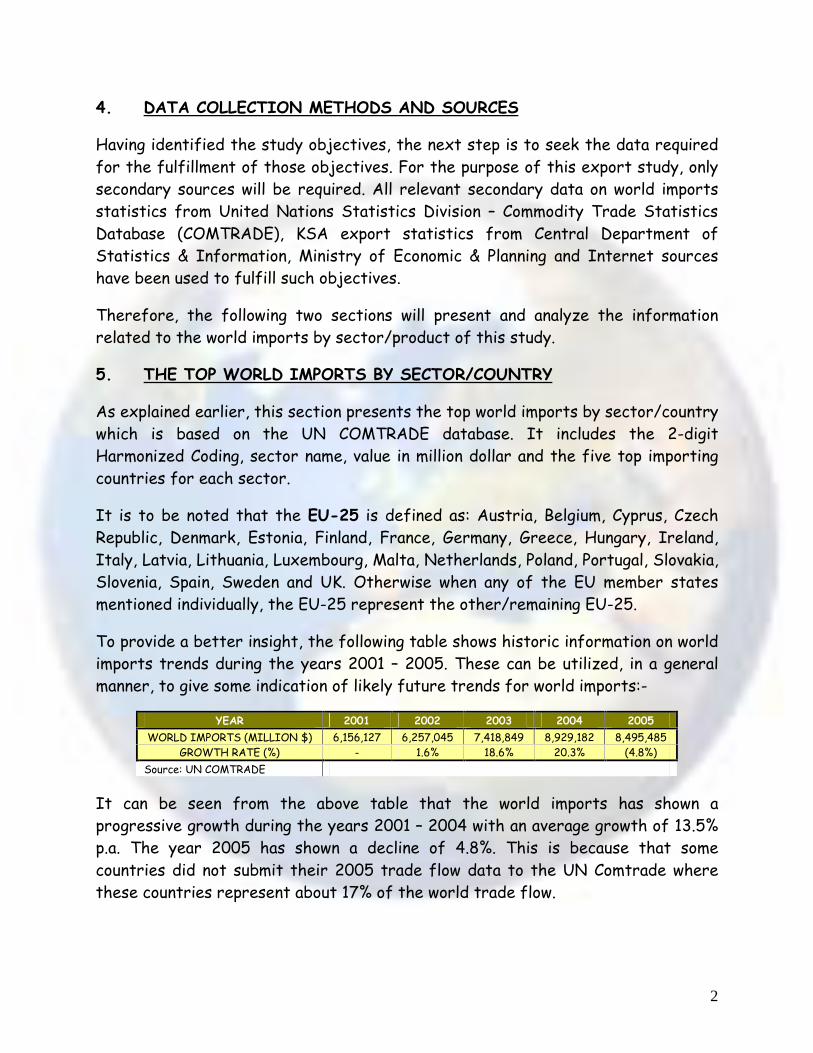
4. DATA COLLECTION METHODS AND SOURCES
Having identified the study objectives, the next step is to seek the data required for the fulfillment of those objectives. For the purpose of this export study, only secondary sources will be required. All relevant secondary data on world imports statistics from United Nations Statistics Division � Commodity Trade Statistics Database (COMTRADE), KSA export statistics from Central Department of Statistics & Information, Ministry of Economic & Planning and Internet sources have been used to fulfill such objectives.
Therefore, the following two sections will present and analyze the information related to the world imports by sector/product of this study.
5. THE TOP WORLD IMPORTS BY SECTOR/COUNTRY
As explained earlier, this section presents the top world imports by sector/country which is based on the UN COMTRADE database. It includes the 2-digit Harmonized Coding, sector name, value in million dollar and the five top importing countries for each sector.
It is to be noted that the EU-25 is defined as: Austria, Belgium, Cyprus, Czech Republic, Denmark, Estonia, Finland, France, Germany, Greece, Hungary, Ireland, Italy, Latvia, Lithuania, Luxembourg, Malta, Netherlands, Poland, Portugal, Slovakia, Slovenia, Spain, Sweden and UK. Otherwise when any of the EU member states mentioned individually, the EU-25 represent the other/remaining EU-25.
To provide a better insight, the following table shows historic information on world imports trends during the years 2001 � 2005. These can be utilized, in a general manner, to give some indication of likely future trends for world imports:-
YEAR 2001 2002 2003 2004 2005
WORLD IMPORTS (MILLION $) 6,156,127 6,257,045 7,418,849 8,929,182 8,495,485 GROWTH RATE (%) - 1.6% 18.6% 20.3% (4.8%)
Source: UN COMTRADE
It can be seen from the above table that the world imports has shown a progressive growth during the years 2001 � 2004 with an average growth of 13.5% p.a. The year 2005 has shown a decline of 4.8%. This is because that some countries did not submit their 2005 trade flow data to the UN Comtrade where these countries represent about 17% of the world trade flow.
3
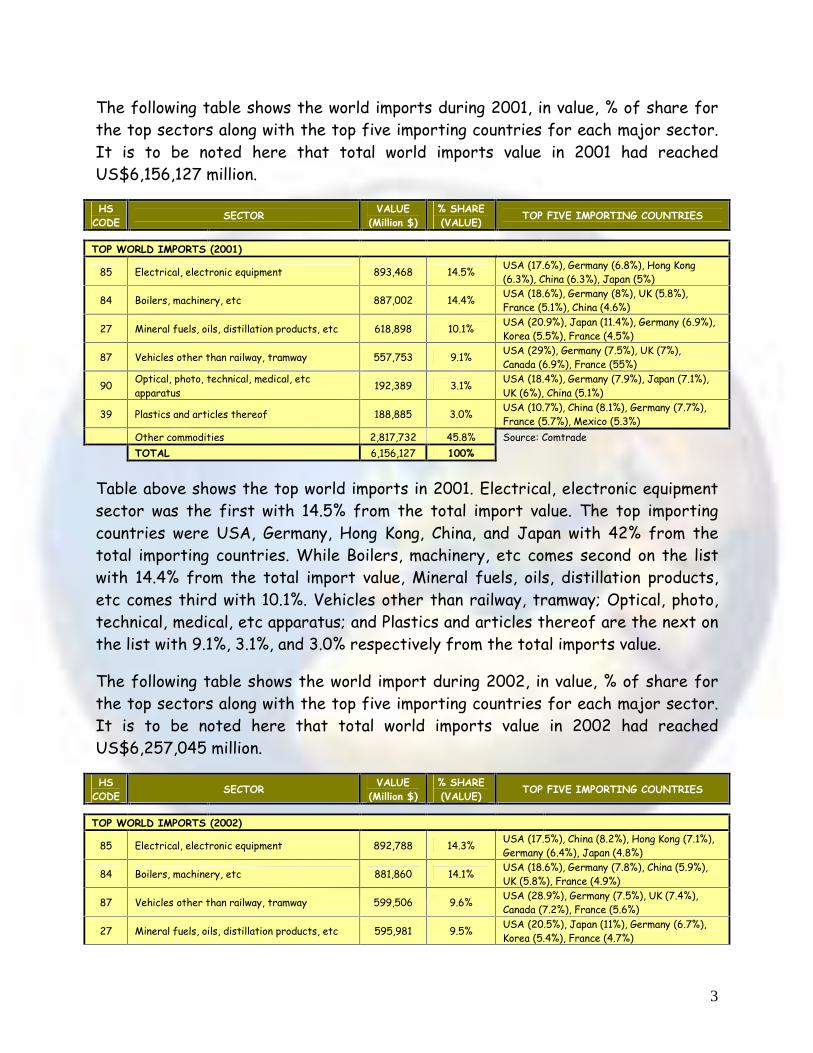
The following table shows the world imports during 2001, in value, % of share for the top sectors along with the top five importing countries for each major sector. It is to be noted here that total world imports value in 2001 had reached US$6,156,127 million.
HS CODE
SECTOR VALUE
(Million $) % SHARE (VALUE)
TOP FIVE IMPORTING COUNTRIES
TOP WORLD IMPORTS (2001)
85 Electrical, electronic equipment 893,468 14.5% USA (17.6%), Germany (6.8%), Hong Kong (6.3%), China (6.3%), Japan (5%)
84 Boilers, machinery, etc 887,002 14.4% USA (18.6%), Germany (8%), UK (5.8%), France (5.1%), China (4.6%)
27 Mineral fuels, oils, distillation products, etc 618,898 10.1% USA (20.9%), Japan (11.4%), Germany (6.9%), Korea (5.5%), France (4.5%)
87 Vehicles other than railway, tramway 557,753 9.1% USA (29%), Germany (7.5%), UK (7%), Canada (6.9%), France (55%)
90 Optical, photo, technical, medical, etc apparatus
192,389 3.1% USA (18.4%), Germany (7.9%), Japan (7.1%), UK (6%), China (5.1%)
39 Plastics and articles thereof 188,885 3.0% USA (10.7%), China (8.1%), Germany (7.7%), France (5.7%), Mexico (5.3%)
Other commodities 2,817,732 45.8% Source: Comtrade
TOTAL 6,156,127 100%
Table above shows the top world imports in 2001. Electrical, electronic equipment sector was the first with 14.5% from the total import value. The top importing countries were USA, Germany, Hong Kong, China, and Japan with 42% from the total importing countries. While Boilers, machinery, etc comes second on the list with 14.4% from the total import value, Mineral fuels, oils, distillation products, etc comes third with 10.1%. Vehicles other than railway, tramway; Optical, photo, technical, medical, etc apparatus; and Plastics and articles thereof are the next on the list with 9.1%, 3.1%, and 3.0% respectively from the total imports value.
The following table shows the world import during 2002, in value, % of share for the top sectors along with the top five importing countries for each major sector. It is to be noted here that total world imports value in 2002 had reached US$6,257,045 million.
HS CODE
SECTOR VALUE
(Million $) % SHARE (VALUE)
TOP FIVE IMPORTING COUNTRIES
TOP WORLD IMPORTS (2002)
85 Electrical, electronic equipment 892,788 14.3% USA (17.5%), China (8.2%), Hong Kong (7.1%), Germany (6.4%), Japan (4.8%)
84 Boilers, machinery, etc 881,860 14.1% USA (18.6%), Germany (7.8%), China (5.9%), UK (5.8%), France (4.9%)
87 Vehicles other than railway, tramway 599,506 9.6% USA (28.9%), Germany (7.5%), UK (7.4%), Canada (7.2%), France (5.6%)
27 Mineral fuels, oils, distillation products, etc 595,981 9.5% USA (20.5%), Japan (11%), Germany (6.7%), Korea (5.4%), France (4.7%)
4
39 Plastics and articles thereof 197,859 3.2% USA (10.9%), China (8.8%), Germany (7.2%), France (5.6%), Mexico (5.3%)
90 Optical, photo, technical, medical, etc apparatus
194,746 3.0% USA (18.1%), Germany (7.4%), China (6.9%), Japan (6.8%), UK (5.7%)
Other commodities 2,894,305 46.3% Source: Comtrade
TOTAL 6,257,045 100%
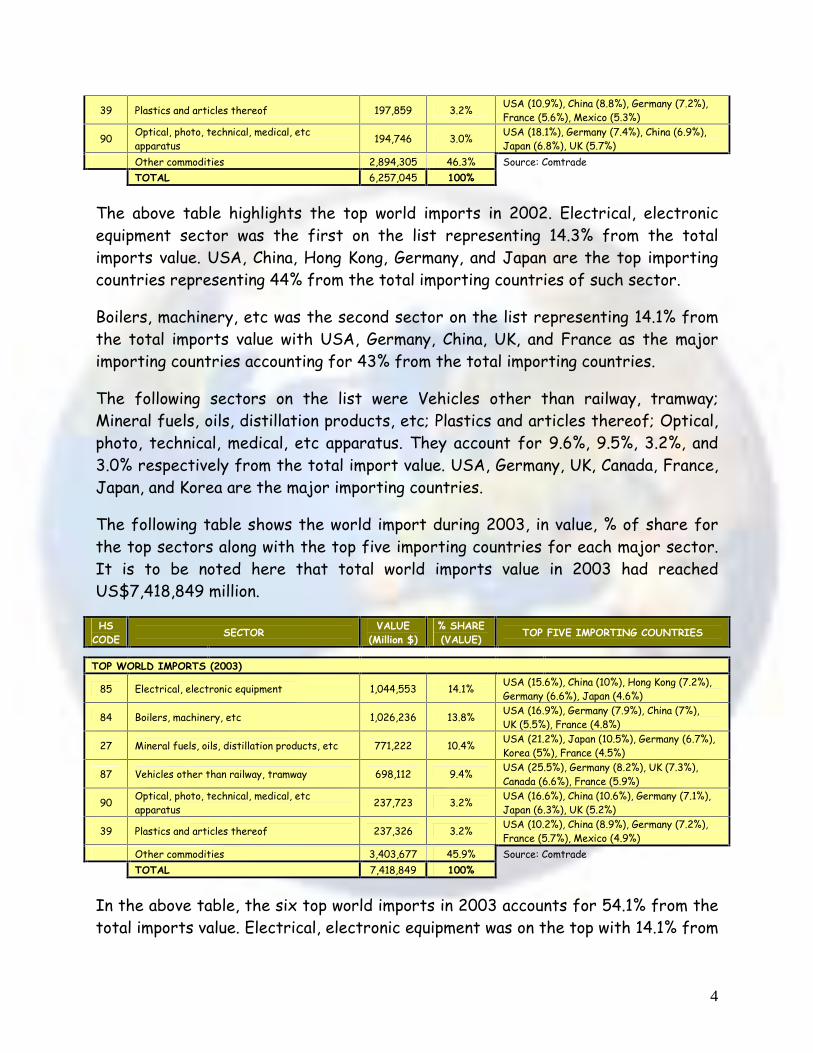
The above table highlights the top world imports in 2002. Electrical, electronic equipment sector was the first on the list representing 14.3% from the total imports value. USA, China, Hong Kong, Germany, and Japan are the top importing countries representing 44% from the total importing countries of such sector.
Boilers, machinery, etc was the second sector on the list representing 14.1% from the total imports value with USA, Germany, China, UK, and France as the major importing countries accounting for 43% from the total importing countries.
The following sectors on the list were Vehicles other than railway, tramway; Mineral fuels, oils, distillation products, etc; Plastics and articles thereof; Optical, photo, technical, medical, etc apparatus. They account for 9.6%, 9.5%, 3.2%, and 3.0% respectively from the total import value. USA, Germany, UK, Canada, France, Japan, and Korea are the major importing countries.
The following table shows the world import during 2003, in value, % of share for the top sectors along with the top five importing countries for each major sector. It is to be noted here that total world imports value in 2003 had reached US$7,418,849 million.
HS CODE
SECTOR VALUE
(Million $) % SHARE (VALUE)
TOP FIVE IMPORTING COUNTRIES
TOP WORLD IMPORTS (2003)
85 Electrical, electronic equipment 1,044,553 14.1% USA (15.6%), China (10%), Hong Kong (7.2%), Germany (6.6%), Japan (4.6%)
84 Boilers, machinery, etc 1,026,236 13.8% USA (16.9%), Germany (7.9%), China (7%), UK (5.5%), France (4.8%)
27 Mineral fuels, oils, distillation products, etc 771,222 10.4% USA (21.2%), Japan (10.5%), Germany (6.7%), Korea (5%), France (4.5%)
87 Vehicles other than railway, tramway 698,112 9.4% USA (25.5%), Germany (8.2%), UK (7.3%), Canada (6.6%), France (5.9%)
90 Optical, photo, technical, medical, etc apparatus
237,723 3.2% USA (16.6%), China (10.6%), Germany (7.1%), Japan (6.3%), UK (5.2%)
39 Plastics and articles thereof 237,326 3.2% USA (10.2%), China (8.9%), Germany (7.2%), France (5.7%), Mexico (4.9%)
Other commodities 3,403,677 45.9% Source: Comtrade
TOTAL 7,418,849 100%
In the above table, the six top world imports in 2003 accounts for 54.1% from the total imports value. Electrical, electronic equipment was on the top with 14.1% from
5
the total imports value; and the top five importing countries are USA, China, Hong Kong, Germany, and Japan; with 44% from the total importing countries of such sector.
The second and third sectors are Boilers, machinery, etc and Mineral fuels, oils, distillation products, etc. They account for 13.8% and 10.4% respectively from the total imports value. USA, Germany, China, UK, France, Japan, and Korea are the major importing countries.
Vehicles other than railway, tramway; Optical, photo, technical, medical, etc apparatus; Plastics and articles thereof are the fourth, fifth, and sixth top world imports, accounting for 9.4%, 3.2%, and 3.2% respectively from the total world imports.
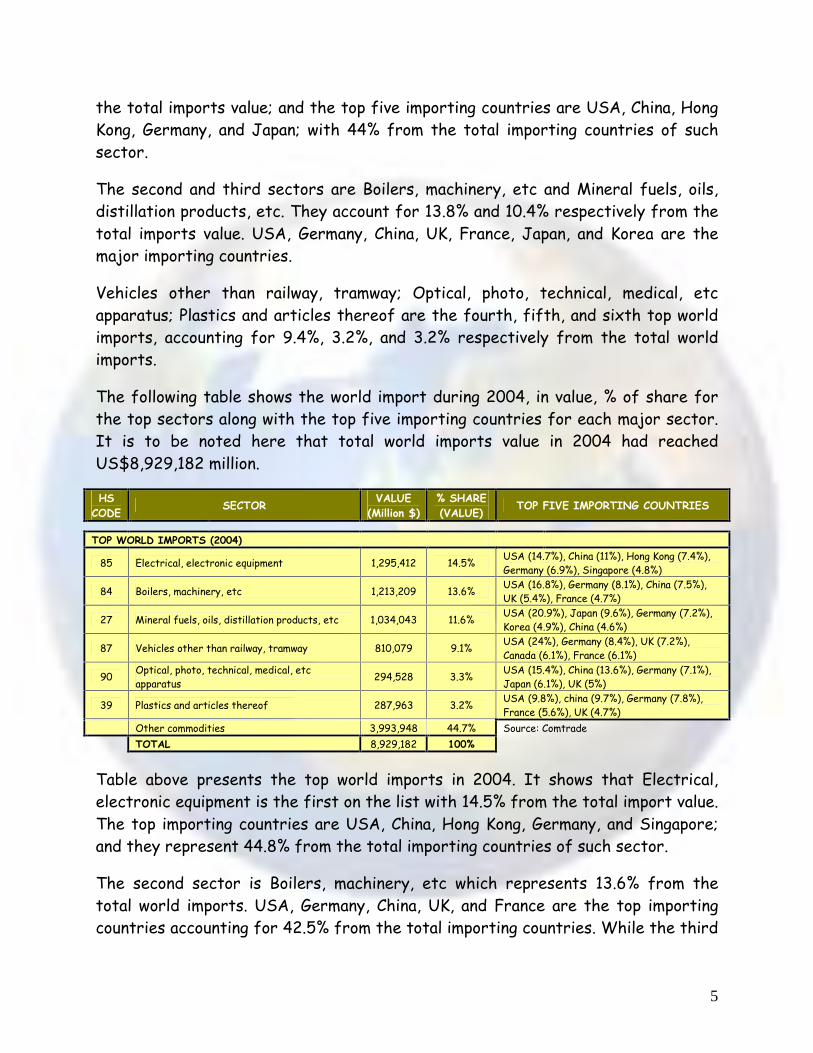
The following table shows the world import during 2004, in value, % of share for the top sectors along with the top five importing countries for each major sector. It is to be noted here that total world imports value in 2004 had reached US$8,929,182 million.
HS CODE
SECTOR VALUE
(Million $) % SHARE (VALUE)
TOP FIVE IMPORTING COUNTRIES
TOP WORLD IMPORTS (2004)
85 Electrical, electronic equipment 1,295,412 14.5% USA (14.7%), China (11%), Hong Kong (7.4%), Germany (6.9%), Singapore (4.8%)
84 Boilers, machinery, etc 1,213,209 13.6% USA (16.8%), Germany (8.1%), China (7.5%), UK (5.4%), France (4.7%)
27 Mineral fuels, oils, distillation products, etc 1,034,043 11.6% USA (20.9%), Japan (9.6%), Germany (7.2%), Korea (4.9%), China (4.6%)
87 Vehicles other than railway, tramway 810,079 9.1% USA (24%), Germany (8.4%), UK (7.2%), Canada (6.1%), France (6.1%)
90 Optical, photo, technical, medical, etc apparatus
294,528 3.3% USA (15.4%), China (13.6%), Germany (7.1%), Japan (6.1%), UK (5%)
39 Plastics and articles thereof 287,963 3.2% USA (9.8%), china (9.7%), Germany (7.8%), France (5.6%), UK (4.7%)
Other commodities 3,993,948 44.7% Source: Comtrade
TOTAL 8,929,182 100%
Table above presents the top world imports in 2004. It shows that Electrical, electronic equipment is the first on the list with 14.5% from the total import value. The top importing countries are USA, China, Hong Kong, Germany, and Singapore; and they represent 44.8% from the total importing countries of such sector.
The second sector is Boilers, machinery, etc which represents 13.6% from the total world imports. USA, Germany, China, UK, and France are the top importing countries accounting for 42.5% from the total importing countries. While the third
6
sector is Mineral fuels, oils, distillation products, etc which represents 11.6% from the total import value with USA, Japan, Germany, Korea, and China being the major importing countries with 47.2% from the total importing countries.
The next three sectors in the list are Vehicles other than railway, tramway; Optical, photo, technical, medical, etc apparatus; and Plastics and articles thereof respectively representing 9.1%, 3.3%, 3.2% from the total world imports. The major importing countries are USA, Germany, UK, Canada, Franc, China, and Japan.
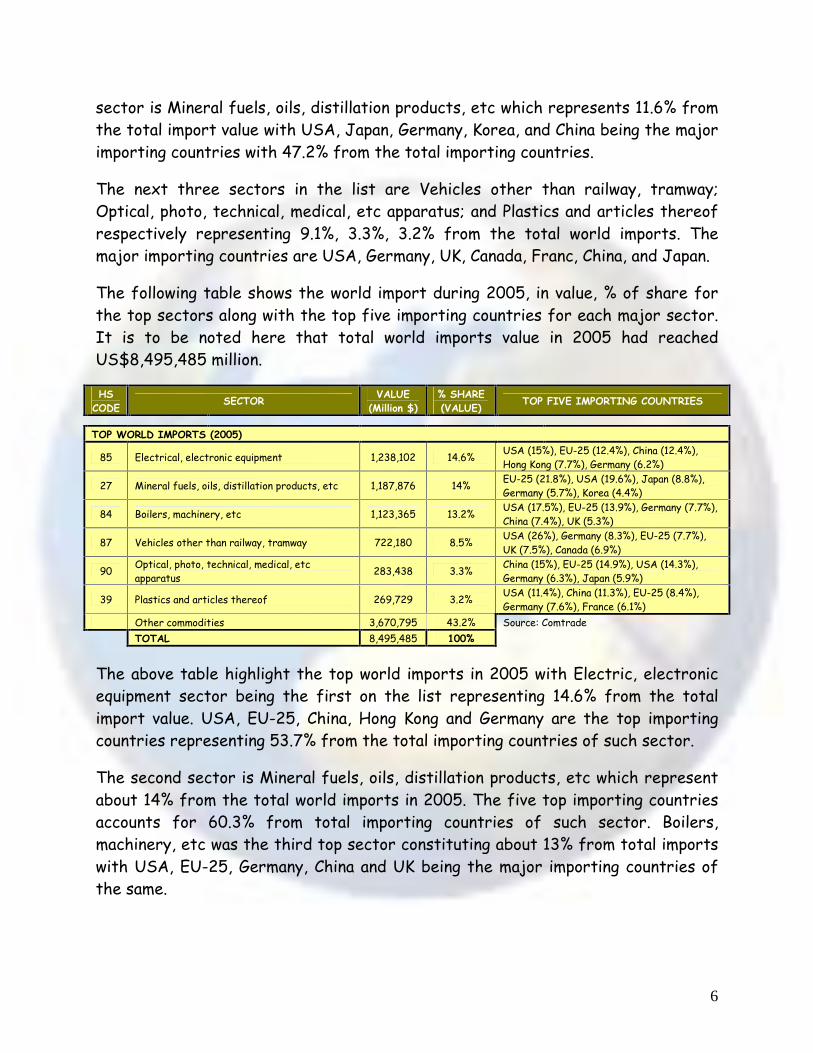
The following table shows the world import during 2005, in value, % of share for the top sectors along with the top five importing countries for each major sector. It is to be noted here that total world imports value in 2005 had reached US$8,495,485 million.
HS CODE
SECTOR VALUE
(Million $) % SHARE (VALUE)
TOP FIVE IMPORTING COUNTRIES
TOP WORLD IMPORTS (2005)
85 Electrical, electronic equipment 1,238,102 14.6% USA (15%), EU-25 (12.4%), China (12.4%), Hong Kong (7.7%), Germany (6.2%)
27 Mineral fuels, oils, distillation products, etc 1,187,876 14% EU-25 (21.8%), USA (19.6%), Japan (8.8%), Germany (5.7%), Korea (4.4%)
84 Boilers, machinery, etc 1,123,365 13.2% USA (17.5%), EU-25 (13.9%), Germany (7.7%), China (7.4%), UK (5.3%)
87 Vehicles other than railway, tramway 722,180 8.5% USA (26%), Germany (8.3%), EU-25 (7.7%), UK (7.5%), Canada (6.9%)
90 Optical, photo, technical, medical, etc apparatus
283,438 3.3% China (15%), EU-25 (14.9%), USA (14.3%), Germany (6.3%), Japan (5.9%)
39 Plastics and articles thereof 269,729 3.2% USA (11.4%), China (11.3%), EU-25 (8.4%), Germany (7.6%), France (6.1%)
Other commodities 3,670,795 43.2% Source: Comtrade
TOTAL 8,495,485 100%
The above table highlight the top world imports in 2005 with Electric, electronic equipment sector being the first on the list representing 14.6% from the total import value. USA, EU-25, China, Hong Kong and Germany are the top importing countries representing 53.7% from the total importing countries of such sector.
The second sector is Mineral fuels, oils, distillation products, etc which represent about 14% from the total world imports in 2005. The five top importing countries accounts for 60.3% from total importing countries of such sector. Boilers, machinery, etc was the third top sector constituting about 13% from total imports with USA, EU-25, Germany, China and UK being the major importing countries of the same.

7
The fourth, fifth and sixth top world imports were Vehicles other than railway, tramway; optical, photo, technical, medical, etc apparatus; and plastics & articles thereof, accounting for 8.5%, 3.3% and 3.1% respectively from total world imports.
6. THE TOP WORLD IMPORTS BY PRODUCT/COUNTRY
This section presents the top world imports by product sector/country in 2005 which are based on the UN COMTRADE database. It include the 6-digits Harmonized Coding, product description, value in million dollar and the top importing & exporting countries for each product sector.
It is to be noted here that the total import value of the products sector being analyzed in the following tables of this section is slightly different from the total import value of its sector being highlighted in the previous section. These differences have been reported to the UN Comtrade Commodity Trade Statistical Section seeking a rational justification for this matter. The UN Statistics Division justified the matter as that it is possible that aggregated data does not match up with detailed data. The main reasons, as been reported directly from the UN Statistics Division, are that any country can report higher level data such as total or 2-digit and also the data has been aggregated by certain processing rules.
The following table shows the world imports of electric, electronic equipment during 2005 in value term along with the top five importing and exporting countries.
HS CODE
PRODUCT SECTOR VALUE
(Million$) TOP FIVE IMPORTING
COUNTRIES TOP FIVE EXPORTING COUNTRIES
HS # 85 (Electric, electronic equipment)
854211 Monolithic integrated circuits, digital 194,409 China (26.8%), Hong Kong (9.7%), EU-25 (8.8%), Korea (8.4%), USA (7.4%)
USA (18%), Japan (11.7%), Korea (10.5%), EU-25 (9%), Hong Kong (8.5%)
852520 Transmit-receive apparatus for radio, TV, etc
105,511 EU-25 (21.4%), USA (18.8%), Germany (9.3%), UK (6.3%), Hong Kong (5.6%)
EU-25 (17.7%), China (14.5%), Korea (11.9%), UK (10.3%), Germany (8.7%)
854219 Monolithic integrated circuits, except digital
78,513 China (20.8%), Singapore (18.4%), Hong Kong (13.5%), Other Asia (7%), EU-25 (6.3%)
Singapore (34.2%), Hong Kong (10.7%), USA (10.6%), Other Asia (9.5%), Korea (7.2%)
852990 Parts for radio/tv transmit/receive equipment, nes
64,433 China (22.3%), Hong Kong (13.1%), EU-25 (11.6%), USA (7.7%), Mexico (7.7%)
China (20.8%), Hong Kong (15.5%), Japan (12.7%), Korea (12.6%), EU-25 (8.7%)
852810 Color television receivers/monitors/projectors
48,503 USA (38.5%), EU-25 (12.8%), UK (7.4%), Germany (6%), France (4.2%)
Mexico (22.1%), China (17.8%), Japan (8.4%), Korea (6.3%), Other Asia (5.2%)
852110 Video recording/reproducing apparatus, magnetic tape
29,442 EU-25 (21.9%), USA (20.9%), Hong Kong (12.4%), Germany (7.3%), UK (4.9%)
Japan (37.4%), China (19.9%), Hong Kong (14.4%), Germany (5.3%), Indonesia (3.2%)
Other 724,269 Source: Comtrade
Total 1,245,080

8
The above table presents the top world imports of Electrical, electronic equipment in 2005. Monolithic integrated circuits, digital is the first on the list accounting for 15.6% from the total import value. The top importing countries are China, Hong Kong, EU-25, Korea, and USA representing 61.1% from the total importing countries. On the other hand, USA, Japan, Korea, EU-25, and Hong Kong were the major exporting countries accounting for 57.7% from the total exporting countries.
The second product sector is Transmit-receive apparatus for radio, TV, etc; which represents 8.47% from the total import value. The five top importing countries are USA, EU-25, Singapore, Germany, France; accounting for 61.4% from the total importing countries. Furthermore, the five top exporting countries are EU-25, China, Korea, UK, Germany; and accounting for 63.1% from the total exporting countries.
Monolithic integrated circuits, except digital is coming third on the list. It accounts for 6.3% from the total import value. While China, Singapore, Hong Kong, Other Asia, and EU-25 are the major importing countries with 66% from the total importing countries, Singapore, Hong Kong, USA, Other Asia, and Korea are the major exporting countries with 72.2% from the total exporting countries.
The fourth, fifth and sixth top world imports in this sector are Parts for radio/tv transmit/receive equipment, nes; Color television receivers/monitors/projectors; and Video recording/reproducing apparatus, magnetic tape, accounting for 5.17%, 3.8%, and 2.36% respectively from the total imports value.
The following table shows the world imports of mineral fuels, oils, distillation products, etc during 2005 in value term along with the top five importing and exporting countries.
HS CODE
PRODUCT SECTOR VALUE
(Million$) TOP FIVE IMPORTING COUNTRIES TOP FIVE EXPORTING COUNTRIES
HS # 27 (Mineral fuels, oils, distillation products, etc)
270900 Petroleum oils, oils from bituminous minerals, crude
662,906 EU-25 (23.6%), USA (21.9%), Japan (9.2%), China (5.5%), Germany (5%)
Russia (37.3%), Mexico (13.3%), Canada (11.6%), UK (9.2%), Qatar (6%)
271000 Oils petroleum, bituminous, distillates, except crude
259,771 USA (20.7%), EU-25 (14.3%), Singapore (5.5%), Germany (5.2%), France (5%)
EU-25 (14.6%), Russia (12.2%), Singapore (9.6%), Korea (5.5%), USA (5.3%)
271121 Natural gas in gaseous state 91,442 EU-25 (23.8%), USA (22.4%), Germany (14.7%), Belgium (8.8), France (7.4%)
Canada (67.7%), Belgium (14.5%), USA (6.4%), France (3.9%), UK (2.8%)
271111 Natural gas, liquefied 38,543 Japan (39.2%), Korea (18.9%), EU-25 (15.9%), USA (11.7%), Other Asia (6.1%)
Indonesia (43.4%), Qatar (40.1%), Australia (14.1%), USA (0.8%), Mozambique (0.6%)
270112 Bituminous coal, not agglomerated 36,643 Japan (27.1%), EU-25 (21.4%), Korea (10.3%), Other Asia (8.2%), UK (4.8%)
Australia (45.1%), China (10.4%), Indonesia (10.1%), Russia (9%), S. Africa (8.6%)

9
271600 Electrical energy 18,112 Austria (18.2%), EU-25 (15.3%), Italy (12.6%), USA (11.6%), Canada (4.9%)
France (21.3%), Austria (18.5%), Canada (12.8%), EU-25 (9.9%), USA (5.1%)
Other 59,214 Source: Comtrade
Total 1,166,631
The above table illustrates the top world imports of Mineral fuels, oils, distillation products, etc in 2005. The first product sector on the list is Petroleum oils, oils from bituminous minerals, crude which represents 56.8% from the total world imports. The top major countries are EU-25, USA, Japan, China, and Germany with 65.2% from the total importing countries. Moreover; Russia, Mexico, Canada, UK, and Qatar are the major exporting countries accounting for 77.4% from the total exporting countries.
Oils petroleum, bituminous, distillates, except crude comes second on the list with 22.26% from the total import value, followed by Natural Gas in gaseous state with 7.83%. While USA, EU-25, Singapore, Germany, France, and Belgium are the major importing countries for these product sectors; the major exporting countries are EU-25, Russia, Singapore, Korea, USA, Canada, Belgium, France, and UK. The following three product sectors on the list are: Natural gas, liquefied; Bituminous coal, not agglomerated; and Electrical energy; representing 3.3%, 3.14%, 1.55% respectively from the total world imports.
The following table shows the world imports of boilers, machinery, etc during 2005 in value term along with the top five importing and exporting countries.
HS CODE
PRODUCT SECTOR VALUE
(Million$) TOP FIVE IMPORTING COUNTRIES TOP FIVE EXPORTING COUNTRIES
HS # 84 (Boilers, machinery, etc)
847330 Parts and accessories of data processing equipment
152,073 EU-25(16.2%), USA (15.6%), Hong Kong (11.7%), China (8.6%), Singapore (7.3%)
China (16.5%), Hong Kong (14.3%), USA (11.2%), Singapore (9.2%), Japan (8.8%)
847193 Computer data storage units 57,057 China (16.8%), USA (16.2%), EU-25 (16%), Germany (7.3%), Hong Kong (6.4%)
Singapore (19.5%), China (17.6%), Thailand (10.3%), USA (7.8%), EU-25 (6.5%)
847120 Digital computers with cpu and input-output units
55,785 USA (28.8%), EU-25 (20.3%), Germany (7.8%), UK (7.3%), Japan (6%)
China (56.2%), Germany (7.7%), Ireland (6.9%), EU-25 (5.4%), USA (5.1%)
847192 Computer input or output units 55,325 USA (26.3%), EU-25 (19.8%), Germany (7.4%), Japan (5.9%), UK (4.2%)
China (37.3%), Korea (9.9%), USA (6.6%), EU-25 (6.4%), Japan (5.2%)
847191 Digital computer cpu with some of storage/input/output
40,557 USA (2.4%), Japan (9.1%), France (8.8%), Germany (7.9%), UK (7.1%)
USA (17.8%), Ireland (13.4%), China (13.2%), EU-25 (13.1%), Germany (10.9%)
847989 Machines and mechanical appliances 32,466 China (19.6%), Other Asia (14%), Korea (10.7%), EU-25 (7.6%), USA (7.6%)
Japan (27.9%), EU-25 (16.4%), USA (12.2%), Germany (11.7%), Italy (6.2%)
Other 720,384 Source: Comtrade
Total 1,113,647
In the above table, the top world imports of Boilers, machinery, etc is presented. On the top, Parts and accessories of data processing equipment which accounts for 13.65% from the total imports value. The major importing countries are EU-25,

10
USA, Hong Kong, China, and Singapore representing 59.4% from the total importing countries. The top exporting countries are China, Hong Kong, USA, Singapore, and Japan with 60% from the total exporting countries.
The second and third product sectors are Computer data storage units and Digital computers with CPU and input-output units. They are accounting for 5.1% and 5% respectively from the total world imports. While China, USA, EU-25, Germany, Hong Kong, UK and Japan are the major importing countries, Singapore, China, Thailand, USA, EU-25, Germany, Ireland, and Japan are the top exporting countries.
Computer input or output units; Digital computer CPU with some of storage/input/output; Machines and mechanical appliances are the fourth, fifth, and sixth product sectors on the list. They account for 4.9%, 3.6%, and 2.9% respectively from the total world imports.
The following table shows the world imports of vehicles other than railway, tramway during 2005 in value term along with the top five importing and exporting countries.
HS CODE
PRODUCT SECTOR VALUE
(Million$) TOP FIVE IMPORTING COUNTRIES
TOP FIVE EXPORTING COUNTRIES
HS # 87 (Vehicles other than railway, tramway)
870323 Automobiles, spark ignition engine of 1500-3000 cc
147,230 USA (29%), UK (10.5%), Germany (7.3%), Canada (7.2%), EU-25 (6.5%)
Germany (18.5%), EU-25 (17.4%), Japan (16.5%), USA (7.9%), Korea (6.6%)
870324 Automobiles, spark ignition engine of >3000 cc
108,481 USA (67%), Canada (6.5%), UK (3.2%), Japan (2.7%), Mexico (2.7%)
Canada (21.6%), EU-25 (20.3%), Germany (18.7%), Japan (17.5%), USA (8.3%)
870332 Automobiles, diesel engine of 1500-2500 cc
68,607 Italy (18.6%), France (18.2%), Germany (13.7%), Belgium (10.3%), EU-25 (10.3%)
Germany (34.6%), France (16.7%), Belgium (12.1%), EU-25 (9.5%), Japan (5.6%)
870899 Motor vehicle parts nes 64,894 USA (22.8%), Germany (9.6%), UK (8.7%), Canada (7.5%), France (7.3%)
EU-25 (14.8%), USA (12.2%), Germany (11.2%), Japan (9.4%), Italy (7.2%)
870829 Parts and accessories of bodies nes for motor vehicle
38,945 USA (21.6%), Canada (14.9%), Germany (11%), Mexico (6.9%), Belgium (6.5%)
USA (23%), Germany (15.3%), Canada (10.1%), Japan (9.4%), EU-25 (8.2%)
870322 Automobiles, spark ignition engine of 1000-1500 cc
35,875 Germany (15.8%), Italy (13.1%), EU-25 (11.3%), USA (9%), UK (8.7%)
Japan (24.5%), France (13.1%), Korea (11%), EU-25 (9%), Belgium (7.6%)
Other 256,758 Source: Comtrade
Total 720,790
The above table shows the top world imports for Vehicles other than railway, tramway. The first product sector on the list is Automobiles, spark ignition engine of 1500-3000 cc accounting for 20.4% from the total world imports. The five top importing countries - which account for 60.5% from the total importing countries- are USA, UK, Germany, Canada, and EU-25. On the other hand, the five major
11
exporting countries �which account for 66.9% from the total exporting countries- are Germany, EU-25, Japan, USA, and Korea.
Automobiles, spark ignition engine of >3000 cc comes after with 15% from the total world imports, followed by Automobiles, diesel engine of 1500-2500 cc with 9.5%. The major importing countries are USA, Canada, UK, Japan, and Mexico. The top exporting countries are Canada, EU-25, Germany, Japan, France, and Belgium.
The following products sector on the list are: Motor vehicle parts nes; Parts and accessories of bodies nes for motor vehicle; and Automobiles, spark ignition engine of 1000-1500 cc representing 9%, 5.4%, and 4.9% respectively from the total world imports.
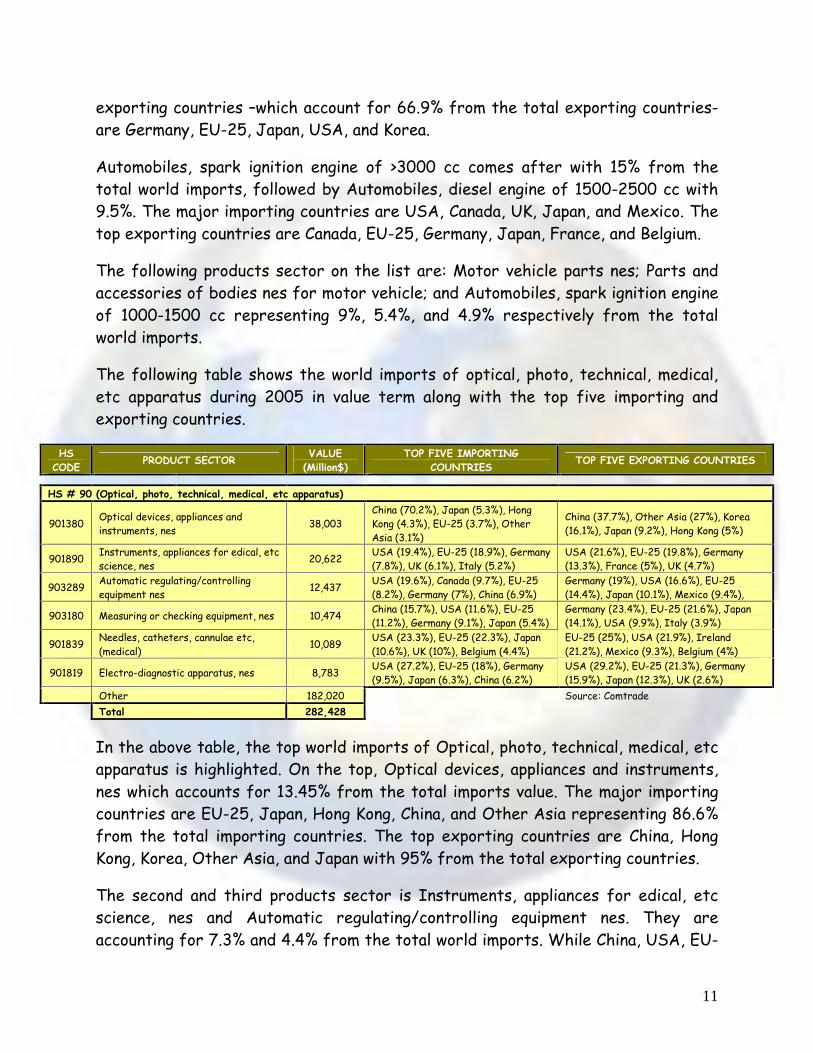
The following table shows the world imports of optical, photo, technical, medical, etc apparatus during 2005 in value term along with the top five importing and exporting countries.
HS CODE
PRODUCT SECTOR VALUE
(Million$) TOP FIVE IMPORTING
COUNTRIES TOP FIVE EXPORTING COUNTRIES
HS # 90 (Optical, photo, technical, medical, etc apparatus)
901380 Optical devices, appliances and instruments, nes
38,003 China (70.2%), Japan (5.3%), Hong Kong (4.3%), EU-25 (3.7%), Other Asia (3.1%)
China (37.7%), Other Asia (27%), Korea (16.1%), Japan (9.2%), Hong Kong (5%)
901890 Instruments, appliances for edical, etc science, nes
20,622 USA (19.4%), EU-25 (18.9%), Germany (7.8%), UK (6.1%), Italy (5.2%)
USA (21.6%), EU-25 (19.8%), Germany (13.3%), France (5%), UK (4.7%)
903289 Automatic regulating/controlling equipment nes
12,437 USA (19.6%), Canada (9.7%), EU-25 (8.2%), Germany (7%), China (6.9%)
Germany (19%), USA (16.6%), EU-25 (14.4%), Japan (10.1%), Mexico (9.4%),
903180 Measuring or checking equipment, nes 10,474 China (15.7%), USA (11.6%), EU-25 (11.2%), Germany (9.1%), Japan (5.4%)
Germany (23.4%), EU-25 (21.6%), Japan (14.1%), USA (9.9%), Italy (3.9%)
901839 Needles, catheters, cannulae etc, (medical)
10,089 USA (23.3%), EU-25 (22.3%), Japan (10.6%), UK (10%), Belgium (4.4%)
EU-25 (25%), USA (21.9%), Ireland (21.2%), Mexico (9.3%), Belgium (4%)
901819 Electro-diagnostic apparatus, nes 8,783 USA (27.2%), EU-25 (18%), Germany (9.5%), Japan (6.3%), China (6.2%)
USA (29.2%), EU-25 (21.3%), Germany (15.9%), Japan (12.3%), UK (2.6%)
Other 182,020 Source: Comtrade
Total 282,428
In the above table, the top world imports of Optical, photo, technical, medical, etc apparatus is highlighted. On the top, Optical devices, appliances and instruments, nes which accounts for 13.45% from the total imports value. The major importing countries are EU-25, Japan, Hong Kong, China, and Other Asia representing 86.6% from the total importing countries. The top exporting countries are China, Hong Kong, Korea, Other Asia, and Japan with 95% from the total exporting countries.
The second and third products sector is Instruments, appliances for edical, etc science, nes and Automatic regulating/controlling equipment nes. They are accounting for 7.3% and 4.4% from the total world imports. While China, USA, EU-

12
25, Germany, Italy, and UK are the major importing countries; USA, EU-25, Germany, France, UK, Mexico, and Japan are the top exporting countries.
Measuring or checking equipment, nes; Needles, catheters, cannulae etc, (medical); Electro-diagnostic apparatus, nes are the fourth, fifth, and sixth products sector on the list. They account for 3.7%, 3.57%, and 3.1% respectively from the total world imports.
The following table shows the world imports of plastics and articles thereof during 2005 in value term along with the top five importing and exporting countries.
HS CODE
PRODUCT SECTOR VALUE
(Million$) TOP FIVE IMPORTING COUNTRIES TOP FIVE EXPORTING COUNTRIES
HS # 39 (Plastics and articles thereof)
392690 Plastic articles nes 25,149 USA (14.2%), EU-25 (11.2%), Mexico (10.4%), Germany (7.6%), France (6%)
Germany (12.9%), EU-25 (12.8%), USA (12.5%), China (10%), Italy (6.9%)
390110 Polyethylene � specific gravity < 0.94 in primary form
11,364 EU-25 (11.4%), Germany (9.4%), China (9.4%), Italy (8.5%), Belgium (8%)
Belgium (15.9%), USA (12%), EU-25 (9.7%), Germany (8.6%), France (7.5%)
390120 Polyethylene � specific gravity > 0.94 in primary form
11,123 China (20.9%), USA (12.3%), EU-25 (7.3%), Germany (6.9%), Italy (6.1%)
Belgium (15.5%), Canada (11.1%), Korea (10.4%), EU-25 (10.3%), Germany (9.8%)
390210 Polypropylene in primary forms 11,080 China (26.3%), Hong Kong (9.4%), Italy (8.3%), Belgium (7.2%), Germany (7.1%)
USA (12.8%), Belgium (12.7%), EU-25 (10.8%), Korea (10.4%), France (8.3)
390740 Polycarbonates, in primary forms 7,245 China (28.4%), Hong Kong (13.3%), Other Asia (8.4%), Germany (5%), Italy (4.7%)
USA (17.1%), Thailand (14.5%), Singapore (13.1%), Hong Kong (11.9%), Japan (11.3%)
392190 Plastic sheet, film, foil or strip, nes 6,821 USA (10.8%), Other Asia (9.2%), EU-25 (8.2%), France (7.5%), Germany (6.9%)
Germany (16.4%), EU-25 (15.2%), Italy (8.6%), Japan (8.5%), USA (6.6%)
Other 196,070 Source: Comtrade
Total 268,852
The above table presents the top world imports for Plastics and articles thereof sector. The first product sector on the list is Plastic articles nes accounting for 9.3% from the total world imports. The five top importing countries �which account for 49.4% from the total importing countries are USA, Germany, and EU-25, Mexico, and France. On the other hand, the five major exporting countries �which account for 55.1% from the total exporting countries are Germany, EU-25, USA, China, and Italy.
Polyethylene � specific gravity < 0.94 in primary form comes after with 4.2% from the total world imports, followed by Polyethylene � specific gravity > 0.94 in primary form with 4.1%. The major importing countries are USA, Germany, EU-25, China, Italy, and Belgium. The top exporting countries are USA, EU-25, Germany, Korea, France, Canada, and Belgium.
13
The following products sector on the list are: Polypropylene in primary forms; Polycarbonates, in primary forms; and Plastic sheet, film, foil or strip, nes representing 4.1%, 2.7%, and 2.5% respectively from the total world imports.
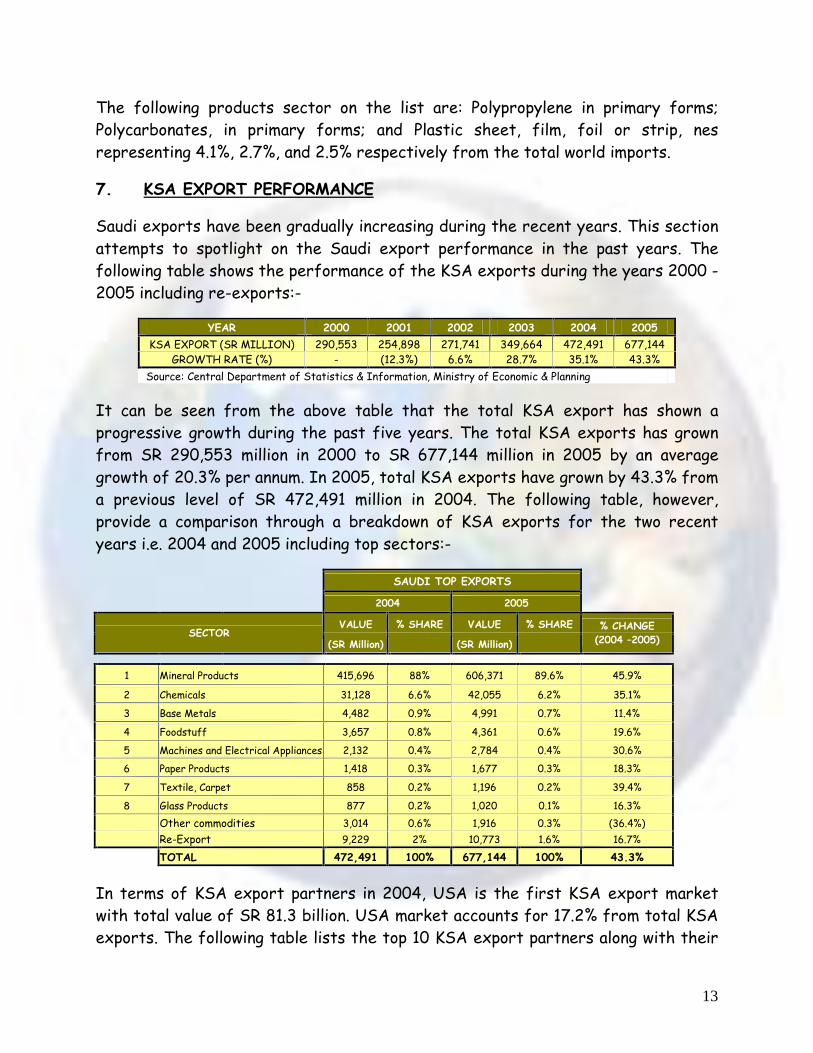
7. KSA EXPORT PERFORMANCE
Saudi exports have been gradually increasing during the recent years. This section attempts to spotlight on the Saudi export performance in the past years. The following table shows the performance of the KSA exports during the years 2000 - 2005 including re-exports:-
YEAR 2000 2001 2002 2003 2004 2005
KSA EXPORT (SR MILLION) 290,553 254,898 271,741 349,664 472,491 677,144 GROWTH RATE (%) - (12.3%) 6.6% 28.7% 35.1% 43.3%
Source: Central Department of Statistics & Information, Ministry of Economic & Planning
It can be seen from the above table that the total KSA export has shown a progressive growth during the past five years. The total KSA exports has grown from SR 290,553 million in 2000 to SR 677,144 million in 2005 by an average growth of 20.3% per annum. In 2005, total KSA exports have grown by 43.3% from a previous level of SR 472,491 million in 2004. The following table, however, provide a comparison through a breakdown of KSA exports for the two recent years i.e. 2004 and 2005 including top sectors:-
SAUDI TOP EXPORTS
2004 2005
VALUE % SHARE VALUE % SHARE SECTOR
(SR Million) (SR Million)
% CHANGE (2004 �2005)
1 Mineral Products 415,696 88% 606,371 89.6% 45.9%
2 Chemicals 31,128 6.6% 42,055 6.2% 35.1%
3 Base Metals 4,482 0.9% 4,991 0.7% 11.4%
4 Foodstuff 3,657 0.8% 4,361 0.6% 19.6%
5 Machines and Electrical Appliances 2,132 0.4% 2,784 0.4% 30.6%
6 Paper Products 1,418 0.3% 1,677 0.3% 18.3%
7 Textile, Carpet 858 0.2% 1,196 0.2% 39.4%
8 Glass Products 877 0.2% 1,020 0.1% 16.3%
Other commodities 3,014 0.6% 1,916 0.3% (36.4%)
Re-Export 9,229 2% 10,773 1.6% 16.7%
TOTAL 472,491 100% 677,144 100% 43.3%
In terms of KSA export partners in 2004, USA is the first KSA export market with total value of SR 81.3 billion. USA market accounts for 17.2% from total KSA exports. The following table lists the top 10 KSA export partners along with their

14
value share from total KSA exports in addition to the total value share of the remaining other countries: -
Top 10 KSA Export Partners (2004) Rank Country SR Million
1 USA 81,360
2 Japan 67,006
3 South Korea 40,382
4 India 27,625
5 China 22,787
6 Singapore 22,147
7 Holland 18,216
8 Taiwan 15,396
9 Italy 12,553
10 France 12,335
Sub-Total 319,807 Other Countries 152,684
Grand Total 472,491
Asia countries (non-Arabic and non-Islamic) which include both Japan and South Korea ranked second and third where both accounts for about 14.2% and 8.5% respectively from total KSA exports. The fourth and fifth export partners are India and China where both accounts for 5.8% and 4.8% respectively. In terms of the remaining countries, the following chart presents the share of the top 10 KSA export partners for the year 2004: -
Top 10 KSA Exports Partners (2004)
17.2%
14.2%8.5%
5.8%
4.8%
4.7%
3.8%3.2% 2.7% 2.6%
USA
Japan
S. Korea
India
China
Singapore
Holland
Taiwan
Italy
France
To provide a better insight, the table below provides historic information on KSA non-oil exports (excluding re-export) trends during the years 2000 � 2005. These can be utilized, in a general manner, to give some indication of likely future trends for KSA exports. It is worth noting that exports during the last five years have

15
been continuously growing, where it reached SR 60,000 million in 2005 from a level of SR 23,371 million in 2000.
YEAR 2000 2001 2002 2003 2004 2005
KSA EXPORT (SR MILLION) 23,371 27,057 28,357 35,743 47,566 60,000 GROWTH RATE (%) - 15.8% 4.8% 26% 33% 26.2%
% OF TOTAL EXPORTS 8% 10.6% 10.4% 10.2% 10% 8.9%
Source: Central Department of Statistics & Information, Ministry of Economic & Planning
It can be seen from the above table that KSA export has shown a progressive growth during the past five years with an average growth of 21.4% per annum. The following chart presents the KSA non-oil export in five year trends:-
2000 2001 2002 2003 2004 2005
0
10,000
20,000
30,000
40,000
50,000
60,000
SR Million
Year
KSA Non-oil Exports (2000-2005)
The following table, however, provide a comparison through a breakdown of KSA non-oil exports for the two recent years i.e. 2004 and 2005 including top sectors:-
SAUDI TOP NON-OIL EXPORTS
2004 2005
VALUE % SHARE VALUE % SHARE SECTOR
(SR Million) (SR Million)
% CHANGE (2004 �2005)
1 Chemicals 31,128 65.5% 42,055 70.1% 35.1%
2 Base Metals 4,482 9.4% 4,991 8.3% 11.4%
3 Foodstuff 3,657 7.7% 4,361 7.3% 19.6%
4 Machines and Electrical Appliances 2,132 4.5% 2,784 4.6% 30.6%
5 Paper Products 1,418 3.0% 1,677 2.8% 18.3%
6 Textile, Carpet 858 1.8% 1,196 2.0% 39.4%
7 Glass Products 877 1.8% 1,020 1.7% 16.3%
Other Commodities 3,014 6.3% 1,916 3.2% (36.4%)
TOTAL 47,566 100% 60,000 100% 26.2%
16
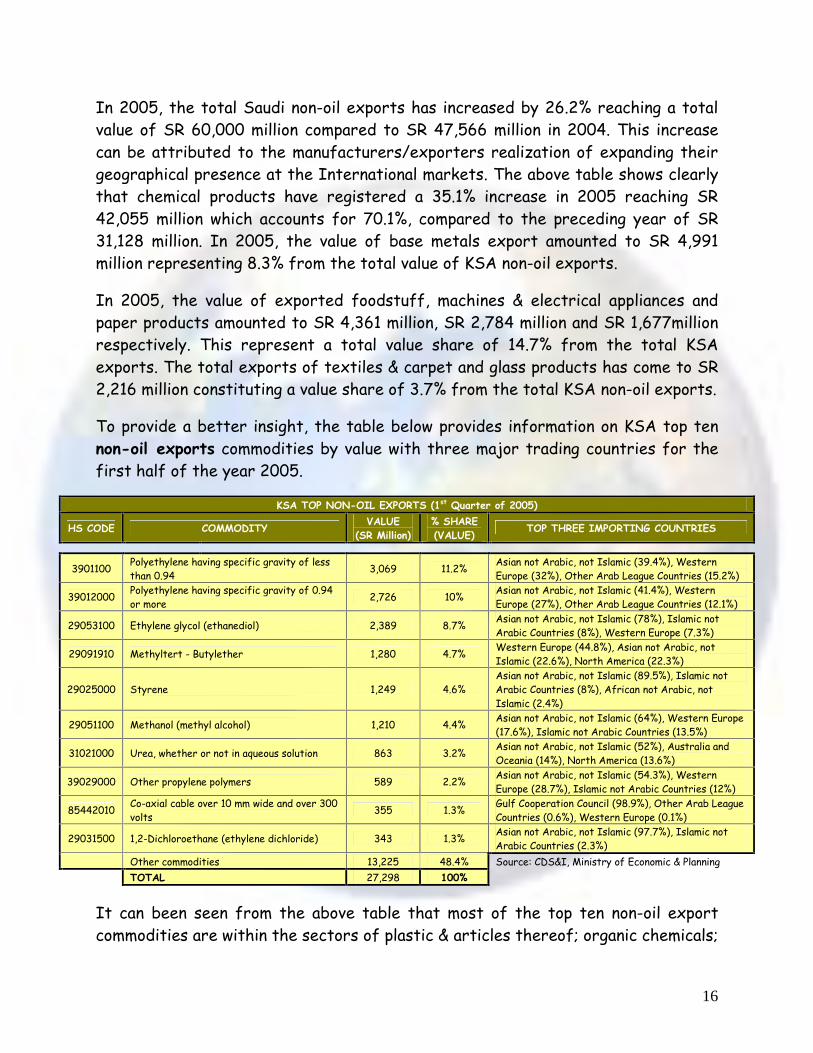
In 2005, the total Saudi non-oil exports has increased by 26.2% reaching a total value of SR 60,000 million compared to SR 47,566 million in 2004. This increase can be attributed to the manufacturers/exporters realization of expanding their geographical presence at the International markets. The above table shows clearly that chemical products have registered a 35.1% increase in 2005 reaching SR 42,055 million which accounts for 70.1%, compared to the preceding year of SR 31,128 million. In 2005, the value of base metals export amounted to SR 4,991 million representing 8.3% from the total value of KSA non-oil exports.
In 2005, the value of exported foodstuff, machines & electrical appliances and paper products amounted to SR 4,361 million, SR 2,784 million and SR 1,677million respectively. This represent a total value share of 14.7% from the total KSA exports. The total exports of textiles & carpet and glass products has come to SR 2,216 million constituting a value share of 3.7% from the total KSA non-oil exports.
To provide a better insight, the table below provides information on KSA top ten non-oil exports commodities by value with three major trading countries for the first half of the year 2005.
KSA TOP NON-OIL EXPORTS (1st Quarter of 2005)
HS CODE COMMODITY VALUE
(SR Million) % SHARE (VALUE)
TOP THREE IMPORTING COUNTRIES
3901100 Polyethylene having specific gravity of less than 0.94
3,069 11.2% Asian not Arabic, not Islamic (39.4%), Western Europe (32%), Other Arab League Countries (15.2%)
39012000 Polyethylene having specific gravity of 0.94 or more
2,726 10% Asian not Arabic, not Islamic (41.4%), Western Europe (27%), Other Arab League Countries (12.1%)
29053100 Ethylene glycol (ethanediol) 2,389 8.7% Asian not Arabic, not Islamic (78%), Islamic not Arabic Countries (8%), Western Europe (7.3%)
29091910 Methyltert - Butylether 1,280 4.7% Western Europe (44.8%), Asian not Arabic, not Islamic (22.6%), North America (22.3%)
29025000 Styrene 1,249 4.6% Asian not Arabic, not Islamic (89.5%), Islamic not Arabic Countries (8%), African not Arabic, not Islamic (2.4%)
29051100 Methanol (methyl alcohol) 1,210 4.4% Asian not Arabic, not Islamic (64%), Western Europe (17.6%), Islamic not Arabic Countries (13.5%)
31021000 Urea, whether or not in aqueous solution 863 3.2% Asian not Arabic, not Islamic (52%), Australia and Oceania (14%), North America (13.6%)
39029000 Other propylene polymers 589 2.2% Asian not Arabic, not Islamic (54.3%), Western Europe (28.7%), Islamic not Arabic Countries (12%)
85442010 Co-axial cable over 10 mm wide and over 300 volts
355 1.3% Gulf Cooperation Council (98.9%), Other Arab League Countries (0.6%), Western Europe (0.1%)
29031500 1,2-Dichloroethane (ethylene dichloride) 343 1.3% Asian not Arabic, not Islamic (97.7%), Islamic not Arabic Countries (2.3%)
Other commodities 13,225 48.4% Source: CDS&I, Ministry of Economic & Planning
TOTAL 27,298 100%
It can been seen from the above table that most of the top ten non-oil export commodities are within the sectors of plastic & articles thereof; organic chemicals;
17
fertilizers; and electrical machinery & equipment & parts thereof. The total KSA non-oil exports in the first half of 2005 reached SR 27,298 million. The highest exported commodity in terms of value is the Polyethylene having specific gravity of less than 0.94 with a total export value of SR 3,069 million accounting for 11.2% from the total KSA non-oil export in the first half of 2005. The lowest rank commodity among the top ten is the 1,2-Dichloroethane (ethylene dichloride) which accounts for 1.3% at a value of SR 343 million. The top ten export commodities accounts for 51.6% while the remaining of KSA non-oil exports represents 48.4% from the total.
8. CONCLUSION
The recent boom in oil prices, coupled with an equally impressive increase in exports, has strengthened the foreign orientation of the Saudi economy.
The non-oil manufacturing sector in the kingdom achieved substantial growth, approximately 8.9% in 2005. The industrial sector has contributed to a great extent in the growth of an increasing volume of Saudi exports to international markets. In this regard, the plastic, chemicals, fertilizers and electrical machinery & equipment, has achieved remarkable success in the penetration of international markets. However, considerable expansion is expected in the Saudi industrial sector to service both local as well as international markets, where greater opportunities for improving the status of the Saudi industry have become available following the KSA joining to WTO.
9. RECOMMENDATION
Based on the aforementioned, it is recommended that KSA exporters, particularly the identified local manufacturers, to consider in their future export plan the previous highlighted figures of the top world imports by sector/product in section 6. These analyzed figures could act as a base for future expansions or new market penetration.
Furthermore, the KSA producers are encouraged to contact local export insurance and credit institutions in order to utilize the available facilities for export credit and the insurance programs cover for higher risk countries. Additionally, the Saudi Export Program (SEP), operated by the Saudi Fund for Development (SFD) in Riyadh, is in a position to assist potential KSA exporters to expand their export activities and assist them to increase their sales volumes to more countries while trying to minimize risk.