KPMG Media and Entertainment 2010
20
Time is Money The digital dilemma continues KPMG’s Media and Entertainment Barometer KPMG LLP (UK)
-
Upload
twofourseven -
Category
Business
-
view
3.351 -
download
0
description
KPMG Media and Entertainment 2010
Transcript of KPMG Media and Entertainment 2010
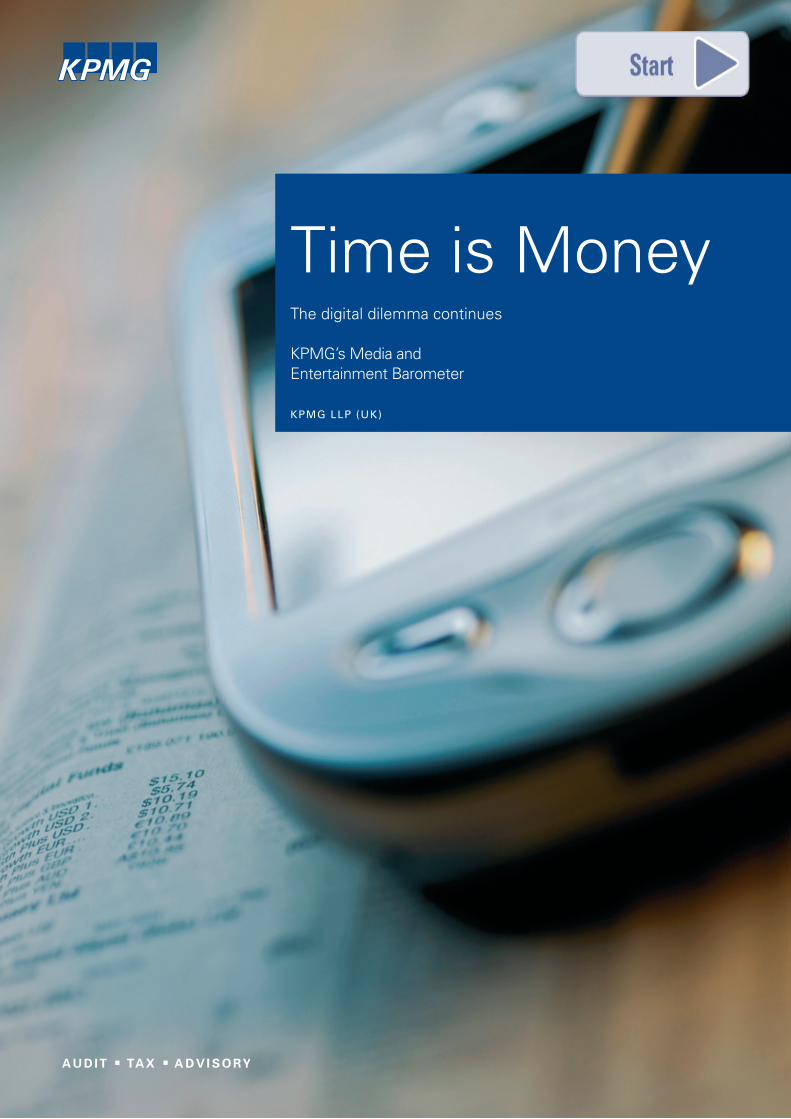
Time is Money The digital dilemma continues
KPMG’s Media and Entertainment Barometer
KPMG LLP (UK)

Introduction Consumer media spend is down but consumption has increased.
David Elms
I am pleased to introduce the second KPMG Media and Entertainment Barometer, our comprehensive six monthly report based on a KPMG commissionedYouGov survey.
We asked over 1,000 UK consumers about their online and offline media consumption and the results highlight the scale of the challenge the media industry faces in halting declining revenues.
Consumer are spending less on traditional and digital media than six months ago, but consuming more.
Average spend per UK consumer on traditional media fell from £9.19 in September 2009 when the first Barometer was undertaken, to £7.46 in March 2010 and spend on digital media also fell (from £1.99 to £0.98.) However the time we spend consuming media has increased.
The average monthly consumption of traditional media has risen marginally from 11 hours 40 minutes in September 09, to 12 hours 13 minutes. Hours spent consuming digital media increased even more from 6 hours 14 minutes to 7 hours 28 minutes.
The survey shows that spend has reduced across several parts of the media industry for example:
• 21 percent of newspaper readers paid nothing for these over the past month, compared with 15 percent six months ago. In London this almost doubled – 23 percent to 41 percent – highlighting the impact of the Evening Standard moving to a ‘free’ model
• The situation is similar for print magazines with 19 percent of consumers saying they had paid nothing for these over the past month compared with 12 percent six months ago.
Previous Accessing traditional media
Prefer accessing online or offline?
Accessing more media now?
Currently paying for online content?
Introduction
1 Time is Money - the digital dilemma continues © 2010 KPMG LLP, a UK limited liability partnership, is a subsidiary of KPMG Europe LLP and a member firm of the KPMG network of independent member firms affiliated with KPMG International Cooperative, a Swiss entity. All rights reserved.

• Of concern to those aiming to introduce pay walls for online newspapers, is the increasing majority of respondents who said they paid nothing for accessing online news portals - up 4 percent from 84 percent in September 2009 to 88 percent in March 2010
• Spend on video games was significantly down, quite possibly reflecting the release of popular titles in the month leading up to the first edition of the Barometer.
These findings of the second KPMG Media and Entertainment Barometer illustrate the problem faced by the media sector in curbing the structural decline in revenues. However, online users are increasing. Online subscription models remain in their infancy and once more developed should provide a platform for significantly higher online revenues.
There is considerable focus on driving digital media revenues and respondents indicated they do access more media because of online availability, but the tide has not yet turned as the majority of us still prefer consuming media offline. Only a quarter favoured online media access compared with 43 percent who said offline and a third who reported it didn’t make a difference.
However, with 24 percent of respondents using Video on Demand services, there is a growing appetite for more dynamic and easily available content. Also, with a marked increase on the time spent online, particularly on social networking and online games, creating integrated business models which make the most of both traditional and digital business models continue to be key for the sector.
About the survey: All figures, unless otherwise stated are fromYouGov Plc. Total sample size for the poll carried out in March 2010 was 1037 completes for wave 1 and 1034 for wave 2, people aged 16 years plus. The field work was conducted with members ofYouGov’s online panel between 11th and 14th September 2009 (wave 1) and 15th and 18th March 2010 (wave 2). The figures have been weighted and are representative of all GB adults (16+).
Next Accessing new media
Traditional vs. New Media: some comparisons
3D viewing FIFA World Cup 2010 viewing plans Betting
© 2010 KPMG LLP, a UK limited liability partnership, is a subsidiary of KPMG Europe LLP and a member firm of the KPMG network Time is Money - the digital dilemma continues 2 of independent member firms affiliated with KPMG International Cooperative, a Swiss entity. All rights reserved.
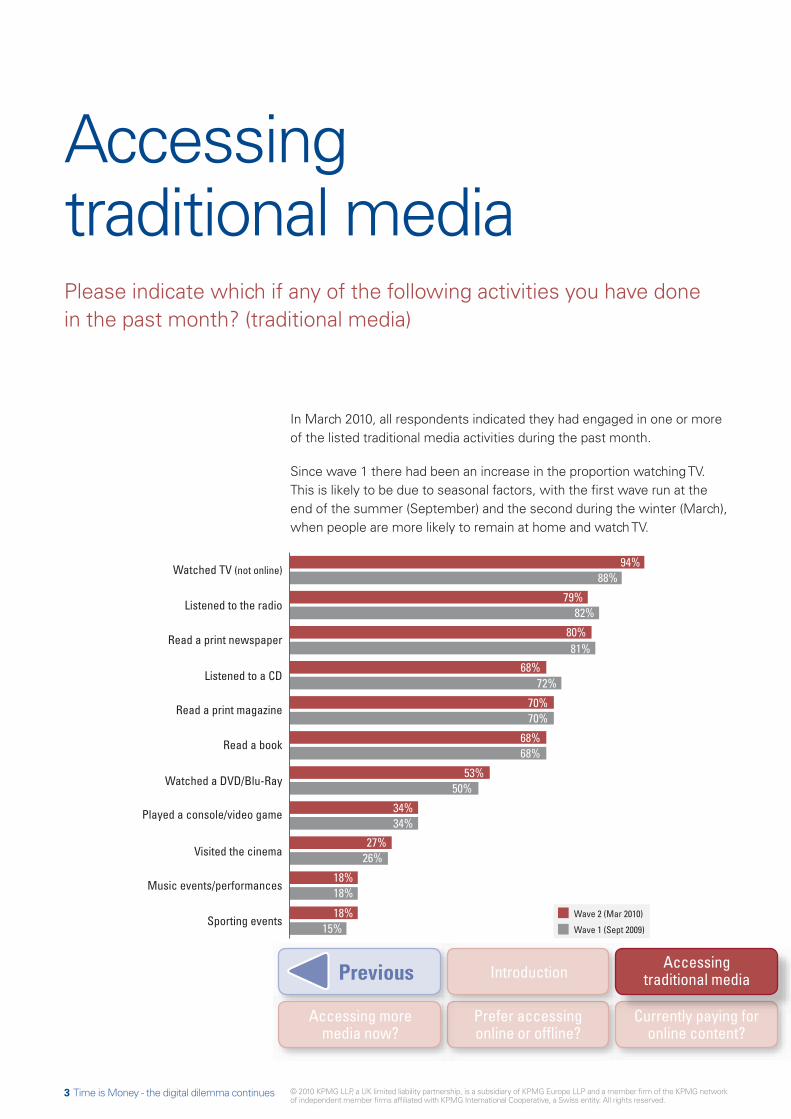
Accessing traditional media Please indicate which if any of the following activities you have done in the past month? (traditional media)
In March 2010, all respondents indicated they had engaged in one or more of the listed traditional media activities during the past month.
Since wave 1 there had been an increase in the proportion watching TV. This is likely to be due to seasonal factors, with the first wave run at the end of the summer (September) and the second during the winter (March), when people are more likely to remain at home and watch TV.
94%Watched TV (not online) 88%
Listened to the radio 82% 79%
Read a print newspaper 81%
80%
Listened to a CD 72% 68%
Read a print magazine 70% 70%
Read a book 68% 68%
Watched a DVD/Blu-Ray 50% 53%
Played a console/video game 34% 34%
Visited the cinema 26% 27%
Music events/performances 18% 18%
Sporting events 15% 18% Wave 2 (Mar 2010)
Wave 1 (Sept 2009)
Previous
Prefer accessing online or offline?
Accessing more media now?
Currently paying for online content?
Introduction Accessing traditional media
3 Time is Money - the digital dilemma continues © 2010 KPMG LLP, a UK limited liability partnership, is a subsidiary of KPMG Europe LLP and a member firm of the KPMG network of independent member firms affiliated with KPMG International Cooperative, a Swiss entity. All rights reserved.

Amongst those who had engaged in traditional activities during the past month, the highest mean spend was on attending music events and performances (£30.20) and sporting events (£29.68). These also had the highest spend in wave 1, though the sum spent was marginally down for wave 2, perhaps reflecting seasonal variation in spend.
Mean spend on newspapers, magazines and the cinema was broadly in line with wave 1. Spend on video games was significantly down, quite possibly reflecting the release of popular titles in the month leading up to wave 1.
The proportion of newspaper readers who spent nothing on these publications had increased since the last wave. In London this almost doubled (from 23% to 41%), highlighting the impact of the Evening Standard moving to a ‘free’ model.
Newspaper and magazine readers aged 16-34 continued to be considerably more likely to spend nothing on newspapers and magazines compared with the general population, suggesting this group are more prone to reading free sheets only or copies purchased by others.
As before, respondents had spent more time watchingTV in the past month than any of the other activities (29 hours), followed by listening to the radio (16 hours) and reading books (14 hours).
Next Accessing new media
Traditional vs. New Media: some comparisons
3D viewing FIFA World Cup 2010 viewing plans Betting
© 2010 KPMG LLP, a UK limited liability partnership, is a subsidiary of KPMG Europe LLP and a member firm of the KPMG network Time is Money - the digital dilemma continues 4 of independent member firms affiliated with KPMG International Cooperative, a Swiss entity. All rights reserved.

Social networking/blogging sites
Online news/RSS feeds
Online games
Used video on demand for TV
Downloaded music
Online magazines
Streamed online TV programmes
Streamed music
Streamed radio
50% 47%
36% 37%
27% 29%
24% 19%
21% 22%
17% 17%
16% 14%
16% 16%
14% 15%
21% Wave 2 (Mar 2010) None of these
22% Wave 1 (Sept 2009)
Accessing new media
Please indicate which if any of the following activities you have done in the past month? (new media)
*Note: means calculated from a base of less than 50 cases have not been quoted.
Previous
Prefer accessing online or offline?
Accessing more media now?
Currently paying for online content?
Introduction Accessing traditional media
5 Time is Money - the digital dilemma continues © 2010 KPMG LLP, a UK limited liability partnership, is a subsidiary of KPMG Europe LLP and a member firm of the KPMG network of independent member firms affiliated with KPMG International Cooperative, a Swiss entity. All rights reserved.

Four-fifths (79%) had engaged in one or more of the listed new media activities in the past month. No significant increase on wave 1.
Half had visited social networking/blogging sites.There had been an increase in use of video on demand forTV.
Overall, men were more likely to have engaged in activities than women (83%, 75%).
Those aged 16-24 tended to be more likely to engage in new media activities than their older counterparts.
A notable exception was accessing online news portals/RSS feeds, which was equally popular across groups.
Amongst those who had engaged in each of the listed new media activities, the highest* mean spend was on downloaded music (£4.26), as had been the case in the first wave.
Amongst those who had engaged in each of the activities, social networking/blogging and playing online games consumed the greatest amount of time (12 and 11 hours respectively).
Next Accessing new media
Traditional vs. New Media: some comparisons
3D viewing FIFA World Cup 2010 viewing plans Betting
© 2010 KPMG LLP, a UK limited liability partnership, is a subsidiary of KPMG Europe LLP and a member firm of the KPMG network Time is Money - the digital dilemma continues 6 of independent member firms affiliated with KPMG International Cooperative, a Swiss entity. All rights reserved.

Traditional vs.NewMedia: some comparisons Fewer people had engaged in new media activities than traditional (79 percent, 100 percent).
As we might expect, fewer people had engaged in new media activities than traditional (79%, 100%).The gap had not narrowed since the last wave.
Those aged 55 plus were less likely to have used new media than other age groups.There was also a significant divide in level of use between the 16-43s and 35+ groups.
People were around six times more likely to have watched traditionalTV than have streamedTV programmes (94%, 16%).They were also far more likely to have listened to traditional than streamed radio (79%, 14%) and read a print magazine than an online one (70%, 17%).
However,There had been an increase in the use of VOD forTV programmes. This online activity had increased from 19% of all respondents in September 2009 to 24% in March 2010.This increase occurred amongst all age groups, but was most marked amongst 18-24 year olds and 35-44 year olds.
There was a marked increase in the use of VOD services forTV shows amongst men.There was only a slight increase amongst women - In September 2009, 15% of women respondents said that they had used VOD services forTV programmes, whereas in March 2010, 17% of women respondents had said so.The comparable figures amongst male respondents was 22% increasing to 30%, 6 months later.
By March 2010, ABC1s had caught up with other social grades in the use of VOD services forTV programmes. In terms of social grade, there was a marked increase in the use of VOD services forTV shows amongst ABC1s. There was only a slight increase amongst C2DEs - In September 2009,
Previous
Prefer accessing online or offline?
Accessing more media now?
Currently paying for online content?
Introduction Accessing traditional media
7 Time is Money - the digital dilemma continues © 2010 KPMG LLP, a UK limited liability partnership, is a subsidiary of KPMG Europe LLP and a member firm of the KPMG network of independent member firms affiliated with KPMG International Cooperative, a Swiss entity. All rights reserved.

21% of C2DE respondents said that they had used VOD services forTV programmes, whereas in March 2010, 23% of this social grade had said so. The comparable figures amongst ABC1 respondents was 17% increasing to 24%, 6 months later.
There had only been a slight increase in the use of streaming of services for TV programmes – increasing from 14% of all respondents in September 2009 to 16% in March 2010.This increase occurred amongst all age groups, but was once again (as with the use of VOD services forTV shows) most marked amongst 18-24 year olds; 35-44 year olds; and, amongst male respondents.
There seemed to be most change in online behaviour amongst the 18-24 year old age group over the past 6 months, as the use of VOD services for audio visual increased above average.The use of VOD for film increased slightly amongst all respondents from 3% in September 2009 to 4% in March 2010. However, it more than doubled amongst the 18-24 age group, from 4% to 9%
The use of social networking / blogging sites has remained the online activity carried out by most respondents.This online activity had increased from 47% of all respondents in September 2009 to 50% in March 2010.The increase amongst the 45-54 age groups was the greatest, increasing from 37% to 45%.
Predictably, male respondents continued to view sporting events online at much higher levels than women.The difference between the sexes continued to be around 17% versus 3% in favour of males for this online activity.
Next Accessing new media
3D viewing FIFA World Cup 2010 viewing plans Betting
Traditional vs. New Media: some comparisons
© 2010 KPMG LLP, a UK limited liability partnership, is a subsidiary of KPMG Europe LLP and a member firm of the KPMG network Time is Money - the digital dilemma continues 8 of independent member firms affiliated with KPMG International Cooperative, a Swiss entity. All rights reserved.
Consumption of media without paying had increased in prevalence in both online and traditional formats since the last wave.
For example, 19% of print magazine consumers said they had paid nothing for these over the past month compared with 12% in the first wave. Newspapers: 21% compared with 15% the first wave.
Consumers of new media continued to be several times more likely to say they had spent nothing on these activities than consumers of similar types of traditional media.The 19% of respondents who had read print magazines said they spent nothing on this compared with four-fifths (85%) of online magazine readers. A similar story was evident for print newspapers compared with online news portals (21%, 88%).
Amongst those who had engaged with traditionalTV, streamedTV, traditional radio and streamed radio, mean spend over the past month tended to be much lower for new media.
Previous
Prefer accessing online or offline?
Accessing more media now?
Currently paying for online content?
Introduction Accessing traditional media
9 Time is Money - the digital dilemma continues © 2010 KPMG LLP, a UK limited liability partnership, is a subsidiary of KPMG Europe LLP and a member firm of the KPMG network of independent member firms affiliated with KPMG International Cooperative, a Swiss entity. All rights reserved.
Accessing more media now?
A majority of respondents agreed that the ability to access media online (e.g. newspapers music, video and radio) meant they now accessed more media than in the past: almost two-thirds (63%) agreed that they accessed more, while 14% disagreed. The proportion in agreement had increased since the last wave (when it stood at 58%).
Around four-fifths of those aged 16-34 agreed compared with just 45% of those aged 55 plus.
Men were significantly more likely to indicate they were accessing more media compared with their female counterparts (70%, 56%).
Next Accessing new media
3D viewing FIFA World Cup 2010 viewing plans Betting
Traditional vs. New Media: some comparisons
© 2010 KPMG LLP, a UK limited liability partnership, is a subsidiary of KPMG Europe LLP and a member firm of the KPMG network Time is Money - the digital dilemma continues 10 of independent member firms affiliated with KPMG International Cooperative, a Swiss entity. All rights reserved.
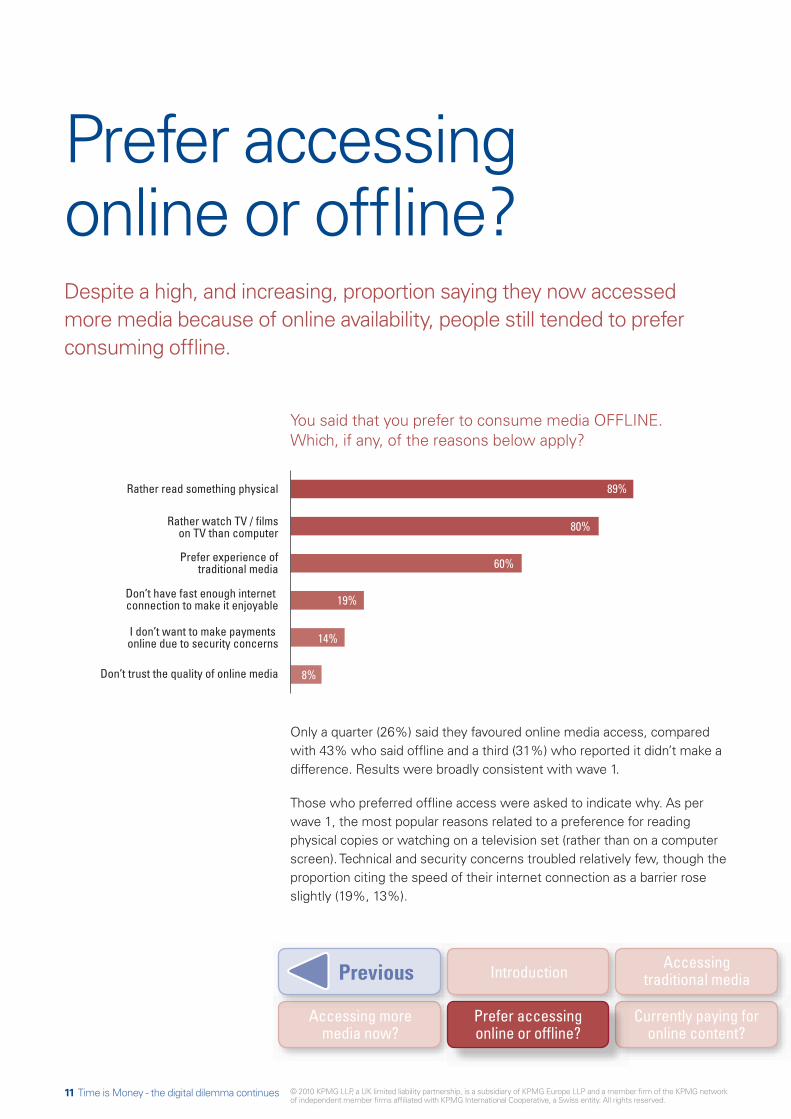
Prefer accessing online or offline? Despite a high, and increasing, proportion saying they now accessed more media because of online availability, people still tended to prefer consuming offline.
You said that you prefer to consume media OFFLINE. Which, if any, of the reasons below apply?
89%Rather read something physical
Rather watch TV / films on TV than computer 80%
Prefer experience of traditional media 60%
Don’t have fast enough internet connection to make it enjoyable 19%
I don’t want to make payments online due to security concerns 14%
Don’t trust the quality of online media 8%
Only a quarter (26%) said they favoured online media access, compared with 43% who said offline and a third (31%) who reported it didn’t make a difference. Results were broadly consistent with wave 1.
Those who preferred offline access were asked to indicate why. As per wave 1, the most popular reasons related to a preference for reading physical copies or watching on a television set (rather than on a computer screen). Technical and security concerns troubled relatively few, though the proportion citing the speed of their internet connection as a barrier rose slightly (19%, 13%).
Accessing more media now?
Previous
Currently paying for online content?
Introduction Accessing traditional media
Prefer accessing online or offline?
11 Time is Money - the digital dilemma continues © 2010 KPMG LLP, a UK limited liability partnership, is a subsidiary of KPMG Europe LLP and a member firm of the KPMG network of independent member firms affiliated with KPMG International Cooperative, a Swiss entity. All rights reserved.

You said that you prefer to consume media ONLINE. Which, if any, of the reasons below apply?
Can access content when I want
Can access the content I want for free online
Spend lots of time on my computer so more convenient
Easier to find content that I’m interested in
Wider choice of content online
More environmentally friendly
Can access the content I want at better price
80%
73%
63%
56%
31%
14%
Those who preferred online access were also asked for their reasons.
The most important reason, selected by around nine-in-ten (93%), was availability of ‘on-demand content’. This suggests the importance of convenience for consumers of online media. Access to free content was the second most important reason. Almost a third cited the environmental merits of online media consumption.
3D viewing FIFA World Cup 2010 viewing plans Betting
Next Accessing new media
Traditional vs. New Media: some comparisons
© 2010 KPMG LLP, a UK limited liability partnership, is a subsidiary of KPMG Europe LLP and a member firm of the KPMG network Time is Money - the digital dilemma continues 12 of independent member firms affiliated with KPMG International Cooperative, a Swiss entity. All rights reserved.
Currently paying for online content? One-in-ten (10%) currently pay for online content, unchanged from wave 1. Seven per cent pay for content when they want it and 3% subscribe.
Those aged 16 to 24 years were more likely to pay for online content than older age groups.
Of those accessing online news portals / RSS feeds, a majority of all respondents continued to pay nothing. Of concern to those aiming to introduce pay walls for online newspapers, was the fact that an increasing majority of respondents said that they paid nothing in March 2010 (88%) than in September 2009 (84%)
The average mean time spent accessing online news portals / RSS feeds had increased from 5.1 hours per month in September 2009 to 6.6 hours in March 2010.The increase was most marked amongst social grade ABC1, and 35-54 year olds.
There was a noticeable increase in the use of VOD services forTV programmes, and the streaming of onlineTV shows in the March 2010 survey when compared to September 2009.This probably reflects seasonal consumption patterns, as generally households watch more audio-visual programmes during October to March. Amongst those that used VOD services, the mean average in March 2010 was 6.2 hours over the past month, 1.5 hours more than those who used VOD services in September 2009.The rise was across the board, but most marked amongst 18-24 year olds
There was a noticeable increase in the playing of online games in the March 2010 survey when compared to September 2009. Once again this probably reflects seasonal consumption patterns.The increase was from an average of just over 9 hours played in the past month during the September 2009 survey to just over 11 hours played in the month during the March 2010 survey. The increase was most marked amongst C2DE social grade - an increase
Previous Introduction Accessing traditional media
Accessing more media now?
Prefer accessing online or offline?
Currently paying for online content?
13 Time is Money - the digital dilemma continues © 2010 KPMG LLP, a UK limited liability partnership, is a subsidiary of KPMG Europe LLP and a member firm of the KPMG network of independent member firms affiliated with KPMG International Cooperative, a Swiss entity. All rights reserved.
of around 4 hours and amongst the 45+ age group, also an increase of approximately 4 hours.
Our surveys found that increasingly more respondents paid nothing over the past month for social networking / blogging sites in March 2010 than in September 2009. Of those that said that they paid for social networking / blogging sites, the amount respondents said they paid, decreased markedly from £16.50 per month in September 2009 to £2.38 per month in March 2010.
In March 2010, the mean average number of hours that younger members of society (16-24 year olds) spent per month on social networking / blogging sites was around double the amount of time spent by older members (45+ aged groups). 18-24 year olds spent just over 18 hours per month in March 2010, whereas, 45-54 year olds spent around 8 hours per month.
There was no marked difference in the amount of hours spent per month on social networking / blogging sites between the sexes (around 12 hours per month). However, social grade C2DE spent more time per month than other social grades – just over 15 hours per month.This was also a marked increase since September 2009, when C2DEs had spent around 11.5 hours per month on social networking
People who did not currently pay for online content were asked whether they thought they would become a paid subscriber over the coming 12 months. In total, 10% indicated they would possibly become a paid subscriber while none indicated they would definitely do so.This suggests that the market for online subscriptions is unlikely to grow greatly over the coming 12 months.
What content would you be prepared to pay for? Those who were not currently paying for online content but thought they would possibly / definitely become a paid subscriber over the coming 12 months were asked what they would be prepared to pay for.
As per wave 1, people were most commonly prepared to pay for music (55%) and film (45%).They were less prepared to pay for TV (30%) and online newspapers/magazines (31%).
FIFA World Cup 2010 viewing plans Betting
Next Accessing new media
Traditional vs. New Media: some comparisons
3D viewing
© 2010 KPMG LLP, a UK limited liability partnership, is a subsidiary of KPMG Europe LLP and a member firm of the KPMG network Time is Money - the digital dilemma continues 14 of independent member firms affiliated with KPMG International Cooperative, a Swiss entity. All rights reserved.
3D viewing
With 3D films andTV becoming more prevalent this year, respondents were asked about their viewing habits and opinions on this growing medium.
More than a quarter (27%) of respondents had viewed a 3D film at the cinema during the past 12 months. This rose to 42% amongst the 18-24s and 45% amongst the 25-34s. By contrast, only 29% of 35-44s, 19% of 45-54s and 12% of those aged 55+ had viewed such films at the cinema.
5% had watched a 3D film on TV. Gender and social grade had no impact on likelihood to watch 3D films either at the cinema or at home.
Despite fairly high levels of 3D viewing, relatively few indicated they were likely to buy a 3D TV next time they purchase a television set (15%).
Amongst those who said they were unlikely to buy a 3D TV, almost two-thirds (63%) indicated they did not see the need and 59% expected it to be too expensive.
Interestingly, four-in-ten (41%) thought 3D TV was a gimmick.
Only a quarter indicated they would prefer to watch TV in 3D if it was available, with a third (33%) saying they would not and 42% unsure. Levels of uncertainty suggest that little is known about 3DTV. Appetite for 3DTV was higher amongst younger age-groups, males and lower socio-economic groups.
Previous Introduction Accessing traditional media
Accessing more media now?
Prefer accessing online or offline?
Currently paying for online content?
15 Time is Money - the digital dilemma continues © 2010 KPMG LLP, a UK limited liability partnership, is a subsidiary of KPMG Europe LLP and a member firm of the KPMG network of independent member firms affiliated with KPMG International Cooperative, a Swiss entity. All rights reserved.

You said you were unlikely to purchase a 3D television next time you buy a TV. Why is this?
Don’t see the need 63%
Likely to be too expensive 59%
I don’t like the idea of wearing the 3D glasses 49%
It’s a gimmick 41%
Lack of programmes available 33%
Will wait for improved version to be launched 19%
Quality likely to be poor 12%
None of these 4%
Not sure 0%
Next Accessing new media
Traditional vs. New Media: some comparisons
Betting 3D viewing FIFA World Cup 2010 viewing plans
© 2010 KPMG LLP, a UK limited liability partnership, is a subsidiary of KPMG Europe LLP and a member firm of the KPMG network Time is Money - the digital dilemma continues 16 of independent member firms affiliated with KPMG International Cooperative, a Swiss entity. All rights reserved.

FIFAWorld Cup 2010 viewing plans
FIFA World Cup 2010 in 3D Amongst those who plan to watch World Cup games, 39% indicated they would watch games in 3D if it were an option (with a further 29% unsure).
This suggests a substantial potential market exists.
This summer’s FIFA World Cup will be a viewing favourite with over half (53%) planning to watch games this summer, with a further 8% unsure. Men were more likely to say they would watch than women (66%, 40%).
Respondents were asked to indicate the locations in which they expect to view the games. Among those who plan to watch, the vast majority plan to watch some games at home (94%). Around half (48%) said they would watch some games at the pub. The number of us who plan to view any games on our computer or smart phone are much lower.
You said that you intend to watch some of the FIFA World Cup this summer. Where do you expect to watch these?
On TV at home/friend’s home
At pub
On computer at home/friend’s home
On my smartphone
At cinema
94%
48%
7%
1%
1%
Previous Introduction Accessing traditional media
Accessing more media now?
Prefer accessing online or offline?
Currently paying for online content?
17 Time is Money - the digital dilemma continues © 2010 KPMG LLP, a UK limited liability partnership, is a subsidiary of KPMG Europe LLP and a member firm of the KPMG network of independent member firms affiliated with KPMG International Cooperative, a Swiss entity. All rights reserved.

Betting
More than half (56%) had placed a bet on a sporting event in the past. This was higher for men than women (63%, 49%).
Amongst these, over a third (36%) had placed a bet online. Again this was more prevalent amongst men than women (44%, 27%).
Amongst the whole population, 12% indicated they plan to place a bet on the forthcoming World Cup. Around three quarters (76%) said they did not plan to place any bets on the tournament. One-in-twenty-five (4%) were unsure.
Those who said they were likely to place bets on the tournament were asked the ways in which they plan to do so.The most popular method was online, 60% indicated they planned to place some bets online, 57% said they would place some at the bookmaker and 3% via telephone.
Next Accessing new media
Traditional vs. New Media: some comparisons
Betting 3D viewing FIFA World Cup 2010 viewing plans
© 2010 KPMG LLP, a UK limited liability partnership, is a subsidiary of KPMG Europe LLP and a member firm of the KPMG network Time is Money - the digital dilemma continues 18 of independent member firms affiliated with KPMG International Cooperative, a Swiss entity. All rights reserved.

kpmg.co.uk Previous
Contacts David Elms Partner, Head of Media
Tel: +44 (0)20 7311 8568 E mail: [email protected]
Claire Le Masurier PR Manager
Tel: +44 (0)20 7694 8639 E mail: [email protected]
The information contained herein is of a general nature and is not intended to address the circumstances of any particular individual or entity. Although we endeavour to provide accurate and timely information, there can be no guarantee that such information is accurate as of the date it is received or that it will continue to be accurate in the future. No one should act on such information without appropriate professional advice after a thorough examination of the particular situation.
© 2010 KPMG LLP, a UK limited liability partnership, is a subsidiary of KPMG Europe LLP and a member firm of the KPMG network of independent member firms affiliated with KPMG International Cooperative, a Swiss entity. All rights reserved. KPMG and the KPMG logo are registered trademarks of KPMG International Cooperative, a Swiss entity. Designed and produced by KPMG LLP (UK)’s Design Services Publication name: New vs. Traditional Media Publication number: RRD-193125 Publication date: April 2010