KPI Benchmarking Scotland - Evaluations Online
31
KPI Benchmarking Scotland Stage 1: Research on current construction performance KPIs Prepared for: Richard Howard, Scottish Enterprise Date: 27 April 2017 Report Number: P105130-1000 Issue: 2 BRE Watford, Herts WD25 9XX Customer Services 0333 321 8811 From outside the UK: T + 44 (0) 1923 664000 F + 44 (0) 1923 664010 E [email protected] www.bre.co.uk Prepared for: Richard Howard Project Manager Scottish Enterprise Atrium Court 50 Waterloo Street Glasgow G2 6HQ
Transcript of KPI Benchmarking Scotland - Evaluations Online
KPI Benchmarking Scotland
Stage 1: Research on current construction performance KPIs
Prepared for: Richard Howard, Scottish Enterprise
Date: 27 April 2017
Report Number: P105130-1000 Issue: 2
BRE Watford, Herts WD25 9XX Customer Services 0333 321 8811 From outside the UK: T + 44 (0) 1923 664000 F + 44 (0) 1923 664010 E [email protected] www.bre.co.uk
Prepared for: Richard Howard Project Manager Scottish Enterprise Atrium Court 50 Waterloo Street Glasgow G2 6HQ

Construction KPIs Scotland
Commercial in Confidence
Template Version V2-082014
© Building Research Establishment Ltd
Report No. P105130-1000
Page 1 of 30
This report is made on behalf of Building Research Establishment Ltd. (BRE) and may only be distributed in its entirety, without amendment, and with attribution to BRE to the extent permitted by the terms and conditions of the contract. BRE’s liability in respect of this report and reliance thereupon shall be as per the terms and conditions of contract with the client and BRE shall have no liability to third parties to the extent permitted in law.
Prepared by
Name Paul Cartwright and Maggie Blackwell
Position Principal Consultant and Senior Consultant
Date 24 April 2017
Signature
Authorised by
Name Simon Cross
Position Director
Date 27 April 2017
Signature
Construction KPIs Scotland
Commercial in Confidence
Template Version V2-082014
© Building Research Establishment Ltd
Report No. P105130-1000
Page 2 of 30
Construction Performance has been identified as a key goal for both the Scottish and UK governments as outlined in the UK Government’s industrial strategy for construction.1 Construction Performance is currently measured through a number of different measures ranging from quality and programme through to community engagement and customer satisfaction. Further indicators are measured by a consortium of organisations featuring Construction Excellence and Glenigan, both of which have played a significant role in developing and implementing effective KPI’s across the construction sector.
In the first half of 2016, Scottish Enterprise approached BRE to understand what is currently in the marketplace in terms of Performance KPI’s so that they could identify what and how construction Performance can be improved across Scotland in future years.
BRE, Constructing Excellence and Glenigan completed a workshop to explore a potential Construction Performance framework for Scotland. Following the meeting a request was made by Scottish Enterprise to scope the potential key performance indicators by researching the requirements of the Scottish market place and the currently available KPI’s measured by the construction sectors.
This report provides an overview of the KPIs currently used in the sector, feedback from users of KPIs on the implementation of KPIs, current international application of KPIs and mapping and categorisation of KPIs to inform the creation of a foundation for the Scottish construction sector.
The key findings are:
• There is a core of KPIs currently used extensively across the sector. These include: § Health and safety – accident frequency rates (AFR) and accident incident rates
(AIR) § Environmental KPIs – waste to landfill § Economic KPIs – predictability in time and cost and client satisfaction
• There are other performance indicators and metrics that look into further detail of the performance including those comparing contract type and those of construction efficiency and quality. These are sometimes only reporting on internally with companies and standardised methods and reporting systems used across the industry are not in place.
• From the feedback gathered from the sector, a separate set of KPIs for Scotland was not considered of value from most respondents. The users, most from large contractors, were using the KPIs available and did not see a need for additional KPIs.
• The KPIs that are of value to companies do vary according to the size of the company and the type of clients they are working for. Smaller companies only have a limited to resource to commit so have to be very focused on what is critical to report. This is influenced by what clients want, for example when tendering for new work. Larger companies will report on a more diverse set of KPIs and have a greater need to compare across regions or even countries but again are usage is influenced by what their clients’ requirements are.
1 HM Government, 2013, Construction 2025 - Industrial Strategy: government and industry in partnership, HM Government, London.
Executive Summary

Construction KPIs Scotland
Commercial in Confidence
Template Version V2-082014
© Building Research Establishment Ltd
Report No. P105130-1000
Page 3 of 30
• There are KPIs being developed to address key industry drivers such as productivity. The Construction Leadership Council (CLC) is leading the industry engagement to inform development of some of these potential KPIs and these should be considered when considering KPIs for the construction sector in Scotland.
• The types of KPIs used outside of the UK are similar to those used in the UK. A number of organisations are already using KPIs aligned to UK metrics through the Constructing Excellence Alliance. Again, KPIs in Scotland that are internationally relevant would benefit companies working across borders.
• A framework for Scotland should focus on building on a core set of KPIs users already use to encourage continued usage rather than introducing KPIs that would require additional investment by users. There is already a lot of data being collected and there are tools to do a lot of this data collection so this should be utilised further for ease of collection and reporting. However, flexibility to allow for expansion of the set of KPI should be provided.
• A portal for projects in Scotland that is simple to import data into and integrated or compatible with data portals for the rest of the UK and beyond would provide a valuable resource for understanding the Scottish construction sector performance but in the context of the UK as a whole and with other countries outside of the UK.
Construction KPIs Scotland
Commercial in Confidence
Template Version V2-082014
© Building Research Establishment Ltd
Report No. P105130-1000
Page 4 of 30
Table of Contents
1 Description of the project 5
Work Programme 5
Collection of Readily Available Data 5 Consultation with Industry 6 International Data Collection 6 Mapping and Benefit Analysis 6
2 Desktop Review of Current KPIs 7
Data sources 7
Reporting on KPIs 7
Types of Indicators 9
Economic Indicators 9 Environmental Indicators 11 Health and Safety KPIs 15 Respect for People KPIs 16 New KPIs 16
Gaps in current performance measurement and the future reporting on performance 17
Integrated hubs for data collection, analysis and benchmarking performance 19
3 Industry Feedback 20 International KPIs 21 Conclusions and Recommendations 24 References 27 Appendix A SmartWaste 28 Appendix B YellowJacket 29
Construction KPIs Scotland
Commercial in Confidence
Template Version V2-082014
© Building Research Establishment Ltd
Report No. P105130-1000
Page 5 of 30
1 Description of the project
Scottish Enterprise intend to implement a framework for construction clients and the supply chain in Scotland. The framework will: • Standardise relevant Construction Performance KPI’s for the Scottish Market • Implement the requirement and benefits of measuring and improving on key measures for the
Construction market • Measure the KPI’s consistently • Benchmark organisations and projects In order to complete the wider framework goals, Scottish Enterprise have asked BRE to understand the following: • What current KPI’s are collected and who holds and maintains the data? • What additional data do we require and how much will it cost? • How can we create data that is not subject to continuous funding? • How will we stimulate take up by the sector? • Suggestions on how the data will be maintained and funded in the future The UK are world class at focusing on Construction improvement, however this sector continues to lag behind other sectors. Our initial piece of work will focus on capturing best practice information related to KPI Benchmarking systems. The definition for construction KPI’s is wide for this work, including economic, environmental and performance criteria. The work programme consists of four key stages:
• Stage 1: Research current construction KPIs used in Scotland • Stage 2: KPI development and selection • Stage 3: Market sector stimulation research • Stage 4: Development of a business model for continuous funding
The focus of this report is on the work completed for stage 1. The programme of works for this phase is outlined below.
Work Programme Initial research into the current construction Performance KPI’s used will be carried out through a desktop based study. Drawing on existing knowledge and through industry consultation, this study will identify current best practice across the United Kingdom and internationally.
Collection of Readily Available Data
Performance KPI and benchmarking data that is readily available will be collated with further reviews of data that is available within the public domain. This will be collected via online platforms such as Government Databases, Client / Framework Websites and Publications, Consultancy Data and Industry Leading Bodies.
Construction KPIs Scotland
Commercial in Confidence
Template Version V2-082014
© Building Research Establishment Ltd
Report No. P105130-1000
Page 6 of 30
Consultation with Industry
Gaps within the data will be identified and filled through direct consultation with industry. Willing participants will be interviewed via telephone or direct meetings and asked to provide information on Performance KPI’s used and to provide feedback on how successful the implementation of these have been. It is envisaged that consultations will be undertaken with leading clients, contractors, house builders and industry specific benchmarking clubs.
International Data Collection
In order to complete the collection of KPI and benchmarking data it is important that any best practise internationally is identified. This data will be captured through consultation with organisations who have an existing relationship with the research parties and who are willing to participate in the study. Furthermore, online research and the review of previous research publications will be carried out. International data collection will primarily be aimed at the European, Americas and Far Eastern countries.
Mapping and Benefit Analysis
All collected KPI and benchmarking data will be mapped and categorised in accordance with current industry data collection terminology. Key to this activity is the filtering of what has worked and what has not, and how this could be applied to the Scottish construction industry. Data will be analysed to understand the benefit of implementation against the ease of collection methods allowing for a foundation to be created and used within stage 2.
Construction KPIs Scotland
Commercial in Confidence
Template Version V2-082014
© Building Research Establishment Ltd
Report No. P105130-1000
Page 7 of 30
2 Desktop Review of Current KPIs
The availability and use of various KPIs was investigated by using BRE’s existing knowledge of KPIs, including the running of online platforms for collecting data as well as desk based research on government reports and data, consultancy reports and industry data.
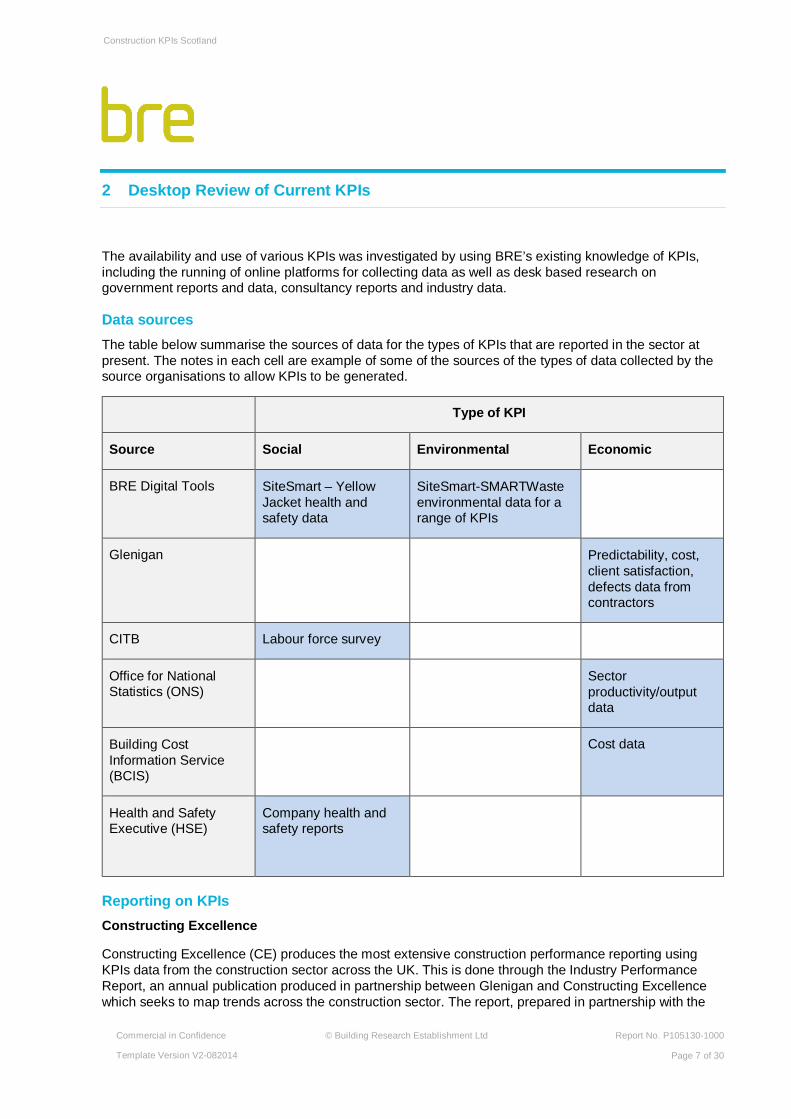
Data sources The table below summarise the sources of data for the types of KPIs that are reported in the sector at present. The notes in each cell are example of some of the sources of the types of data collected by the source organisations to allow KPIs to be generated.
Type of KPI
Source Social Environmental Economic
BRE Digital Tools SiteSmart – Yellow Jacket health and safety data
SiteSmart-SMARTWaste environmental data for a range of KPIs
Glenigan Predictability, cost, client satisfaction, defects data from contractors
CITB Labour force survey
Office for National Statistics (ONS)
Sector productivity/output data
Building Cost Information Service (BCIS)
Cost data
Health and Safety Executive (HSE)
Company health and safety reports
Reporting on KPIs Constructing Excellence
Constructing Excellence (CE) produces the most extensive construction performance reporting using KPIs data from the construction sector across the UK. This is done through the Industry Performance Report, an annual publication produced in partnership between Glenigan and Constructing Excellence which seeks to map trends across the construction sector. The report, prepared in partnership with the
Construction KPIs Scotland
Commercial in Confidence
Template Version V2-082014
© Building Research Establishment Ltd
Report No. P105130-1000
Page 8 of 30
Construction Industry Training Board (CITB) and endorsed by the Department of Business, Energy and Industrial Strategy (BEIS) and Constructing Excellence, maps trends and sets benchmarks across the construction sector. The report uses Construction Key Performance Indicators (KPIs) have become a mainstay of the industry since their initial development in 1998.
Most central government projects and all local authority frameworks, plus all the large infrastructure projects in the UK use the CE standard KPI metrics. The KPIs are used my many of the large private sector developers and large contractors.
CE operate in most areas and regions of the UK and runs a number of benchmarking clubs. These do not currently operate in Scotland though.
Glenigan
Glenigan is a provider of construction and industry analysis for clients operating in the sector. The company with its regular contact to thousands of construction companies collates the KPI data from surveys of construction clients, contractors, sub-contractors and consultants, covering issues such as client satisfaction, profitability, safety and environmental protection. The data is a collated of data from thousands of projects completed during the preceding year.
BRE Digital Tools
BRE runs the SiteSmart data and information hub which includes the SmartWaste tool to monitor and report on environmental impacts and the YellowJacket tool to report on health and safety impacts. These tools provide a means to collect data for a number of KPIs. The SmartWaste tool currently provides one of the most extensive sources of environmental performance data in the United Kingdom. This includes waste data KPIs as well as water and energy usage on construction sites, responsible sourcing of materials and transport impacts of the construction process. SMARTWaste data is used to support the reporting in the Industry Performance Report related to the environmental performance of the construction process. SmartWaste is a membership scheme and the data used to produce KPIs is based on information recorded by the construction project personnel. Membership includes benchmark reports so that companies can see how they are performing relative to the rest of the sector.
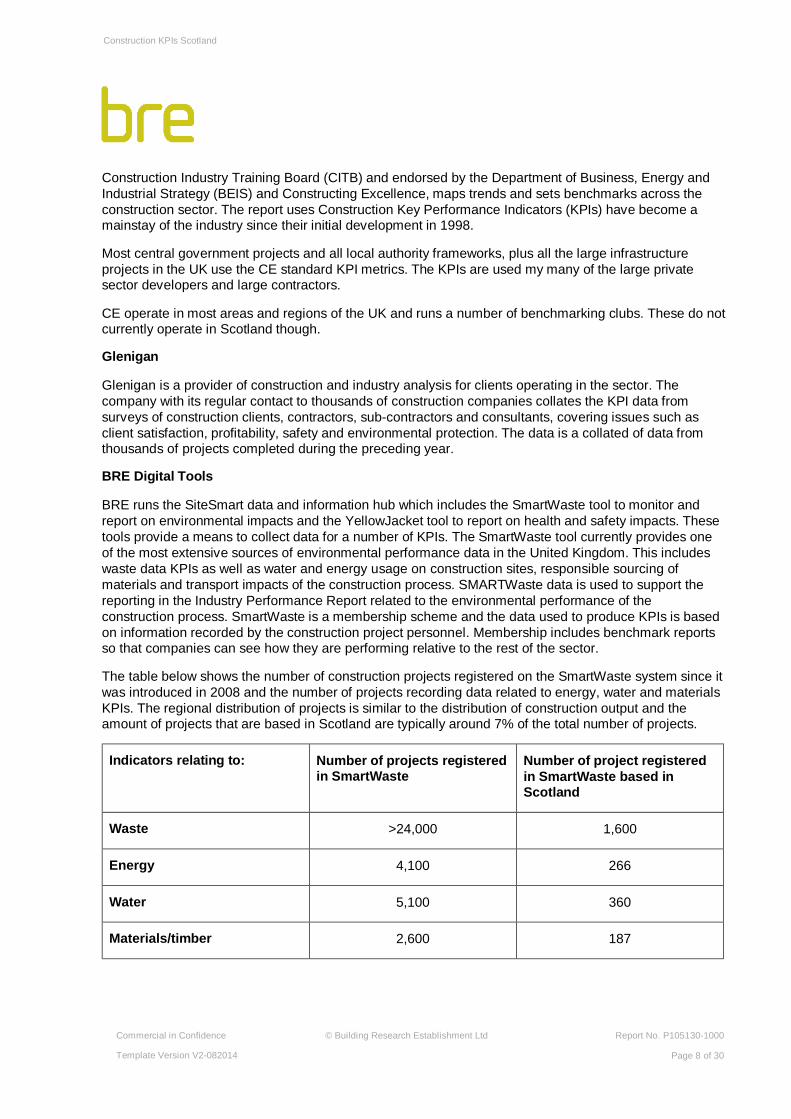
The table below shows the number of construction projects registered on the SmartWaste system since it was introduced in 2008 and the number of projects recording data related to energy, water and materials KPIs. The regional distribution of projects is similar to the distribution of construction output and the amount of projects that are based in Scotland are typically around 7% of the total number of projects.
Indicators relating to: Number of projects registered in SmartWaste
Number of project registered in SmartWaste based in Scotland
Waste >24,000 1,600
Energy 4,100 266
Water 5,100 360
Materials/timber 2,600 187
Construction KPIs Scotland
Commercial in Confidence
Template Version V2-082014
© Building Research Establishment Ltd
Report No. P105130-1000
Page 9 of 30
Types of Indicators The types of indicators and the specific indicators are detailed further in this section. The use of KPI varies across type and specific KPI. The most widely used KPI in the industry at present are:
• Health and safety – injuries and accidents • Predictability of cost • Predictability of time • Client satisfaction • Waste going to landfill
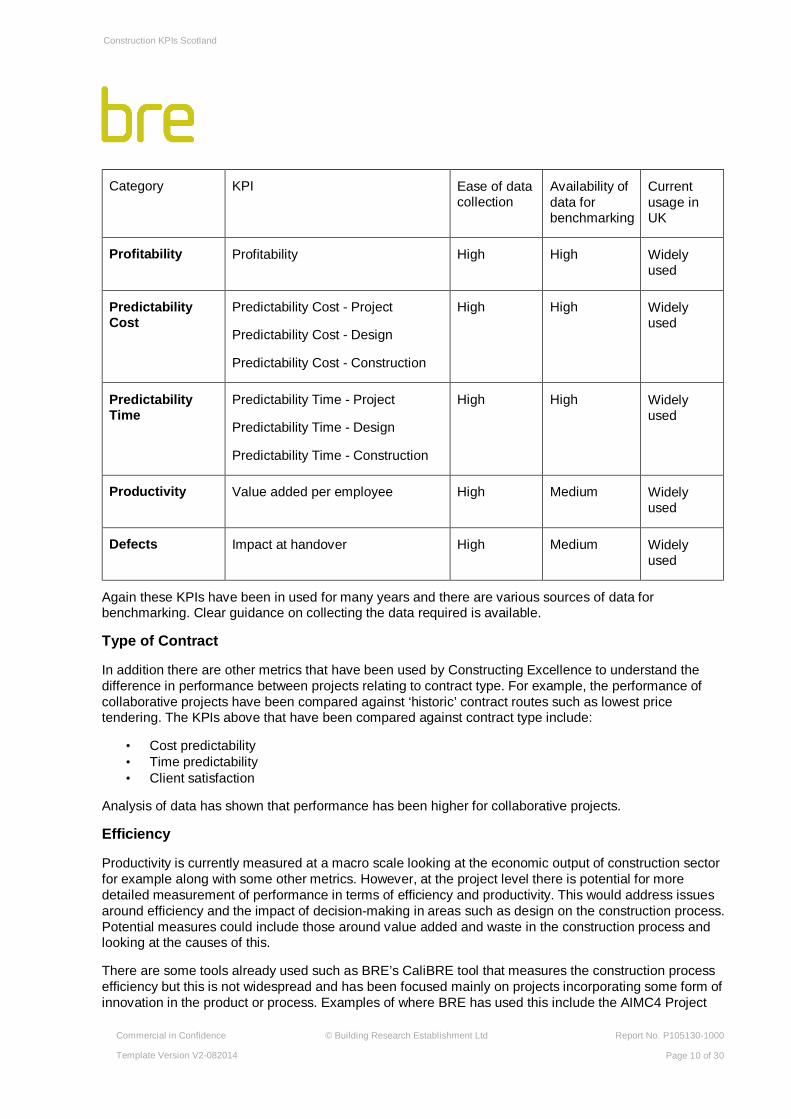
Economic Indicators
Economic indicators report on client satisfaction, contractor satisfaction, profitability and predictability.
Client and contractor satisfaction
Category KPI Ease of data collection
Availability of data for benchmarking
Current usage in the UK
Client satisfaction
Client Satisfaction - Product
Client Satisfaction - Service
Client Satisfaction - Value for Money
Medium High Widely used
Contractor satisfaction
Contractor Satisfaction
-Performance - Overall
Contractor Satisfaction
-Provision of Information - Overall
Contractor Satisfaction
-Payment Overall
Medium High Widely used
Many of the economic KPIs have been in use for several years and guidance on collecting data is available2 and there are several years’ data available for benchmarking performance. Data for client and contractor satisfaction is collected by carrying out surveys and results are given as a score from 1-10.
2 KPI Report for The Minister for Construction by The KPI Working Group, January 2000, https://www.gov.uk/government/uploads/system/uploads/attachment_data/file/16323/file16441.pdf
Construction KPIs Scotland
Commercial in Confidence
Template Version V2-082014
© Building Research Establishment Ltd
Report No. P105130-1000
Page 10 of 30
Category KPI Ease of data collection
Availability of data for benchmarking
Current usage in UK
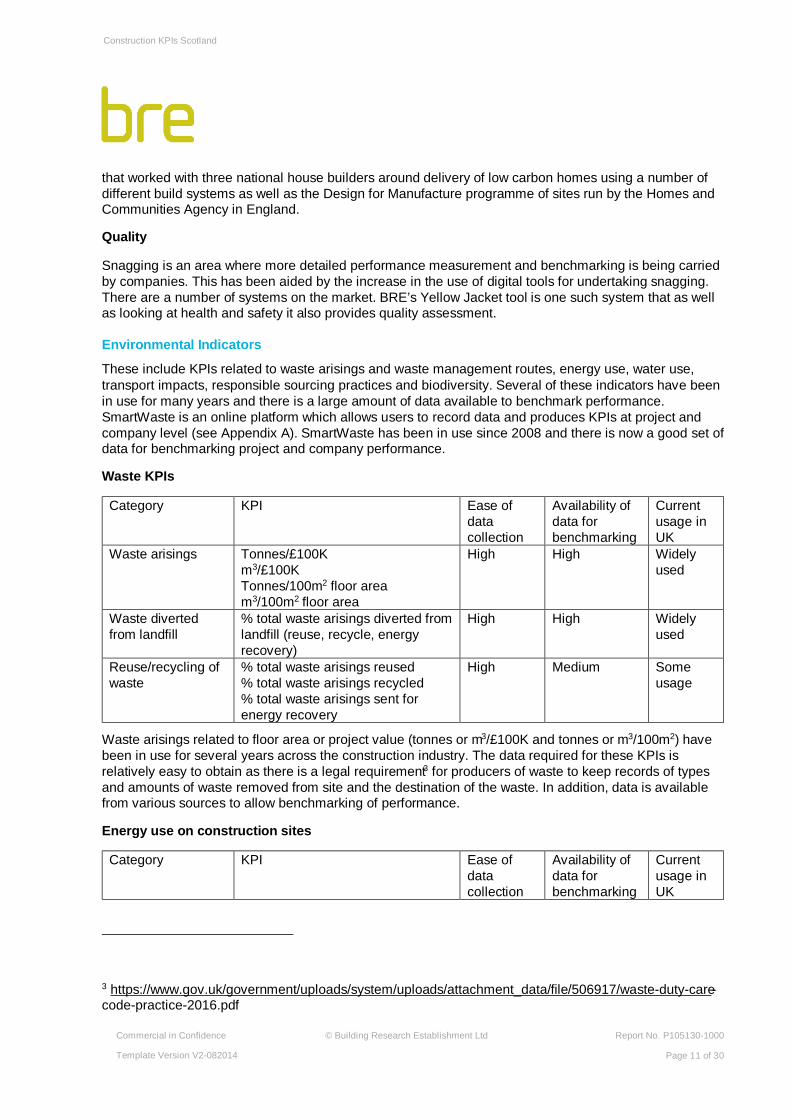
Profitability Profitability High High Widely used
Predictability Cost
Predictability Cost - Project
Predictability Cost - Design
Predictability Cost - Construction
High High Widely used
Predictability Time
Predictability Time - Project
Predictability Time - Design
Predictability Time - Construction
High High Widely used
Productivity Value added per employee High Medium Widely used
Defects Impact at handover High Medium Widely used
Again these KPIs have been in used for many years and there are various sources of data for benchmarking. Clear guidance on collecting the data required is available.
Type of Contract
In addition there are other metrics that have been used by Constructing Excellence to understand the difference in performance between projects relating to contract type. For example, the performance of collaborative projects have been compared against ‘historic’ contract routes such as lowest price tendering. The KPIs above that have been compared against contract type include:
• Cost predictability • Time predictability • Client satisfaction
Analysis of data has shown that performance has been higher for collaborative projects.
Efficiency
Productivity is currently measured at a macro scale looking at the economic output of construction sector for example along with some other metrics. However, at the project level there is potential for more detailed measurement of performance in terms of efficiency and productivity. This would address issues around efficiency and the impact of decision-making in areas such as design on the construction process. Potential measures could include those around value added and waste in the construction process and looking at the causes of this.
There are some tools already used such as BRE’s CaliBRE tool that measures the construction process efficiency but this is not widespread and has been focused mainly on projects incorporating some form of innovation in the product or process. Examples of where BRE has used this include the AIMC4 Project
Construction KPIs Scotland
Commercial in Confidence
Template Version V2-082014
© Building Research Establishment Ltd
Report No. P105130-1000
Page 11 of 30
that worked with three national house builders around delivery of low carbon homes using a number of different build systems as well as the Design for Manufacture programme of sites run by the Homes and Communities Agency in England.
Quality
Snagging is an area where more detailed performance measurement and benchmarking is being carried by companies. This has been aided by the increase in the use of digital tools for undertaking snagging. There are a number of systems on the market. BRE’s Yellow Jacket tool is one such system that as well as looking at health and safety it also provides quality assessment.
Environmental Indicators
These include KPIs related to waste arisings and waste management routes, energy use, water use, transport impacts, responsible sourcing practices and biodiversity. Several of these indicators have been in use for many years and there is a large amount of data available to benchmark performance. SmartWaste is an online platform which allows users to record data and produces KPIs at project and company level (see Appendix A). SmartWaste has been in use since 2008 and there is now a good set of data for benchmarking project and company performance.
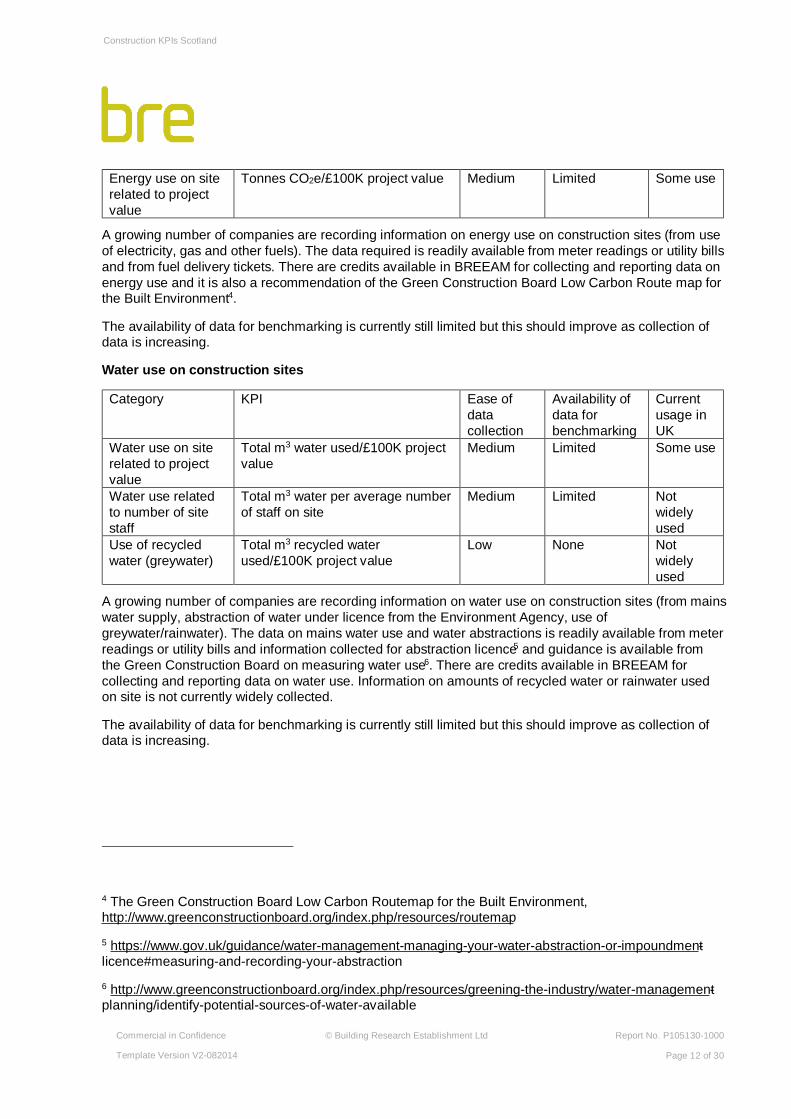
Waste KPIs
Category KPI Ease of data collection
Availability of data for benchmarking
Current usage in UK
Waste arisings Tonnes/£100K m3/£100K Tonnes/100m2 floor area m3/100m2 floor area
High High Widely used
Waste diverted from landfill
% total waste arisings diverted from landfill (reuse, recycle, energy recovery)
High High Widely used
Reuse/recycling of waste
% total waste arisings reused % total waste arisings recycled % total waste arisings sent for energy recovery
High Medium Some usage
Waste arisings related to floor area or project value (tonnes or m3/£100K and tonnes or m3/100m2) have been in use for several years across the construction industry. The data required for these KPIs is relatively easy to obtain as there is a legal requirement3 for producers of waste to keep records of types and amounts of waste removed from site and the destination of the waste. In addition, data is available from various sources to allow benchmarking of performance.
Energy use on construction sites
Category KPI Ease of data collection
Availability of data for benchmarking
Current usage in UK
3 https://www.gov.uk/government/uploads/system/uploads/attachment_data/file/506917/waste-duty-care-code-practice-2016.pdf
Construction KPIs Scotland
Commercial in Confidence
Template Version V2-082014
© Building Research Establishment Ltd
Report No. P105130-1000
Page 12 of 30
Energy use on site related to project value
Tonnes CO2e/£100K project value
Medium Limited Some use
A growing number of companies are recording information on energy use on construction sites (from use of electricity, gas and other fuels). The data required is readily available from meter readings or utility bills and from fuel delivery tickets. There are credits available in BREEAM for collecting and reporting data on energy use and it is also a recommendation of the Green Construction Board Low Carbon Route map for the Built Environment4.
The availability of data for benchmarking is currently still limited but this should improve as collection of data is increasing.
Water use on construction sites
Category KPI Ease of data collection
Availability of data for benchmarking
Current usage in UK
Water use on site related to project value
Total m3 water used/£100K project value
Medium Limited Some use
Water use related to number of site staff
Total m3 water per average number of staff on site
Medium Limited Not widely used
Use of recycled water (greywater)
Total m3 recycled water used/£100K project value
Low None Not widely used
A growing number of companies are recording information on water use on construction sites (from mains water supply, abstraction of water under licence from the Environment Agency, use of greywater/rainwater). The data on mains water use and water abstractions is readily available from meter readings or utility bills and information collected for abstraction licence5 and guidance is available from the Green Construction Board on measuring water use6. There are credits available in BREEAM for collecting and reporting data on water use. Information on amounts of recycled water or rainwater used on site is not currently widely collected.
The availability of data for benchmarking is currently still limited but this should improve as collection of data is increasing.
4 The Green Construction Board Low Carbon Routemap for the Built Environment, http://www.greenconstructionboard.org/index.php/resources/routemap
5 https://www.gov.uk/guidance/water-management-managing-your-water-abstraction-or-impoundment-licence#measuring-and-recording-your-abstraction
6 http://www.greenconstructionboard.org/index.php/resources/greening-the-industry/water-management-planning/identify-potential-sources-of-water-available
Construction KPIs Scotland
Commercial in Confidence
Template Version V2-082014
© Building Research Establishment Ltd
Report No. P105130-1000
Page 13 of 30
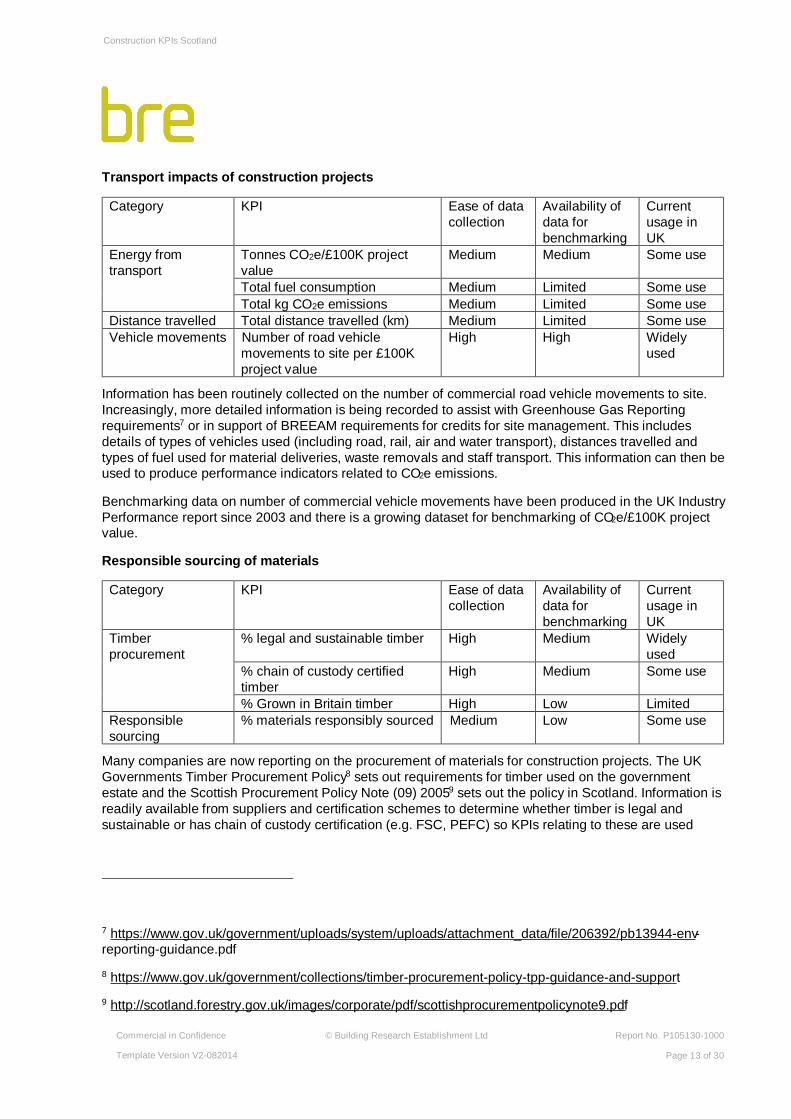
Transport impacts of construction projects
Category KPI Ease of data collection
Availability of data for benchmarking
Current usage in UK
Energy from transport
Tonnes CO2e/£100K project value
Medium Medium Some use
Total fuel consumption Medium Limited Some use Total kg CO2e emissions Medium Limited Some use
Distance travelled Total distance travelled (km) Medium Limited Some use Vehicle movements Number of road vehicle
movements to site per £100K project value
High High Widely used
Information has been routinely collected on the number of commercial road vehicle movements to site. Increasingly, more detailed information is being recorded to assist with Greenhouse Gas Reporting requirements7 or in support of BREEAM requirements for credits for site management. This includes details of types of vehicles used (including road, rail, air and water transport), distances travelled and types of fuel used for material deliveries, waste removals and staff transport. This information can then be used to produce performance indicators related to CO2e emissions.
Benchmarking data on number of commercial vehicle movements have been produced in the UK Industry Performance report since 2003 and there is a growing dataset for benchmarking of CO2e/£100K project value.
Responsible sourcing of materials
Category KPI Ease of data collection
Availability of data for benchmarking
Current usage in UK
Timber procurement
% legal and sustainable timber High Medium Widely used
% chain of custody certified timber
High Medium Some use
% Grown in Britain timber High Low Limited Responsible sourcing
% materials responsibly sourced Medium Low Some use
Many companies are now reporting on the procurement of materials for construction projects. The UK Governments Timber Procurement Policy8 sets out requirements for timber used on the government estate and the Scottish Procurement Policy Note (09) 20059 sets out the policy in Scotland. Information is readily available from suppliers and certification schemes to determine whether timber is legal and sustainable or has chain of custody certification (e.g. FSC, PEFC) so KPIs relating to these are used
7 https://www.gov.uk/government/uploads/system/uploads/attachment_data/file/206392/pb13944-env-reporting-guidance.pdf
8 https://www.gov.uk/government/collections/timber-procurement-policy-tpp-guidance-and-support
9 http://scotland.forestry.gov.uk/images/corporate/pdf/scottishprocurementpolicynote9.pdf
Construction KPIs Scotland
Commercial in Confidence
Template Version V2-082014
© Building Research Establishment Ltd
Report No. P105130-1000
Page 14 of 30
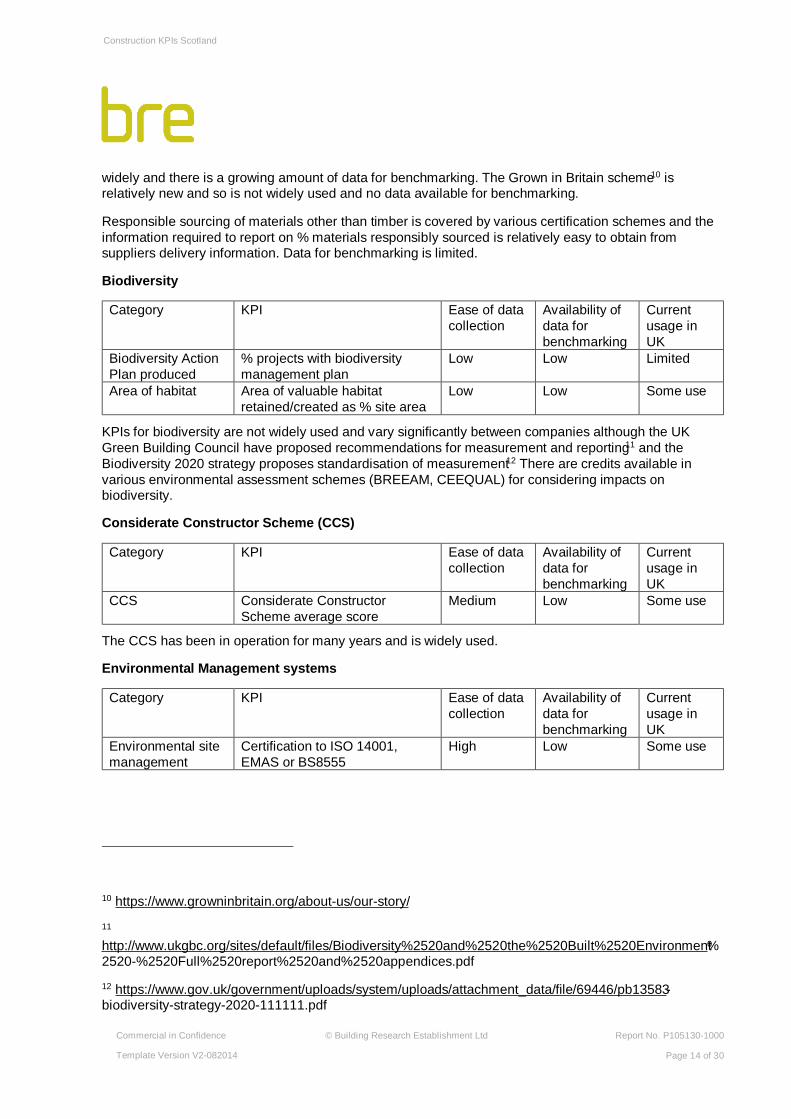
widely and there is a growing amount of data for benchmarking. The Grown in Britain scheme10 is relatively new and so is not widely used and no data available for benchmarking.
Responsible sourcing of materials other than timber is covered by various certification schemes and the information required to report on % materials responsibly sourced is relatively easy to obtain from suppliers delivery information. Data for benchmarking is limited.
Biodiversity
Category KPI Ease of data collection
Availability of data for benchmarking
Current usage in UK
Biodiversity Action Plan produced
% projects with biodiversity management plan
Low Low Limited
Area of habitat Area of valuable habitat retained/created as % site area
Low Low Some use
KPIs for biodiversity are not widely used and vary significantly between companies although the UK Green Building Council have proposed recommendations for measurement and reporting11 and the Biodiversity 2020 strategy proposes standardisation of measurement12 There are credits available in various environmental assessment schemes (BREEAM, CEEQUAL) for considering impacts on biodiversity.
Considerate Constructor Scheme (CCS)
Category KPI Ease of data collection
Availability of data for benchmarking
Current usage in UK
CCS Considerate Constructor Scheme average score
Medium Low Some use
The CCS has been in operation for many years and is widely used.
Environmental Management systems
Category KPI Ease of data collection
Availability of data for benchmarking
Current usage in UK
Environmental site management
Certification to ISO 14001, EMAS or BS8555
High Low Some use
10 https://www.growninbritain.org/about-us/our-story/
11 http://www.ukgbc.org/sites/default/files/Biodiversity%2520and%2520the%2520Built%2520Environment%2520-%2520Full%2520report%2520and%2520appendices.pdf
12 https://www.gov.uk/government/uploads/system/uploads/attachment_data/file/69446/pb13583-biodiversity-strategy-2020-111111.pdf

Construction KPIs Scotland
Commercial in Confidence
Template Version V2-082014
© Building Research Establishment Ltd
Report No. P105130-1000
Page 15 of 30
Health and Safety KPIs Category KPI Ease of data
collection Availability of data for benchmarking
Current usage in UK
Health and Safety Reportable injury frequency rate per 100,000 employees and contractors (AFR)
High High Widely used
Accident Incident rate (AIR) High High Widely
used
Accident Severity rate High High Widely
used
Lost time incident frequency rate High High Widely
used Audits and good practice
Number of actions closed out on time
Medium Low Some use
Number of good practice observations raised
Medium Low Some use
Number of audits completed Medium Low Some use Number of corrective actions closed out
Medium Low Some use
The KPIs related to health and safety are widely used and the collection of information required is relatively easy as there is a requirement to report under the Reporting of Injuries, Diseases and Dangerous Occurrences Regulations13. Data has been collected over many years for benchmarking and HSE produce annual statistics relating to these KPIs14. There are additional KPIs which relate to health and safety audits, corrective actions required and good practice observations. Information related to these can be recorded and reports of performance produced using the YellowJacket tool (see Appendix B). There is limited use of these KPIs and data for benchmarking is not currently publicly available.
13 http://www.hse.gov.uk/riddor/index.htm
14 http://www.hse.gov.uk/statistics/
Construction KPIs Scotland
Commercial in Confidence
Template Version V2-082014
© Building Research Establishment Ltd
Report No. P105130-1000
Page 16 of 30
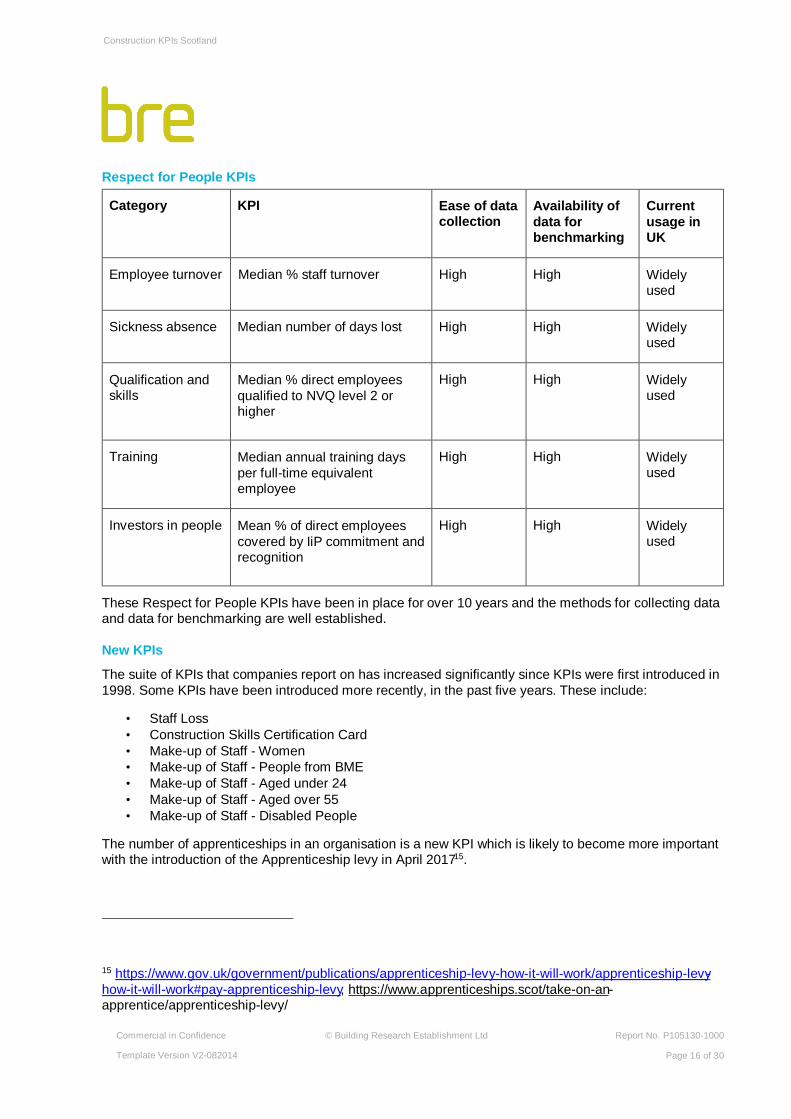
Respect for People KPIs
Category KPI Ease of data collection
Availability of data for benchmarking
Current usage in UK
Employee turnover Median % staff turnover High High Widely used
Sickness absence Median number of days lost High High Widely used
Qualification and skills
Median % direct employees qualified to NVQ level 2 or higher
High High Widely used
Training Median annual training days per full-time equivalent employee
High High Widely used
Investors in people Mean % of direct employees covered by IiP commitment and recognition
High High Widely used
These Respect for People KPIs have been in place for over 10 years and the methods for collecting data and data for benchmarking are well established.
New KPIs
The suite of KPIs that companies report on has increased significantly since KPIs were first introduced in 1998. Some KPIs have been introduced more recently, in the past five years. These include:
• Staff Loss • Construction Skills Certification Card • Make-up of Staff - Women • Make-up of Staff - People from BME • Make-up of Staff - Aged under 24 • Make-up of Staff - Aged over 55 • Make-up of Staff - Disabled People
The number of apprenticeships in an organisation is a new KPI which is likely to become more important with the introduction of the Apprenticeship levy in April 201715.
15 https://www.gov.uk/government/publications/apprenticeship-levy-how-it-will-work/apprenticeship-levy-how-it-will-work#pay-apprenticeship-levy, https://www.apprenticeships.scot/take-on-an-apprentice/apprenticeship-levy/
Construction KPIs Scotland
Commercial in Confidence
Template Version V2-082014
© Building Research Establishment Ltd
Report No. P105130-1000
Page 17 of 30
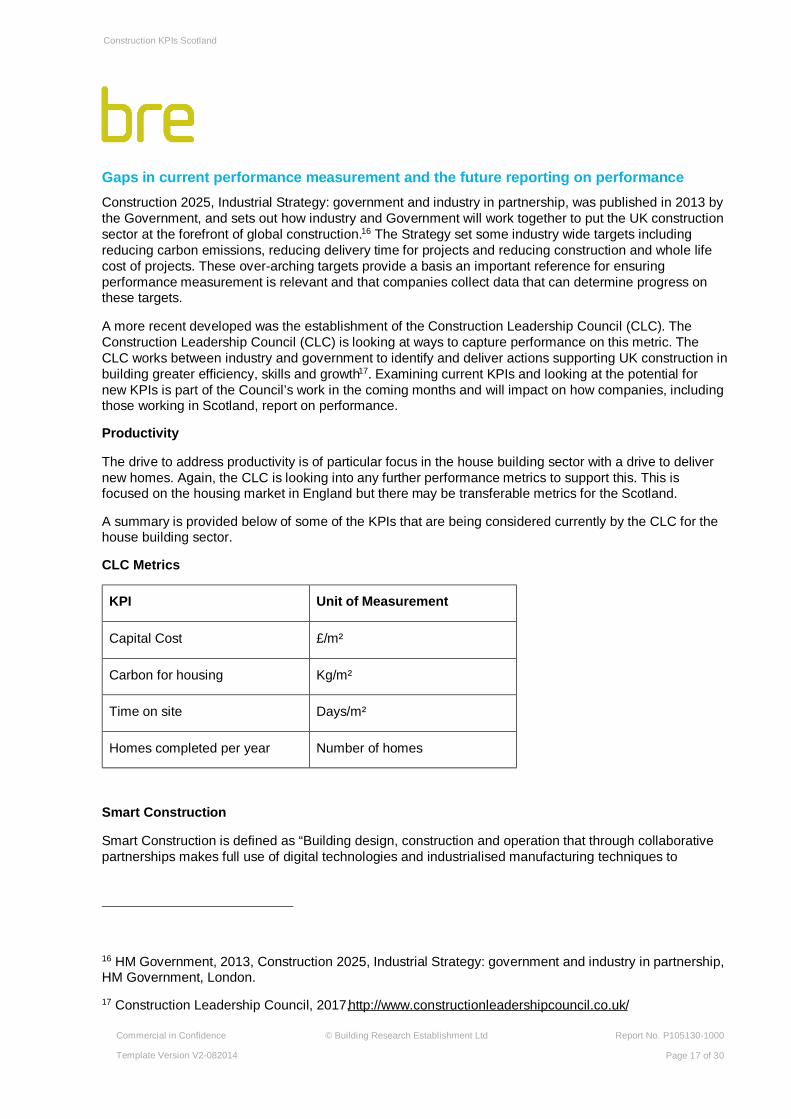
Gaps in current performance measurement and the future reporting on performance Construction 2025, Industrial Strategy: government and industry in partnership, was published in 2013 by the Government, and sets out how industry and Government will work together to put the UK construction sector at the forefront of global construction.16 The Strategy set some industry wide targets including reducing carbon emissions, reducing delivery time for projects and reducing construction and whole life cost of projects. These over-arching targets provide a basis an important reference for ensuring performance measurement is relevant and that companies collect data that can determine progress on these targets.
A more recent developed was the establishment of the Construction Leadership Council (CLC). The Construction Leadership Council (CLC) is looking at ways to capture performance on this metric. The CLC works between industry and government to identify and deliver actions supporting UK construction in building greater efficiency, skills and growth17. Examining current KPIs and looking at the potential for new KPIs is part of the Council’s work in the coming months and will impact on how companies, including those working in Scotland, report on performance.
Productivity
The drive to address productivity is of particular focus in the house building sector with a drive to deliver new homes. Again, the CLC is looking into any further performance metrics to support this. This is focused on the housing market in England but there may be transferable metrics for the Scotland.
A summary is provided below of some of the KPIs that are being considered currently by the CLC for the house building sector.
CLC Metrics
KPI Unit of Measurement
Capital Cost £/m²
Carbon for housing Kg/m²
Time on site Days/m²
Homes completed per year Number of homes
Smart Construction
Smart Construction is defined as “Building design, construction and operation that through collaborative partnerships makes full use of digital technologies and industrialised manufacturing techniques to
16 HM Government, 2013, Construction 2025, Industrial Strategy: government and industry in partnership, HM Government, London.
17 Construction Leadership Council, 2017,http://www.constructionleadershipcouncil.co.uk/
Construction KPIs Scotland
Commercial in Confidence
Template Version V2-082014
© Building Research Establishment Ltd
Report No. P105130-1000
Page 18 of 30
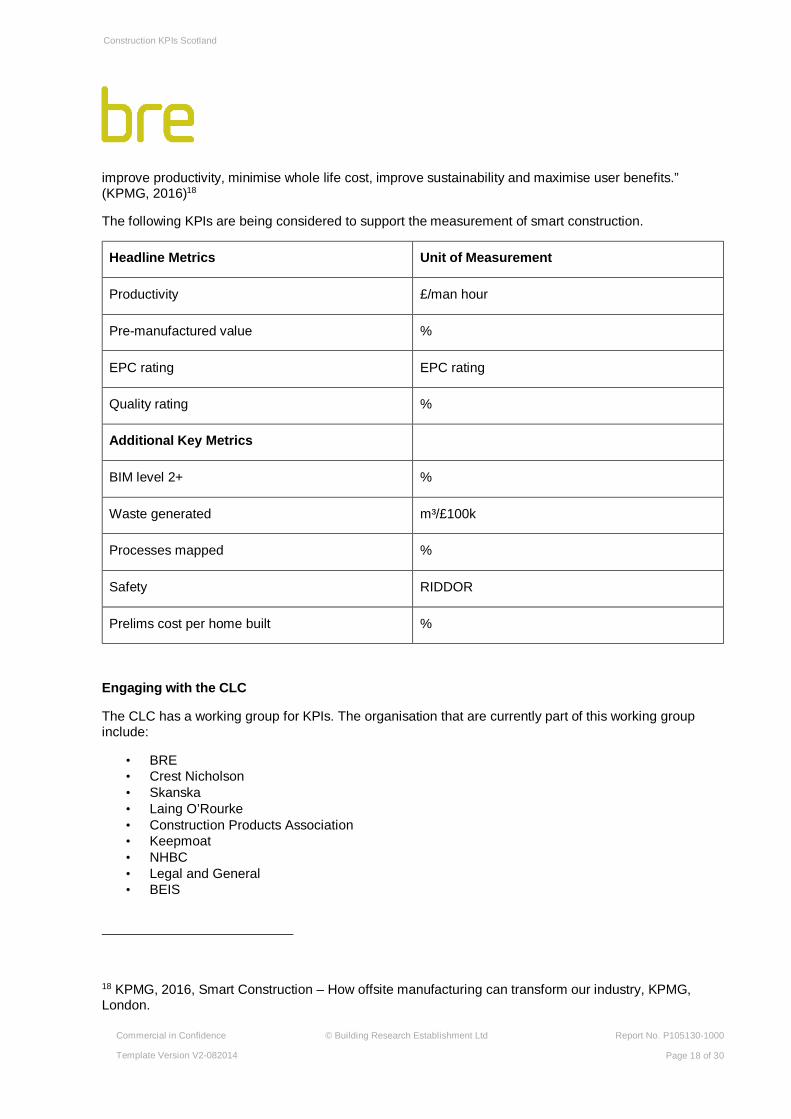
improve productivity, minimise whole life cost, improve sustainability and maximise user benefits.” (KPMG, 2016)18
The following KPIs are being considered to support the measurement of smart construction.
Headline Metrics Unit of Measurement
Productivity £/man hour
Pre-manufactured value %
EPC rating EPC rating
Quality rating %
Additional Key Metrics
BIM level 2+ %
Waste generated m³/£100k
Processes mapped %
Safety RIDDOR
Prelims cost per home built %
Engaging with the CLC
The CLC has a working group for KPIs. The organisation that are currently part of this working group include:
• BRE • Crest Nicholson • Skanska • Laing O’Rourke • Construction Products Association • Keepmoat • NHBC • Legal and General • BEIS
18 KPMG, 2016, Smart Construction – How offsite manufacturing can transform our industry, KPMG, London.
Construction KPIs Scotland
Commercial in Confidence
Template Version V2-082014
© Building Research Establishment Ltd
Report No. P105130-1000
Page 19 of 30
Simon Cross is BRE’s representative.
Pre-manufactured value
In the past year, there has been increased attention on how the UK construction sector can increase productivity and predictability The Farmer Review of the UK Construction Labour Model19 included as one of its recommendations, recommendation 8, that Government should promote pre-manufactured social housebuilding through Registered Providers. This is aimed at increasing the percentage of pre-manufactured value as a total of the housebuilding output. Pre-manufactured value refers to the amount of value of the project provided through the products and systems manufactured in offsite in a factory relative to the whole construction cost.
Scotland already has a well developed offsite construction market with systems such as timber frame already used for building of thousands of homes each year. However, to drive greater innovation, productivity and predictability in deliver, increasing pre-manufactured value further could be of benefit to the sector. Measuring this allows companies and the sector as a whole to measure progress.
Social value
Social value is an area that has become of increasing important to the sector. Social value refers to value in terms of job creation, training, collaborative working within the supply chain and being open to new ideas from within and outside of the sector.
Constructing Excellence set up a Social Value Task Group in March 2016, that brings together all constructing excellence stakeholders and aims to develop a definition for social value, a consensus on how to measure social value, and a toolkit for social value, highlighting the responsibilities for clients, communities, contractors and their supply chain20. The plan is to develop this by December 2017. In regard to the Scottish construction sector, this may be an area that is of interest.
Integrated hubs for data collection, analysis and benchmarking performance The growth of digital tools and processes for collecting data on construction performance has increased the volume of data being collected and the means of collecting the data. Companies can often have different tools that are not necessarily compatible when it comes to analysing and reporting on data.
BRE has been addressing this by developing the SiteSmart system that includes suite of performance tools covering safety, environment, quality and process. This will allow analysis, reporting and knowledge sharing with other users across performance areas for companies using this integrated system. A summary visual is provided below of the different elements.
19 Farmer, M., 2016, The Farmer Review of the UK Construction Labour Model, Construction Leadership Council, London.
20 Constructing Excellence, 2016, http://constructingexcellence.org.uk/the-farmer-review-and-social-value/, Watford.

Construction KPIs Scotland
Commercial in Confidence
Template Version V2-082014
© Building Research Establishment Ltd
Report No. P105130-1000
Page 20 of 30
BRE’s SiteSmart System
3 Industry Feedback
A number of construction companies who conduct business in Scotland were contacted to gain feedback on the current uptake of KPIs including which ones are considered most useful, which ones are not and what other KPIs would be useful for the sector. Most of the contractors were large contractors who work across the UK but some smaller companies were also contacted. This feedback survey also included asking contractors if there was any demand for any specific KPIs for the Scottish construction sector.
Current usage and value of KPIs
Health and Safety:
Health and safety KPIs were consistently raised as the type of KPIs commonly used and most valuable to companies. This is aligns with the construction sector generally where health and safety is the number one priority of many companies.
Environmental:
Materials waste generation, specifically the volume or tonnage of waste to landfill was the most widely used KPIs. Energy usage in construction was also used by a number of companies. Water usage was KPI not used as extensively as it did not have the same value to contractors as other environmental KPIs.
Construction KPIs Scotland
Commercial in Confidence
Template Version V2-082014
© Building Research Establishment Ltd
Report No. P105130-1000
Page 21 of 30
Economic performance:
Cost, time, defects and client satisfaction consistently arose as a key priority for performance measurement through the use of KPIs.
Other KPIs used
Some companies are using their own specific performance metrics but their value is for internal reporting rather than external industry-wide reporting. They still use the industry-wide KPIs for the external reporting and see the value in being able to compare with the rest of industry and benchmarks established.
Scottish Construction Sector
Most companies consulted did not see value in having any specific KPIs for the Scottish Construction sector but having a platform for benchmarking between companies and projects was considered of value to some companies. The KPIs currently reported on are ones used across the UK allowing for comparison rather than requiring a specific set of KPIs for area or region. There was a suggestion that widening the platform beyond the UK to provide comparison across Europe would be of benefit. This could be particular important for larger companies who work across countries.
International KPIs
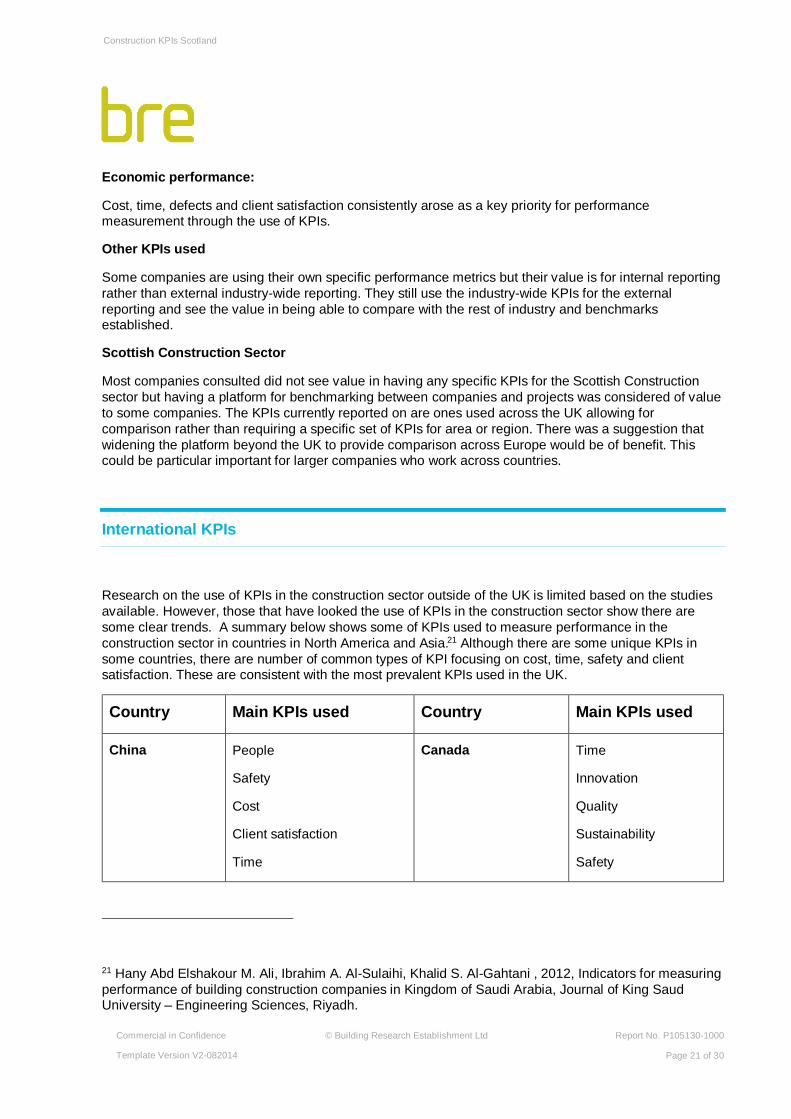
Research on the use of KPIs in the construction sector outside of the UK is limited based on the studies available. However, those that have looked the use of KPIs in the construction sector show there are some clear trends. A summary below shows some of KPIs used to measure performance in the construction sector in countries in North America and Asia.21 Although there are some unique KPIs in some countries, there are number of common types of KPI focusing on cost, time, safety and client satisfaction. These are consistent with the most prevalent KPIs used in the UK.
Country Main KPIs used Country Main KPIs used
China People
Safety
Cost
Client satisfaction
Time
Canada Time
Innovation
Quality
Sustainability
Safety
21 Hany Abd Elshakour M. Ali, Ibrahim A. Al-Sulaihi, Khalid S. Al-Gahtani , 2012, Indicators for measuring performance of building construction companies in Kingdom of Saudi Arabia, Journal of King Saud University – Engineering Sciences, Riyadh.

Construction KPIs Scotland
Commercial in Confidence
Template Version V2-082014
© Building Research Establishment Ltd
Report No. P105130-1000
Page 22 of 30
Communication
Quality
Environment
Client Satisfaction
India Benefit
Cost effectiveness
Risk
Customer commitment
Project status
Stakeholders
Decision effectiveness
Project management
Production
USA
Construction cost
Defects
Construction time
Client satisfaction product
Predictability cost and time
Saudi Arabia Client satisfaction
Planning period
Staff experience
Communication
Safety
Closeness to budget
Profitability
Payment
Claims
Thailand On time
Under budget
Specifications
Efficiency
Effectiveness
Safety
Defects
Stakeholders
Disputes
These finding are consistent with those found by Constructing Excellence who now operate through an international alliance with similar organisation outside of the UK who share knowledge and collaborate across industry. Organisation forming this alliance are based in Europe, the Middle East, the Far East and New Zealand. CE have found that organisation want to be able to compare performance across borders and therefore it is important to use KPIs that facilitate this.
The list of organisations includes:
• Constructing Excellence in New Zealand • Vernieuwing Bouw, Netherlands • Sustainable Built Environment National Research Centre, SBENRC, Australia • Bygherreforeningen (Danish Association of Construction Clients) • Hong Kong Construction Industry Council • Project Norway • Building and Construction Authority, Singapore

Construction KPIs Scotland
Commercial in Confidence
Template Version V2-082014
© Building Research Establishment Ltd
Report No. P105130-1000
Page 23 of 30
• Constructing Excellence in Qatar • Constructing Excellence in UAE
The UK has been at the forefront of using KPIs as part of the drive for continuous improvement in the construction sector. The nature of performance measurement means that it is more effective when direct comparisons can be made with other companies, regions or countries. The relevance for the Scottish construction sector is that using a common sets of KPIs are used both in the UK and internationally is of great benefit. Therefore, the core KPIs focusing on cost, time, health and safety, and customer satisfaction will continue to remain relevant and any other KPIs used should be
Construction KPIs Scotland
Commercial in Confidence
Template Version V2-082014
© Building Research Establishment Ltd
Report No. P105130-1000
Page 24 of 30
Conclusions and Recommendations
The review of KPI usage shows that there is wide range of KPIs currently used. There are some core types of KPIs that are used extensively whilst there are some KPIs that are used less extensively and more on ad-hoc basis depending on client requirements and the capacity to collect these. There are also new KPIs being considered to address key industry drivers such as productivity including specific requirements for sectors such as house building.
A framework for Scotland should consider building on KPI performance measurement that is working well already to encourage buy-in from the sector and continued use to provide reporting that is relevant and representative of the sector. This includes using existing KPI infrastructure including building on existing data collection methods, tools for collection and reporting mechanisms but with the facility Scotland-focused reporting from the data set.
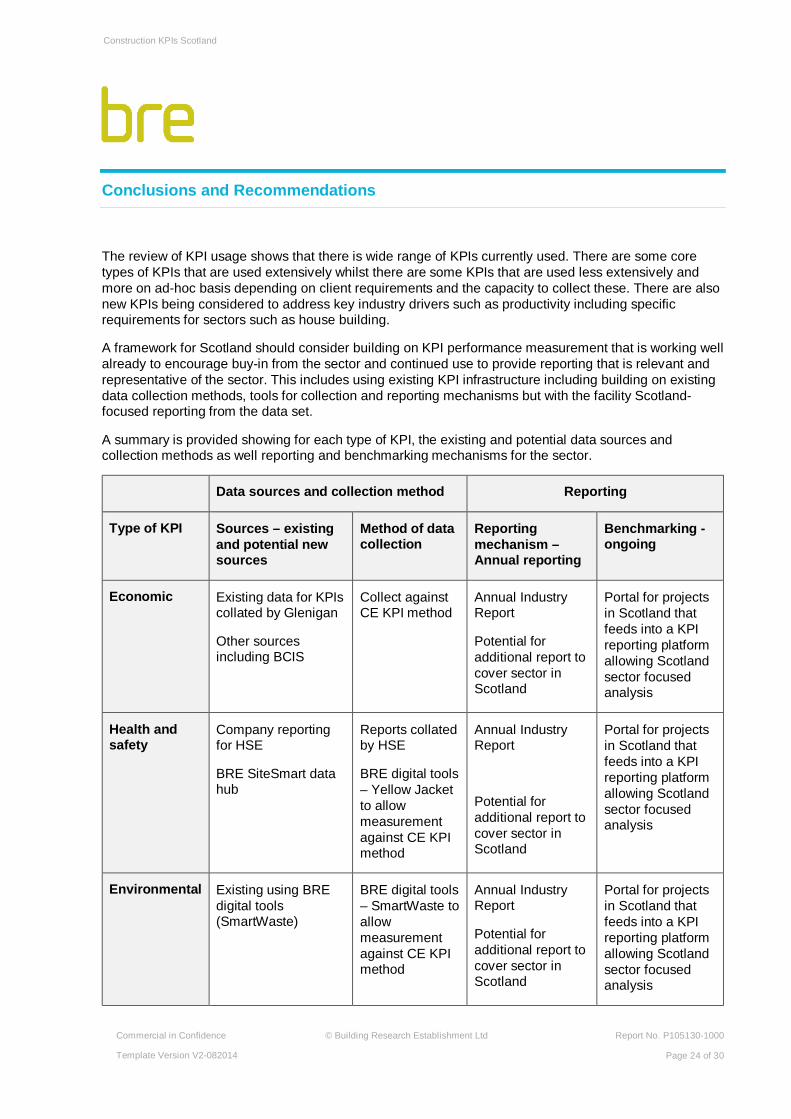
A summary is provided showing for each type of KPI, the existing and potential data sources and collection methods as well reporting and benchmarking mechanisms for the sector.
Data sources and collection method Reporting
Type of KPI Sources – existing and potential new sources
Method of data collection
Reporting mechanism – Annual reporting
Benchmarking - ongoing
Economic Existing data for KPIs collated by Glenigan
Other sources including BCIS
Collect against CE KPI method
Annual Industry Report
Potential for additional report to cover sector in Scotland
Portal for projects in Scotland that feeds into a KPI reporting platform allowing Scotland sector focused analysis
Health and safety
Company reporting for HSE
BRE SiteSmart data hub
Reports collated by HSE
BRE digital tools – Yellow Jacket to allow measurement against CE KPI method
Annual Industry Report
Potential for additional report to cover sector in Scotland
Portal for projects in Scotland that feeds into a KPI reporting platform allowing Scotland sector focused analysis
Environmental Existing using BRE digital tools (SmartWaste)
BRE digital tools – SmartWaste to allow measurement against CE KPI method
Annual Industry Report
Potential for additional report to cover sector in Scotland
Portal for projects in Scotland that feeds into a KPI reporting platform allowing Scotland sector focused analysis

Construction KPIs Scotland
Commercial in Confidence
Template Version V2-082014
© Building Research Establishment Ltd
Report No. P105130-1000
Page 25 of 30
Productivity – additional measures
Existing data including that for economic KPIs
BRE SiteSmart data hub
Other sources including CITB labour survey and ONS macro level
Further metrics to be developed (.e.g. house building specific)
BREdigital tools – process tool
Determine method of additional KPI of value. Refer to CLC development and assess value for market in Scotland.
Annual Industry Report
Potential for additional report to cover sector in Scotland
Portal for projects in Scotland that feeds into a KPI reporting platform allowing Scotland sector focused analysis
Respect for people and additional social value measures
Further metrics to be developed
Existing CE KPI methods
Determine method for additional KPI of value
Annual Industry Report
Potential for additional report to cover sector in Scotland
Portal for projects in Scotland that feeds into a KPI reporting platform allowing Scotland sector focused analysis
• Alignment with companies in the rest of the UK – many companies work in both Scotland and rest of
the UK and need to be able to benchmark across regions and countries. This includes for some companies working across Europe or even globally. A platform that allows companies to input into a system regardless of whether they work in one or many areas is critical to success providing ease of use, efficiency and relevance to the sector.
• A separate portal for construction projects in Scotland into which companies could report back their KPI scores but that feeds into a wider KPI platform reporting platform such as Constructing Excellence would provide the performance comparison required for companies working across the country and outside of the UK. It would allow ongoing benchmarking providing this at Scotland-only level and with the rest of the UK and beyond. This ensures there is a consistency in methodology and companies, many who work in both Scotland and the rest of UK, can compare performance on a like-for-like basis.
• Construction Leadership Council (CLC: The CLC is driving forward with a strategy to improve
performance in the sector with productivity a core part of that. To ensure that there is an integrated approach to achieving this, the framework for Scotland would benefit from aligning with this as this will align with the overall UK construction strategy.
• A framework should be flexible enough to allow for integration of new KPI such as those around
productivity. This should also apply to areas such as social value, an area where further research and industry consultation is taking place to providing definition and specific metrics.
• The KPIs that companies focus their reporting on and find of greatest value have been highlighted in
this report. The next step is to consult with companies operating in the Scottish construction sector to

Construction KPIs Scotland
Commercial in Confidence
Template Version V2-082014
© Building Research Establishment Ltd
Report No. P105130-1000
Page 26 of 30
understand the detail of the KPIs in each KPI type that would be of benefit. A focused list of KPIs to start with will provide benefits in terms of buy-in and quality of data rather than an expansive list that could impact on data quality as companies lack the resource to implement fully at this stage.
Construction KPIs Scotland
Commercial in Confidence
Template Version V2-082014
© Building Research Establishment Ltd
Report No. P105130-1000
Page 27 of 30
References
BRE, 2017, www.sitesmart.co.uk, BRE, Watford.
CCIC, 2006. Measuring the performance of the Canadian construction industry: metrics. Canadian Construction Innovation Council, Toronto, Ont. Available at: www.ccic-ccic.ca.
Constructing Excellence, 2016, http://constructingexcellence.org.uk/the-farmer-review-and-social-value/, Watford.
Construction Leadership Council, 2017,http://www.constructionleadershipcouncil.co.uk/
Farmer, 2016, The Farmer Review of the UK Construction Labour Model, Construction Leadership Council, London.
Glenigan, Constructing Excellence, CITB, BEIS, 2016, UK Industry Performance Report, London.
Hany Abd Elshakour M. Ali, Ibrahim A. Al-Sulaihi, Khalid S. Al-Gahtani , 2012, Indicators for measuring performance of building construction companies in Kingdom of Saudi Arabia, Journal of King Saud University – Engineering Sciences, Riyadh.
HM Government, 2013, Construction 2025 - Industrial Strategy: government and industry in partnership, HM Government, London.
Construction KPIs Scotland
Commercial in Confidence
Template Version V2-082014
© Building Research Establishment Ltd
Report No. P105130-1000
Page 28 of 30
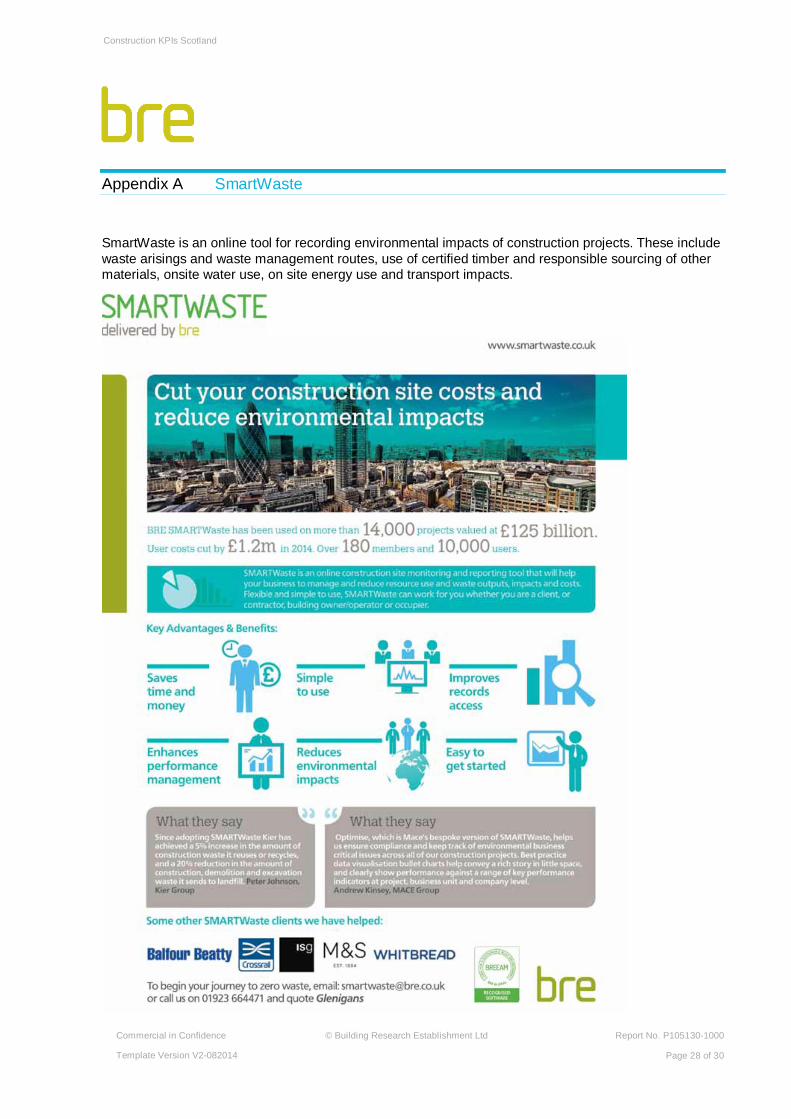
Appendix A SmartWaste
SmartWaste is an online tool for recording environmental impacts of construction projects. These include waste arisings and waste management routes, use of certified timber and responsible sourcing of other materials, onsite water use, on site energy use and transport impacts.
Construction KPIs Scotland
Commercial in Confidence
Template Version V2-082014
© Building Research Establishment Ltd
Report No. P105130-1000
Page 29 of 30
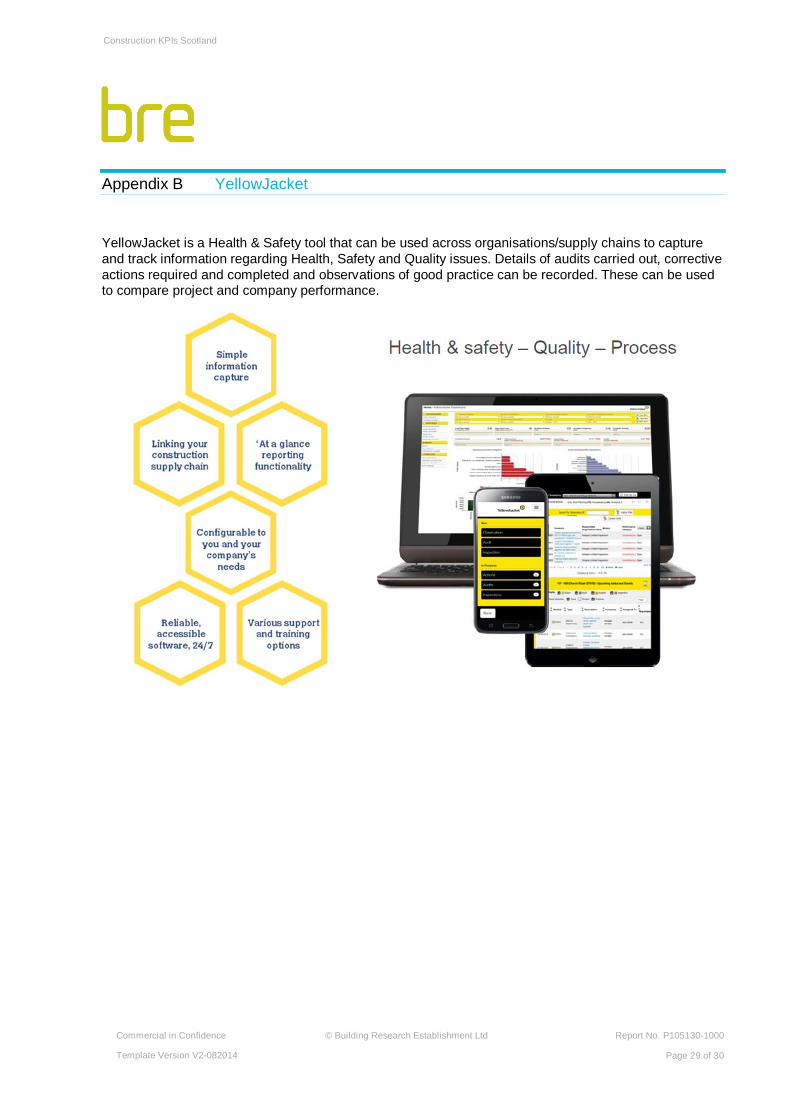
Appendix B YellowJacket
YellowJacket is a Health & Safety tool that can be used across organisations/supply chains to capture and track information regarding Health, Safety and Quality issues. Details of audits carried out, corrective actions required and completed and observations of good practice can be recorded. These can be used to compare project and company performance.