Knowledge is Power: Visualizing JIRA's Performance Data
61
LUKE DURKAN • GRADUATE DEVELOPER • ATLASSIAN Knowledge is Power: Visualising JIRA’s Performance Data
Transcript of Knowledge is Power: Visualizing JIRA's Performance Data

LUKE DURKAN • GRADUATE DEVELOPER • ATLASSIAN
Knowledge is Power: Visualising JIRA’s Performance Data

At Atlassian we ask the tough
questions…

Can we graph that?

A picture is worth a 1000 words

A picture is worth a 1000 words

A picture is worth a 1000 words
graph

A picture is worth a 1000 words
graph

A picture is worth a 1000 words
graph
numbers
W H AT Y O U C A N S E E
W H AT I S P E R F. M O N I TO R I N G ?
W H AT T H E D ATA C A N T E L L Y O U
G E T T I N G T H E B I G P I C T U R E
AgendaA B O U T M E

About Me
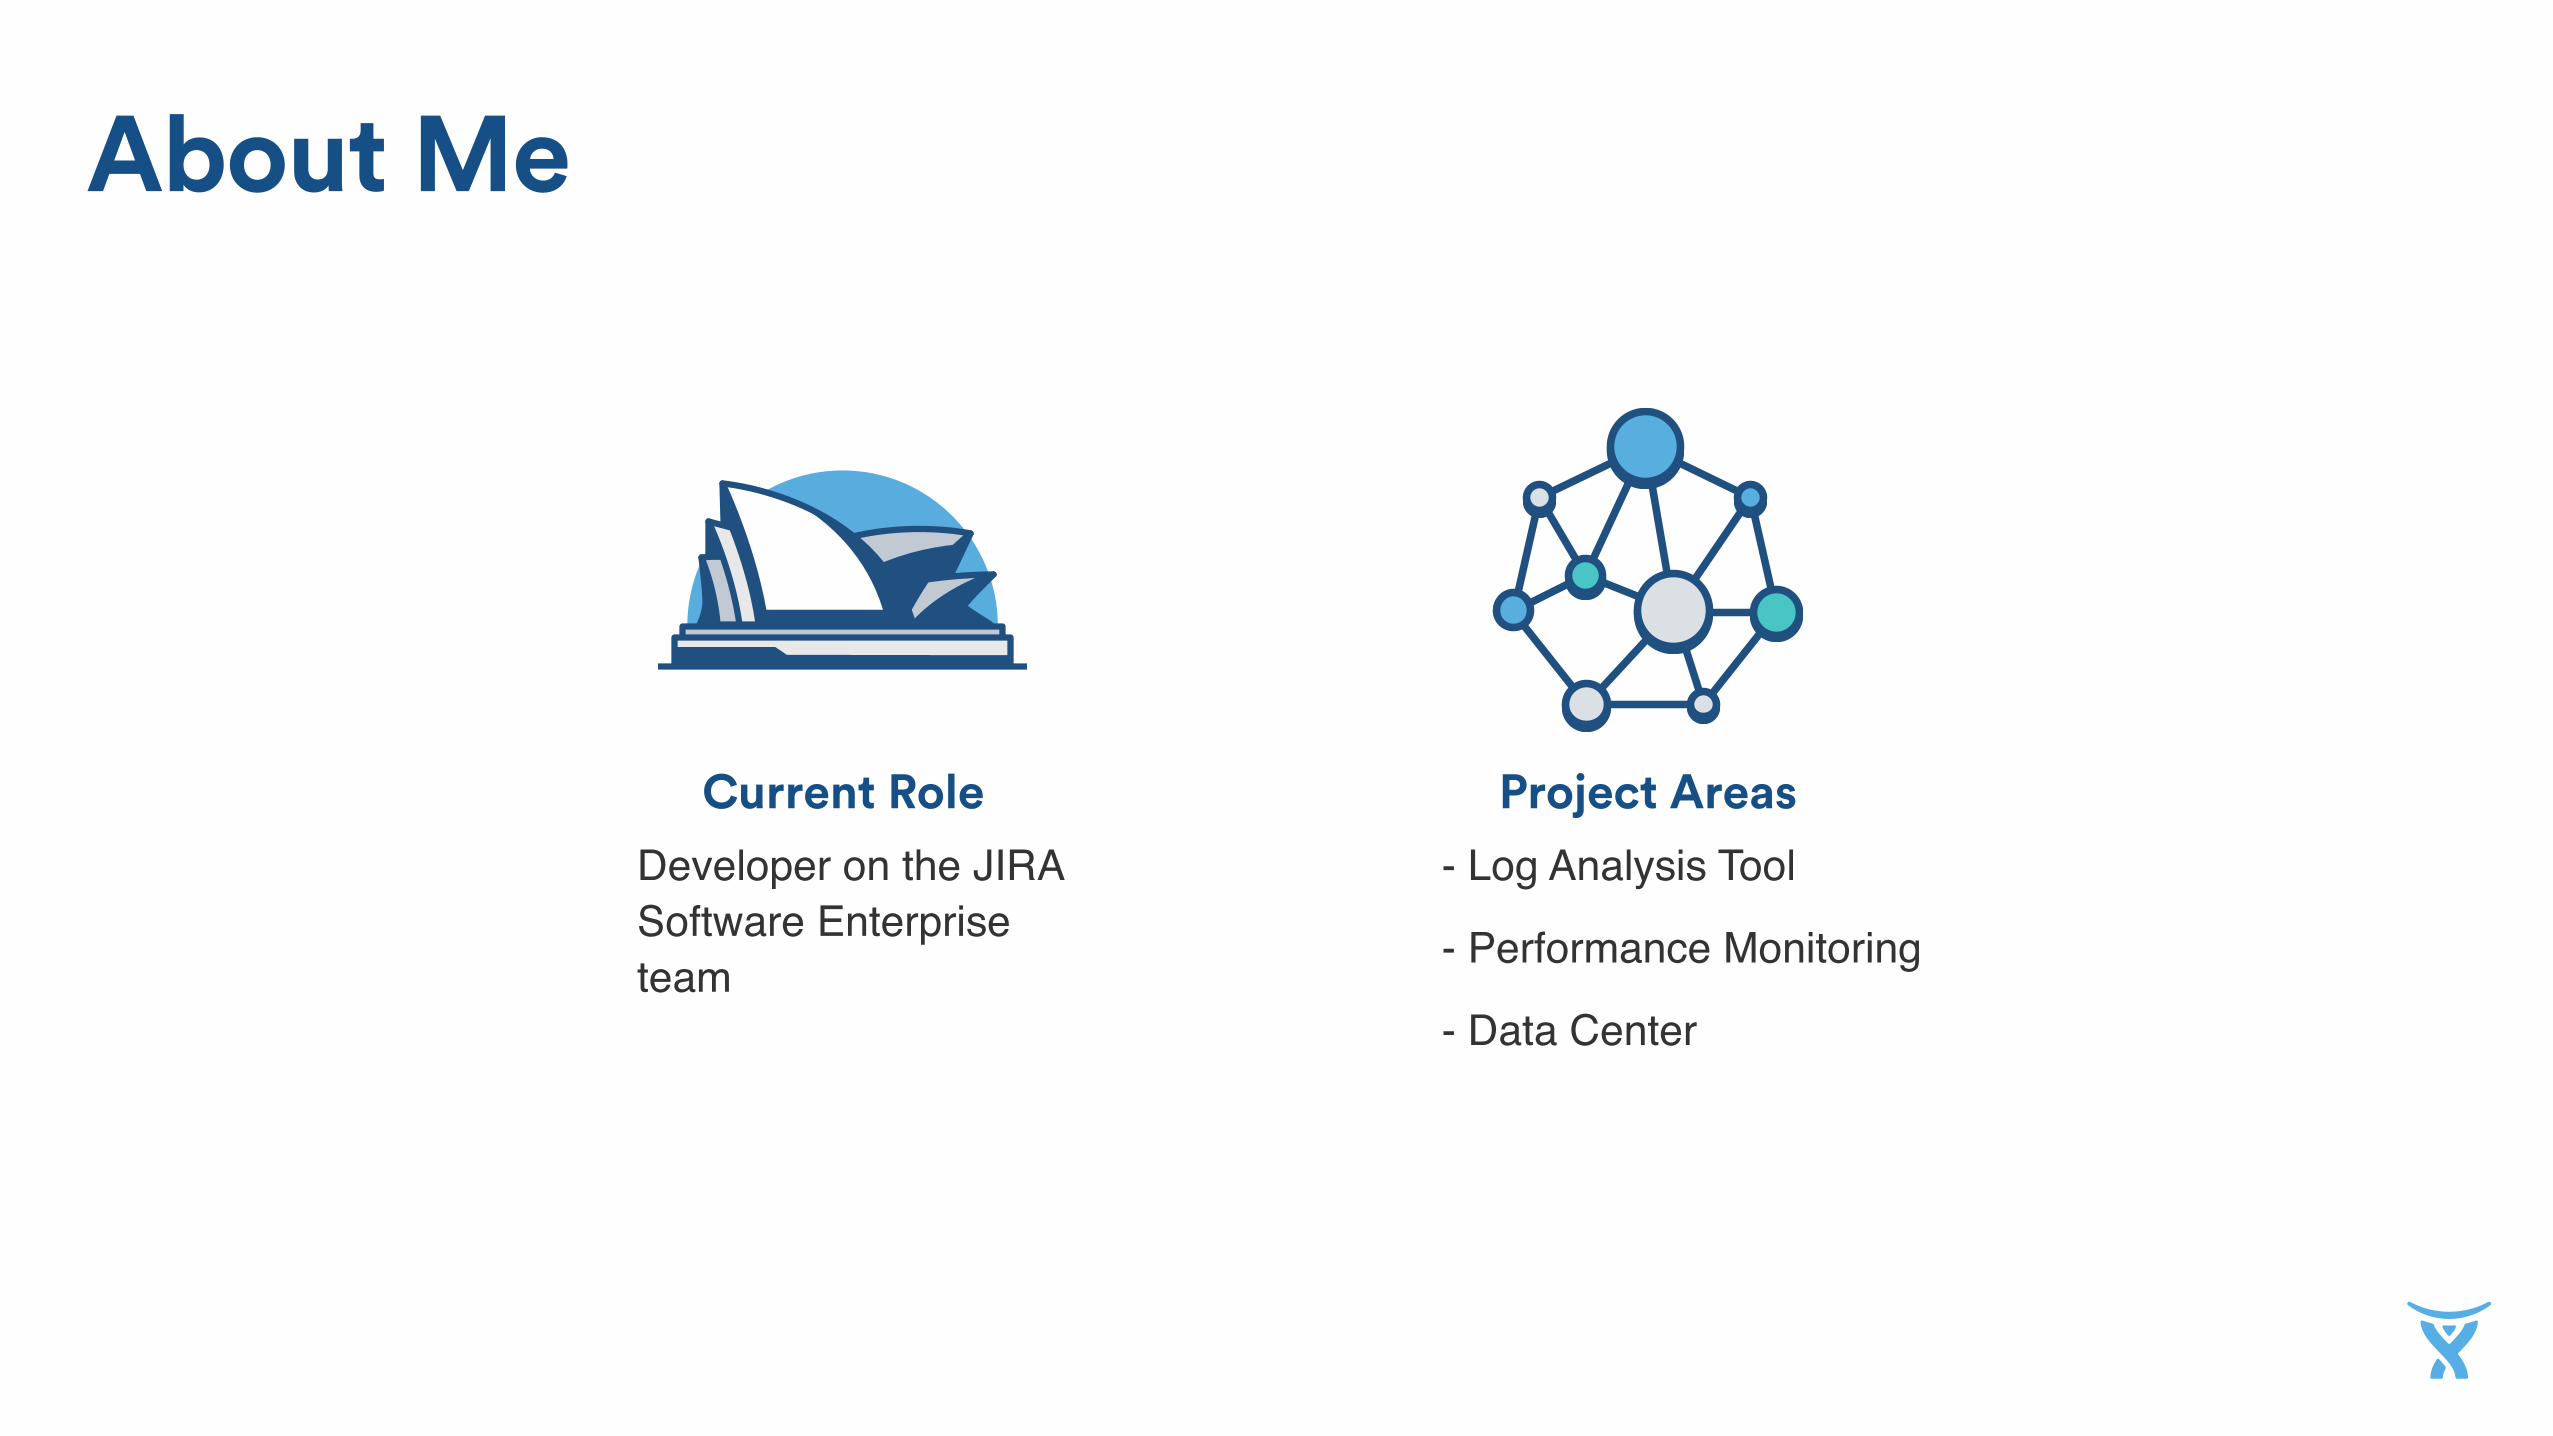
Project AreasCurrent Role
About Me
- Log Analysis Tool
- Performance Monitoring
- Data Center
Developer on the JIRA Software Enterprise team

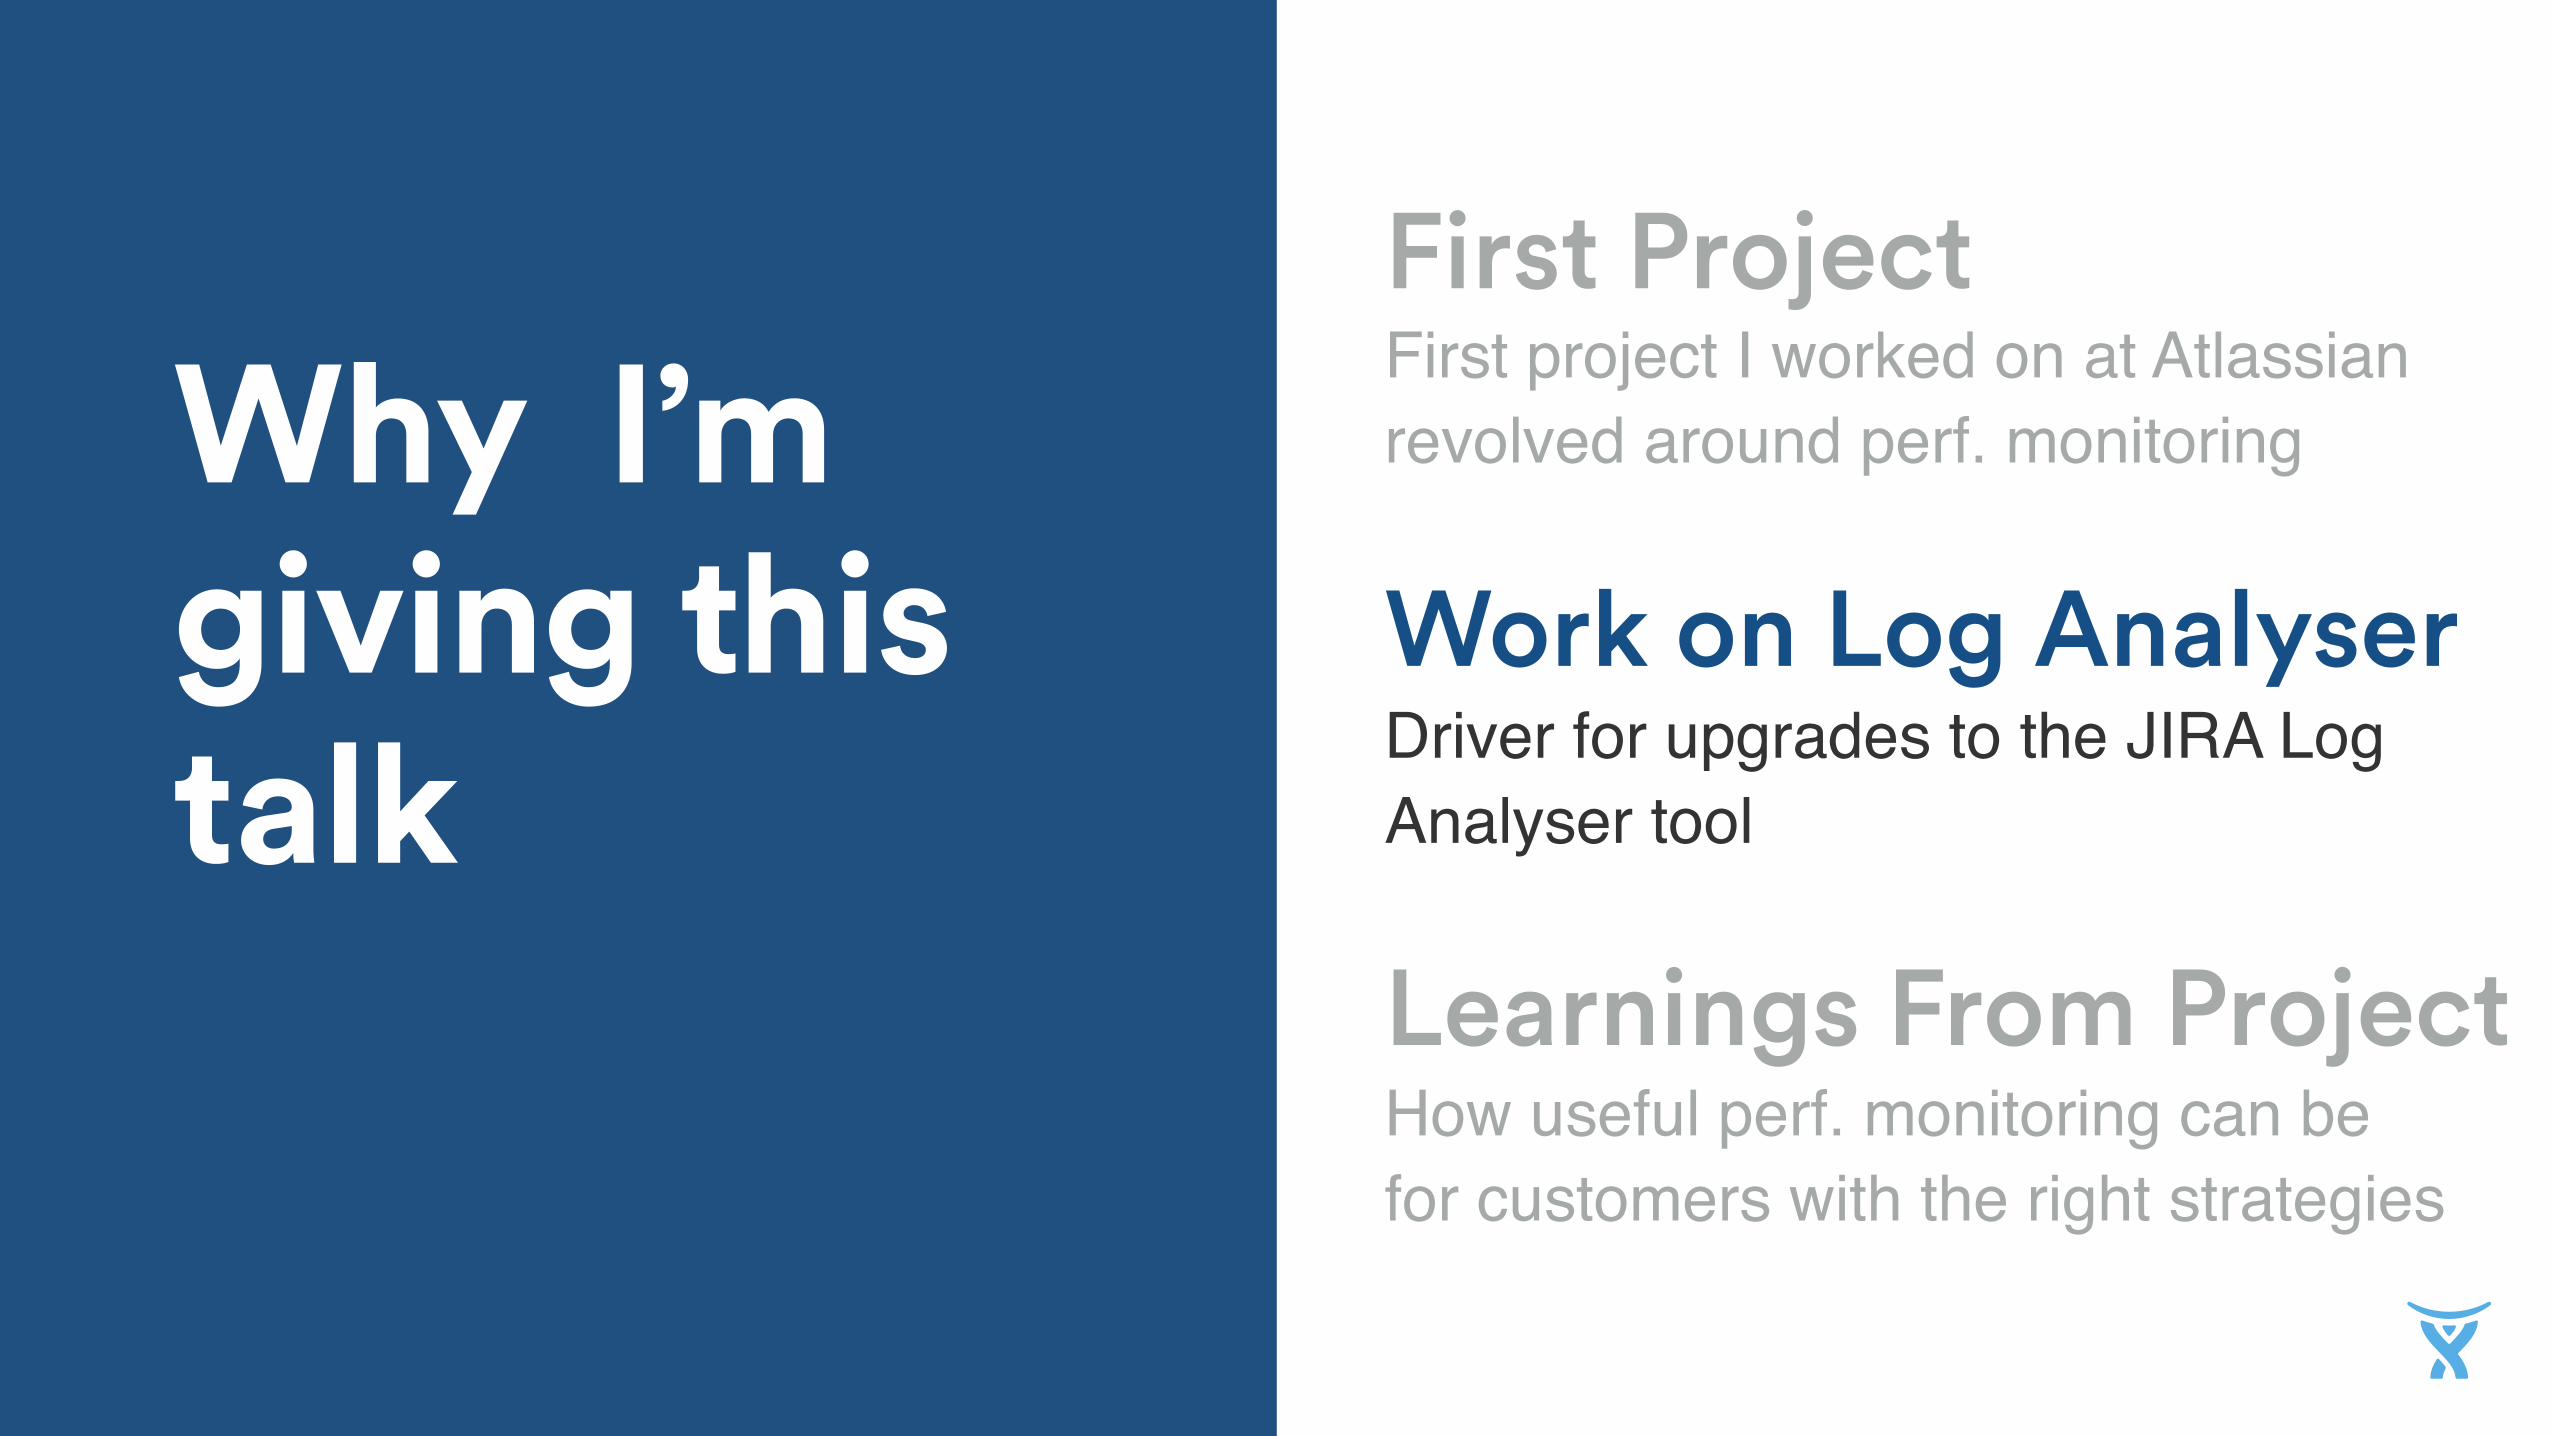
Why I’m giving this talk
Learnings From Project
First project I worked on at Atlassian revolved around perf. monitoring
Work on Log AnalyserDriver for upgrades to the JIRA Log Analyser tool
First Project
How useful perf. monitoring can be for customers with the right strategies

Why I’m giving this talk
Learnings From Project
First project I worked on at Atlassian revolved around perf. monitoring
Work on Log AnalyserDriver for upgrades to the JIRA Log Analyser tool
First Project
How useful perf. monitoring can be for customers with the right strategies
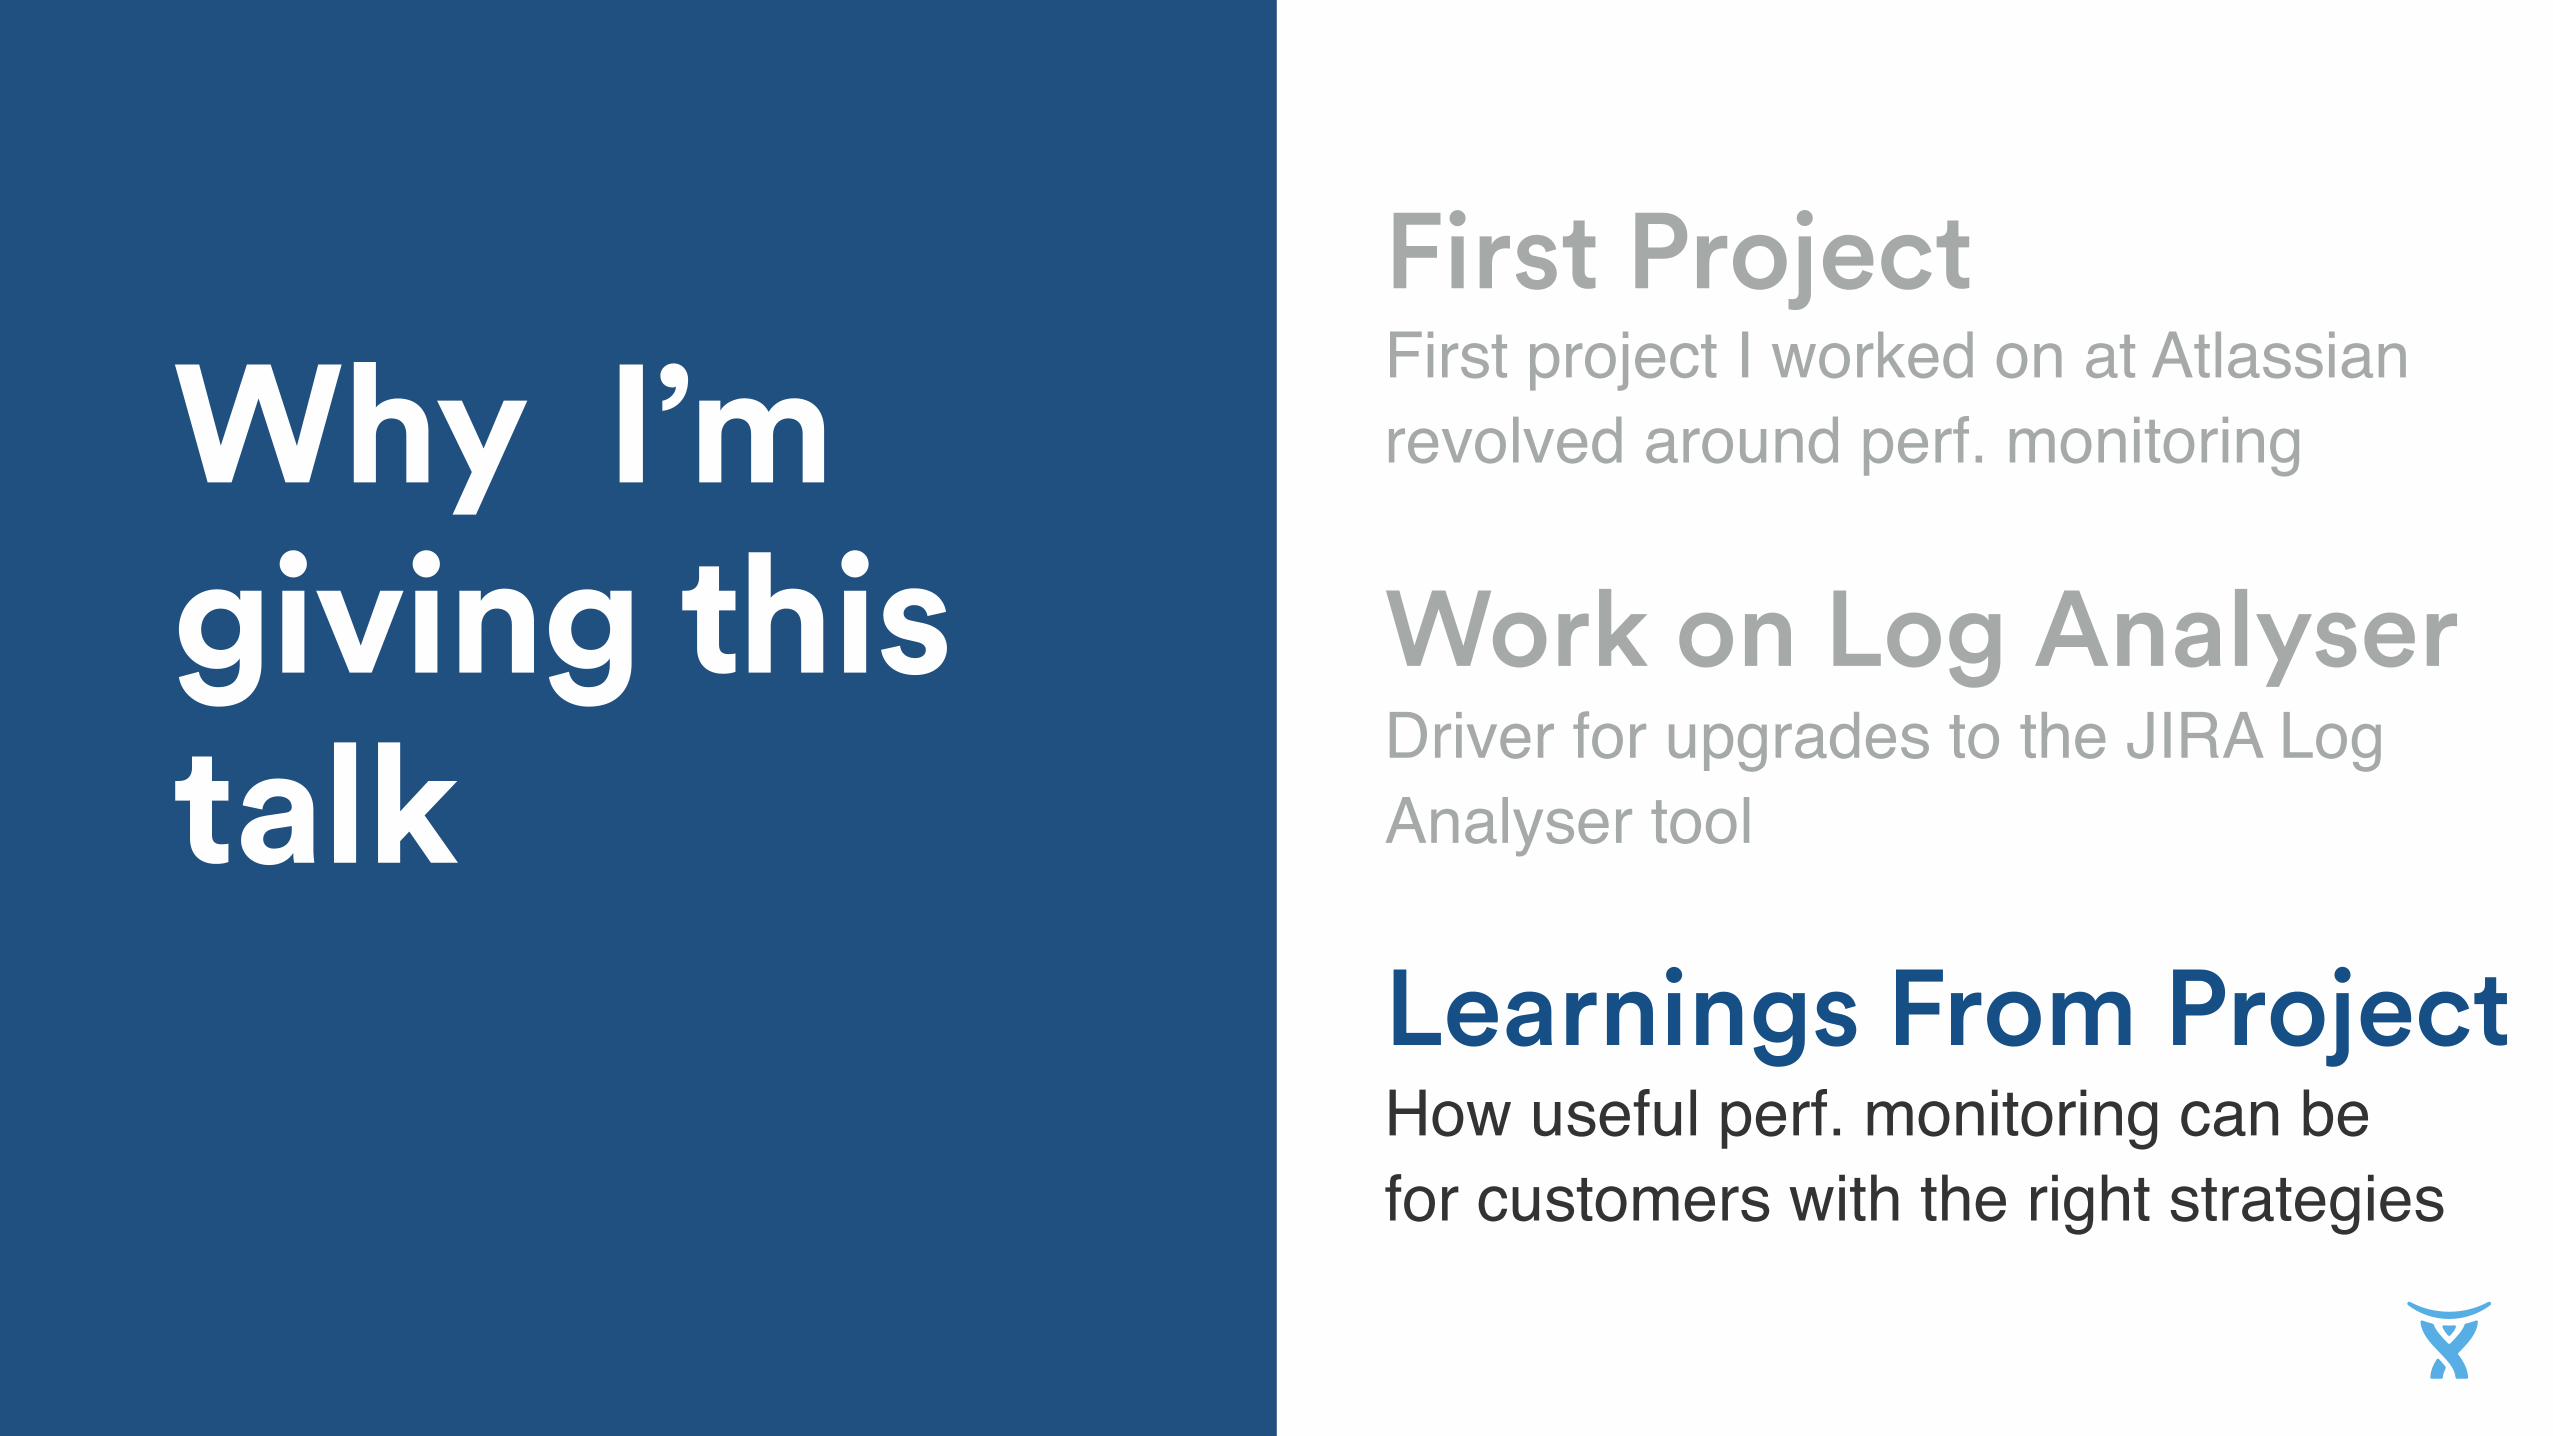
Why I’m giving this talk
Learnings From Project
First project I worked on at Atlassian revolved around perf. monitoring
Work on Log AnalyserDriver for upgrades to the JIRA Log Analyser tool
First Project
How useful perf. monitoring can be for customers with the right strategies

Why I’m giving this talk
Learnings From Project
First project I worked on at Atlassian revolved around perf. monitoring
Work on Log AnalyserDriver for upgrades to the JIRA Log Analyser tool
First Project
How useful perf. monitoring can be for customers with the right strategies

It is an immutable law in business that words are words, explanations are explanations, promises are promises-but only performance is reality.H A R O L D G E N E E N , F O R M E R P R E S I D E N T O F I T T
“
”
Why I’m giving this talk
Learnings From Project
First project I worked on at Atlassian revolved around perf. monitoring
Work on Log AnalyserDriver for upgrades to the JIRA Log Analyser tool
First Project
How useful perf. monitoring can be for customers with the right strategies

What is Performance Monitoring?
What is Performance Monitoring?

What isn’t Performance Monitoring?

5 Secrets to JIRA no has told you about

5 Secrets to JIRA no has told you about

7 Things they don’t want you to know about JIRA
Performance

7 Things they don’t want you to know about JIRA
Performance

Performance Monitoring
Not Perf. Testing
This allows for quick reaction to potential performance problems
Log File AnalysisReview logs around the time reported problems happen to understand why
Real-Time Analysis
Performance testing is the use of fake data to stress test applications

Performance monitoring helps to understand, why!

What you can see

Spoiler: You can see a lot!
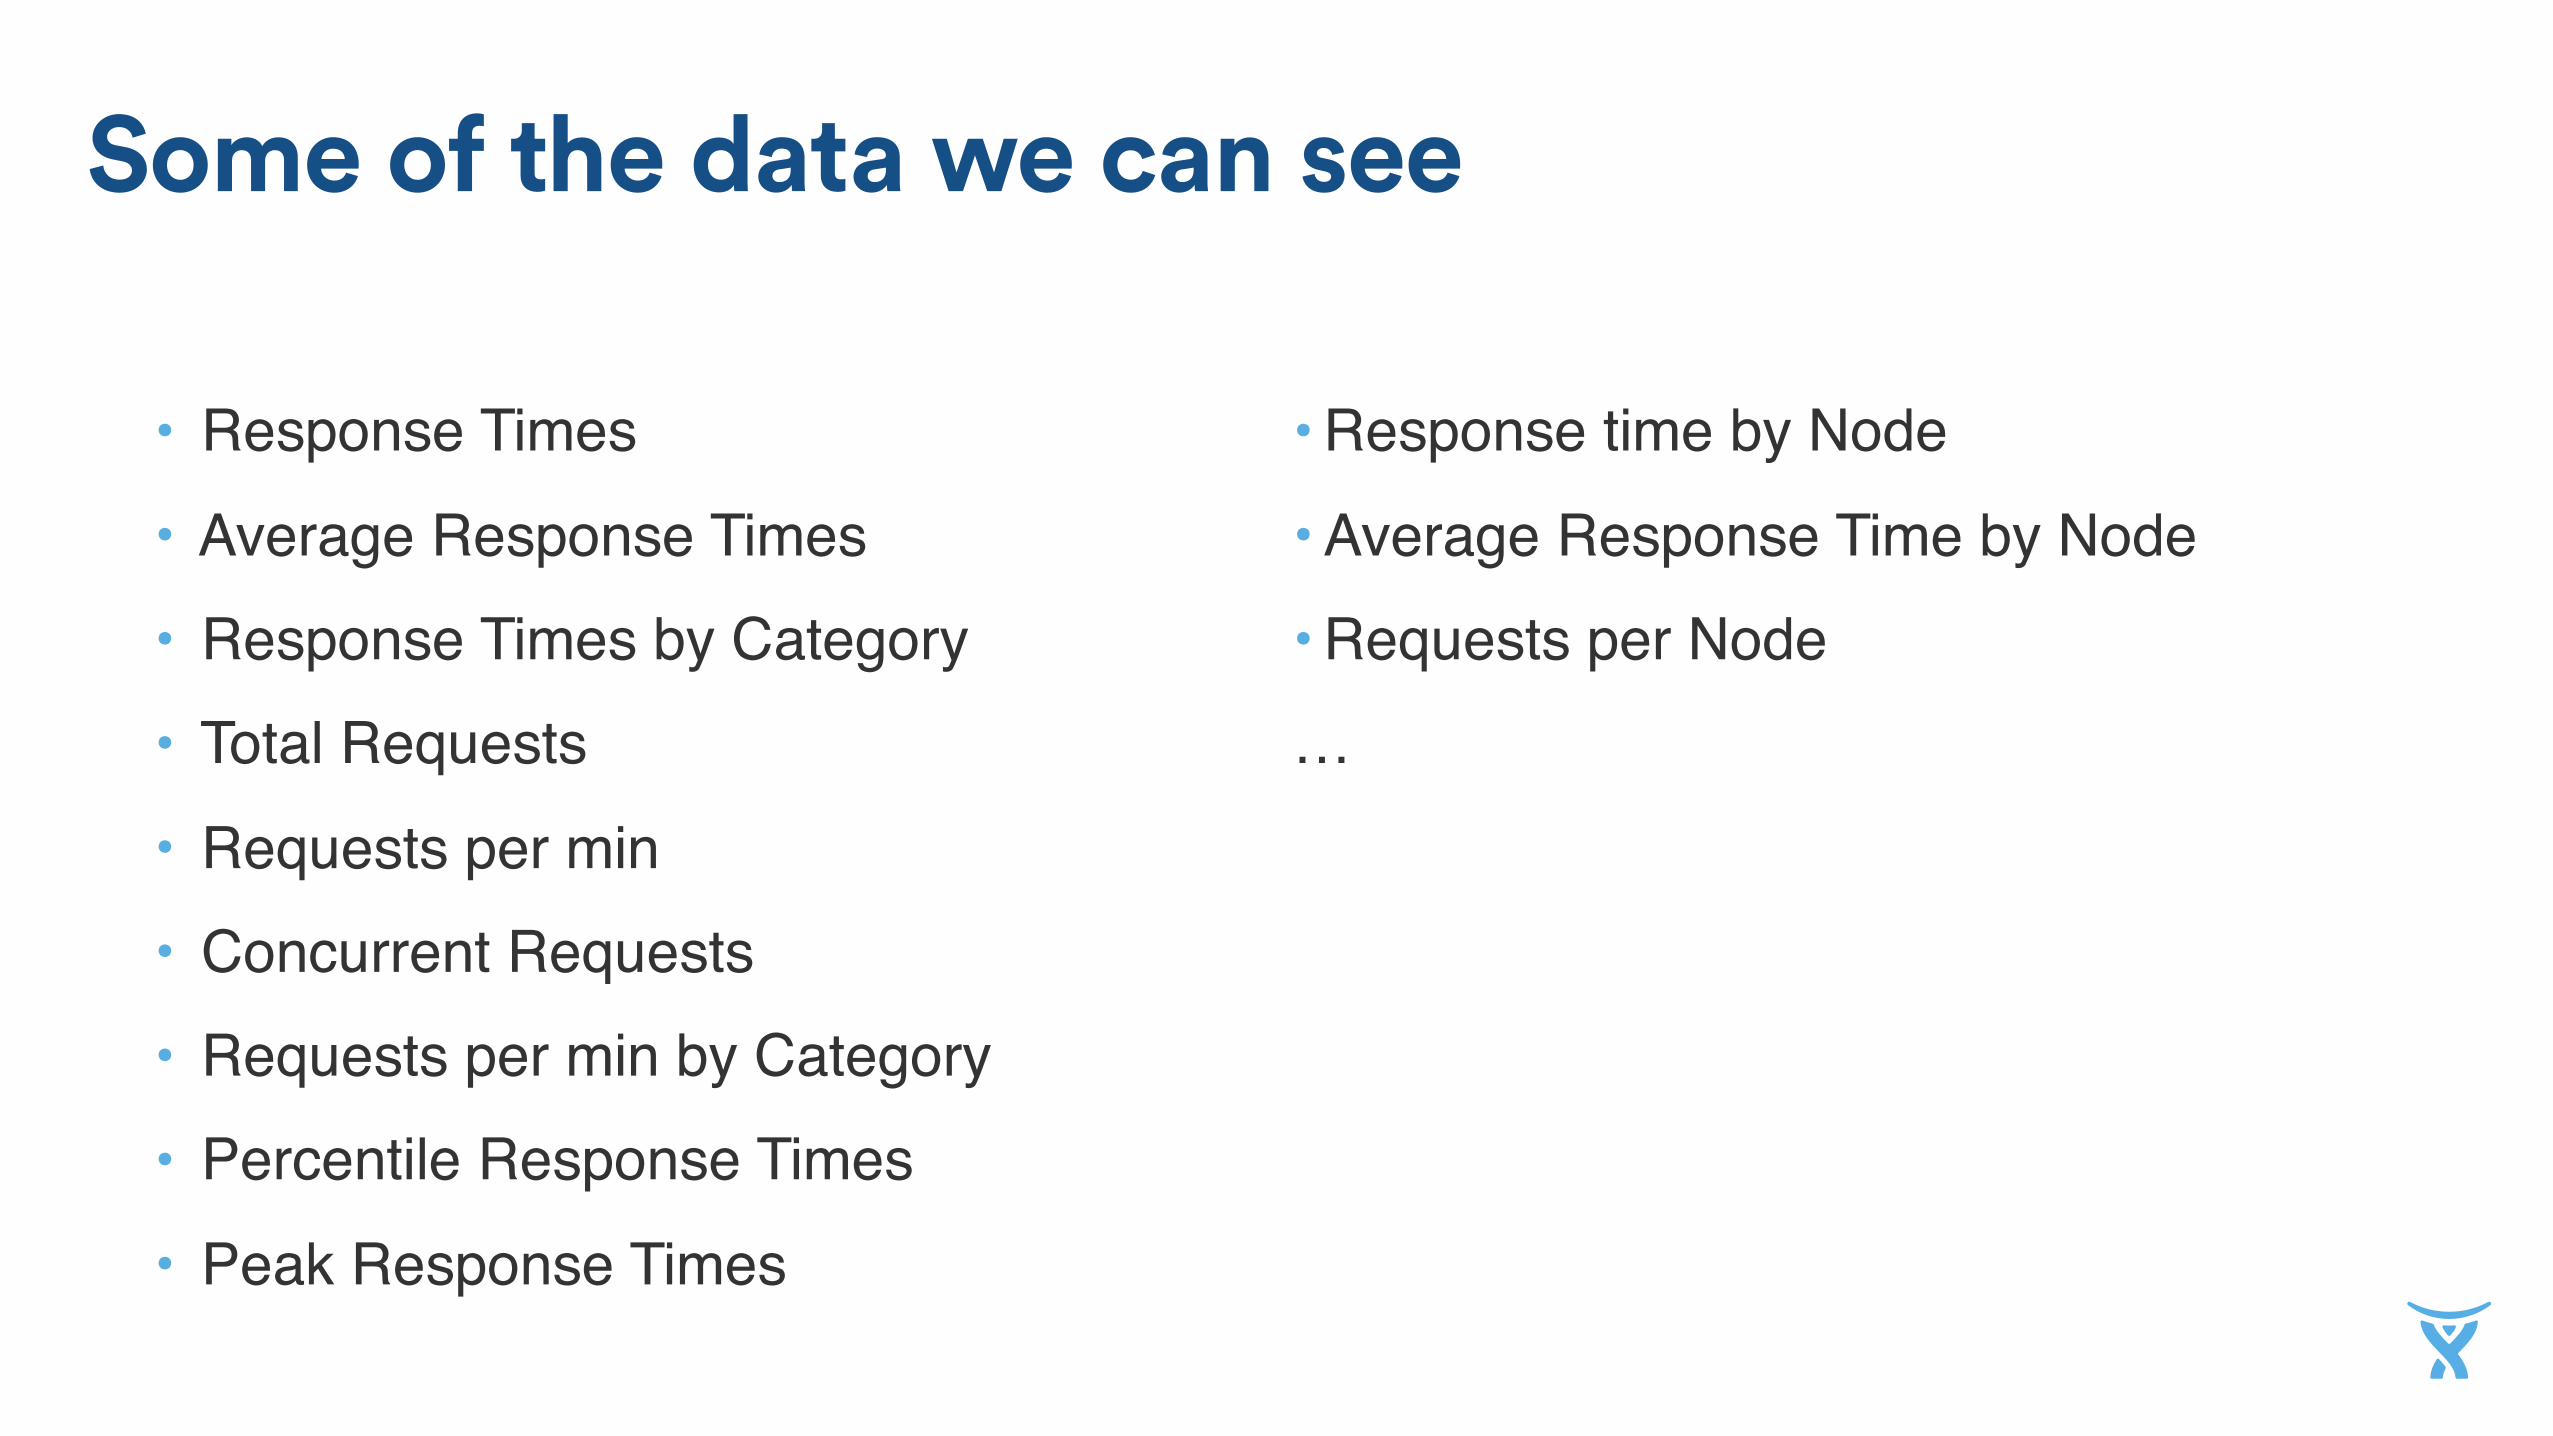
• Response Times• Average Response Times• Response Times by Category• Total Requests• Requests per min• Concurrent Requests• Requests per min by Category• Percentile Response Times• Peak Response Times
Some of the data we can see
• Response time by Node• Average Response Time by Node• Requests per Node…
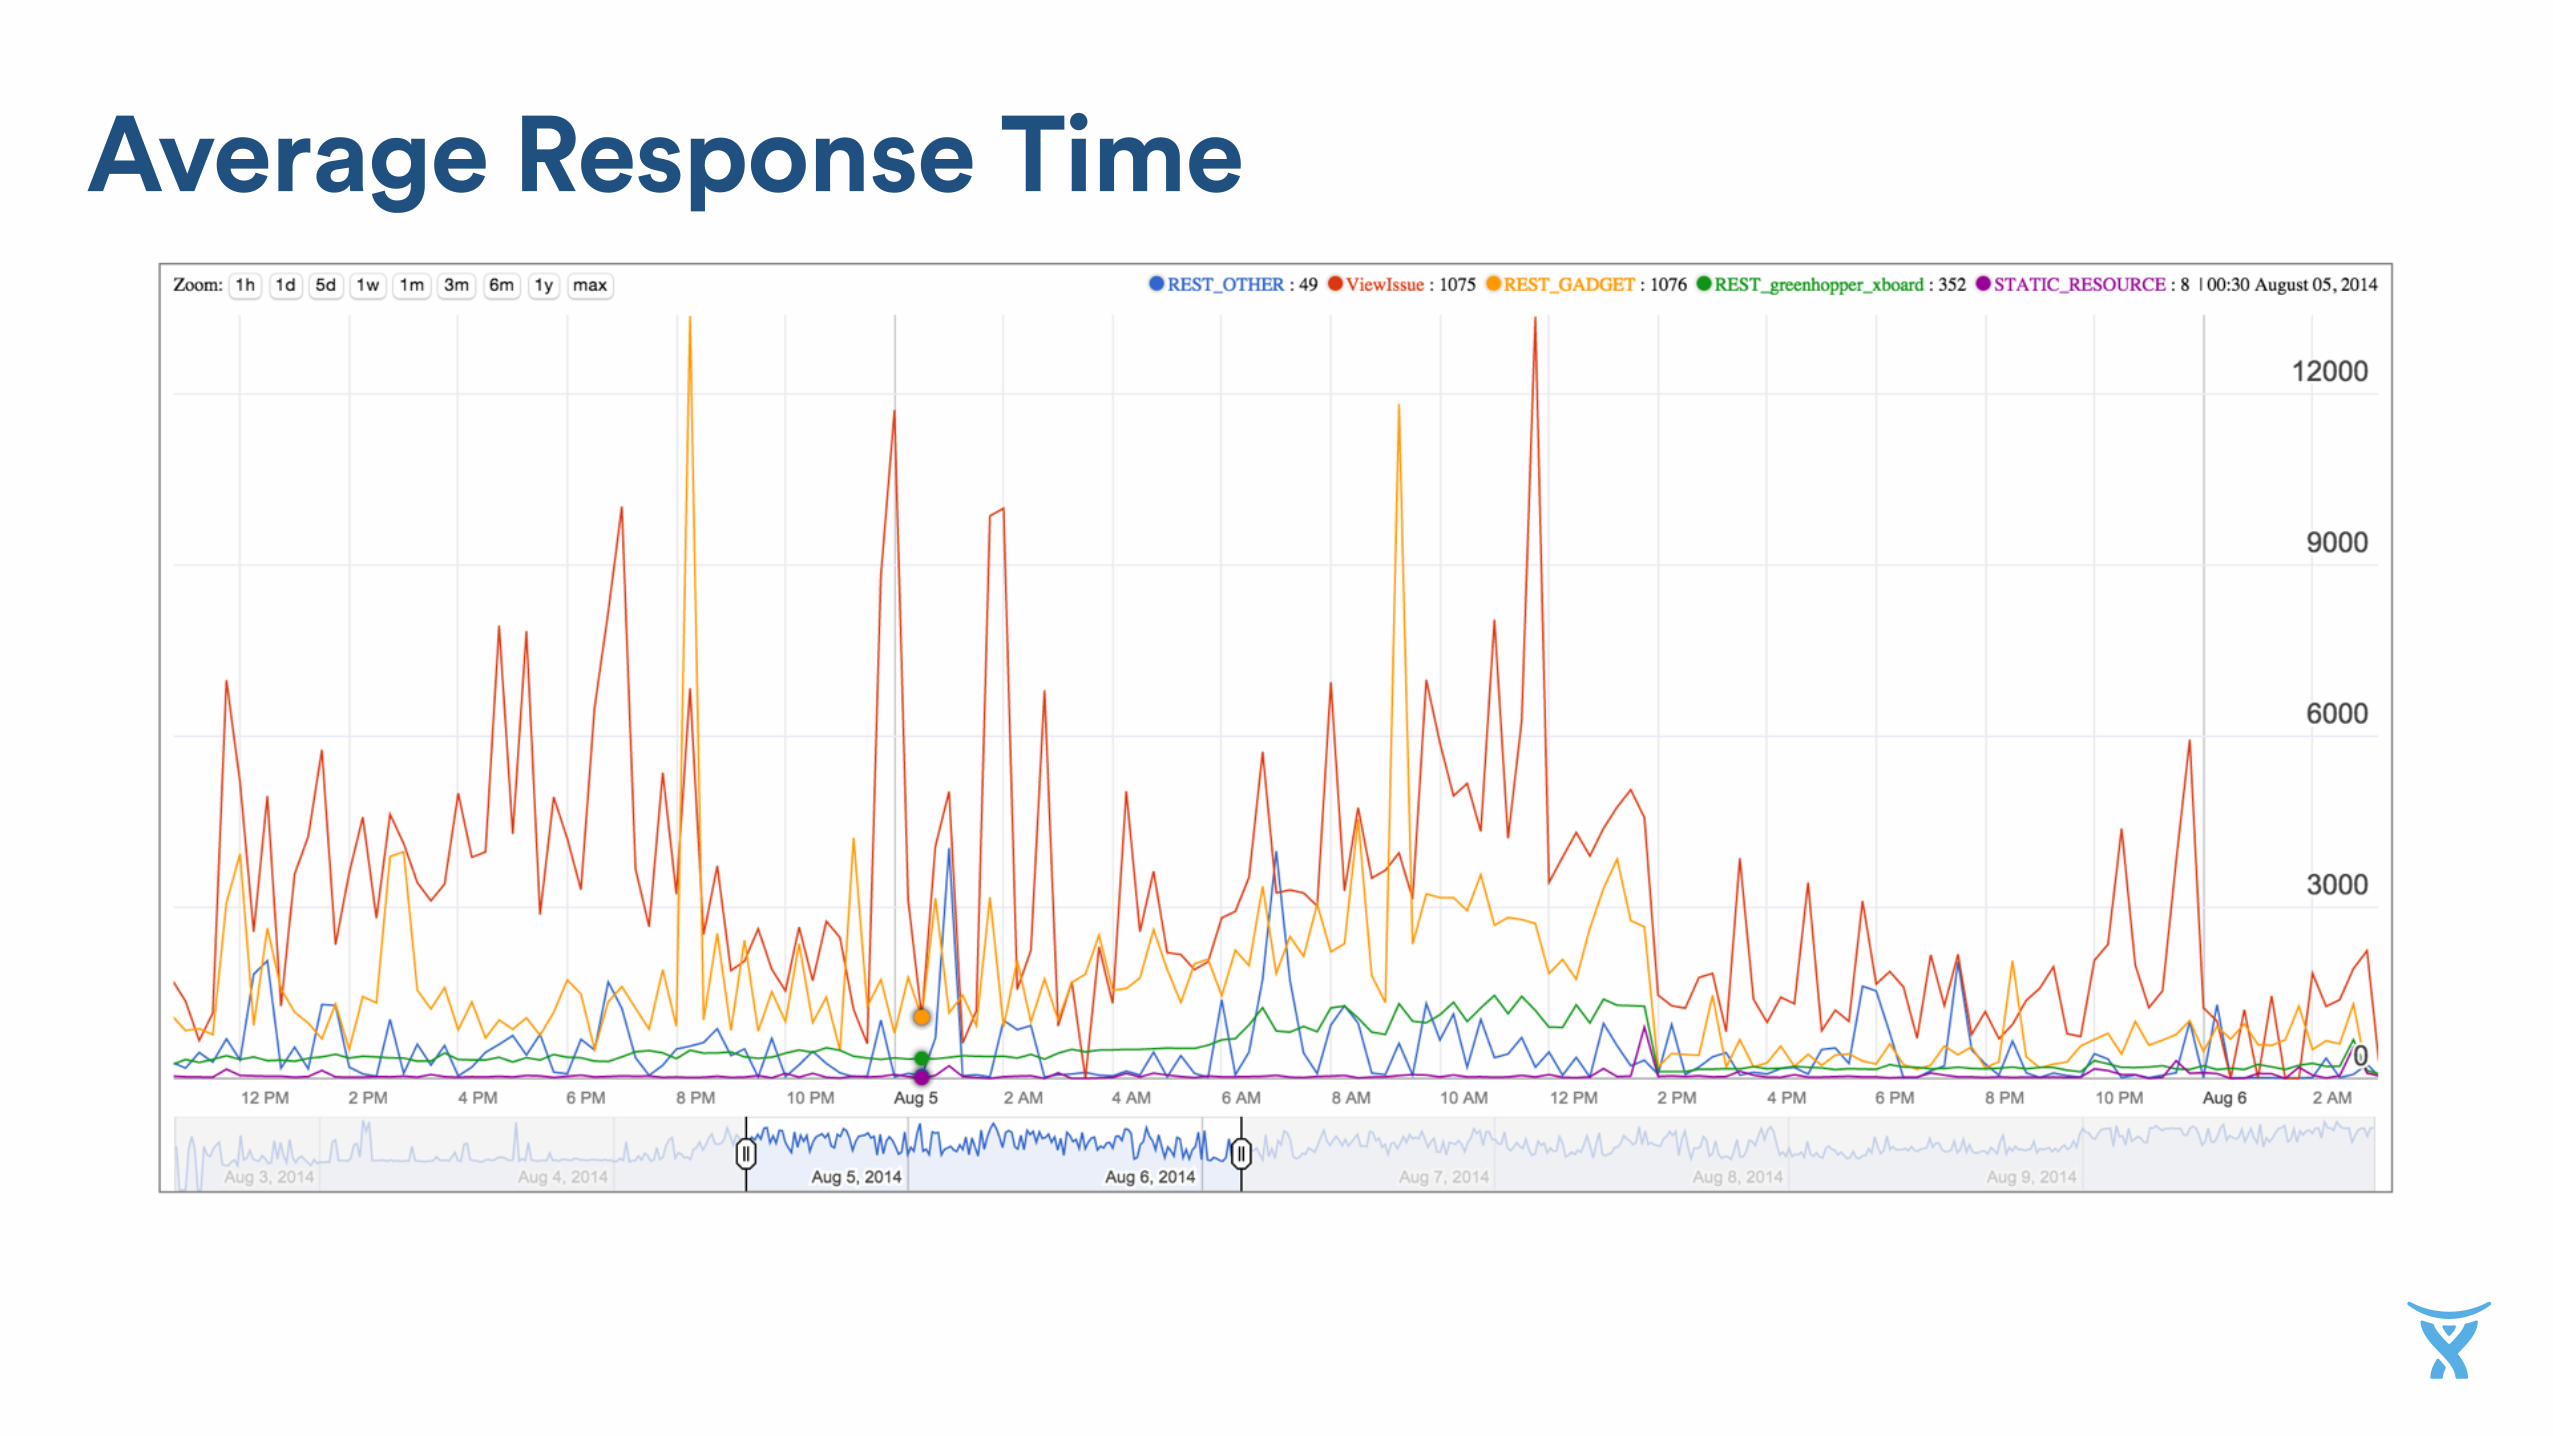
Average Response Time
Always keep track of what’s being
measured

Request Count (req/min)

Average Response Time by Nodes (ms)

Write your ownNew RelicLog Analyser Tool
Examples of products you can use

What the data can tell you

Average Response Time (ms)

Request Count (req/min)

Request Count (req/min)
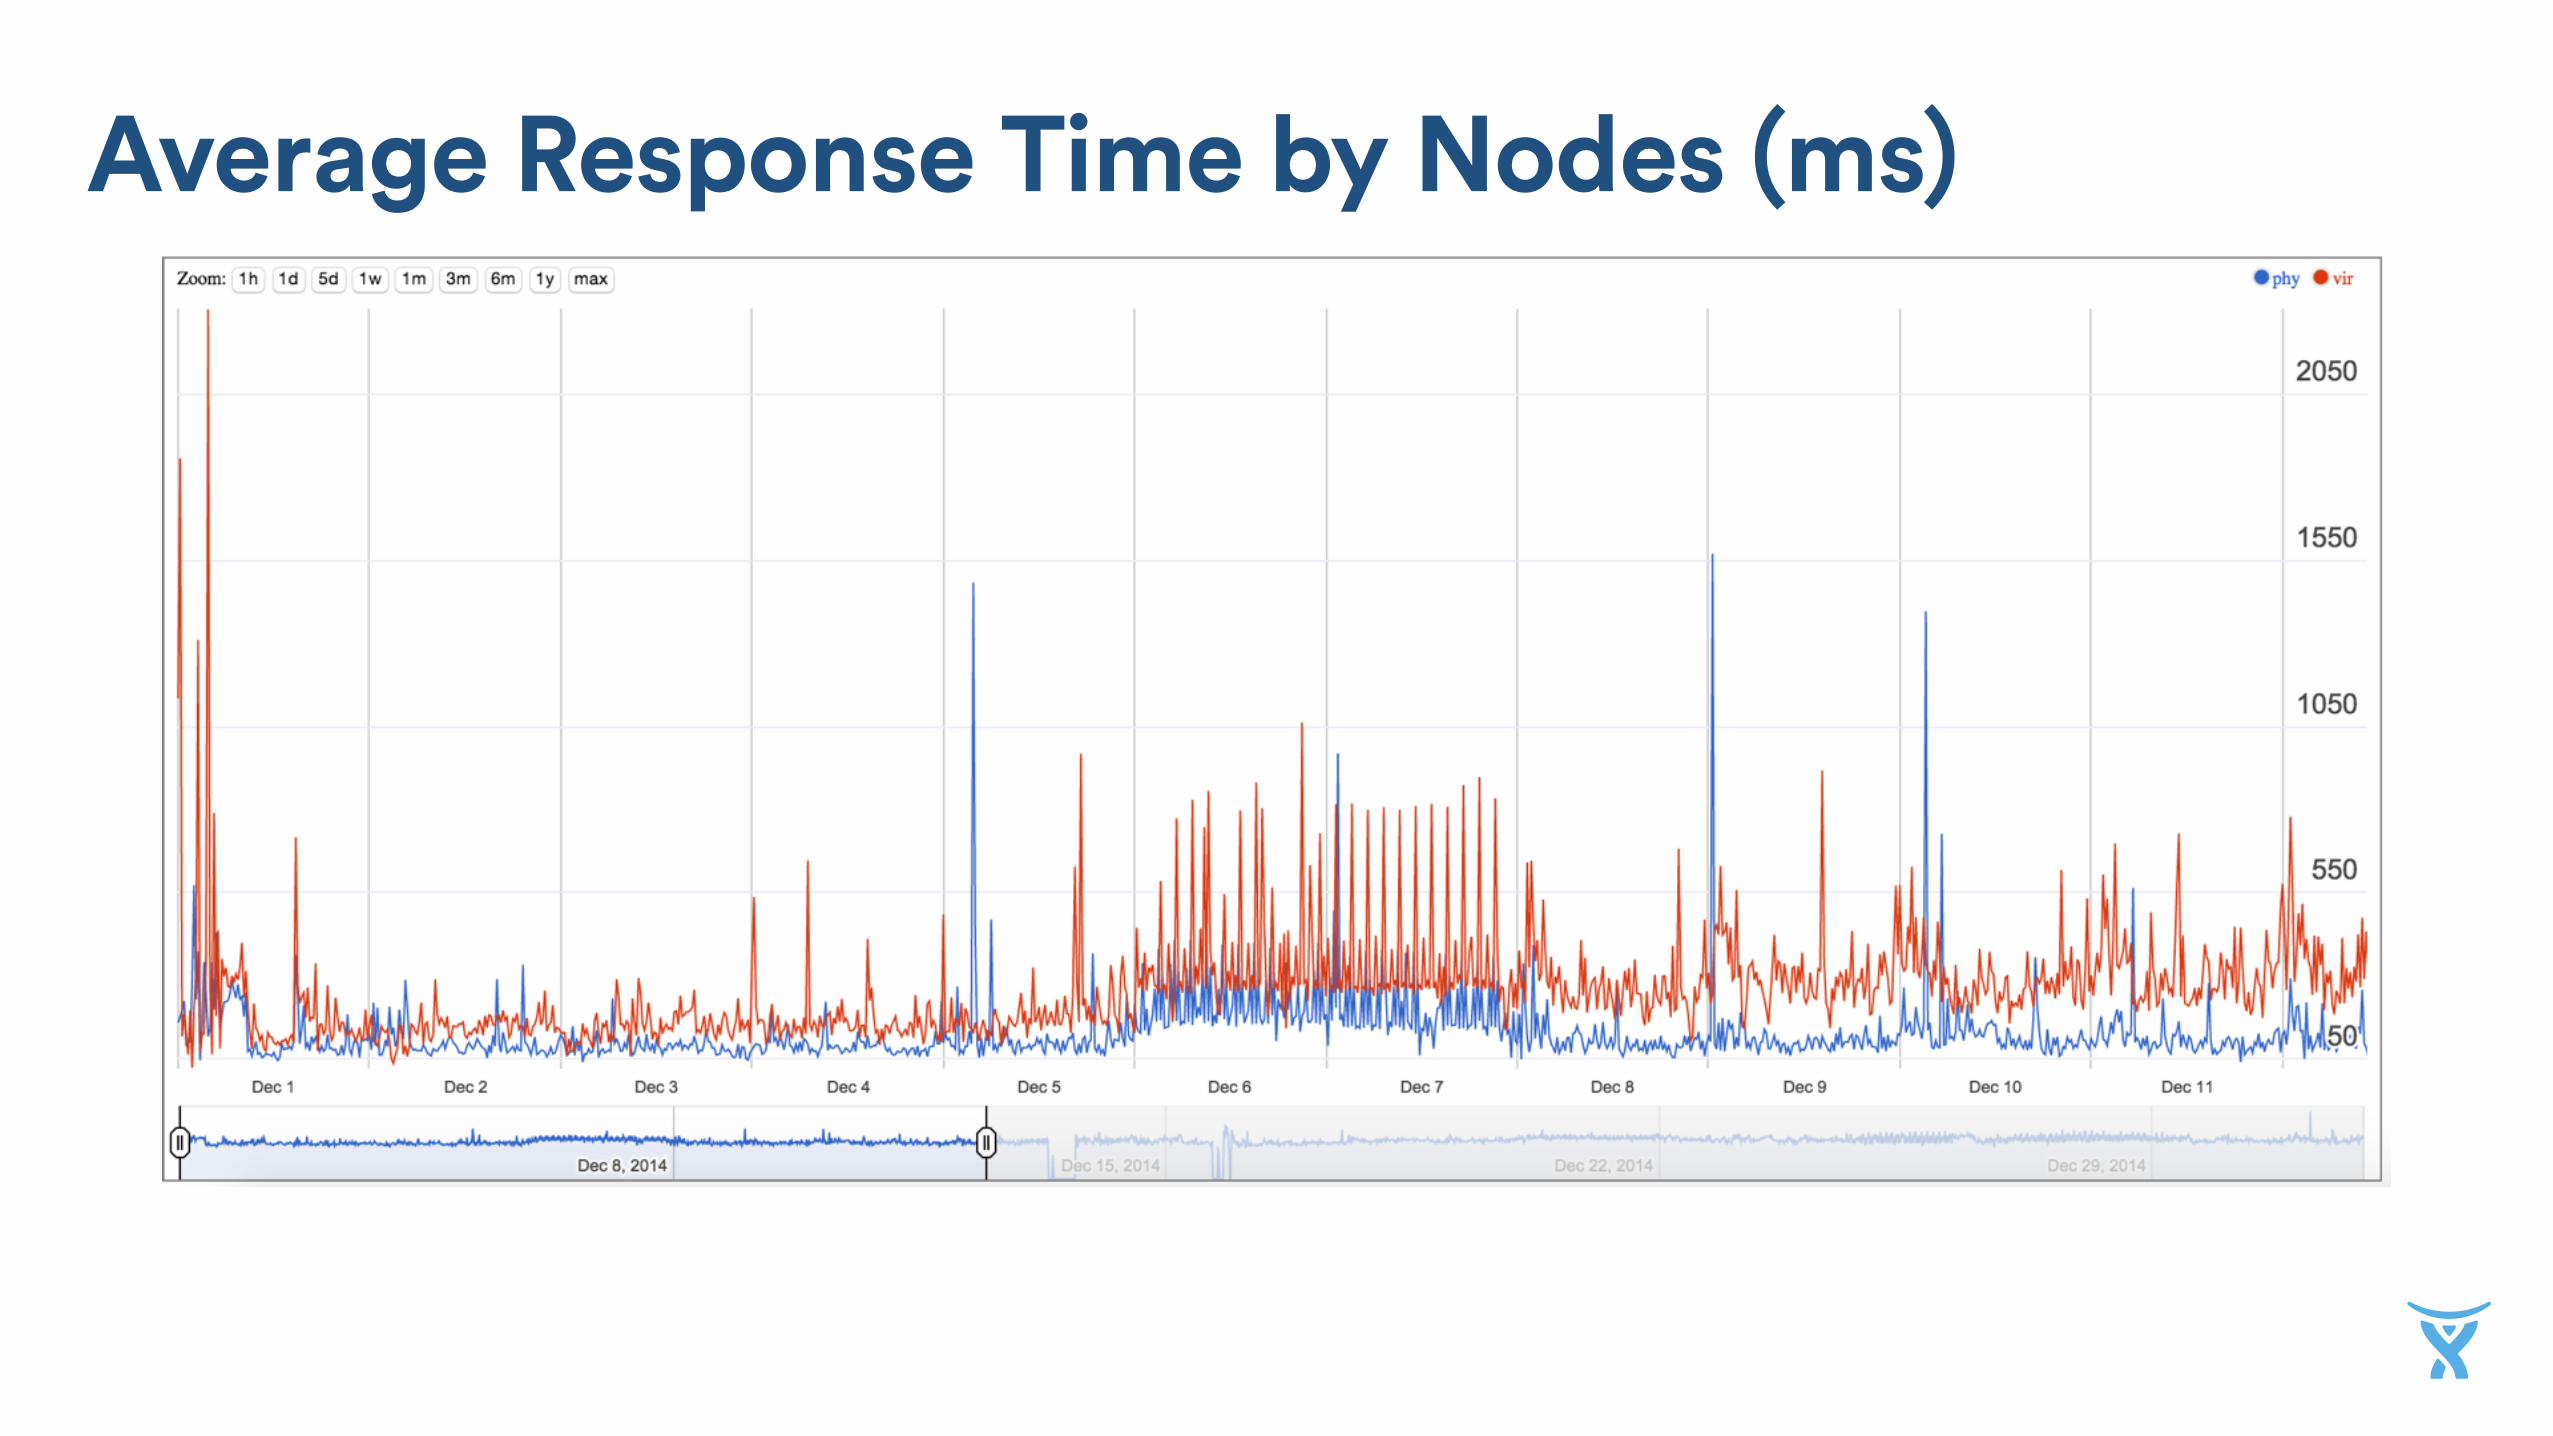
Average Response Time by Nodes (ms)

Average Response Time by Nodes (ms)

Getting the big picture

Each graph is one piece of a Jigsaw

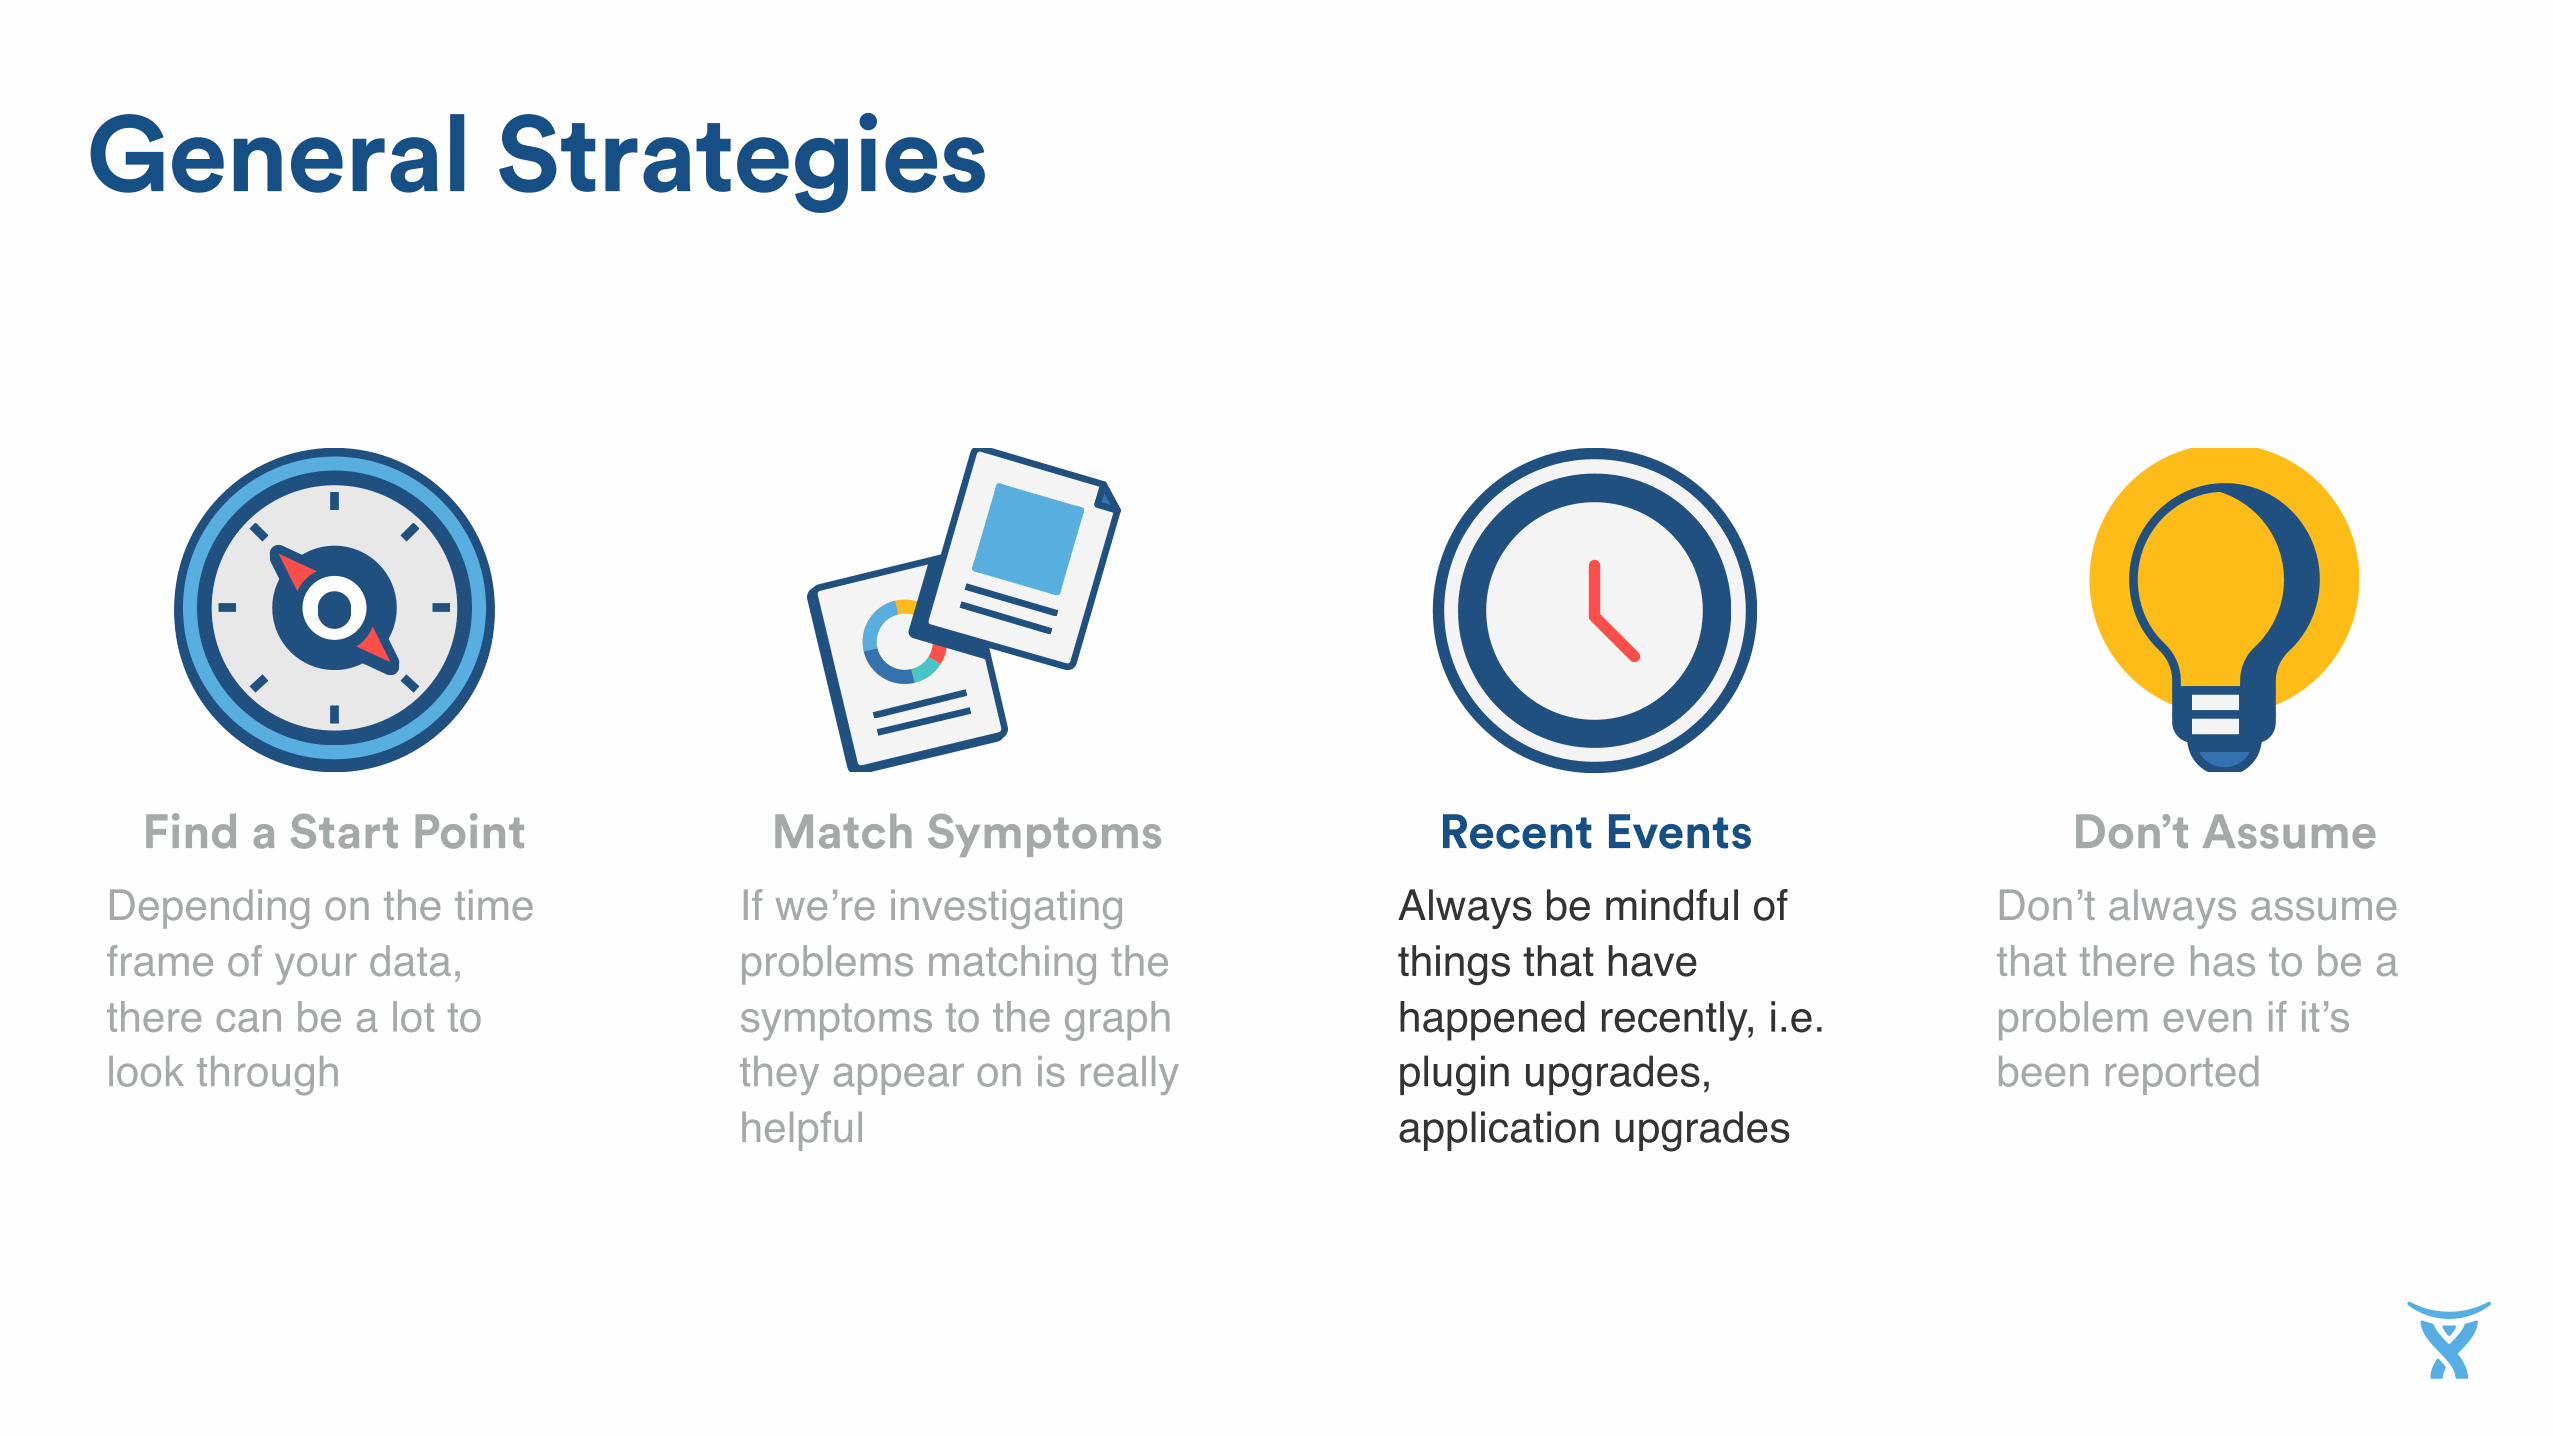
Don’t AssumeMatch SymptomsFind a Start Point
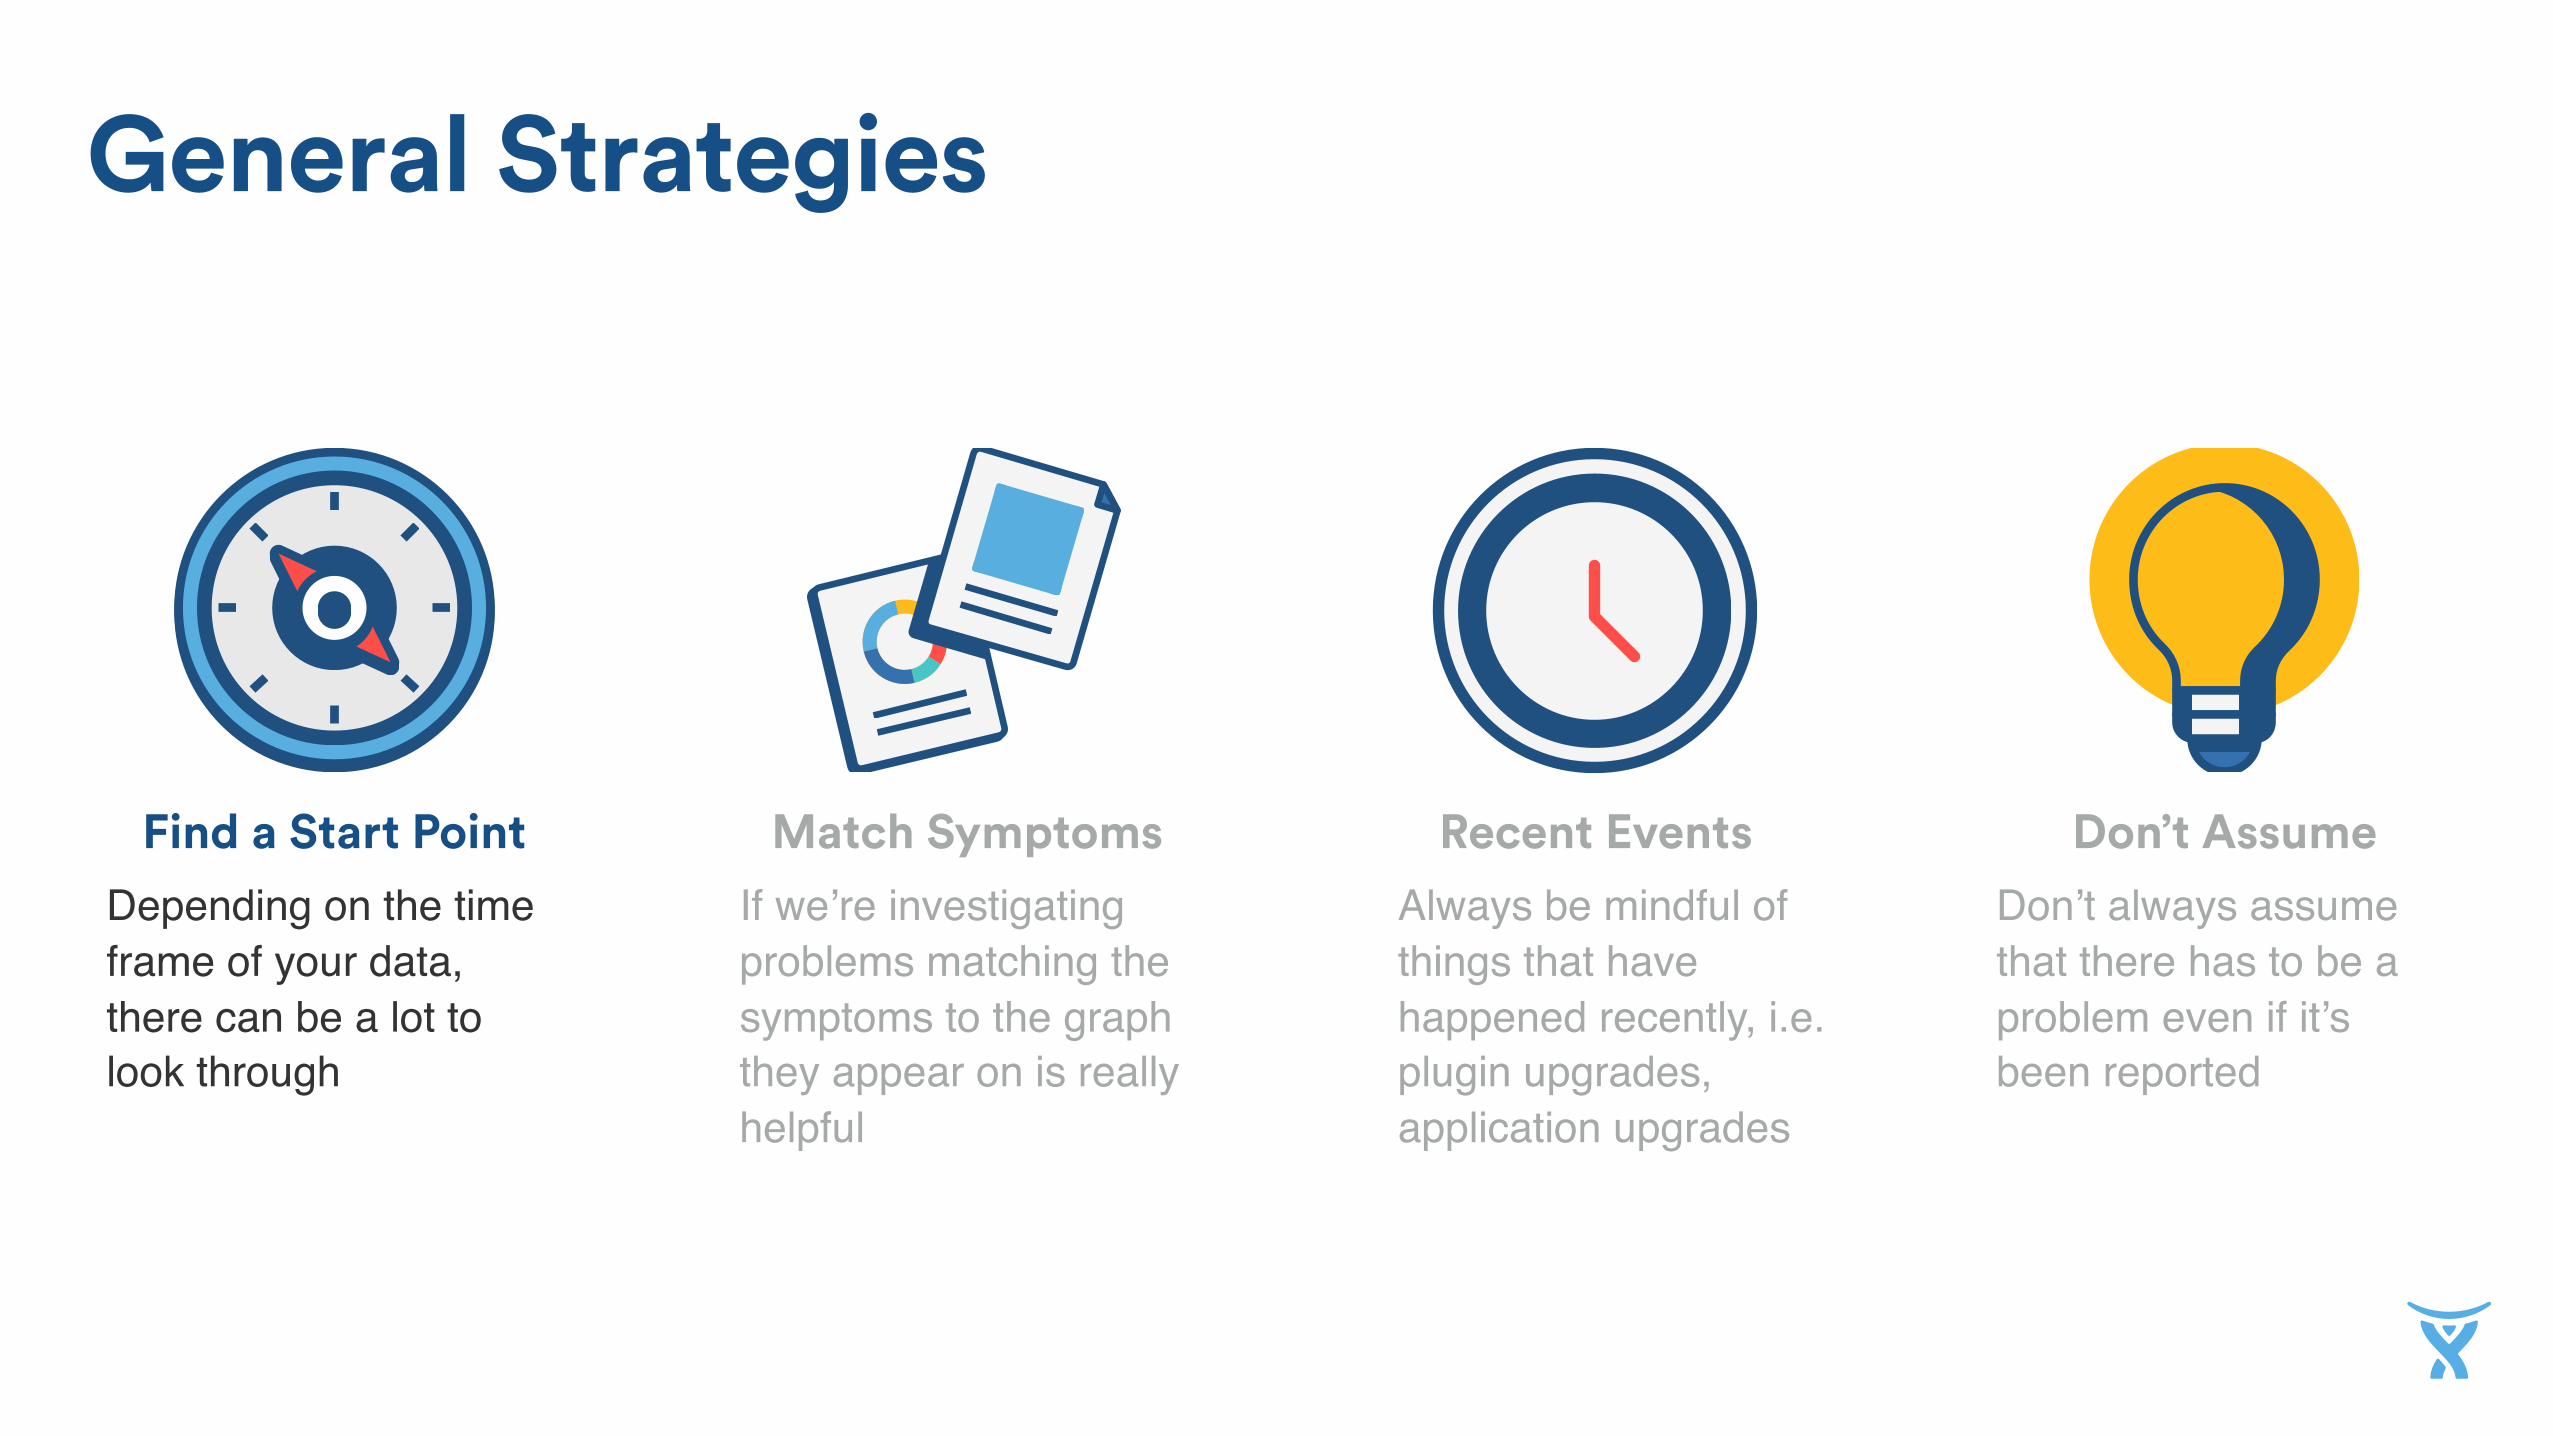
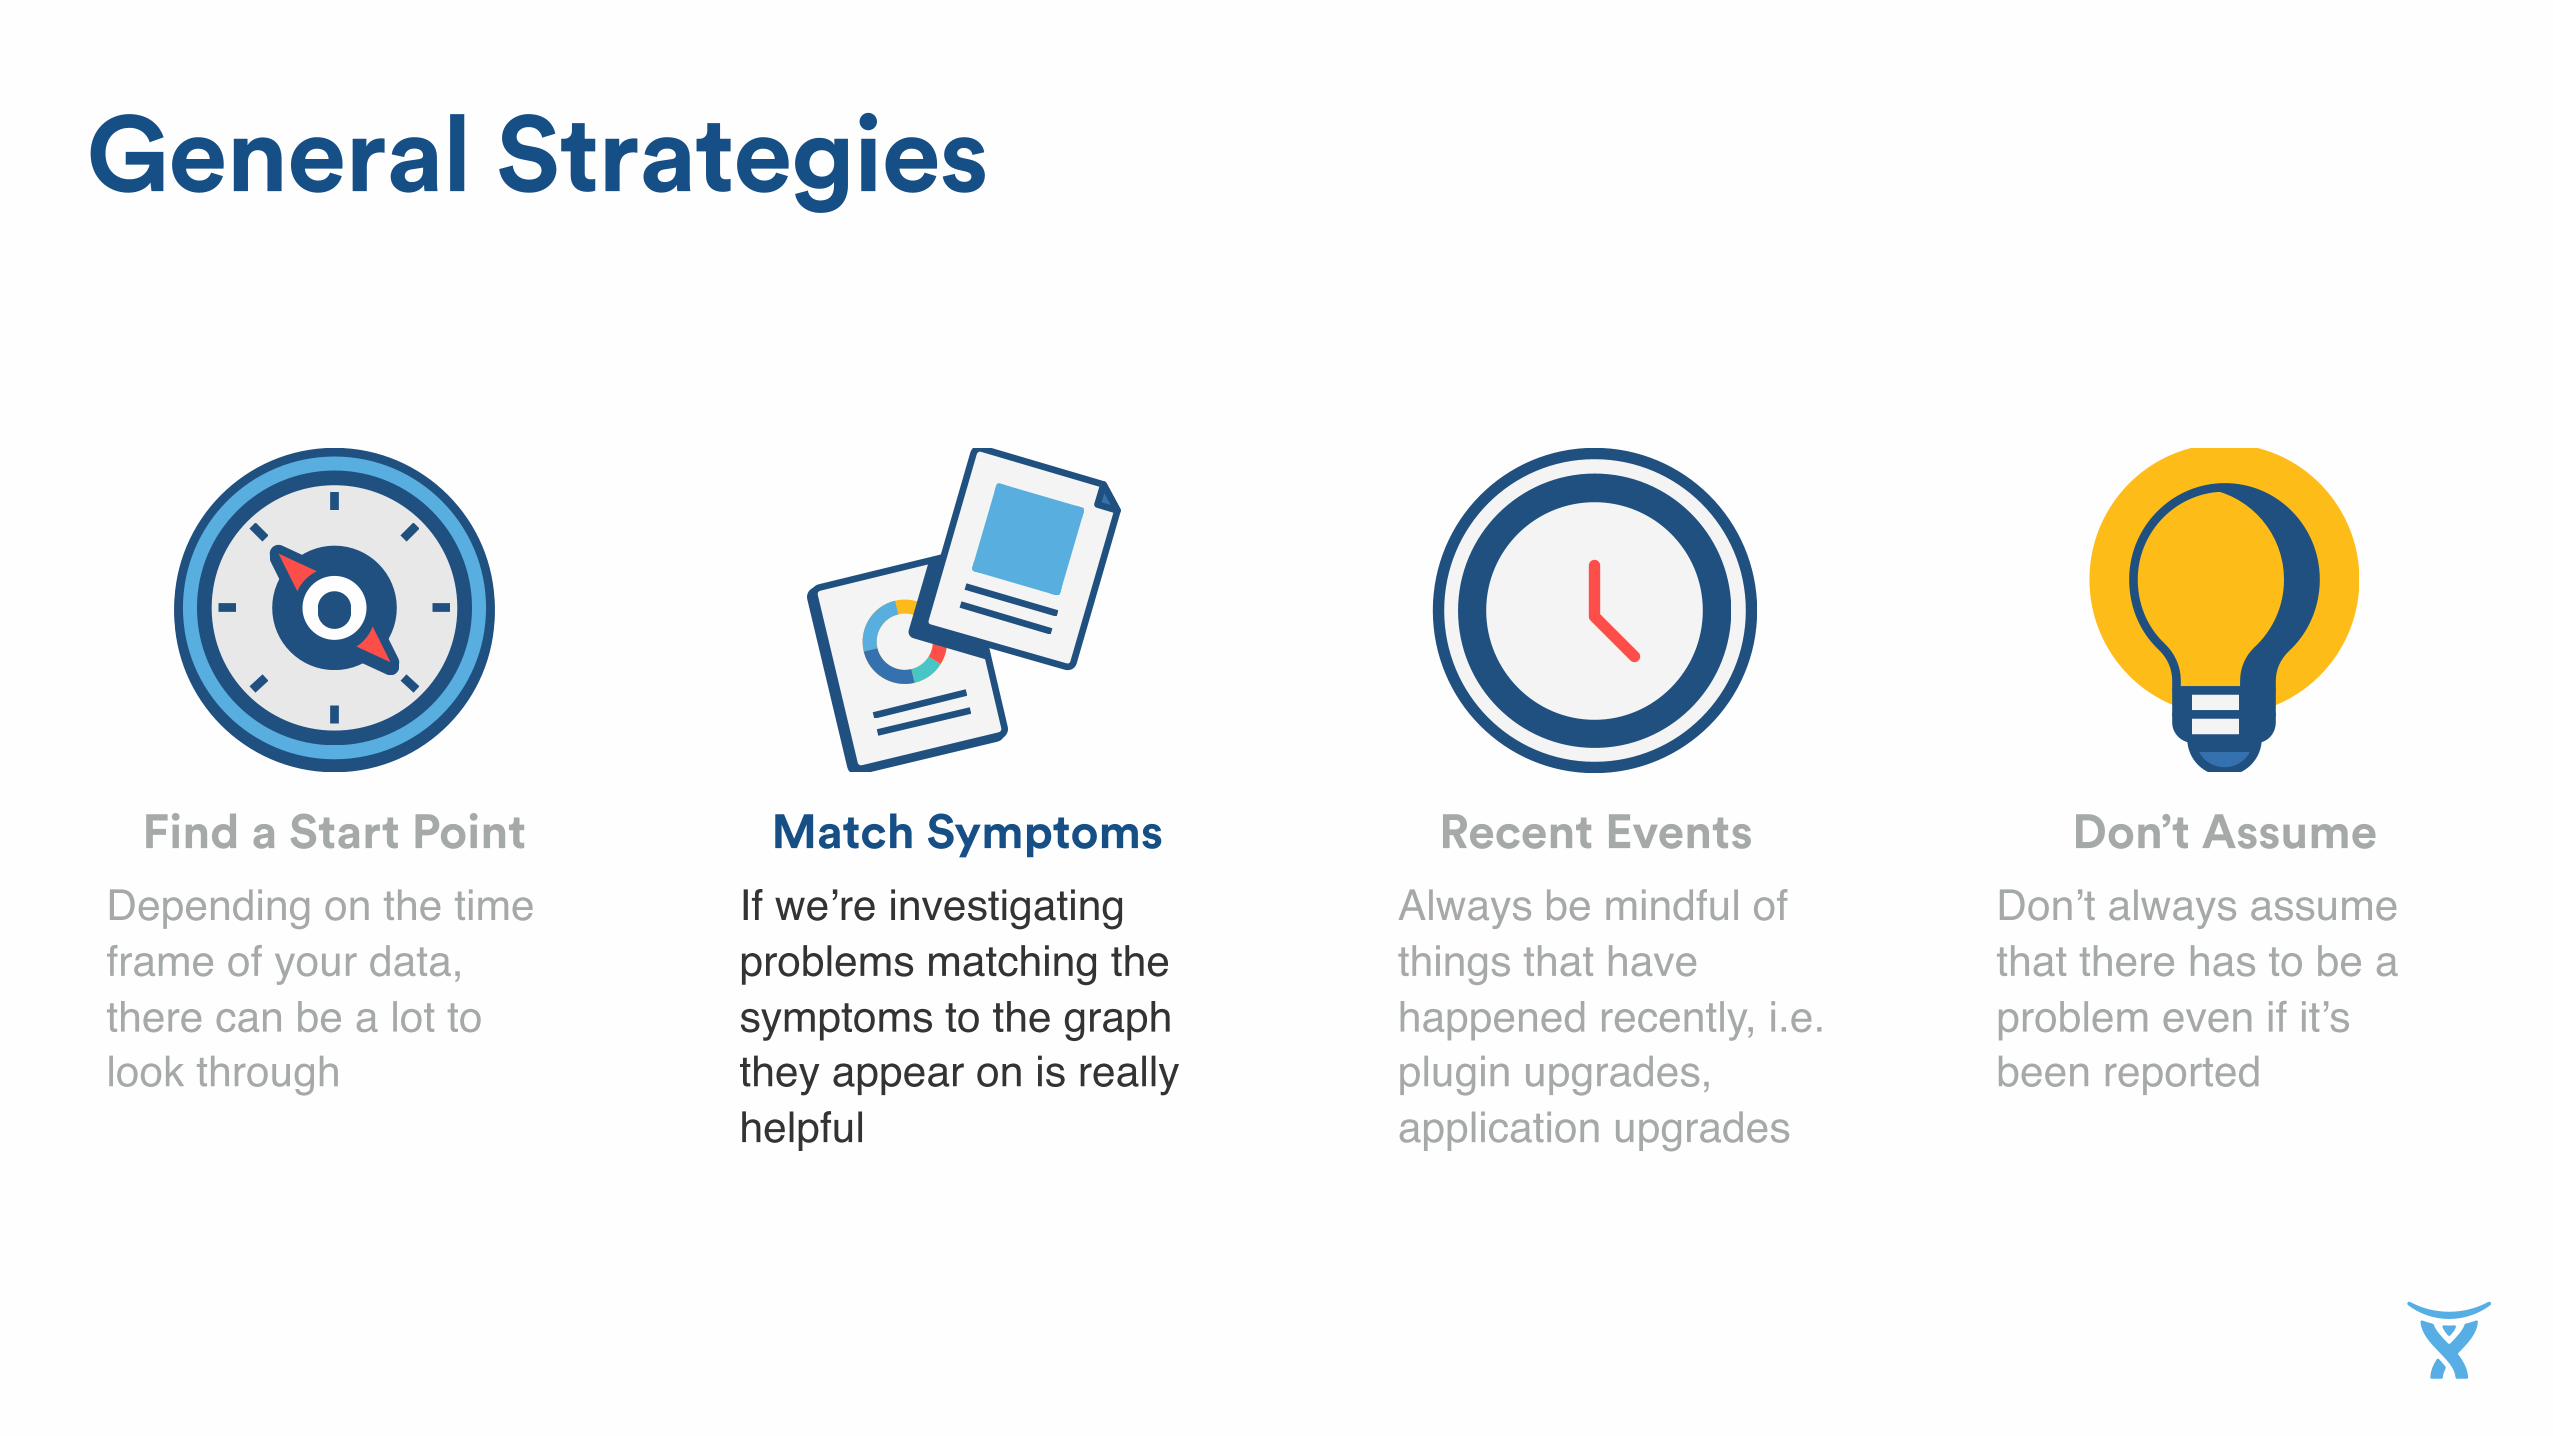
General Strategies
Recent EventsIf we’re investigating problems matching the symptoms to the graph they appear on is really helpful
Depending on the time frame of your data, there can be a lot to look through
Don’t always assume that there has to be a problem even if it’s been reported
Always be mindful of things that have happened recently, i.e. plugin upgrades, application upgrades

Don’t AssumeMatch SymptomsFind a Start Point
General Strategies
Recent EventsIf we’re investigating problems matching the symptoms to the graph they appear on is really helpful
Depending on the time frame of your data, there can be a lot to look through
Don’t always assume that there has to be a problem even if it’s been reported
Always be mindful of things that have happened recently, i.e. plugin upgrades, application upgrades

Key Takeaways
Try Perf. Monitoring
Perf. Monitoring allows you to understand why things happen
Have a StrategyAnalysing data without a strategy is like looking for a needle in a haystack
Understand Why
go.atlassian.com/jiraloganalyzer to use our log analysis tool for free.

Thank you!
LUKE DURKAN • GRADUATE DEVELOPER • ATLASSIAN