Knock Sensor Failure Behavior on Wärtsilä Gas Engines
63
Knock Sensor Failure Behavior on Wärtsilä Gas Engines Thomas Dahl Bachelor´s thesis Elecrtical Engineering Vasa 2015
Transcript of Knock Sensor Failure Behavior on Wärtsilä Gas Engines

Knock Sensor Failure Behavior on Wärtsilä
Gas Engines
Thomas Dahl
Bachelor´s thesis
Elecrtical Engineering
Vasa 2015

This is an official version of the thesis. Chapters containing confidential information have been removed from this thesis version.

BACHELOR’S THESIS
Author: Thomas Dahl Degree Programme: Electrical Engineering Specialization: Automation Technology Supervisor: Roger Mäntylä Title: Knock sensor failure behaviour on Wärtsilä gas engines
_________________________________________________________________________
Date 9.4.2015 Number of pages 62
_________________________________________________________________________
Summary This thesis contains investigations concerning the effect temperature has on the knock
measurement systems used on Wärtsilä gas engines. Testing of new knock sensors is also a
part of the thesis. The objective of the thesis is to find out the cause why the knock sensor
failure detection system is temperature sensitive in certain cases, and to find a solution to
the problem.
The thesis contains information concerning engine knocking and how it is measured, and
also a short introduction to gas engines and knock sensors. The physical phenomenon
behind the functional principle of a knock sensor is also explained.
A Root Cause analysis was performed to get an overall view of the system and the test
results.
_________________________________________________________________________
Language: English Key words: knock, piezoelectric effect, insulation resistance
_________________________________________________________________________
The thesis is available in either the web library Theseus.fi or in Tritonia Academic Library, Vaasa.

EXAMENSARBETE
Författare: Thomas Dahl Utbildningsprogram: Elektroteknik Inriktningsalternativ: Automationsteknik Handledare: Roger Mäntylä Titel: Felbeteende hos knackgivare på Wärtsiläs gasmotorer
_________________________________________________________________________
Datum 9.4.2015 Sidantal 62
_________________________________________________________________________
Abstrakt Detta examensarbete innehåller undersökningar om temperaturens inverkan på de
knackmätningssystem som används på Wärtsiläs gasmotorer. Också testning av andra
knackgivartyper finns med i examensarbetet. Målet var att hitta orsaken till att
knackgivardiagnostiksystemet är temperaturkänsligt och att hitta en lösning på problemet.
Dokumentet innehåller information som berör motorknack och hur detta mäts, samt
kortfattat om gasmotorer och knackgivare. Fysiken som behövs för att förstå
knackgivarnas funktion finns också förklarad.
En ”Root Cause-analys” har gjorts för att få en helhetsbild av systemet och alla resultat
från testerna.
_________________________________________________________________________
Språk: engelska Nyckelord: knack, piezoelektrisk effekt, isolationsresistans
_________________________________________________________________________
Examensarbetet finns tillgängligt antingen i webbiblioteket Theseus.fi eller på Tritonia, Vasa ventenskapliga bibliotek.

OPINNÄYTETYÖ
Tekijä: Thomas Dahl Koulutusohjelma: Sähköteknikka Suuntautumisvaihtoehto: Automaatiotekniikka Ohjaajat: Roger Mäntylä Nimike: Nakutusanturin vikadiagnostikkajärjestelmän käyttäytyminen Wärtsilän
kaasumoottoreissa.
_________________________________________________________________________
Päivämäärä 9.4.2015 Sivumäärä 62
_________________________________________________________________________
Tiivistelmä Tässä opinnäytetyössä on tutkittu miten lämpötila vaikuttaa nakutusjärjestelmään, jota
käytetään Wärtsilän kaasumoottoreissa. Uusien nakutusanturien testaus on myös osa
opinnäytetyötä. Opinnäytetyön tavoitteena oli löytää syy miksi nakutusanturien
vikadiagnostikkajärjestelmä on lämpötilaherkkä ja löytää ratkaisu tähän ongelmaan.
Opinnäytetyö sisältää tietoa mottorin nakutuksesta ja siitä kuinka se mitataan, sekä lyhyt
esittely kaasumoottoreista ja nakutusantureista. Nakutusanturin toiminnan taustalla olevat
fysikaaliset ilmiöt on myös selitetty.
Syy-seuraus-analyysi tehtiin, jotta saataisiin parempi kokonaiskuva järjestelmästä ja
tehdyistä testeistä.
_________________________________________________________________________
Kieli: Englanti Avainsanat: nakutus, piezosähköinen vaikutus, eristysresistanssi
_________________________________________________________________________
Opinnäytetyö on saatavissa web kirjastossa Theseus.fi tai Tritoniassa, Vaasa tieteellinen
kirjasto.

Contents
Abbreviations.................................................................................................................... 1
1 Introduction ................................................................................................................... 2
1.1 Objectives ............................................................................................................ 2
1.2 Organization ......................................................................................................... 2
1.2.1 Ship Power ................................................................................................... 2
1.2.2 Power Plants ................................................................................................. 3
1.2.3 Services ........................................................................................................ 3
2 Theory ........................................................................................................................... 3
2.1 Wärtsilä gas fuel engines ...................................................................................... 3
2.1.1 Gas engine types ........................................................................................... 4
2.1.2 Gas engine control systems ........................................................................... 4
2.1.3 WECS 8000 modules .................................................................................... 5
2.1.4 UNIC C3 modules ........................................................................................ 6
2.2 Engine knocking................................................................................................... 7
2.2.1 Reasons for knocking .................................................................................... 7
2.2.2 Effects of knocking ....................................................................................... 8
2.3 Knock sensors ...................................................................................................... 8
2.3.1 Combustion pressure sensor .......................................................................... 8
2.3.2 Mechanical Piezo sensors ............................................................................. 9
2.3.3 Functional principle of a Piezo knock sensor................................................. 9
2.3.4 Bosch knock sensors ..................................................................................... 9
2.3.4.1 Specifications .......................................................................................... 11
2.3.4.2 Design ..................................................................................................... 11
2.4 Piezoelectric effect ............................................................................................. 12
2.4.1 Applications ............................................................................................... 12
2.4.2 Direct and inverse piezoelectric effect ......................................................... 13

2.4.2.1 Direct piezoelectric effect ........................................................................ 13
2.4.2.2 Electromechanical effect (inverse piezoelectric effect) ............................. 13
2.4.3 Polarization................................................................................................. 14
2.4.4 Mathematical description ............................................................................ 17
2.4.5 Usage temperatures of piezoceramic materials ............................................ 18
2.5 Pyroelectric effect .............................................................................................. 18
2.6 Knock measurement and sensor failure detection ................................................ 20
2.6.1 Knock measurement ................................................................................... 20
2.6.2 Sensor failure detection ............................................................................... 22
2.6.2.1 Knock sensor replacement circuit ............................................................. 24
2.6.2.2 Sensor failure diagnostic circuit ............................................................... 24
2.7 Root cause analysis theory .................................................................................. 25
2.7.1 Realitycharting process ............................................................................... 25
3 Tests ............................................................................................................................ 28
3.1 General information ........................................................................................... 28
3.2 The initial problem ............................................................................................. 28
3.3 Heat cabinet ....................................................................................................... 29
3.4 KS1 heat test with WECS 8000 .......................................................................... 30
3.4.1 Test results ................................................................................................. 30
3.5 KS1 drying test................................................................................................... 31
3.5.1 Different drying times ................................................................................. 33
3.5.2 Drying time ................................................................................................ 34
3.5.3 Temperature test 2 weeks after drying ......................................................... 35
3.5.4 Mounting torque test ................................................................................... 37
3.5.5 Pyro-electric effect proof ............................................................................ 38
3.6 Insulation resistance test ..................................................................................... 39
3.6.1 Test results ................................................................................................. 39
3.7 Knock diagnostic system simulation ................................................................... 42

3.7.1 Knock sensor replacement circuit................................................................ 42
3.7.2 Simulation results ....................................................................................... 42
3.8 Engine block potential influence ......................................................................... 44
3.9 Engine block potential tests ................................................................................ 46
3.9.1 WECS 8000 ................................................................................................ 46
3.9.2 UNIC C3 .................................................................................................... 46
3.9.3 UNIC 2 ....................................................................................................... 46
3.10 Vibration tests .................................................................................................. 46
3.10.1 WECS 8000 .............................................................................................. 46
3.10.2 UNIC C3 .................................................................................................. 46
3.10.3 UNIC 2 ..................................................................................................... 46
4 Root Cause Analysis .................................................................................................... 47
4.1 Incident report .................................................................................................... 47
4.2 Reality Charting Possible Solutions Report ........................................................ 48
1.1 Realitychart ........................................................................................................ 50
5 Results ......................................................................................................................... 51
6 Discussion.................................................................................................................... 53
Bibliography ................................................................................................................... 54

1
Abbreviations
WECS Wärtsilä Engine Control System
UNIC Unified Control
BMEP Break Mean Even Pressure
KSFD Knock Sensor Failure detection
DSP Digital Signal Processing
CCM Cylinder Control Module
MCM Main Control Module
IOM Input Output Module
LDU Local Display Unit
ESM Engine Safety Module
WCD Wärtsilä Coil Driver
SG Spark Ignited Gas
DF Dual Fuel
GD Gas Diesel
RCA Root Cause Analysis

2
1 Introduction
1.1 Objectives
The primary goal of the thesis work is to identify and map how ambient conditions affect
the output signal from the knock sensors used on Wärtsilä gas engines. The target is also to
find working solutions on how to bypass or compensate for the effect of the signal
fluctuations associated with the different ambient conditions.
The secondary goal is to scan the market for alternative sensors or solutions available that
could be implemented on existing engines. Currently there are three different generations
of automation systems in use on Wärtsilä engines, and the study must take into account
how each system is affected.
1.2 Organization
Wärtsilä is a global leader in complete lifecycle power solutions for marine and energy
markets. By emphasising technological innovation and total efficiency, Wärtsilä
maximizes the environmental and economic performance of the vessels and power plants
of its customers. In 2013, Wärtsilä's net sales totalled EUR 4.7 billion with approximately
18,700 employees. The company has operations in more than 200 locations in nearly 70
countries around the world. Wärtsilä is listed on NASDAQ OMX Helsinki, Finland.
1.2.1 Ship Power
Wärtsilä enhances the business of its marine and oil & gas industry customers by providing
products and integrated solutions that are safe, environmentally sustainable, efficient,
flexible, and economically sound. The solutions are developed based on customers' needs
and include products, systems and services.

3
1.2.2 Power Plants
Wärtsilä Power Plants is a leading global supplier of flexible base load power plants of up
to 600 MW operating on various gaseous and liquid fuels. The product portfolio includes
solutions for peaking, reserve and load-following power generation, as well as for
balancing intermittent power production. Wärtsilä Power Plants also provides LNG
terminals and distribution systems. As of 2014, Wärtsilä has 55 GW of installed power
plant capacity in 169 countries around the world.
1.2.3 Services
Wärtsilä Services supports its customers throughout the lifecycle of their installations by
optimising efficiency and performance. The Service department provides services for both
energy and marine markets. [1]
2 Theory
2.1 Wärtsilä gas fuel engines
Wärtsilä has several different types of gas-fuel
engines, types which only run on gas like SG
engines, or DF and GD engines which can run on
either liquid fuels or gas.
Gas engines run with so-called lean burn combustion (not the GD engine). This means that
the air/fuel ratio (lambda) on gas engines is approximately lambda 2, compared to a diesel
engine for which the ratio is lambda 1. This makes the gas engines produce less emissions
and the efficiency of the engines is increased.
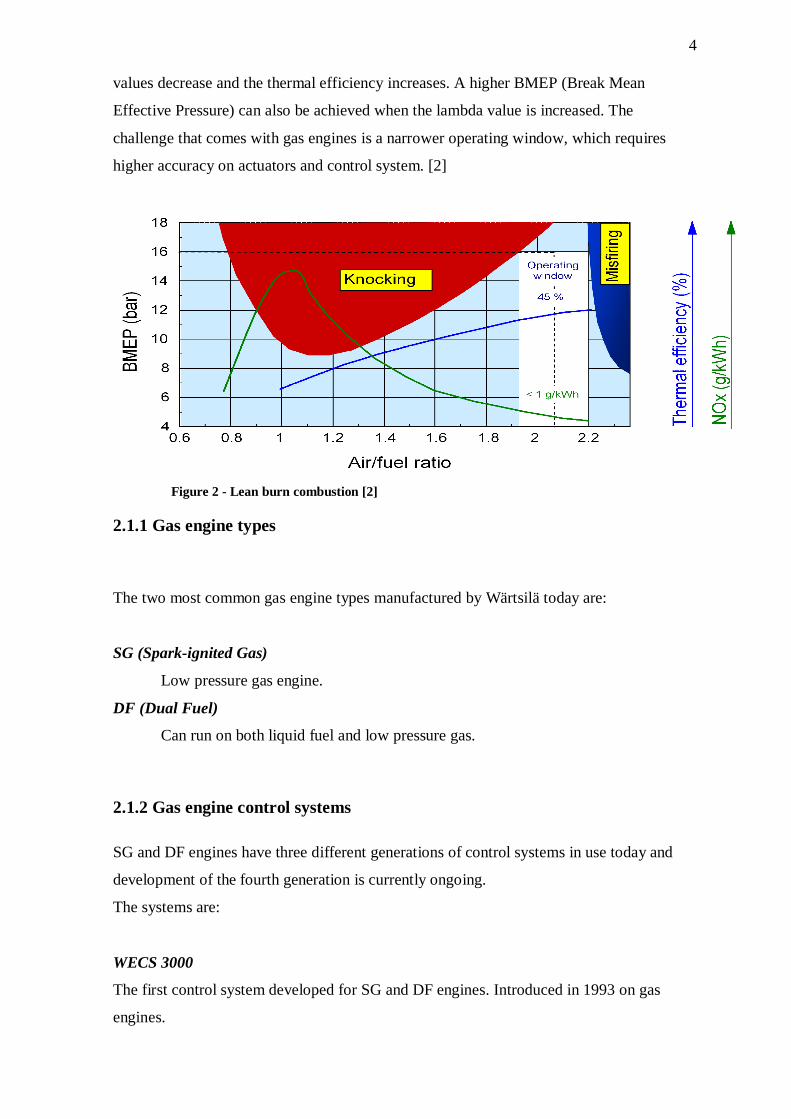
Figure 2 shows the operating window for gas engines. Here the benefits of a gas engine,
compared to a diesel engine, can easily be seen. As the air/fuel ratio increases, the NOx
Figure 1 - 34SG engine [2]
4
values decrease and the thermal efficiency increases. A higher BMEP (Break Mean
Effective Pressure) can also be achieved when the lambda value is increased. The
challenge that comes with gas engines is a narrower operating window, which requires
higher accuracy on actuators and control system. [2]
Figure 2 - Lean burn combustion [2]
2.1.1 Gas engine types
The two most common gas engine types manufactured by Wärtsilä today are:
SG (Spark-ignited Gas)
Low pressure gas engine.
DF (Dual Fuel)
Can run on both liquid fuel and low pressure gas.
2.1.2 Gas engine control systems
SG and DF engines have three different generations of control systems in use today and
development of the fourth generation is currently ongoing.
The systems are:
WECS 3000
The first control system developed for SG and DF engines. Introduced in 1993 on gas
engines.

5
WECS 8000
New hardware and new software design compared to WECS3000. Introduced in 1998.
UNIC C3
The current generation of control system for gas engines. The first control system with
hardware completely designed by Wärtsilä. Production started in 2002.
UNIC2
The newest control system which is estimated to be taken in production on some pilot
engines during 2015.
2.1.3 WECS 8000 modules
The WECS 8000 engine control system consists of the following modules:
MCM-700 - Main control module
Main control module, handles the main functions such as starting/stopping and speed
measuring on the engine.
CCM10 - Cylinder controller module
Controls cylinder specific functions as exhaust gas temperature measurements, knock
measuring and fuel injection for each cylinder.
ESM-10 - Engine safety module
ESM handles safety functions on the engine. ESM is an independent safety system for the
engine with standardized solutions - its hardware and working principles are common for
all engine applications and it uses unified marine and power plant solutions. The ESM
provides a standardized stop circuitry for all actions and a standard interface to the engine
control system and external systems with a predefined setting. The ESM also handles
speed measuring and other similar functions.
LDU-10 – Local display unit
LDU (Local Display Unit) is a microprocessor-based display and Ethernet gateway unit
adapted for Wärtsilä applications. The LDU-10 acts as an operator interface and as a
communication interface to other networks.

6
WCD-10 Wärtsilä coil driver
Module used for spark plug ignition. Used on SG engines only, performs ignition to up to
10 cylinders. Capacity to perform one to six sparks per event to each spark plug
(multispark). [3]
2.1.4 UNIC C3 modules
The UNIC engine control system comprises the following modules:
MCM-11 Main Control Module
The MCM is the main module of the engine and it controls among other things starting and
stopping of the engine. The MCM also controls many of the other modules in the UNIC
system.
CCM-20 Cylinder Control Module
As implied by the name, CCM handles functions related to cylinders. It controls fuel
injection and cylinder specific measurements. One CCM can handle injection for up to
three cylinders simultaneously and can act as a backup unit for another three cylinders. The
CCM is also capable of functioning in limp mode if the CAN buses fail or if the MCM
fails.
IOM-10 Input Output Module
The IOM-10 is a universal, configurable, microprocessor-based data acquisition unit. It has
a variety of flexible analogue and digital measuring channels for different applications.
Two analogue outputs and eight digital outputs are also provided.
ESM-20 Engine Safety Module
The ESM is an important module, if not the most important. It handles functions related to
the safety of the engine. Also related to the engine safety, the module handles speed
measuring and monitoring. Other functions include e.g. monitoring of the lube oil pressure
and the cooling water temperature.

7
LDU-20 Local Display Unit
LDU-20 is a microprocessor-based display and Ethernet gateway unit adapted for Wärtsilä
applications. The LDU-20 acts as an operator interface and as a communication interface
to other networks. LDU-20 is the next LDU version after LDU-10. [3, 4]
2.2 Engine knocking
“Knock is the name given to the noise which is transmitted through the engine structure
when essentially spontaneous ignition of a proportion of the end-gas ahead of the
propagating flame front occurs”. The fuel-air mixture is meant to be ignited by a spark
plug only, and at a precise point in the piston's stroke. Knock occurs when the peak of the
combustion process no longer occurs at the optimum moment for the four-stroke cycle.
The shock wave creates the characteristic metallic "pinging" sound, and cylinder pressure
increases dramatically. Effects of engine knocking can be inconsequential or completely
destructive. [5]
2.2.1 Reasons for knocking
Knocking is a result of temperature, pressure and time. If, for instance, the temperature and
pressure of the end gases reach the threshold for self-ignition before the flame front
initiated by the spark has had time to propagate to the cylinder walls, a knock will occur./4/
Several factors can cause knocking, for example:
- High compression of air-fuel mixture
- High temperature of cylinder wall
- Glowing combustion (engine oil) residues in the cylinder
- Methane number of the fuel too low
- Inhomogeneous air-fuel mixture
- Engine speed and engine load
- Ignition timing too early

8
2.2.2 Effects of knocking
Knocking has many different effects on engines. These range from mechanical wear to an
actual damaging effect on different parts on the engine.
When knocking occurs, the cylinder pressure can be remarkably higher compared to the
pressure at normal combustion. The same applies for the temperature in the cylinders. This
leads to an increased risk of engine seizure. Engine parts may suffer from mechanical
deformation because of knocking, due to the increased pressure and temperature inside the
cylinder chamber. Engine efficiency is also something that is directly affected by
knocking. Comparing an engine under normal running conditions with a heavily knocking
engine shows that engine efficiency drops several percent. Effects of engine knocking
range from inconsequential (light knocking) to completely destructive (heavy knocking).
[4, 6]
Direct effects of prolonged knocking includes:
-Damaged cylinder heads and cylinder head gaskets
-Piston seizure
-Melting pistons and valves
-Increasing abrasion on bearings
-Higher fuel consumption
-Higher level of exhaust gas emissions.
2.3 Knock sensors
Knock can be measured in several different ways. Wärtsilä uses two different methods
which include two different sensor types. One method is to measure the cylinder peak
pressure and in that way detect knocking. The other way is a detection system which is
using mechanical piezo knock sensors. [6]
2.3.1 Combustion pressure sensor
A direct approach is to analyze the combustion pressure-curve. In this approach the sensors
measure the pressure inside the combustion chamber of a running engine. This approach
provides the best signal to analyze and it is used on some Wärtsilä engines. However, the
direct approach is not available on all engines, as the sensor cost is relatively high and each
cylinder requires its own sensors. [4]

9
2.3.2 Mechanical Piezo sensors
This type of knock sensor is a structure-borne noise microphone and transforms the engine
vibrations caused by normal combustion and caused by knocking combustion to electrical
signals. It measures the structure-borne vibrations on the cylinder that occur at
uncontrolled combustion. As a result of the forces generated by the vibrations in the engine
the piezo-elements in the sensors generate a voltage that can be measured. [4] This is the
type of sensor which will be tested in this report.
2.3.3 Functional principle of a Piezo knock sensor
The functionality of this sensor type is based on the piezoelectrical effect which is
described in the piezoelectric effect chapter in this report.
A sensor consists of three main parts: a piezoceramic disc, a seismic mass and contact
discs placed on each side of the piezo disc. The inertia of the seismic mass causes changing
pressure forces on the Piezo ceramic disc corresponding to the acceleration. This
rhythmical increase and decrease of the pressure force causes a movement of the electrical
charges in the ceramic disc (Piezo effect) which can conducted by the contact discs and be
measured as a voltage signal. [3]
Figure 3- Functional principle of a knock sensor [6]
2.3.4 Bosch knock sensors
The sensors which are used by Wärtsilä and investigated in this report are manufactured by
Bosch. Two models are investigated in this report, the KS1 model and the KS4 model.

10
KS1
The knock sensor type which is presently used on Wärtsilä engines is the KS1 type.
Nowadays Bosch is manufacturing this model for only a few customers, including
Wärtsilä. The model was developed about 25 years ago.
KS4
KS4 is developed from the KS1 sensor and is now the knock sensor that Bosch
manufactures most of. Samples of this model were ordered with the purpose to test if this
model would be suitable and have better insulation resistance than the KS1 sensors.
The main differences between the KS1 and the KS4 sensors are:
Changed piezomaterial from Sonox P4 to Sonox P8
Smaller housing diameter
Threaded ring replaced by crimps
Changed housing design
KS4 with new molding material
A KS4 sensor is a model with a new type of molding material that is less temperature
sensitive. The heat stabilizer in the old molding material used on previous sensors was
based on metal salts, which results in a decreasing insulation resistance due to moisture
ingress. The heat stabilizer in the new molding material is metal salt free and is not as
moisture sensitive as the old material. [Alfred Glatz, personal communication, 14.2.2015]
Figure 4 - KS1 sensor
Figure 5 - KS4 sensor

11
2.3.4.1 Specifications
These specifications are valid for knock sensors with brass support sleeve.
KS1 KS4
Sensitivity (5 kHz, 190 pF load capacitance) 26 ± 8 mV/g 30 ± 6 mV/g
Linearity from 5...20 kHz ± 15% ± 10%
Frequency range 3...22 kHz 3...25 kHz
Main resonance frequency > 30 kHz > 30 kHz
Insulation resistance > 1 M > 1 M
Sensor capacitance 800...1600 pF 950...1350 pF
Operating temperature: silver/gold plated -40...150 °C -40...150 °C
Temperature dependency < -0.06 mV/g K < -0.04 mV/g K
[6]
2.3.4.2 Design
The following figure is an exploded view of a Bosch KS4- knock sensor.
Figure 6 - Design of a KS4 knock sensor [6]

12
2.4 Piezoelectric effect
Piezoelectricity can shortly be explained as the electric charge that accumulates in certain
solid materials in response to applied mechanical stress (direct piezoelectric effect). The
word piezoelectricity means electricity resulting from
pressure. It is derived from the Greek piezo or piezein
), which means to squeeze or press.
The piezoelectric effect is a reversible process, in which
materials exhibiting the direct piezoelectric effect also
exhibit the reverse piezoelectric effect. This means that an
applied electric field causes a mechanical strain in the
piezomaterial. [7]
2.4.1 Applications
Piezo technology is used in high-end technology markets, such as medical technology,
mechanical and automotive engineering or semiconductor technology, but is also present
in everyday life, for example as generator of ultrasonic vibrations in a cleaning bath for
glasses and jewellery or in medical tooth cleaning.
Piezo actuator technology has also gained acceptance in automotive technology, because
piezo-controlled injection valves in combustion engines reduce the transition times and
significantly improve the smoothness and exhaust gas quality. Several models of piezo-
sensors are also occurring in the automotive technology and in the industry.
Piezo-based ultrasonic sensors are used as park distance control and monitor the heartbeats
of babies prior to birth. Ultrasound is defined as sound at frequencies above the human
hearing frequency range, i.e. starting from around 16 kHz. Industry, medical technology
and research use this frequency range for many purposes. Applications range from distance
measurement and object recognition, filling level or flow rate metering, to ultrasonic
welding or bonding, high-resolution material tests, and medical diagnostics and therapy.
[8]
Figure 7 - Piezoelectric effect principle [7]
13
2.4.2 Direct and inverse piezoelectric effect
The piezoelectric effect can be split up into two parts depending on if a voltage is applied
or produced.
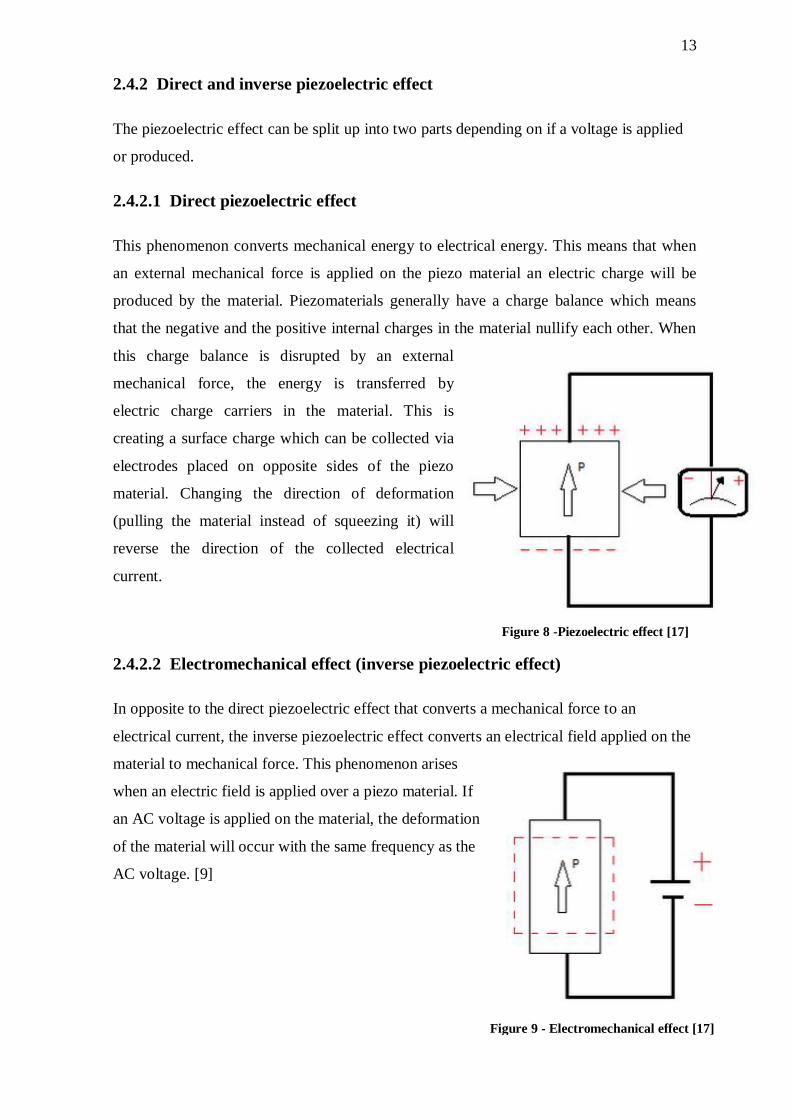
2.4.2.1 Direct piezoelectric effect
This phenomenon converts mechanical energy to electrical energy. This means that when
an external mechanical force is applied on the piezo material an electric charge will be
produced by the material. Piezomaterials generally have a charge balance which means
that the negative and the positive internal charges in the material nullify each other. When
this charge balance is disrupted by an external
mechanical force, the energy is transferred by
electric charge carriers in the material. This is
creating a surface charge which can be collected via
electrodes placed on opposite sides of the piezo
material. Changing the direction of deformation
(pulling the material instead of squeezing it) will
reverse the direction of the collected electrical
current.
2.4.2.2 Electromechanical effect (inverse piezoelectric effect)
In opposite to the direct piezoelectric effect that converts a mechanical force to an
electrical current, the inverse piezoelectric effect converts an electrical field applied on the
material to mechanical force. This phenomenon arises
when an electric field is applied over a piezo material. If
an AC voltage is applied on the material, the deformation
of the material will occur with the same frequency as the
AC voltage. [9]
Figure 9 - Electromechanical effect [17]
Figure 8 -Piezoelectric effect [17]

14
2.4.3 Polarization
A presumption for a piezoelectrical and pyroelectrical material is that the material is
polarized. Polarization is a vector quantity, it has magnitude and direction. These
properties are imparted to the piezoceramic during the manufacturing process.
A molecule is polarized if the average position of all of its positive ions is not the same as
the average position of all of its negative ions. For example, a water molecule has a bond
angle of 104.5° between the oxygen and the two hydrogen atoms. As a result the average
position of the two positive ions is not centred on the oxygen ion as it would be if the bond
angle were 180°, and therefore the water molecule is strongly polarized.
Figure 10 – Polarization in a water molecule [10]
The Curie temperature is the critical temperature when the piezoceramics loses its
polarization. For example, if the water molecule would be a piezoceramic, then the average
bound angle would change to 180° when the temperature exceeds the Curie temperature.
Increasing temperature of the piezomaterial results in a greater internal energy in the
material. This causes the negative charged particle to start oscillating from above to below
the plane with an average position in the middle of the plane. The crystal structure in a
piezoceramic is becoming symmetric above the Curie temperature.

15
The polarization in a piezoceramic can be explained with a mechanical model of four balls
(positive ions) placed in the corners of a square frame. The four balls are connected with
springs to a single central ball (negative ion). The bond length (length of the springs)
pushes the negative ion out of the plane of the four corner positive ions. The ceramic is
now polarized.
Figure 11 - Polarization in a piezoceramic [10]
Figure 11-A shows a simplified piezocrystal structure above Curie temperature. The
negative ion is now oscillating from above to below the plane, and receives an average
position in the centre of the plane.
Figure 11-B shows a simplified piezocrystal structure below Curie temperature. The
negative ion is now forced to stay either above or below the middle of the plane. The
negative ion is now oscillating but with an average position above or under the plane
centre position. This is what makes the crystal polarized. The crystal has now received a
net polarization in the direction from the negative ion in the direction of the plane (as the
arrow describes).
Piezoceramics are not formed by a single crystal, but by grains of crystal separated by
glassy interfaces and containing various flaws. These crystals are obtaining a spontaneous

16
polarization, which means that the direction of the polarization of each crystal differs
spontaneously from each other. The net polarization in a sample of a piezoceramic is
therefore close to zero. At best the polarization in the sample can be less than 60% of the
polarization which could be found in a single crystal of the same formulation.
Figure 12 - Polarization in a piezoceramic [10]
Figure 12-A shows a piezoceramic with net polarization zero. This because of the fact that
the domains spontaneously points in different directions.
Figure 12-B shows a piezoceramic which is exposed to a large electric field. This field has
now flipped direction of some domains so that the net polarization in the material is no
longer zero. Note that the majority of the domains now are directed against minus of the
electrical field, and only the domains that didn´t point that way before changed direction.
The same behaviour occurs when an external force is applied on the piezoceramic.
Polarization of a ceramic is not permanent. The polarized ceramic has higher energy and
lower entropy than it had before polarization. Random variations due to heat, stress, noise
and quantum tunnelling will decrease the polarization of the ceramic. Depoling of a
ceramic is usually a logarithmic process. For example, a sample of a piezoceramic may
lose 2% of its net polarization in the first hour after being polarized, followed by another
2% the next ten hours, and so on. The rate of depolarization of a piezoceramic increases
rapidly as the temperature approaches the Curie temperature of the ceramic. [10]

17
2.4.4 Mathematical description
This section will present the basic mathematical formulation describing the
electromechanical properties of piezoelectric materials. As explained in previous sections,
when a polarized piezoelectric material is mechanically strained it becomes electrically
polarized, producing a fixed electric charge on the surface of the material. If electrodes are
attached to the surfaces of the material, the generated electric charge can be collected and
used. Following the linear theory of piezoelectricity, the density of a generated fixed
charge in a piezoelectric material is proportional to the external stress. In a first
mathematical formulation, this relationship can be simply written as:
=
Where,
Ppe = the piezoelectric polarization vector, whose magnitude is equal to the fixed charge
density produced as a result of piezoelectric effect.
d = the piezoelectric strain coefficient.
T = the stress to which piezoelectric material is subjected.
For simplicity, the polarization, stress, and the strain generated by the piezoelectric effect
have been specified with the ‘pe’ subscript, while those externally applied do not have any
subscript. In a similar manner, the indirect/reverse piezoelectric effect can be formulated
as:
=
Where,
Spe = the mechanical strain produced by reverse piezoelectric effect
E = the magnitude of the applied electric field.
Considering the elastic properties of the material, the direct and reverse piezoelectric
effects can alternatively be formulated as:
= = =
= = =
Where,
c = the elastic constant relating the generated stress and the applied strain
18
(T=c·S), is the compliance coefficient which relates the deformation produced by the
application of a stress (S=s·T)
e = the piezoelectric stress constant [11]
2.4.5 Usage temperatures of piezoceramic materials
The temperature at which a piezoceramic is to be used is often the most important factor
when choosing the piezo material for a specific application. A guideline is to choose the
material with the usage temperature not exceeding about half of the Curie temperature of
the piezoceramic.
A polarized piezoceramic has decreased entropy. Thermal variations increase the entropy
of systems, thus causing parts to depolarize over time. The rate of this depolarization
increases over time. The usage temperature is a function of the ambient temperature for the
application and the amount of energy that will be dissipated in the ceramic.
For some applications the temperature in the ceramic can be tens or even hundreds of
degrees above the ambient temperature. In general, as the temperature rises the useful
properties of the piezoceramic will get worse.
Many of the properties of piezoceramics change significantly as the material is heated. For
example, the capacitance of piezoceramics rises to a maximum at the Curie temperature,
and it can have values which are 50% or higher at its highest working temperature
compared to room temperature. [10]
2.5 Pyroelectric effect
Pyroelectric effect is a property of several piezoceramics. The pyroelectric effect is very
closely related to the piezoelectric effect. Pyroelectricity (from the Greek pyr, fire, and
electricity) is the ability of certain materials to generate a temporary voltage when they are
heated or cooled. But when the temperature stabilizes the pyroelectric voltage gradually
disappears. All pyroelectric materials are piezoelectric, but not all piezoelectric are
pyroelectric.

19
The change in temperature modifies the crystal structure in such a way that the central
negative ion is forced out of its centre position. This is causing a change in the polarization
in the same way as when a piezoceramic is exposed to vibration. But in this case the centre
negative ion self oscillation increases due to the heat, resulting in a voltage over the
crystal. It should be clearly understood that the pyroelectric voltage is not a function of
temperature, but only a function of change in temperature. The pyroelectric effect consists
of two parts, the primary pyroelectric effect and the secondary pyroelectric effect.
The primary effect is the total change in net polarization due to the stress in the ceramic.
This is mathematically described as:
=
The secondary effect is described as the piezoelectric contribution of an electrical voltage
due to thermal expansion in the ceramics, mathematically described as follows:
=
The total mathematical description of the pyroelectric effect is therefore described as:
= = +
Where,
P=Pyroelectrical effect (µAs/ (K · m²))
D =Electric displacement, charge per unit area (Coloumb/m2)
Ps=Polarization
T=Stress (N/m2)
E=Electric field (Volt/m)
=Electrical permittivity
The unit for the pyroelectric effect is usually given as electrical charge / Kelvin area
(µAs/ (K · m²)). [12]

20
2.6 Knock measurement and sensor failure detection
The knock control application prevents the engine from knocking by controlling the
ignition timing (on SG engines) and main fuel injection demand (on SG and DF engines).
If cylinder pressure balancing is not available, Knock control application also balances the
engine load by controlling main fuel injection between the cylinders when the engine load
is high. During normal conditions the air/fuel mixture in the combustion chamber ignites
and burns in a controlled manner.
However, during special unwanted conditions, the air/fuel mixture can ignite in an
uncontrolled manner creating pressure and temperature peaks in the cylinder which often
can be heard as a knocking sound. Knocking can be very damaging for the engine. The
engine components cannot withstand severe knocking for any longer periods of time and
knocking should hence, when appearing, immediately be neutralized. Figure 13 on the
following page describes what knocking looks like. [13]
2.6.1 Knock measurement
Knocking can be measured with two separate sensors, piezo sensors and cylinder pressure
sensors. Measurements from these sensors are taken during a specific crank angle window.
Once the window has passed, the measurements are analyzed by a DSP (digital signal
processor) and the calculated values are provided to the Knock control application. This
means that a new knocking value from the piezo sensor and another from the cylinder
pressure sensor is available once per engine cycle (720 degrees) for each cylinder. [13]

21
Figure 14 shows example measurement windows of knock from the piezo sensor and
knock from the cylinder pressure sensor for a two-cylinder engine. In this example, a total
of four knock values are received during one full engine cycle:
1. Knocking value from the piezo sensor of cylinder A1
2. Knocking value from the cylinder pressure sensor of cylinder A1
3. Knocking value from the piezo sensor of cylinder A2
4. Knocking value from the cylinder pressure sensor of cylinder A2
Figure 13 – Knocking [13]

22
Figure 14 –Measurement windows [13]
The knock control function prevents the engine from knocking by controlling the ignition
timing (on SG engines) and main fuel injection demand (on SG and DF engines). The
control of the ignition and fuel demand is done in a cylinder wise manner. The knock
control function can also, if necessary, automatically initiate a gas trip, load reduction or
shutdown of the engine.
2.6.2 Sensor failure detection
The cylinder pressure and piezo sensors are connected to the DSP on the CCM. A DSP
calculates separate piezo and cylinder pressure knock values from the raw signals and
sends them as knock sample messages to the Knock control application. Each sample holds
the latest raw knock value and the sensor failure status. The piezo sensor signal is used
only for knock detection but the bell shaped cylinder pressure signal is also used for
detecting other pressure related values (e.g. cylinder peak pressure). The piezo knock
sensor is stated faulty, when a sample sent by the CCM module has the sensor failure
status active. [13]
23
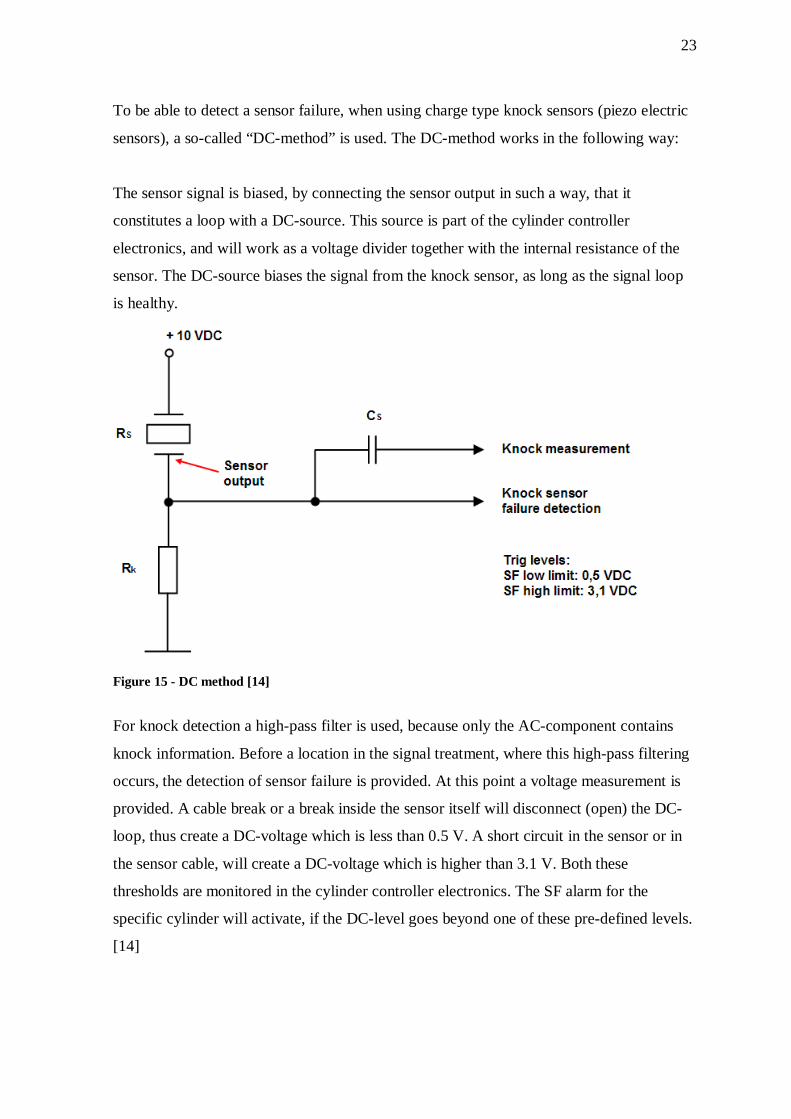
To be able to detect a sensor failure, when using charge type knock sensors (piezo electric
sensors), a so-called “DC-method” is used. The DC-method works in the following way:
The sensor signal is biased, by connecting the sensor output in such a way, that it
constitutes a loop with a DC-source. This source is part of the cylinder controller
electronics, and will work as a voltage divider together with the internal resistance of the
sensor. The DC-source biases the signal from the knock sensor, as long as the signal loop
is healthy.
Figure 15 - DC method [14]
For knock detection a high-pass filter is used, because only the AC-component contains
knock information. Before a location in the signal treatment, where this high-pass filtering
occurs, the detection of sensor failure is provided. At this point a voltage measurement is
provided. A cable break or a break inside the sensor itself will disconnect (open) the DC-
loop, thus create a DC-voltage which is less than 0.5 V. A short circuit in the sensor or in
the sensor cable, will create a DC-voltage which is higher than 3.1 V. Both these
thresholds are monitored in the cylinder controller electronics. The SF alarm for the
specific cylinder will activate, if the DC-level goes beyond one of these pre-defined levels.
[14]
24
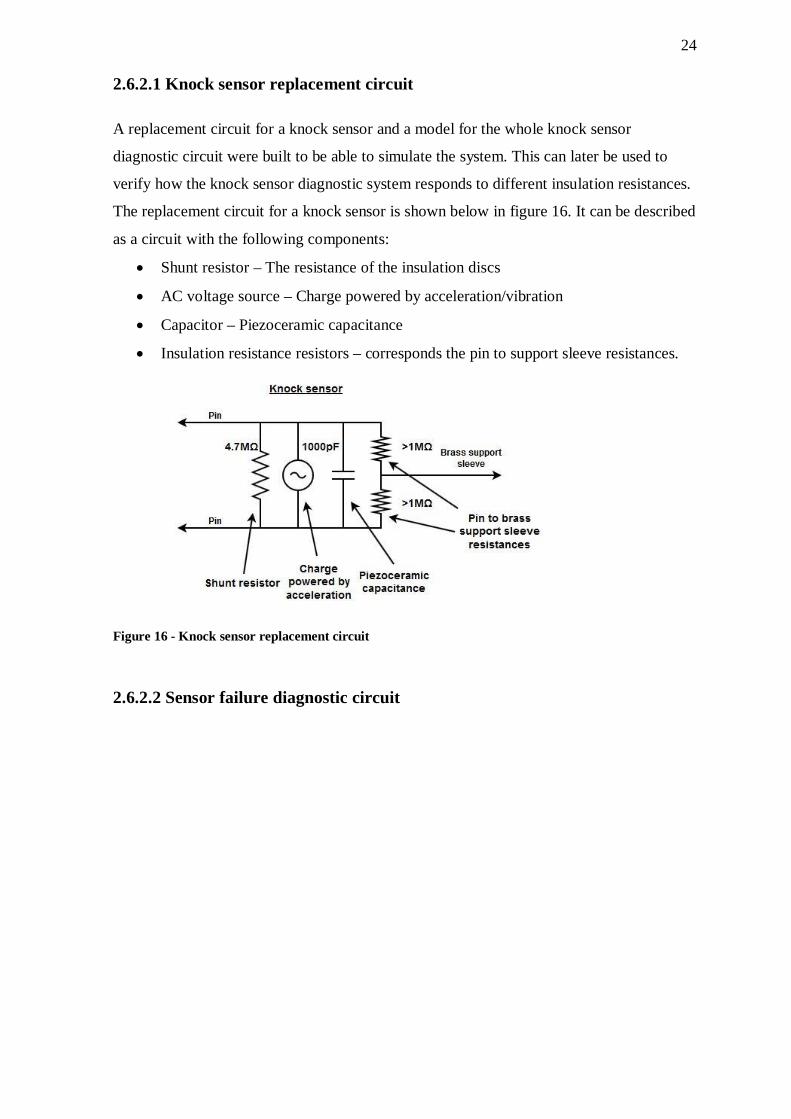
2.6.2.1 Knock sensor replacement circuit
A replacement circuit for a knock sensor and a model for the whole knock sensor
diagnostic circuit were built to be able to simulate the system. This can later be used to
verify how the knock sensor diagnostic system responds to different insulation resistances.
The replacement circuit for a knock sensor is shown below in figure 16. It can be described
as a circuit with the following components:
Shunt resistor – The resistance of the insulation discs
AC voltage source – Charge powered by acceleration/vibration
Capacitor – Piezoceramic capacitance
Insulation resistance resistors – corresponds the pin to support sleeve resistances.
Figure 16 - Knock sensor replacement circuit
2.6.2.2 Sensor failure diagnostic circuit

25
2.7 Root Cause Analysis theory
“A Root Cause is the cause where a solution is implemented to solve the problem” [Mark
Wildi, Root Cause analysis course. 24.11.2014]. Root Cause analysis (RCA) is a method
of problem solving that tries to identify the root causes of faults or problems. A Root
Cause is a cause that once removed from the problem fault sequence, prevents the final
undesirable event from recurring. A condition is a factor that affects an action's outcome.
Removing a condition can benefit an outcome, but it does not necessarily prevent its
recurrence. [15]
2.7.1 Realitycharting process
Realitycharting is the name of the Root Cause analysis method which is used in this thesis.
This method is most easily understood by looking at an example of a simple problem.
Let’s say that a fire has started on a chair in your apartment, and now you want to use the
realitycharting method to find out the Root Cause (why the fire started). A candle was
placed on the chair when the fire started.
This is the realitycharting process:
1. Define the problem
Write down the following
What – The primary effect
When
Where
Significance- Why you want to prevent it
So, for the fire on the chair it could look like this:
Figure 17 - Problem definition

26
2. Create a Realitychart
For each effect ask “why”?
Look for causes in Actions and Conditions
Connect causes with “Caused by”
Support causes with evidence or use a “?”
End with stop or “?”
When going from right to left in the chart you go in the direction of time, i.e. first the
candle tipped on the chair which introduced heat to the chair and finally the fire started.
The direction from left to right, when looking at the chart, is called direction of causation.
This means that the fire was caused by the introduced heat which in its turn was caused by
the fact that the candle tipped on the chair.
Figure 18 - Realitychart
27
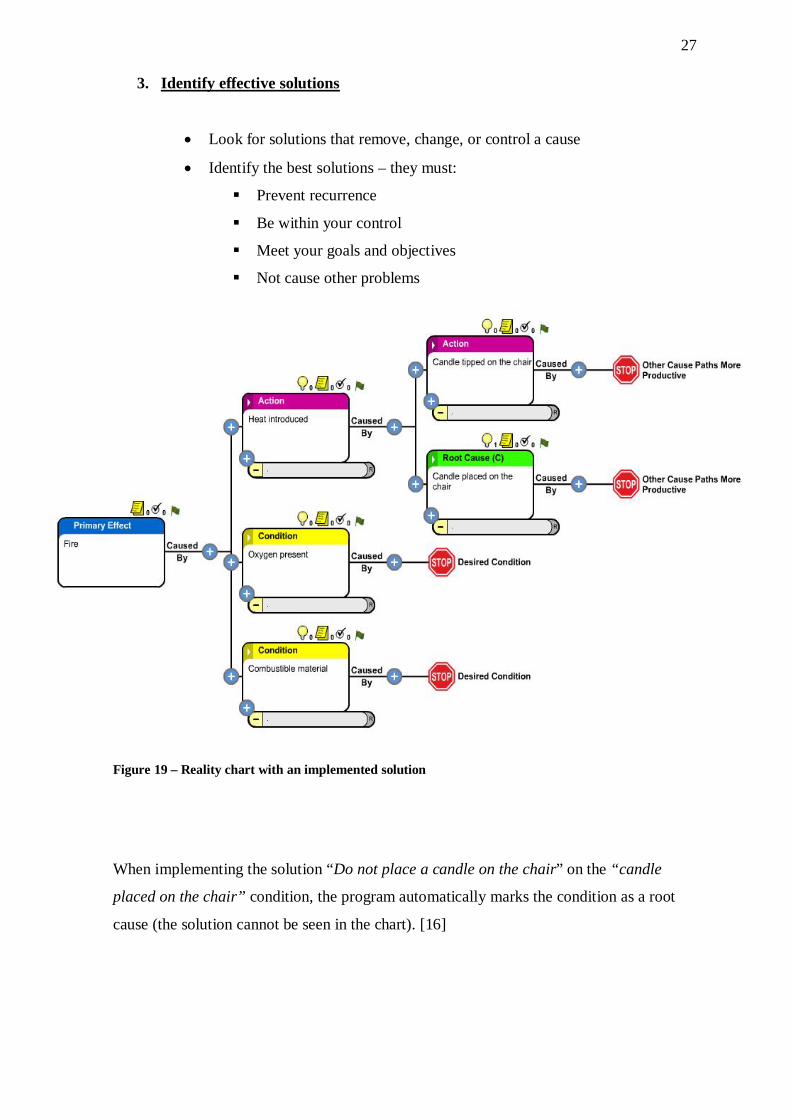
3. Identify effective solutions
Look for solutions that remove, change, or control a cause
Identify the best solutions – they must:
Prevent recurrence
Be within your control
Meet your goals and objectives
Not cause other problems
Figure 19 – Reality chart with an implemented solution
When implementing the solution “Do not place a candle on the chair” on the “candle
placed on the chair” condition, the program automatically marks the condition as a root
cause (the solution cannot be seen in the chart). [16]
28
3 Tests
In this chapter all performed tests have been documented. Both KS1 and KS4 sensors have
been tested in a, for the purpose, specially built test cabinet. The tests have been performed
with both heat and vibration as affecting variables. A sensor named the “good” sensor is an
old working sensor, which is used as reference in several tests.
3.1 General information
The investigations of the knock sensors were, for a long time in the beginning of the tests,
focused on the pyro-electric effect, but this is not the phenomenon that causes the
fluctuations of the diagnostic values.
The insulation resistance measurements on knock-sensors, which are documented in a
forthcoming chapter, have shown that the main reason for the changing diagnostic values
is poor insulation resistances. When the sensors warm up (80-100 °C) the insulation
resistance drops remarkably, which in its turn causes the knock sensor diagnostic values to
drop/rise depending on the engine block potential. The poor insulation resistance is in its
turn caused by moisture in the sensor moulding material.
Samples of a new model of the Bosch knock sensor, the KS4 model, were ordered and to
be tested and compared with the KS1 model. If the KS4 sensor is suitable for the knock
system and shows better results than the KS1 sensor, changing to the KS4 sensor as
standard on gas engines will be the optimal solution.
3.2 The initial problem
The initial problem concerning knock sensor diagnostic value fluctuations occurred at
vessels with 50DF engines equipped with WECS 8000 and KSFD card. When replacing
old KS1 sensors with new KS1 sensors on engines, the diagnostic values drop/rise causing
sensor failure alarm.
29
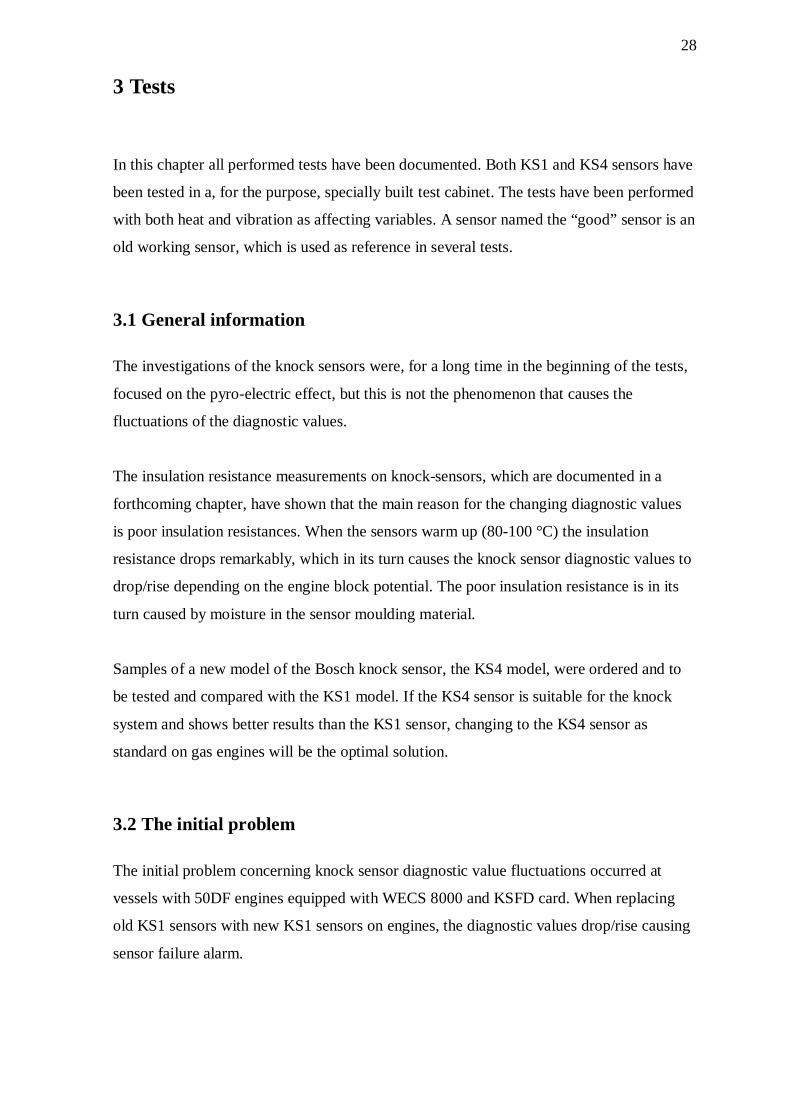
At a customer ship the sensor change from old KS1 sensors to new ones resulted in a
majority of the diagnostic values dropping below the knock sensor failure low limit.
Originally the knock sensor failure limits are set at 500 mV and 3100 mV. Figure 21 shows
the knock values on an engine after all knock sensors had been replaced with new KS1
sensors. As seen in figure 21, 11 out of 12 sensors are below the low limit (500 mV) after
changing to new KS1 sensors.
3.3 Heat cabinet
Before the testing could start a heat/vibration test bench had to be built. The test bench was
made from three basic parts, a vibration bench, an electric cabinet and a hotplate. The
cabinet was mounted on top of the vibration bench with four threaded rods. The hot plate
was mounted inside the cabinet next to a fan which circulates the air in the cabinet. A
thermostat regulates the temperature in the cabinet.
0
100
200
300
400
500
600
700
800
900
200 202 204 206 208 210Diagnostic voltage
(mV) Time (s)
Diagnostic values after replacing old knock sensors
Knock sensor diag. cyl A1
Knock sensor diag. cyl A2
Knock sensor diag. cyl A3
Knock sensor diag. cyl A4
Knock sensor diag. cyl A5
Knock sensor diag. cyl A6
Knock sensor diag. cyl B1
Knock sensor diag. cyl B2
Knock sensor diag. cyl B3
Knock sensor diag. cyl B4
Knock sensor diag. cyl B5
Knock sensor diag. cyl B6
Figure 20-Diagnostic values at a customer ship after changing to new KS1 sensors

30
Figure 23 shows what the complete heat/vibration bench looks like. Figure 22 shows three
knock sensors mounted on the vibration bench. The temperature sensor in the middle
measures knock sensor temperature. A temperature sensor beside the vibration head
measures the air temperature inside the cabinet. A regular frequency generator was used to
generate the desired frequencies for the vibration exciter.
3.4 KS1 heat test with WECS 8000
15 knock sensors were received from a customer ship. The sensors were said to be defect
and will now be tested by heating them up to 120 degrees Celsius and at the same time
logging the output with Wecsplorer. The ”good” sensor is also tested and plotted in the
same graph as the other sensors. The sensors are tested three at a time in a WECS 8000 test
rig.
3.4.1 Test results
During the test procedure all sensors were heated up to 120 °C in the heat/vibration cabinet
until the diagnostic signal stops rising. The results have been summarized in Figure 25.
The graph shows all sensors that have been tested and also the “Good” sensor is included.
Figure 22 - Heat cabinet Figure 21- Knock sensors mounted in the heat /vibration cabinet

31
Figure 25 - KS1 heat test
As can be seen in figure 25 all KS1 sensors are exceeding the knock sensor failure limit
with over 1000 mV at 125 ºC, while the ”Good” sensor maximum diagnostic voltage
output is 2700 mV. It can also be noted that all sensors from the ship have the same
characteristics, which means that the high diagnostic voltage output can be a result from
the manufacturing of the sensors.
3.5 KS1 drying test
When this test was planned the intentions were to investigate if it was poor aged piezo
material in the sensors that could be the reason for the rising diagnostic voltage. When the
insulation resistance tests in chapter 3.6 were performed it was clear that this was not the
case.
The ”aging” process is a part in the manufacturing of the piezo knock sensors when the
piezo-discs for a period are exposed to high temperature in order to make the sensors
507090110130150170190210230250270290310330350370390410430450470490510
0
500
1000
1500
2000
2500
3000
3500
4000
4500
5000
0 500 1000 1500 2000 2500 3000 3500
Temperature (ºC)
Diagnosticvoltage
(mV)
Time (s)
KS1 heat test Sensor 3
Sensor 5
Sensor 8
Sensor 9
Sensor 16
Sensor 19
Sensor 21
Sensor26
Sensor 36
Sensor 38
Sensor 39
Sensor 40
Sensor 43
Sensor 46
Knock sensor failure high limit

32
stable. The aging process at Bosch´s factory is performed by heating up the piezoelements
to 240 ºC for 5 hours in an oven.
When trying to heat up a complete knock sensor to 240 ºC it was noticed that the molding
material on the sensor becomes too soft and the sensor begins to lose its shape. Therefore
the temperature was decreased to 210 ºC when aging them. Sensors no 3, 5 and 8 were
heated up to 210 ºC for 6 hours to see if the pyro-electric voltage is remarkably affected by
the aging process. After the heating the aged sensors were tested again in the oven at 120
ºC and the outputs from the sensors were logged with wecsplorer.
The diagnostic output characteristics of the sensors before aging and after aging are both
compared in figure 26.
Figure 26 - Diagnostic voltage comparison
As can be seen in the diagram the diagnostic voltage has decreased remarkably after aging
the sensors. The highest diagnostic voltage observed after drying at the same temperature
(120 ºC) is 1100 mV, about 3000 mV lower than before the drying procedure.
040801201602002402803203604004404805205606006406807207608008408809209601000
0
500
1000
1500
2000
2500
3000
3500
4000
4500
0 500 1000 1500 2000 2500 3000 3500 4000 TemperatureºC
Diagnosticvoltage
(mV)Time (s)
Diagnostic voltage before & after drying
Sensor 3
Sensor 5
Sensor 8
Sensor 3 after agingSensor 5 after agingSensor 8 after agingTemperature

33
3.5.1 Different drying times
As the sensors could not stand heat up to 240 ºC a new test was performed but now at a
temperature of 150 ºC. The tested sensors are number 9, 16 and 19. The drying times will
be 2.5 h for sensor no 9, 5 h for sensor no 16 and 7.5 h for sensor no 19.
The results are compared in figure 27.
Figure 27 - Diagnostic voltage comparison
As can be seen in the diagram the diagnostic voltage decreases remarkably when extending
the aging time. After 2,5 hours the diagnostic voltage has dropped with about 500 mV,
after 5 hours it has decreased to half of its original value and after 7,5 hours it has
decreased with about 2900 mV.
It can also be noticed that the diagnostic voltage rises more slowly for the aged sensors
than for the unaged sensors when exposing them to a high temperature.
040801201602002402803203604004404805205606006406807207608008408809209601000
0200400600800
1000120014001600180020002200240026002800300032003400360038004000420044004600
0 500 1000 1500 2000 2500 3000 3500 4000 TemperatureºC
Diagnostic lvoltage
(mV) Time (s)
Diagnostic voltage before & after drying (150ºC for 2,5, 5 & 7,5 h)
Sensor 9
Sensor 16
Sensor19
Sensor 9 after 2.5h aging
Sensor 16 after 5 aging
Sensor 19 after 7.5 h agingTemperature original sensors
Sensor 9 dried 2,5 hours
Sensor 16 dried 5 hours
Sensor 19 dried 7,5 hours

34
3.5.2 Drying time
Figure 28 shows how the drying time affects the diagnostic voltage at a temperature of 150
ºC. This diagram is based on the results from the test when sensors 9, 16 and 19 were
dried.
Figure 28 - Drying time for KS1 sensors
0
500
1000
1500
2000
2500
3000
3500
4000
4500
0 1 2 3 4 5 6 7 8Diagnostic voltage (mV)
Drying time (h)
Drying time @150ºC
Diagnostic voltage
35
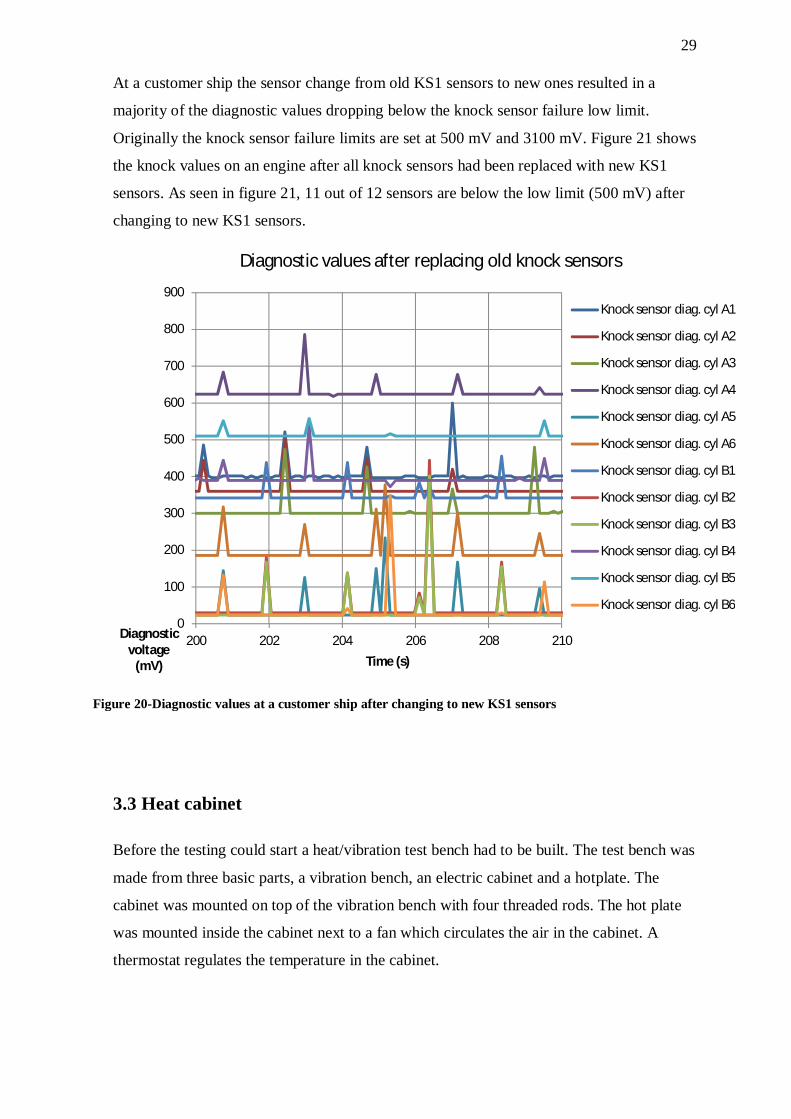
3.5.3 Temperature test 2 weeks after drying
Sensors 3, 5, 8 and 9, 16, 19 were tested again in the same way as they were tested two
weeks after they had been dried.
Sensor 9, 16 ,19
Figure 29 - Diagnostic voltage comparison
As can be seen sensor 9 has not changed remarkably but sensor 16 has got a higher
diagnostic output. Sensor 19 has worsened most, approximately twice as much as sensor
16. It can be seen from these results that the sensors are, after drying, creeping back to a
larger diagnostic voltage output. If the sensors have been dried for a longer time, they
return faster to a larger diagnostic output than the sensors that have not been dried for an
equally long time.
040801201602002402803203604004404805205606006406807207608008408809209601000
0200400600800
1000120014001600180020002200240026002800300032003400360038004000
0 1000 2000 3000 4000Temperature
ºCDiagnosticl
voltage(mV) Time (s)
Diagnostic voltage directly after aging and 2 weeks later
Sensor 9 one day after dryingSensor 16 one day after dryingSensor19 one day after dryingSensor 9 two weeks after dryingSensor 16 two weeks after dryingSensor 19 two weeks after dryingTest temperature
All sensors aged @ 150ºC

36
Sensors 3,5,8
Figure 30 - Diagnostic voltage comparison
After two weeks the diagnostic voltage for sensors 3, 5 and 8 has risen remarkably. All
these sensors were aged at the same temperature (210 ºC), and for an equally long period
(6h). Note that the testing temperature went approximately 10 ºC higher in the newer test
and may have caused a bit too high results compared to the previous test, but still it can be
stated that the diagnostic voltage output increases by time after drying, when sensors are
stored at room temperature.
040801201602002402803203604004404805205606006406807207608008408809209601000
0
200
400
600
800
1000
1200
1400
1600
1800
2000
2200
2400
2600
0 500 1000 1500 2000 2500 3000 3500 TemperatureºC
Diagnosticvoltage
(mV)Time (s)
Diagnostic voltage directly after drying and 2 weeks later
Sensor 3 one day after drying
Sensor 5 one day after drying
Sensor8 one day after drying
Sensor 3 two weeks after drying
Sensor 5 two weeks after drying
Sensor 8 two weeks after drying
All sensors aged @ 210 ºC
37
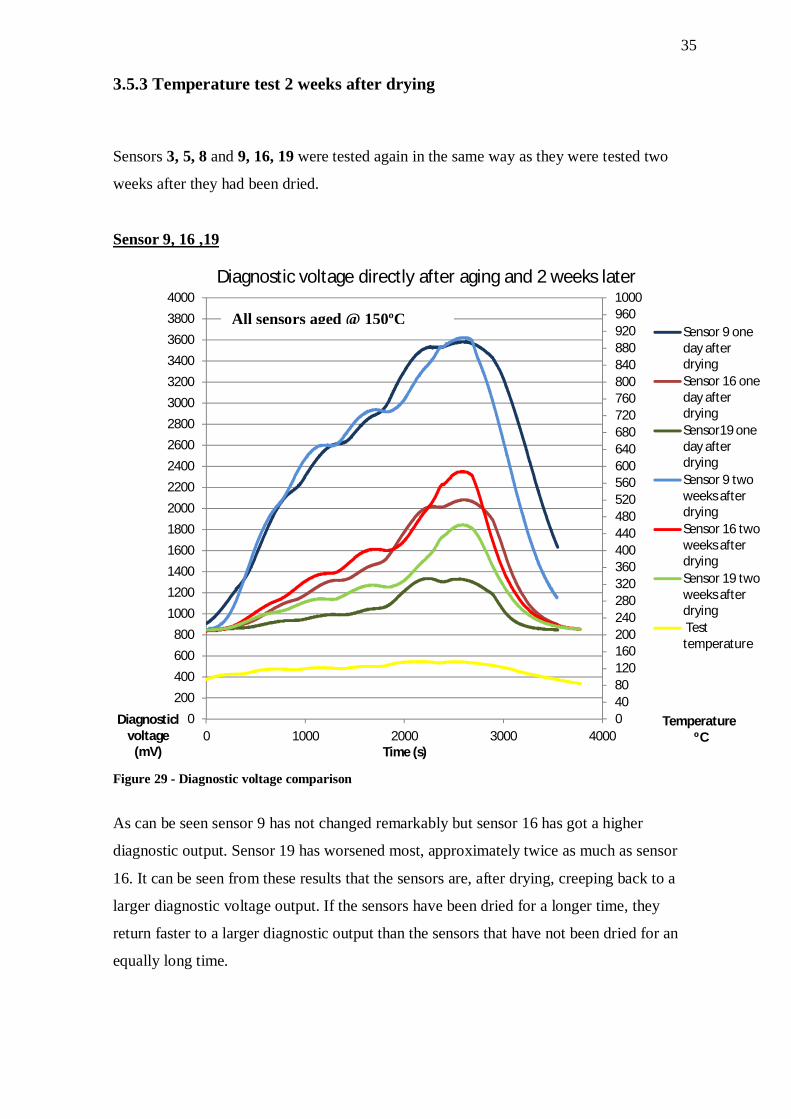
3.5.4 Mounting torque test
In this test sensors no 21, 26 and 36 were tested with different mounting torques to see if it
affects the diagnostic voltage output from the sensor. The sensors were mounted on
different iron plates to avoid appearance of interference between them. On an engine the
mounting torque is 20 Nm for the knock sensors. The different torques that will be tested
are therefore 20, 35 and 50 Nm. The test was performed in the same way as previous tests,
i.e. by heating up the sensors to 120 ºC and at the same time logging the results with
Wecsplorer.
Figure 31 - Mounting torque test
As can be seen in this graph the mounting torque does not affect the diagnostic voltage at
all. The same voltage levels are reached independently of the mounting torque.
040801201602002402803203604004404805205606006406807207608008408809209601000
0200400600800
1000120014001600180020002200240026002800300032003400360038004000420044004600
0 500 1000 1500 2000 2500 3000 3500 4000 TemperatureºC
Diagnosticlvoltage
(mV)Time (s)
Mounting torque effect on Diagnostic voltage
Sensor 21 (20Nm)Sensor 26 (35Nm)Sensor 36 (50Nm)Temperature

38
3.5.5 Pyro-electric effect proof
The pyro-electrical effect, which was the main suspect for this problem for a long time is
confirmed not to be affecting the diagnostic system remarkably. Pyro-electrical voltage can
only be produced by a piezoceramic when the material is heated up or cooled down. At a
stable temperature there is no pyro-electrical voltage produced by the sensors.
The knock sensors produce a maximum pyro-electrical voltage of about 50-70 mV.
Figure 32 shows a voltage output from a KS1 sensor when it is first cooled down to
approximately -15 °C and then heated up to +60 °C.
Figure 32 - Pyroelectric voltage generated by temperature changes
If this test was performed with inverse polarity, the pyro-electrical voltage output would
also be inversed compared to this result. Further cooling or heating would not result in a
higher pyro-electrical voltage. Due to the fact that the pyro-electrical voltage levels are this
low the effects on the diagnostic system will be insignificant.
-0,06
-0,04
-0,02
0
0,02
0,04
0,06
00:00:00 00:00:17 00:00:35 00:00:52 00:01:09 00:01:26 00:01:44 00:02:01 00:02:18
KS1-Pyroelectrical voltage
Pyroelectrical voltage
Knock sensor heated
Knock sensor cooled
Voltage
(V)
Time
39
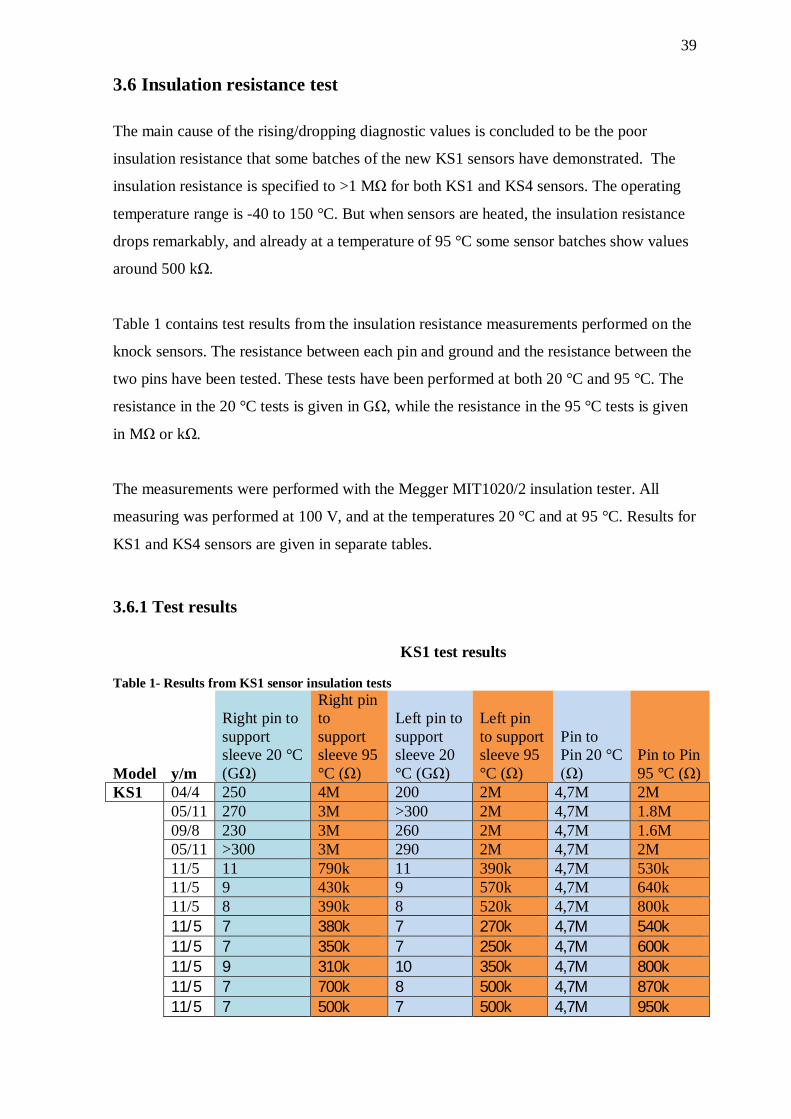
3.6 Insulation resistance test
The main cause of the rising/dropping diagnostic values is concluded to be the poor
insulation resistance that some batches of the new KS1 sensors have demonstrated. The
insulation resistance is specified to >1 M for both KS1 and KS4 sensors. The operating
temperature range is -40 to 150 °C. But when sensors are heated, the insulation resistance
drops remarkably, and already at a temperature of 95 °C some sensor batches show values
around 500 k .
Table 1 contains test results from the insulation resistance measurements performed on the
knock sensors. The resistance between each pin and ground and the resistance between the
two pins have been tested. These tests have been performed at both 20 °C and 95 °C. The
resistance in the 20 °C tests is given in G , while the resistance in the 95 °C tests is given
in M or k .
The measurements were performed with the Megger MIT1020/2 insulation tester. All
measuring was performed at 100 V, and at the temperatures 20 °C and at 95 °C. Results for
KS1 and KS4 sensors are given in separate tables.
3.6.1 Test results
KS1 test results
Table 1- Results from KS1 sensor insulation tests
Model y/m
Right pin to support sleeve 20 °C (G )
Right pin to support sleeve 95 °C ( )
Left pin to support sleeve 20 °C (G )
Left pin to support sleeve 95 °C ( )
Pin to Pin 20 °C
) Pin to Pin 95 °C ( )
KS1 04/4 250 4M 200 2M 4,7M 2M 05/11 270 3M >300 2M 4,7M 1.8M 09/8 230 3M 260 2M 4,7M 1.6M 05/11 >300 3M 290 2M 4,7M 2M 11/5 11 790k 11 390k 4,7M 530k 11/5 9 430k 9 570k 4,7M 640k 11/5 8 390k 8 520k 4,7M 800k 11/5 7 380k 7 270k 4,7M 540k 11/5 7 350k 7 250k 4,7M 600k 11/5 9 310k 10 350k 4,7M 800k 11/5 7 700k 8 500k 4,7M 870k 11/5 7 500k 7 500k 4,7M 950k

40
As can be seen when comparing the KS1 sensors, the insulation resistance for the 11/5
dated sensors is much lower than for the other KS1 batches.
KS4 test results Table 2 - Results from KS4 sensor insulation tests
Model y/m/d
Right pin to support sleeve 20 °C (G )
Right pin to support sleeve 95 °C ( )
Left pin to support sleeve 20 °C (G )
Left pin to support sleeve 95 °C ( )
Pin to Pin 20 °C ( )
Pin to Pin 95 °C ( )
KS4 14-10-02 >300 6M >300 2M 4,7M 3.5M 14-06-30 290 3.5M >300 4M 4,7M 3M 14-10-02 >300 8M >300 4M 4,7M 4M 14-10-02 >300 8M >300 5M 4,7M 4M 14-10-02 >300 8M >300 7M 4,7M 4M 14-10-02 >300 8M >300 6M 4,7M 4M
14-10-02 >300 4M >300 3M 4,7M 2M 14-10-02 >300 4M >300 3M 4,7M 2M 14-10-02 >300 4M >300 3M 4,7M 2M 14-06-30 >300 1.8M >300 1.4M 4,7M 1M 14-06-30 >300 1.5M >300 1.6M 4,7M 900k 14-06-30 >300 1.6M >300 1.7M 4,7M 1M
When comparing the KS4 sensors we can see that the 14-10-02 dated batch is better than
any of the KS1 sensor batches, but the insulation resistance for the 14-06-30 batch is
sometimes lower than for some of the KS1 batches.
The sensors with the lowest insulation resistance show a resistance (pin to support sleeve)
KS4 with new molding material test results Table 3 - Results from KS4 sensor with new molding material insulation tests
Model y/m/d
Right pin to support sleeve 20 °C (G )
Right pin to support sleeve 95 °C ( )
Left pin to support sleeve 20 °C (G )
Left pin to support sleeve 95 °C ( )
Pin to Pin 20 °C ( )
Pin to Pin 95 °C ( )
KS4 15-01-28 >300 76M >300 83M 4,7M 4,7M 15-01-26 >300 77M >300 83M 4,7M 4,7M 15-01-26 >300 88M >300 90M 4,7M 4,6M 15-01-26 >300 90M >300 104M 4,7M 4,6M 15-01-26 >300 130M >300 135M 4,7M 4,7M

41
of >70 M at 95 °C. This is remarkably higher compared to previous tests with sensors
with the old molding material. It can also be noted that pin to pin resistance does not
change from the specified 4.7 M . Using this sensor model would therefore be a good
solution for the problem seen from the sensor failure detection aspect.
Figure 33 shows a KS1 and a KS4 sensor that have been trended in parallel when the
temperature was increased from 20 °C to 95 °C. The test time is 25 minutes (1500
seconds). The KS1 sensor is from batch 11/5 and the KS4 from batch 14-10-02. The
resistance is measured from the right pin to the Brass support sleeve. Note that the
resistance is in a logarithmic scale in the diagram. After the previous test was done we
received a KS4 model with the new kind of molding material which was tested in the same
way.
Figure 33 - Insulation resistance depending on temperature (sensors with old molding material)
Note that the lowest measured resistance for the KS1 model in Figure 33 is 516 k and the
lowest value for the KS4 is 5 M . It can be seen from the tests that all KS1 sensors from
batch 11/5 do not fulfil the specifications for 1 M insulation resistance. Already at
around a temperature of 90 °C the insulation resistance drops below 1 M .
Note that the KS4 sensors with the new molding material are not included in this test.
0
23,75
47,5
71,25
95
118,75
0,1
1
10
100
1000
10000
0 200 400 600 800 1000 1200 1400Temperature (°C)Resistance (M )
Time (s)
KS4
KS1
Temperature
KS1 and KS4 insulation resistance test

42
3.7 Knock diagnostic system simulation
To be able to verify the behaviour due to changing insulation resistances a model of the
knock sensor diagnostic system was created. The circuit was created and simulated with
LTspice 5.
3.7.1 Knock sensor replacement circuit
The replacement circuit (Figure 24) for the knock sensor was inserted in the simulation
with specified component values to get as realistic simulation results as possible.
Figure 23 - Knock sensor replacement circuit
3.7.2 Simulation results
The same diagnostic voltage levels as in chapter 3.4 KS1 heat test with WECS 8000 are
now also reached when simulating the diagnostic output voltage with LTspice.
Figure 25 shows a simulation of a cold sensor with good insulation resistance.

43
Figure 24 - Diagnostic voltage when a “good” sensor is simulated
It is now verified that the output is the same as in real tests with wecsplorer. The results
can be compared to the heat tests in chapter 3.4 KS1 heat test with WECS 8000 and chapter
3.5 KS1 drying test earlier in this document.
Values from chapter 3.6 insulation resistance tests are used in the next simulation. The
results can be seen in figure 27. The values are from an 11/5 dated KS1 sensor, when the
sensor was heated to 95 °C.
Figure 25 - Knock sensor replacement circuit in simulation model
With a shunt resistor at 600 k and a pin to support sleeve resistance at 350 k and 250
, figure 27 shows that the voltage output is the same as the real values from chapter 3.4
KS1 heat test with WECS 8000 .

44
Figure 26 - Diagnostic voltage when a "bad" sensor is simulated
Based on these results the simulation model can be concluded to correspond well with the
real characteristics of the knock sensor diagnostic system. This simulation can therefore be
used in the future to find out the diagnostic voltage output from a sensor, if insulating
resistances for the sensor are available.
3.8 Engine block potential influence
As mentioned earlier the bad insulation resistance of heated knock sensors is causing rising
diagnostic values in the knock sensor diagnostic system. This is leading to that the possible
difference in the engine block potential compared to the minus potential of the power
supply, is causing current leaking in to the sensors increasing or decreasing the diagnostic
value.
The dropping diagnostic values at the customer ship are caused because the engine block
potential is more negative than minus the on power supply. When the sensors are warming
up and the insulation resistance decreases, the negative voltage is causing a current to start
leaking through the poor insulation resistance, beginning to interfere with the knock sensor
diagnostic system.
Figure 27- Knock sensor schematic

45
This has been confirmed by building a model of the whole diagnostic system in LTspice,
where it is possible to achieve the same voltage levels when using this knock sensor model
and the earlier measured insulation resistances.
It is confirmed by Bosch that the molding material on the knock sensors gets a lower
resistance when heated. The degree of humidity in the molding material affects how low
the resistance will go. A heat stabilizer based on metal salts is used in the molding
material. Humidity dissolves these metal salts and the resulting solution with ions
additionally decreases the insulation resistance.
In figure 29 there are three examples of how different engine potentials can affect the
diagnostic system:
1. Brass support sleeve not connected to ground => the measuring voltage 10V DC
is causing a current leakage directly to the other pin via both the internal
resistance of the piezomaterial and via the insulation materials, causing rising
diagnostic levels.
2. Brass support sleeve connected to engine ground, ground and – (minus) on power
supply have the same potential => the diagnostic value doesn t́ rise or drop
remarkably.
3. Brass support sleeve connected to engine ground, ground and – (minus) on power
supply not having the same potential => if for example the brass support sleeve
has got a more negative potential than – (minus) on power supply (in this test -10
V), a current will leak from the brass support sleeve due to the bad insulation
resistance into the heated sensor and cause the measured voltage to drop (Seri
Balqis).

46
Figure 28 - Different types of failure modes on diagnostic voltage
3.9 Engine block potential tests
3.9.1 WECS 8000
3.9.2 UNIC C3
3.9.3 UNIC 2
3.10 Vibration tests
3.10.1 WECS 8000
3.10.2 UNIC C3
3.10.3 UNIC 2
0
200
400
600
800
1000
1200
1400
0 500 1000 1500 2000 2500 3000
Time [s]
Different failure modes
Sensor temperature
Air temperature
KS4
Bad KS1
Good KS1
1 2 3

47
4 Root Cause Analysis
A root cause analysis was performed to obtain a holistic view of the problem. The
description of how the Root cause analysis process is done is documented in chapter Root
cause analysis theory.
4.1 Incident report
Knock sensor diagnostic failure system
Report Date: 02-17-2015
Start Date: 08-01-2014
I. Problem Definition
What: Sensor failure alarm, knock sensor /load reduction
When: After changing to new KS-1 sensors
Where: 50DF WECS 8000 Ships
Significance: Sensors need to be replaced
Environment:
II. Report Summary
The root cause analysis resulted in a solved problem. Bosch is committed to making a new
type of knock sensor which meets our requirements. The bad sensors on the affected ships
will be replaced with this new type.
III. Solutions
Causes Solutions Solution Owner Due Date
Molding material
sensitive to moisture
Change to Bosch KS4
sensor model with
new molding material
Dahl Thomas 02-17-2015

48
IV. Team Members
Name Email Member Info
Dahl Thomas
V. Notes
1. Realitychart Status: The Realitychart and Incident Report have been finalized.
2. Rules Check Status: Missing Causes Resolved.
3. Rules Check Status: Conjunctions Resolved.
VI. References
1. Engine block potential influence tests
2. Insulation resistance tests
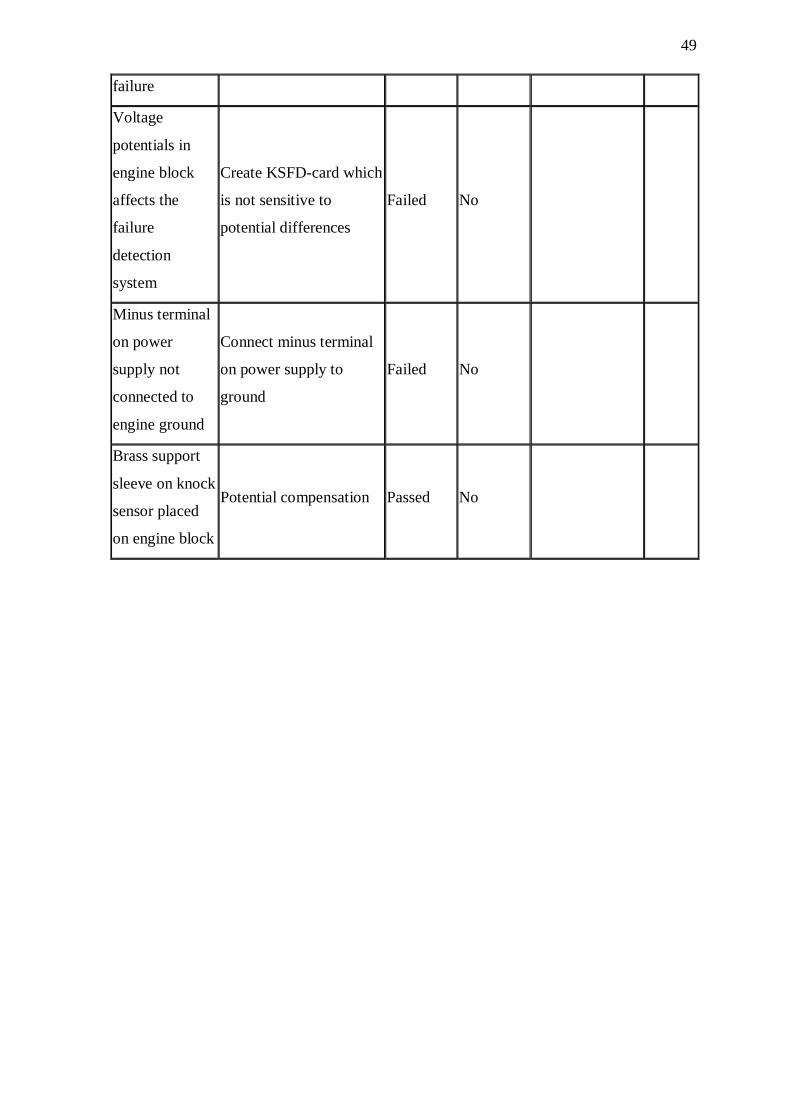
4.2 Reality Charting Possible Solutions Report
In the following table all possible solutions are listed. Only one solution passed the criteria
check in the program. This solution is Change to Bosch KS4 sensor model with new
molding material.
Causes Solutions Criteria
Check Implement Solution Owner
Due
Date
Too low
insulation
resistance in
some sensor
batches
Change to other sensors
instead of Bosch Failed No
Molding
material
sensitive to
moisture
Change to Bosch KS4
sensor model with new
molding material
Passed Yes
Pyroelectric
effect
Change to non
piezoelectric sensors Failed No
KSFD-card Redesign KSFD-card Failed No
49
failure
Voltage
potentials in
engine block
affects the
failure
detection
system
Create KSFD-card which
is not sensitive to
potential differences
Failed No
Minus terminal
on power
supply not
connected to
engine ground
Connect minus terminal
on power supply to
ground
Failed No
Brass support
sleeve on knock
sensor placed
on engine block
Potential compensation Passed No

50
Figure 29 - Realitychart describing the problem
1.1 Realitychart

51
Figure 38 shows the Realitychart for the root cause analysis. The condition Molding
material sensitive to moisture resulted in to become the root cause.
5 Results
The result of this thesis is mainly the knowledge of what is causing the rising/dropping
knock sensor diagnostic voltage, i.e. the knock sensor insulation resistance. As a result of
this knowledge I have had discussions with a knock sensor developer at Bosch, and with
him put together a new knock sensor model that Bosch will start to manufacture.
The main cause of this problem, which also the root cause analysis showed, is the molding
material on the knock sensors. The molding material on the KS1 sensor and the standard
KS4 sensor consists of a metal salt-based heat stabilizer. The ingress of moisture into the
molding material combined with the metal salts cause a significant decrease of the
resistance in the molding material when it is heated up. Drying tests were performed with
results that looked promising at the start, sensors can be dried and the dried sensors do
have a higher insulation resistance. But after storage at room temperature for a few weeks
the sensors will regain their initial insulation resistances.
All tests of the knock sensor diagnostic voltage shows one common factor: the KS1
sensors are very sensitive to temperature and voltage influences. Also in the insulation
resistance tests the KS1 sensors show very bad results, meaning that not a single one of the
KS1 sensors meets the insulation resistance specifications on >1 M at 95 °C. Discussions
have been held with Bosch regarding this issue, but no guarantee that the KS1 sensors will
fulfil the specified values has been given. Uneven quality between sensor batches is also a
problem with this sensor type.
Therefore samples of the newer KS4 knock sensor were ordered. This model proves to
have a better insulation resistance than the KS1 sensor and shows more stable vibration
signals than the KS1 sensors. Why this model exhibits higher insulation resistance than the
KS1 model is unclear, the molding material in the sensors is after all the same. Even if the
tests have shown better insulation resistance on the KS4 sensors we can see that different
batches of this model also differ from each other. This is a bit worrying, the worst KS4
sensors in the WECS 8000 -10 volt tests show diagnostic values very near the sensor
failure low limit (500 mV).
52
An order specification was created for the KS4 sensor to be able to order sensors for field
testing. Sensors have been sent for field testing to a customer ship but no results have been
received within the timetable for this thesis work.
Further discussions were held with Bosch about how to find a solution for the insulation
resistance problem. Bosch then revealed that they had recently developed a new molding
material. Samples of a KS4 knock sensor with this new molding material were ordered of
this model for testing. Testing results show that this model shows a remarkably higher
insulation resistance than sensors with the old molding material.
Unfortunately this sensor model had a steel support sleeve instead of a brass support sleeve
and silver plated contacts instead of gold plated. The steel support sleeve results in a
slightly less sensitive sensor, but this would maybe not be a problem. Experience in the
company concerning silver plated contacts on sensors says on the contrary that silver
plated contacts are not a good solution on an engine. Therefore, further discussions were
held with Bosch, which will result in a future creation of a new knock sensor model which
matches our requirements on a knock sensor. This new knock sensor will be a new version
of the KS4 sensor model and will consist of:
The new molding material
Brass support sleeve
Gold plated contacts
Jetronic connector
Sonox P8 piezo disc.
Further field testing focusing on the frequency response of the KS4 sensor will still be
needed to confirm that the sensors are suitable. If the results of this field test show that this
sensor is suitable, this sensor model will also be used as the standard solution for new
engines in production.
A replacement circuit for a knock sensor and a model for the whole knock sensor failure
diagnostic circuit were built on order to be able to simulate how the system would respond
to different insulation resistances, with no need to test sensors in a rig.
53
6 Discussion
The testing procedures in this thesis have required a lot of time, but without these tests it
would have been quite hard to find the cause of the problem. The fact that Wärtsilä has had
this problem on their gas engines now for over 10 years maybe supports that.
Afterwards the problem may seem simple, when it is solved, but it required a lot of work
by me and my colleagues at Wärtsilä until the problem was finally solved. The pyroelectric
effect was suspected to cause the rising diagnostic voltages for a long time until it was
clear that it is the bad insulation resistance in the molding material that is causing the high
voltage levels.
The problem also required full understanding of the piezoelectric/pyroelectric effect, which
required a lot of studying. But now after I solved this problem I know that I am one of the
persons that know most about knock sensors at Wärtsilä. I also spent a lot of time studying
the knock detection systems for each control system in order to learn how they work.
Before starting with this thesis I also attended a Root Cause Analysis course at Wärtsilä in
Turku in order to get the skills to perform a Root Cause Analysis on this knock sensor
problem. A Root Cause Analysis does not solve the problem just like that, but by doing it I
got an overall view of the problem and all the possible solutions. As a result it is easier to
decide which solution is the best one. A lot of discussions have also been held with a
knock sensor developer at Bosch, to get some help from him and his colleagues.
Further field-testing of the new sensors is needed to confirm that they are suitable for all
gas engines. Defects and weaknesses which have been discovered in the knock-detection
system during my tests and in regular operation of the engines will also be a future
challenge.

54
Bibliography
[1] Overview (Wärtsilä). [Online] http://www.wartsila.com/en/about/company-management/overview [visited 12.12.2014].
[2] Product Review W34SGD. Tech. rep. Wärtsilä Finland. eprint:
DBAD273877 (Wärtsilä IDM).
[3] Engine technology (Wärtsilä). [Online] http://compass.wartsila.com/ Operations/RD_and_design/engine_technology_activities/aut_control/Pages.aspx [visited 12.2.2015].
[4] Holtti, J., 2012. Tuning light knock limits on SG engine. Bachelor’s thesis
in Automation technology. Novia University of Applied Sciences. [5] Engine knocking. [Online] http://en.wikipedia.org/wiki/Engine_knocking
[visited 17.1.2015]. [6] Bosch Knock Sensors Overview, 2013. Tech. rep. Bosch. (Bosch internal
document). [7] Piezoelectricity. [Online] http://en.wikipedia.org/wiki/Piezoelectricity
[visited 15.12.2014]. [8] Applications (Piceramic). [Online] http://piceramic.com/applications.html
[visited 15.12.2014].
[9] Fundamentals (Piceramic). [Online] http://piceramic.com/piezo-technology/fundamentals.html [visited 15.12.2014].
[10] Polarization in Piezoceramic Materials (Piezotechnologies). [Online]
http://www.piezotechnologies.com/ Resources/White-Papers.aspx [visited 15.12.2014].
[11] Webster, J. G., 1999. The measurement, instrumentation, and sensors
handbook. ISBN 978-0-8493-8347-2. [12] Ferroelectric and Piezoelectric materials (Zaahir Salam). [Online]
http://www.slideshare.net/researcher1234 [visited 15.12.2014]. [13] Knock Control v9.0 Application Description. Tech. rep. Wärtsilä Finland.
eprint: DBAB409026 (Wärtsilä IDM).

55
[14] Knock SF DC-method description. Tech. rep. Wärtsilä Finland. eprint: DBAD233313 (Wärtsilä IDM).
[15] Root cause analysis. [Online]
http://en.wikipedia.org/wiki/Root_cause_analysis [visited 17.1.2015].
[16] RealityCharting-The standard for Effective Problem Solving, 2010.
Apollonian Publications. [17] Piezoelectric effect [Online] http://www.intechopen.com/books/advances-
in-modern-woven-fabrics-technology/smart-woven-fabrics-in-renewable-energy-generation [Visited 17.12.2014].