Keynote H818 The Power of (In)formal learning: a learning analytics approach
48
The power of (in)formal learning: a learning analytics approach A special thanks to Avinash Boroowa, Simon Cross, Lee Farrington-Flint, Christothea Herodotou, Lynda Prescott, Kevin Mayles, Tom Olney, Lisette Toetenel, John Woodthorpe and others…A special thanks to Prof Belinda Tynan for her continuous support on analytics at the OU UK @DrBartRienties Reader in Learning Analytics
-
Upload
bart-rienties -
Category
Education
-
view
242 -
download
1
Transcript of Keynote H818 The Power of (In)formal learning: a learning analytics approach

The power of (in)formal learning: a learning analytics approach
A special thanks to Avinash Boroowa, Simon Cross, Lee Farrington-Flint, Christothea Herodotou, Lynda Prescott, Kevin Mayles, Tom Olney, Lisette Toetenel, John Woodthorpe and others…A special thanks to Prof Belinda Tynan for her continuous support on analytics at the OU UK
@DrBartRientiesReader in Learning Analytics

What is learning analytics?
http://bcomposes.wordpress.com/

(Social) Learning Analytics“LA is the measurement, collection, analysis and reporting of data about learners and their contexts, for purposes of understanding and optimising learning and the environments in which it occurs” (LAK 2011)
Social LA “focuses on how learners build knowledge together in their cultural and social settings” (Ferguson & Buckingham Shum, 2012)


What you can expect
1. The power of Learning Design2. How OU UK uses Analytics to make
evidence-based interventions3. Perhaps some laughs


Assimilative Finding and handling information
Communication
Productive Experiential Interactive/
Adaptive
Assessment
Type of activity
Attending to information
Searching for and processing information
Discussing module related content with at least one other person (student or tutor)
Actively constructing an artefact
Applying learning in a real-world setting
Applying learning in a simulated setting
All forms of assessment, whether continuous, end of module, or formative (assessment for learning)
Examples of activity
Read, Watch, Listen, Think about, Access, Observe, Review, Study
List, Analyse, Collate, Plot, Find, Discover, Access, Use, Gather, Order, Classify, Select, Assess, Manipulate
Communicate, Debate, Discuss, Argue, Share, Report, Collaborate, Present, Describe, Question
Create, Build, Make, Design, Construct, Contribute, Complete, Produce, Write, Draw, Refine, Compose, Synthesise, Remix
Practice, Apply, Mimic, Experience, Explore, Investigate, Perform, Engage
Explore, Experiment, Trial, Improve, Model, Simulate
Write, Present, Report, Demonstrate, Critique


Method – data sets• Combination of four different data sets:
• learning design data (189 modules mapped, 276 module implementations included)
• student feedback data (140)• VLE data (141 modules)• Academic Performance (151)
• Data sets merged and cleaned• 111,256 students undertook these modules

Toetenel, L. & Rienties, B. (2016). Analysing 157 Learning Designs using Learning Analytic approaches as a means to evaluate the impact of pedagogical decision-making. British Journal of Educational Technology.
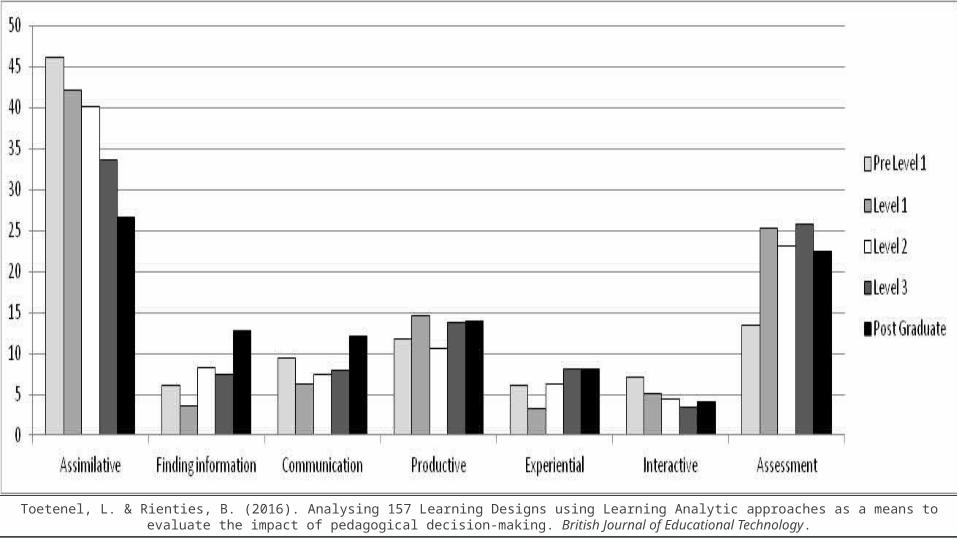
Toetenel, L. & Rienties, B. (2016). Analysing 157 Learning Designs using Learning Analytic approaches as a means to evaluate the impact of pedagogical decision-making. British Journal of Educational Technology.

Constructivist Learning Design
Assessment Learning Design
Productive Learning Design
Socio-construct. Learning Design
VLE Engagement
Student Satisfaction
Student retention
Learning Design151 modules
Week 1 Week 2 Week30+
Rienties, B., Toetenel, L., Bryan, A. (2015). “Scaling up” learning design: impact of learning design activities on LMS behavior and performance. Learning Analytics Knowledge conference.
Disciplines LevelsSize module

Average time spent per week in VLE

Cluster 1 Constructive (n=73)
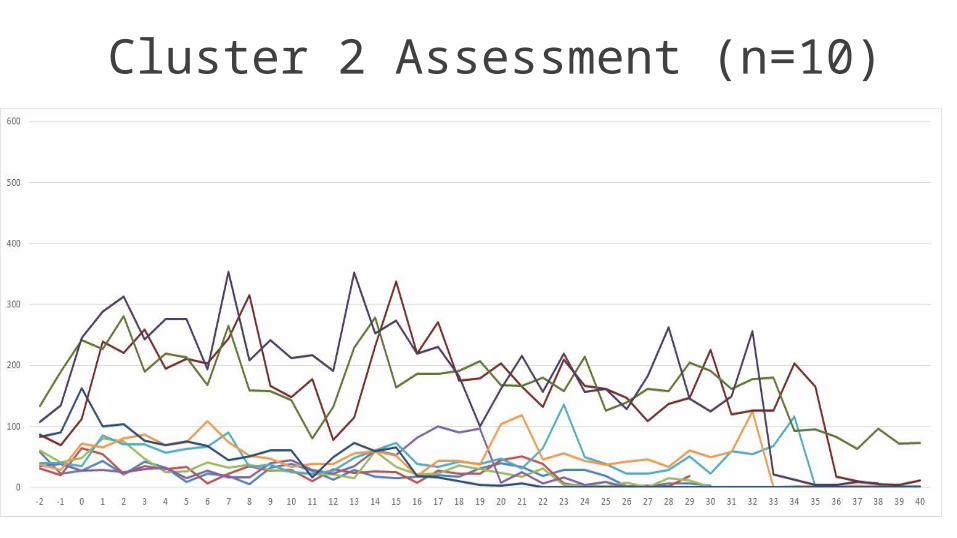
Cluster 2 Assessment (n=10)

Cluster 3 Productive (n=38)

Cluster 4 Social Constructivist (n=20)

Week Assim Find Com. Prod Exp Inter Asses Total
-2 -.03 .02 -.02 -.09 .20* -.03 .01 .35** -1 -.17* .14 .14 -.01 .30** -.02 -.05 .38**
0 -.21* .14 .37** -.07 .13 .08 .02 .48**
1 -.26** .25** .47** -.02 .28** .01 -.1 .48**
2 -.33** .41** .59** -.02 .25** .05 -.13 .42**
3 -.30** .33** .53** -.02 .34** .02 -.15 .51**
4 -.27** .41** .49** -.01 .23** -.02 -.15 .35**
5 -.31** .46** .52** .05 .16 -.05 -.13 .28**
6 -.27** .44** .47** -.04 .18* -.09 -.08 .28**
7 -.30** .41** .49** -.02 .22** -.05 -.08 .33**
8 -.25** .33** .42** -.06 .29** -.02 -.1 .32**
9 -.28** .34** .44** -.01 .32** .01 -.14 .36**
10 -.34** .35** .53** .06 .27** .00 -.13 .35**

Model 1 Model 2 Model 3
Level0 -.279** -.291** -.116
Level1 -.341* -.352* -.067
Level2 .221* .229* .275**
Level3 .128 .130 .139
Year of implementation .048 .049 .090
Faculty 1 -.205* -.211* -.196*
Faculty 2 -.022 -.020 -.228**
Faculty 3 -.206* -.210* -.308**
Faculty other .216 .214 .024
Size of module .210* .209* .242**
Learner satisfaction (SEAM) -.040 .103
Finding information .147
Communication .393**
Productive .135
Experiential .353**
Interactive -.081
Assessment .076
R-sq adj 18% 18% 40%
n = 140, * p < .05, ** p < .01 Table 3 Regression model of LMS engagement predicted by institutional, satisfaction and learning design analytics
• Level of study predict VLE engagement
• Faculties have different VLE engagement
• Learning design (communication & experiential) predict VLE engagement (with 22% unique variance explained)

Model 1 Model 2 Model 3
Level0 .284** .304** .351**
Level1 .259 .243 .265
Level2 -.211 -.197 -.212
Level3 -.035 -.029 -.018 Year of implementation .028 -.071 -.059
Faculty 1 .149 .188 .213*
Faculty 2 -.039 .029 .045
Faculty 3 .090 .188 .236* Faculty other .046 .077 .051
Size of module .016 -.049 -.071 Finding information -.270** -.294**
Communication .005 .050
Productive -.243** -.274** Experiential -.111 -.105
Interactive .173* .221* Assessment -.208* -.221*
LMS engagement .117
R-sq adj 20% 30% 31%
n = 150 (Model 1-2), 140 (Model 3), * p < .05, ** p < .01 Table 4 Regression model of learner satisfaction predicted by institutional and learning design analytics
• Level of study predict satisfaction
• Learning design (finding info, productive, assessment) negatively predict satisfaction
• Interactive learning design positively predicts satisfaction
• VLE engagement and satisfaction unrelated

Model 1 Model 2 Model 3
Level0 -.142 -.147 .005
Level1 -.227 -.236 .017
Level2 -.134 -.170 -.004
Level3 .059 -.059 .215
Year of implementation -.191** -.152* -.151*
Faculty 1 .355** .374** .360**
Faculty 2 -.033 -.032 -.189*
Faculty 3 .095 .113 .069
Faculty other .129 .156 .034
Size of module -.298** -.285** -.239**
Learner satisfaction (SEAM) -.082 -.058
LMS Engagement -.070 -.190*
Finding information -.154
Communication .500**
Productive .133
Experiential .008
Interactive -.049
Assessment .063
R-sq adj 30% 30% 36%
n = 150 (Model 1-2), 140 (Model 3), * p < .05, ** p < .01
Table 5 Regression model of learning performance predicted by institutional, satisfaction and learning design analytics
• Size of module and discipline predict completion
• Satisfaction unrelated to completion
• Learning design (communication) predicts completion

Constructivist Learning Design
Assessment Learning Design
Productive Learning Design
Socio-construct. Learning Design
VLE Engagement
Student Satisfaction
Student retention
150+ modules
Week 1 Week 2 Week30+
Rienties, B., Toetenel, L., (Submitted). The impact of 151 learning designs on student satisfaction and performance: social learning (analytics) matters. Learning Analytics Knowledge conference.
Communication


Toetenel, L., Rienties, B. (Submitted) Learning Design – creative design to visualise learning activities. Open Learning.


So what does the OU do in terms of interventions on learning analytics?

The OU is developing its capabilities in 10 key areas that build the underpinning strengths required for the effective deployment of analytics
Strategic approach

39

41
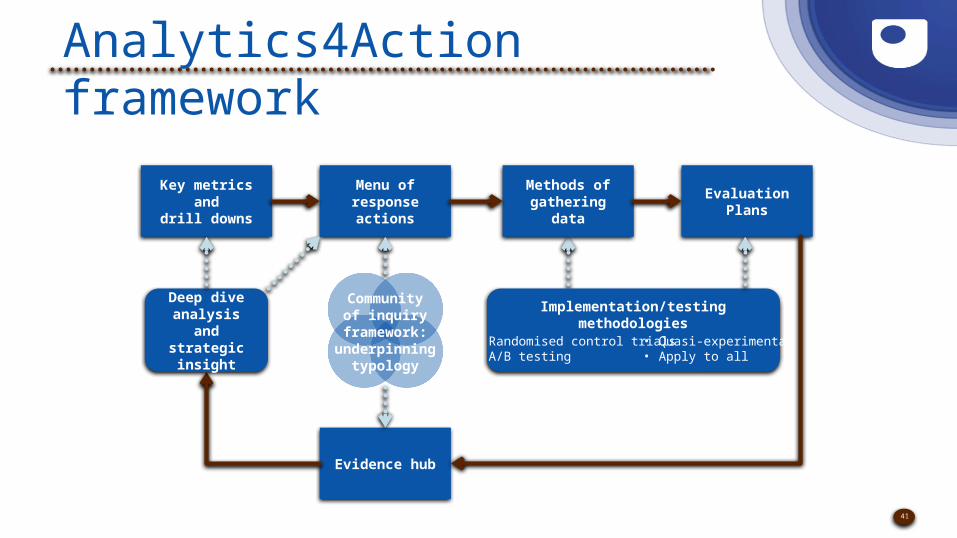
Analytics4Action framework
Implementation/testing methodologies
• Randomised control trials• A/B testing
• Quasi-experimental• Apply to all
Communityof inquiry
framework:underpinning
typology
Menu of response actions
Methods of gathering data Evaluation Plans
Evidence hub
Key metrics anddrill downs
Deep dive analysis and
strategic insight


44
Menu of actions Learning design (before start) In-action interventions (during module)
Cognitive Presence Redesign learning materials
Redesign assignments
Audio feedback on assignments
Bootcamp before exam
Social Presence Introduce graded discussion forum activities
Group-based wiki assignment
Assign groups based upon learning analytics
metrics
Emotional questionnaire to gauge students’
emotions
Introduce buddy system
Organise additional videoconference sessions
One-to-one conversations
Cafe forum contributions
Support emails when making progress
Teaching Presence Introduce bi-weekly online videoconference
sessions
Podcasts of key learning elements in the module
Screencasts of “how to survive the first two weeks”
Organise additional videoconference sessions
Call/text/skype student-at-risk
Organise catch-up sessions on specific topics that
students struggle with


Conclusions (Part I)
1. Learning design strongly influences student engagement, satisfaction and performance
2. Visualising learning design decisions by teachers lead to more interactive/communicative designs

Conclusions (Part II)
1. 10 out of 11 modules improved retention
2. Visualising learning analytics data can encourage teachers to intervene in-presentation and redesign afterwards

The power of (in)formal learning: a learning analytics approach
A special thanks to Avinash Boroowa, Simon Cross, Lee Farrington-Flint, Christothea Herodotou, Lynda Prescott, Kevin Mayles, Tom Olney, Lisette Toetenel, John Woodthorpe and others…A special thanks to Prof Belinda Tynan for her continuous support on analytics at the OU UK
@DrBartRientiesReader in Learning Analytics