Key Mobility Challenges in Indian Cities - International Transport
33
Key Mobility Challenges in Indian Cities 18 Discussion Paper 2011 • 18 Geetam TIWARI Indian Institute of Technology Delhi
Transcript of Key Mobility Challenges in Indian Cities - International Transport
Key Mobility Challenges in Indian Cities
18Discussion Paper 2011 • 18
Geetam TIWARIIndian Institute of Technology Delhi

This document was produced as background for the 2011 International Transport Forum, on 25-27 May in Leipzig, Germany, on Transport for Society. The views expressed in this document do not necessarily reflect those of the member countries of the International Transport Forum.
Further information about the International Transport Forum is available at www.internationaltransportforum.org

Key Mobility Challenges in Indian Cities
Discussion Paper No. 2011-18
Geetam Tiwari Civil Engineering Department
Indian Institute of Technology Delhi, India
May 2011
Key Mobility Challenges in Indian Cities
2 Discussion Paper 2011-18: Geetam Tiwari – ©OECD/ITF 2011
INTERNATIONAL TRANSPORT FORUM
The International Transport Forum at the OECD is an intergovernmental organisation with 52 member countries. It acts as a strategic think tank with the objective of helping shape the transport policy agenda on a global level and ensuring that it contributes to economic growth, environmental protection, social inclusion and the preservation of human life and well-being. The International Transport Forum organizes an annual summit of Ministers along with leading representatives from industry, civil society and academia.
The International Transport Forum was created under a Declaration issued by the Council of Ministers of the ECMT (European Conference of Ministers of Transport) at its Ministerial Session in May 2006 under the legal authority of the Protocol of the ECMT, signed in Brussels on 17 October 1953, and legal instruments of the OECD.
The Members of the Forum are: Albania, Armenia, Australia, Austria, Azerbaijan, Belarus, Belgium, Bosnia-Herzegovina, Bulgaria, Canada, Croatia, the Czech Republic, Denmark, Estonia, Finland, France, FYROM, Georgia, Germany, Greece, Hungary, Iceland, India, Ireland, Italy, Japan, Korea, Latvia, Liechtenstein, Lithuania, Luxembourg, Malta, Mexico, Moldova, Montenegro, Netherlands, New Zealand, Norway, Poland, Portugal, Romania, Russia, Serbia, Slovakia, Slovenia, Spain, Sweden, Switzerland, Turkey, Ukraine, the United Kingdom and the United States.
The International Transport Forum’s Research Centre gathers statistics and conducts co-operative research programmes addressing all modes of transport. Its findings are widely disseminated and support policymaking in Member countries as well as contributing to the annual summit.
DISCUSSION PAPERS
The International Transport Forum’s Discussion Paper Series makes economic research, commissioned or carried out at its Research Centre, available to researchers and practitioners. The aim is to contribute to the understanding of the transport sector and to provide inputs to transport policy design. The Discussion Papers are not edited by the International Transport Forum and they reflect the author's opinions alone.
The Discussion Papers can be downloaded from: www.internationaltransportforum.org/jtrc/DiscussionPapers/jtrcpapers.html
The International Transport Forum’s website is at: www.internationaltransportforum.org or further information on the Discussion Papers and other JTRC activities, please email: [email protected]

Key Mobility Challenges in Indian Cities
Discussion Paper 2011-18: Geetam Tiwari – ©OECD/ITF 2011 3
TABLE OF CONTENTS
1. INTRODUCTION ................................................................................................................... 5
2. URBANIZATION AND TRANSPORT .................................................................................... 6
2.1 Urbanization and Economic Growth .............................................................................. 6 2.2 Economic Growth .......................................................................................................... 6 2.3 City Profile and Travel Patterns ..................................................................................... 7 2.4 Travel Trends ................................................................................................................ 8 2.5 Vehicle Ownership: Trends and Projections .................................................................. 9
3. URBAN MOBILITY CHALLENGES ......................................................................................10
3.1 Traffic Crashes .............................................................................................................10
3.1.1 Projecting Road Traffic Fatalities in Indian Cities .............................................11 3.1.2 Traffic Crash Patterns in Cities .........................................................................12 3.1.3 Road Users Killed in Traffic Crashes ................................................................13
3.2 Fuel Consumption and Green House Gas (GHG) Emissions........................................14
4. CURRENT POLICIES AND INTERVENTIONS ....................................................................17
4.1 Required Interventions: ................................................................................................19
4.1.1 Improving Bus Systems ...................................................................................19 4.1.2 Improvements in Intermediate Public Transport ...............................................20 4.1.3 Speed Limits in Cities .......................................................................................21
4.2 National Level Policies .................................................................................................21
4.2.1 National Urban Housing and Habitat Policy (NUHHP) ......................................21 4.2.2 National Urban Transport Policy (NUTP) ..........................................................22 4.2.3 Jawaharlal Nehru National Urban Renewal Mission (JNNURM) .......................22 4.2.4 The National Road Safety &Traffic Management Board Bill, 2010 ....................23
4.3 State Level Policy Intervention .....................................................................................25
4.3.1 State Urban Transport Policy (SUTP):..............................................................25 4.3.2 State Road Safety &Traffic Management Board ...............................................25
4.4 City Level Policy Interventions ......................................................................................25
5. CONCLUDING REMARKS ..................................................................................................26
5.1 Activities Suggested for Implementing Agencies: Ministry of Urban Development, State PWD, Urban development Authorities, City Municipalities) ..................................26
5.1.1 All Road Design Standards to be Reviewed (2 yrs) ..........................................27 5.1.2 Audit of Hazardous Locations (yr 1-10) ............................................................27 5.1.3 Crash Data Base on Standard Format (1 yr) ....................................................27 5.1.4 Segregated NMV Lanes: ..................................................................................27 5.1.5 Capacity Building City Engineers, Town Planners,
Safety Auditor, Traffic Police (every year): .......................................................27

Key Mobility Challenges in Indian Cities
Discussion Paper 2011-18: Geetam Tiwari – ©OECD/ITF 2011 5
1. INTRODUCTION
The existing modal share in Indian cities is in favor of Non-motorized transport (NMT) and public transport. However given the hostile conditions for public transport and increasing risk to pedestrians and cyclists, the use of personal motorized vehicle is increasing. This trend is accompanied with the rise in traffic crashes and deteriorating air quality in cities. Emission levels vary with travel behavior which is dependent on city size, structure and mode choice available.
In Indian cities, a large proportion of population lives in slums, for example in Mumbai percentage of population living in slums is 54.1%, Kolkata 32.5% and in Delhi it is 18.7% (Census of India, 2001). There is a significant proportion of people who cannot afford personal motorized vehicles (cars and two-wheelers) for transportation and subsidized bus systems are also too expensive for them for daily commute (Mohan and Tiwari, 2000). Their transportation needs are thus dependent on NMT (walking or cycling). As such, even in the megacities of India (population more than 8 million), 30% of the trips are made by NMT, 50% by PT (both formal bus systems and informal bus systems, tempos) and rest are by Personal Motorized Vehicles (PMV) i.e. cars and two wheelers.
Any investment in infrastructure to improve mobility of motorized vehicles thus benefits only small group of affluent class of people who own PMV. Moreover, without facilities to regulate the interaction between motorized vehicles and NMT this new infrastructure limits the freedom of movement of the common citizen substantially. Also, any investments made in infrastructure to improve mobility of PMV results in improvement in vehicular speeds in the short term. This is often short lived eventually resulting in increase in congestion levels because of the increasing number of PMV (Grazi and van den Bergh, 2008). Moreover, the increasing number of PMV results in increasing negative environmental impacts like degrading air quality, noise and habitat loss and fragmentation (Demirel et al., 2008) and increasing number of accidents (Peden et al., 2004). For a long term solution and sustainable transportation it is required to promote the use of NMT and PT.
This study discusses the key challenges in urban mobility in India in three parts as listed below:
Urbanization and transport
Urbanization and population growth
City Profile
Vehicle ownership trends
Travel Patterns
Urban Transport challenges
Increasing share of personal motorized vehicles
Traffic crashes
Fuel consumption and GHG emissions
Current policies and interventions
NUTP
State level Policy
City level Policy

Key Mobility Challenges in Indian Cities
6 Discussion Paper 2011-18: Geetam Tiwari – ©OECD/ITF 2011
2. URBANIZATION AND TRANSPORT
Urbanization and Economic growth
City Profile
Vehicle ownership trends
Travel Patterns
2.1 Urbanization and Economic Growth
Current population of India is 1.21 billion. The population is expected to grow at the rate of 1.8-1.5% per annum by 2030. Therefore, the estimated population of India by 2040 will be in the range of 1.5-1.7 billion. The Indian economy has been growing at a rate of more than 7% for the last four years. However, the urbanization process has been slow in India. The analysis of development dynamics in the 1990s shows that there has been an all-round decline in the growth of employment. Income growth and incidence of poverty have been extremely uneven across states. Thus a slowing down in the rate of urbanization and concentrations of demographic growth in developed states seem to be the logical outcome. The process of urbanization has also become exclusionary in nature, as only a few large cities with a strong economic base are able to raise resources for development, leaving out small and medium towns (Kundu, 2003). India is 30% urbanized and is expected to reach 40% by 2040. The current per capita income of 1 061 USD is expected to increase to 12 000 USD in the high growth (9% per annum) scenario and 6 000 USD in the low growth rate (6-7% per annum) scenario.
2.2 Economic Growth
At a likely GDP growth rate of 7.5 to 8% per year, real per capita GDP is expected to reach USD 2 700 by 2030, a five-fold increase over the 2005 level. India’s population is likely to reach 1.5 billion. This growth will be accompanied by increased urbanization, with well over 550 million (40%) of India’s people living in cities two decades from now. This shift towards a more urban economy will expand demand for services like housing, power and transport. The vehicle fleet is expected to increase from a little over 50 million today to about 380 million by 2030 (McKinsey & Company, 2009).
India’s GDP (nominal) is forecast to increase from US$ 1 256 billion in 2010 to US$ 6 683 billion in 2030, US$ 16 510 billion in 2040 and US$37 668 billion in 2050. Per capita GDP trend has been forecast in terms of GDP- nominal and per capita in Table 1.
Table 1. Forecast of GDP trends
2010 2020 2030 2040 2050
GDP (nominal) US$ billion 1 256 2 848 6 683 16 510 37 668 GDP (per capita) 1 061 2 091 4 360 9 802 20 836
Source: (Wilson and Stupnytska, 2007).
Key Mobility Challenges in Indian Cities
Discussion Paper 2011-18: Geetam Tiwari – ©OECD/ITF 2011 7
2.3 City Profile and Travel Patterns
There are 4 378 urban agglomerations and towns identified by the census of India. Distribution of cities in various population sizes are given in Table 2. Nearly 50% of the urban population lives in small cities (<.5 million), whereas 15% of the urban population lives in mega cities (>8 million population).
Table 2. Classification of cities by population size
Category Population (million)
Total no. of census cities
% of Total population in different cities
1 < .5 4 304 53 2 .5 – 1.0 39 10 3 1.0 – 2.0 22 10 4 2.0 – 4.0 6 6 5 4.0 – 8.0 4 8 6 > 8.0 3 15 Total 4 378
Source: (Wilbur Smith Associates, 2008).
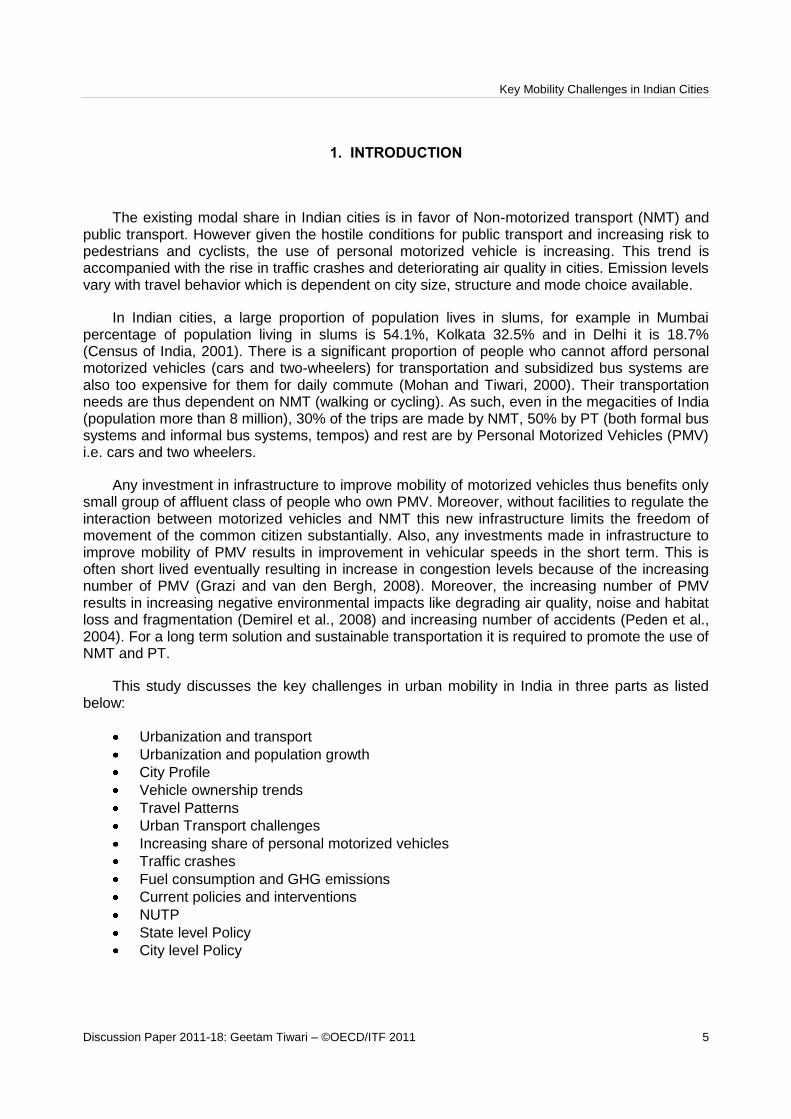
Indian cities have mix land use structure with substantial informal settlements (15-60% population living in slums). This has resulted in short trip lengths irrespective of city size. Figure 1 shows that even in big cities like Mumbai and Hyderabad 80% of the trips are less than 10 km in length and 70% of the trips are less than 5 km. In cities like Pune 97% of the trips is less than 10 km and 80% of the trips are shorter than 5 km. The average trip length in medium and small size cities is less than 5 km.
Figure 1. Trip lengths in selected cities in India
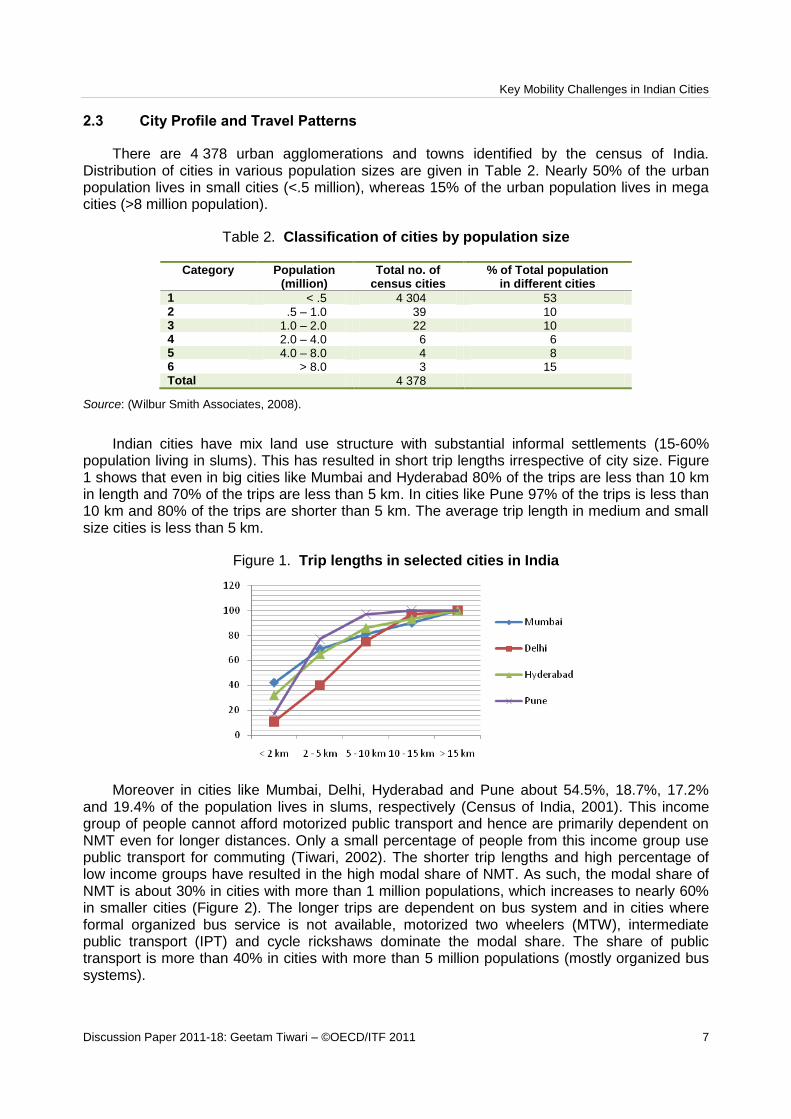
Moreover in cities like Mumbai, Delhi, Hyderabad and Pune about 54.5%, 18.7%, 17.2% and 19.4% of the population lives in slums, respectively (Census of India, 2001). This income group of people cannot afford motorized public transport and hence are primarily dependent on NMT even for longer distances. Only a small percentage of people from this income group use public transport for commuting (Tiwari, 2002). The shorter trip lengths and high percentage of low income groups have resulted in the high modal share of NMT. As such, the modal share of NMT is about 30% in cities with more than 1 million populations, which increases to nearly 60% in smaller cities (Figure 2). The longer trips are dependent on bus system and in cities where formal organized bus service is not available, motorized two wheelers (MTW), intermediate public transport (IPT) and cycle rickshaws dominate the modal share. The share of public transport is more than 40% in cities with more than 5 million populations (mostly organized bus systems).
Key Mobility Challenges in Indian Cities
8 Discussion Paper 2011-18: Geetam Tiwari – ©OECD/ITF 2011
Figure 2. Modal share (%) vs. different city size (population in millions)
2.4 Travel Trends
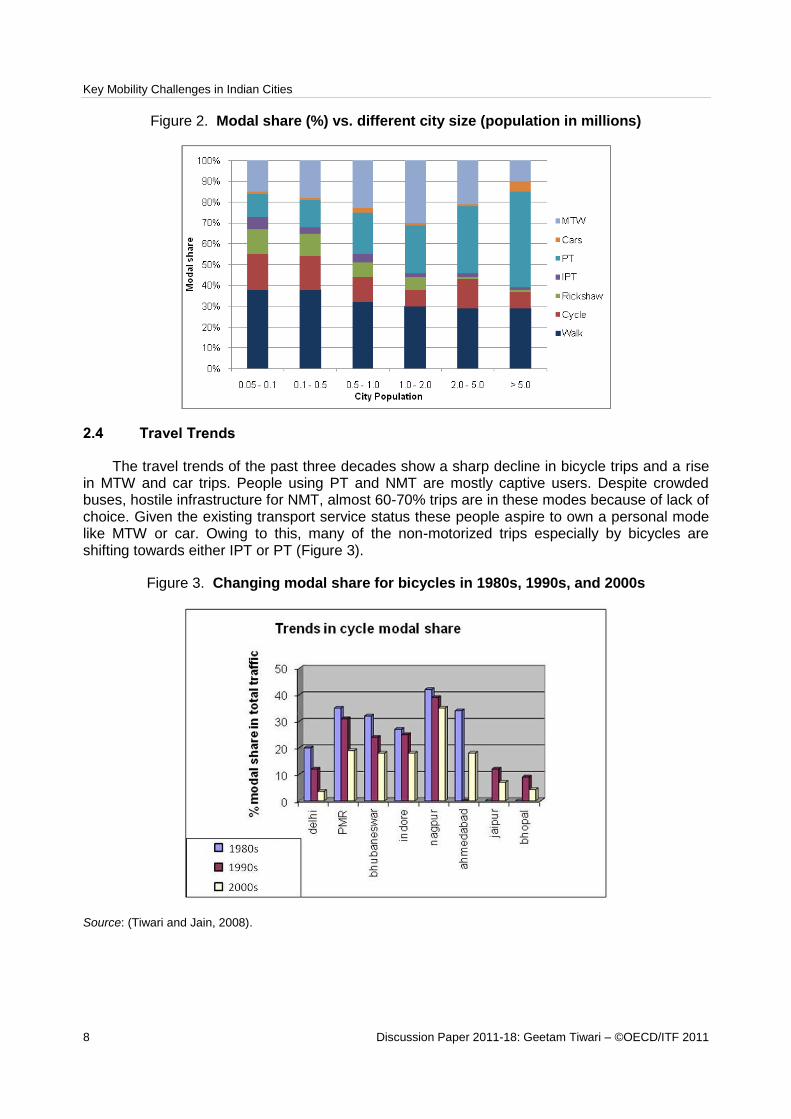
The travel trends of the past three decades show a sharp decline in bicycle trips and a rise in MTW and car trips. People using PT and NMT are mostly captive users. Despite crowded buses, hostile infrastructure for NMT, almost 60-70% trips are in these modes because of lack of choice. Given the existing transport service status these people aspire to own a personal mode like MTW or car. Owing to this, many of the non-motorized trips especially by bicycles are shifting towards either IPT or PT (Figure 3).
Figure 3. Changing modal share for bicycles in 1980s, 1990s, and 2000s
Source: (Tiwari and Jain, 2008).
Key Mobility Challenges in Indian Cities
Discussion Paper 2011-18: Geetam Tiwari – ©OECD/ITF 2011 9
2.5 Vehicle Ownership: Trends and Projections
The total motor population has increased from 0.3 million in 1951 to about 73 million in 2004. Motorcycles are five times as numerous as cars. Indian economy has been growing at 8% for the past five years and is expected to grow at 8-10% over the next 5–6 years. However major increases in fuel prices are likely to have a greater negative influence over the car sales than motorized two vehicles
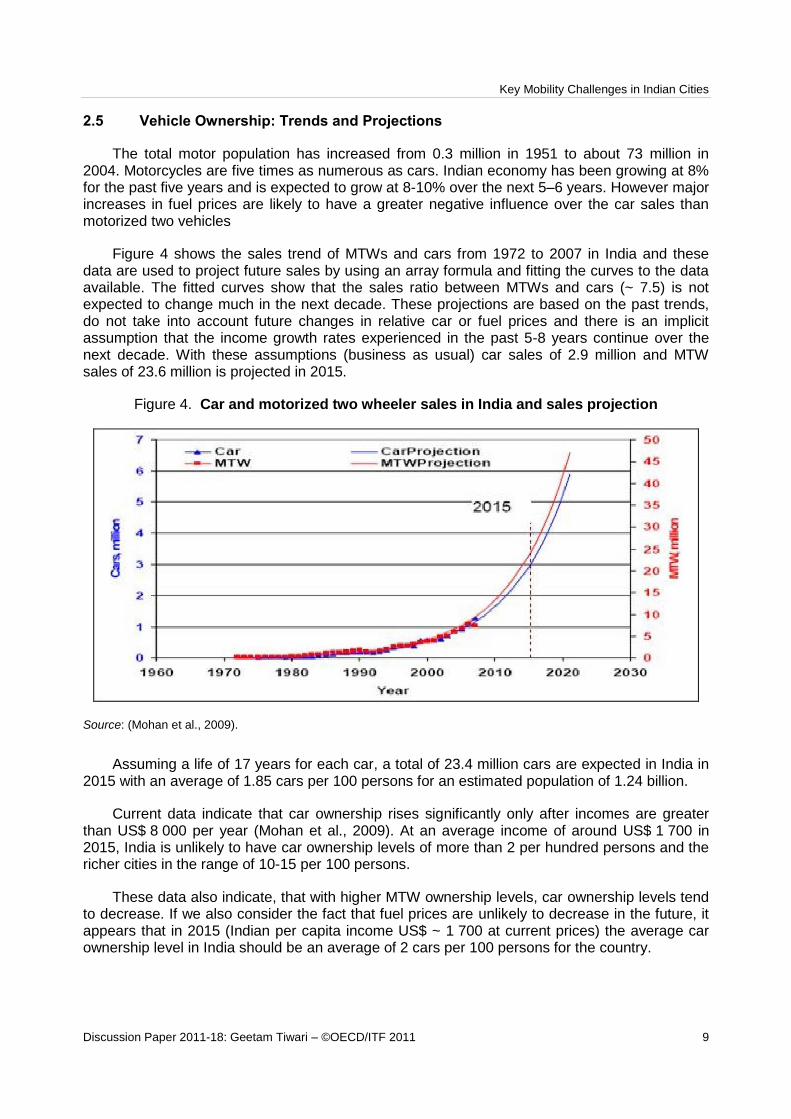
Figure 4 shows the sales trend of MTWs and cars from 1972 to 2007 in India and these data are used to project future sales by using an array formula and fitting the curves to the data available. The fitted curves show that the sales ratio between MTWs and cars (~ 7.5) is not expected to change much in the next decade. These projections are based on the past trends, do not take into account future changes in relative car or fuel prices and there is an implicit assumption that the income growth rates experienced in the past 5-8 years continue over the next decade. With these assumptions (business as usual) car sales of 2.9 million and MTW sales of 23.6 million is projected in 2015.
Figure 4. Car and motorized two wheeler sales in India and sales projection
Source: (Mohan et al., 2009).
Assuming a life of 17 years for each car, a total of 23.4 million cars are expected in India in 2015 with an average of 1.85 cars per 100 persons for an estimated population of 1.24 billion.
Current data indicate that car ownership rises significantly only after incomes are greater than US$ 8 000 per year (Mohan et al., 2009). At an average income of around US$ 1 700 in 2015, India is unlikely to have car ownership levels of more than 2 per hundred persons and the richer cities in the range of 10-15 per 100 persons.
These data also indicate, that with higher MTW ownership levels, car ownership levels tend to decrease. If we also consider the fact that fuel prices are unlikely to decrease in the future, it appears that in 2015 (Indian per capita income US$ ~ 1 700 at current prices) the average car ownership level in India should be an average of 2 cars per 100 persons for the country.

Key Mobility Challenges in Indian Cities
10 Discussion Paper 2011-18: Geetam Tiwari – ©OECD/ITF 2011
3. URBAN MOBILITY CHALLENGES
Urban residents face multiple mobility challenges. Despite having high share of non motorized vehicles, public transport and low vehicle ownership of car, compared to most European cities, residents are exposed to high level of local pollution and risk of getting involved in traffic crashes (Tiwari, 1996; Thynell et al., 2010).
It is clear that having the right modal mix and low use of personal transport is a necessary but not sufficient condition for the provision of clean air, safe roads and optimal access conditions in cities.
3.1 Traffic Crashes
Fatalities and injuries caused by traffic crashes have become a major public health concern in India. Total number of people involved in traffic crashes as well as rates per million population have been increasing in the last three decades.
According to official statistics, 114 444 people were killed in road traffic crashes in India in 2007 (NCRB, 2007). Traffic fatalities increased by about 5% per year from 1980 to 2000, and since then have increased by about 8% per year for the four years for which statistics are available (Figure 5). This is attributable partly to an increase in the number of vehicles on the road, and partly to the absence of a coordinated official policy to control the problem. The fatality rate has increased from 36 fatalities per million persons in 1980 to 95 fatalities per million persons in 2006 (Mohan et al., 2009). However, a study done in Bangalore shows that while the number of traffic crash deaths recorded by the police may be reasonably reliable, the total number of injuries is grossly underestimated (Gururaj, 2006). According to that study, deaths were underestimated by 5% and the number injured who needed treatment in hospitals was underestimated by more than a factor of two. In that study, the ratio of injured people reporting to hospitals versus those killed was 18:1. An estimated 1,650,000 people were victimised in traffic cashes were hospitalised in 2006.
Figure 5. Number of people (in thousands) killed in road traffic crashes
Source: (NCRB, 2007).

Key Mobility Challenges in Indian Cities
Discussion Paper 2011-18: Geetam Tiwari – ©OECD/ITF 2011 11
Table 3. Road accident statistics of India: 1970-2004
Year Total no. of
road accidents (in numbers)
Total no. of persons killed (in numbers)
Total no. of regd. Motor vehicles (in thousands)
No. of accidents per ten thousand
vehicles
No. of persons killed per ten
thousand vehicles
1970 114 100 14 500 1 401 814.42 103.50 1980 153 200 24 000 4 521 338.86 53.09 1990 282 600 54 100 19 152 147.56 28.25 1991 295 131 56 278 21 374 138.08 26.33 1992 275 541 60 113 23 507 117.22 25.57 1993 284 646 60 380 25 505 111.60 23.67 1994 325 864 64 463 27 660 117.81 23.31 1995 351 999 70 781 30 295 116.19 23.36 1996 371 204 74 665 33 786 109.87 22.10 1997 373 671 76 977 37 332 100.09 20.62 1998 385 018 79 919 41 368 93.07 19.32 1999 386 456 81 966 44 875 86.12 18.27 2000 391 449 78 911 48 857 80.12 16.15 2001 405 637 80 888 54 991 73.76 14.71 2002 407 497 84 674 58 924 69.16 14.37 2003 406 726 85 998 67 007 60.70 12.83 2004 429 910 92 618 72 718 59.12 12.74
Source: (MORTH, 2010).
Figure 5 gives the road accident statistics of India 1970-2004. It shows that while the total number of road accidents increase to almost four times from the year 1970 to 2004, the number of persons killed in them becomes approximately six times. As the total number of registered motor vehicles increases fifty times, the number of accidents per ten thousand vehicles decreases from 814 in 1970 to 60 in 2004. The number of persons killed per ten thousand vehicles decrease from 103 in 1970 to 13 in 2004.
Indians between the ages of 15 and 50 years have a higher probability of being admitted to the hospital due to a road traffic injury than heart attacks, cancer or HIV. We also know that occupants of small vehicles suffer more severe injuries than those in heavier vehicles when the two are involved in a crash (Wood and Simms, 2005; Broughton, 2008). At the same time we have some evidence that three-wheeled scooter taxis do not have as high crash rates in India as is commonly assumed (Mukherjee et al., 2007). This could be because these vehicles cannot exceed a speed of 50 km/h most of the time.
3.1.1 Projecting Road Traffic Fatalities in Indian Cities
(Koornstra, 2007) has projected fatalities in India. Fatalities include occupants of vehicles and pedestrians. Vehicles include four-wheel and two wheel motor vehicles, both passenger and commercial. From Table 4, we see that India had 47 million vehicles (87% of China’s) in 2000, and is* expected to have 292 million (59% of China’s) by 2050. Fatalities per vehicles in India are expected to fall by 3.3% per year, from 122.7 fatalities per 25,000 vehicles in 2000 to 23.2 in 2050.
India’s base road fatalities Kuznets curve (21.6 fatalities per 100 000 persons in 2000) peaks in 2012 at 23.8 fatalities per 100 000 persons. Fatalities per 100,000 persons gradually fall after 2012 to 17.3 fatalities per 100 000 persons in 2050. There were 225 000 road fatalities in India in 2000. The toll is expected to peak at 301 000 fatalities 2024, and thereafter gradually fall to 272 000 in 2050. If fatalities per capita in India were to remain at or below the 2000 level, then 483 000 fewer road fatalities would occur between 2000 and 2050. This portion of the

Key Mobility Challenges in Indian Cities
12 Discussion Paper 2011-18: Geetam Tiwari – ©OECD/ITF 2011
Kuznets curve with fatalities per capita higher than the 2000 rate is responsible for 3.34 more fatalities per 100 000 persons in China than in India. The base case predicts about 14 million road fatalities in India between 2000 and 2050.
Table 4. Projection of population, GDP and fatalities
Calendar Year 2000 2050
Population (millions) 1,041 1,572 GDP per capita $460 $2,569 Vehicles (millions) 47 292 Fatalities (thousands) 225 272 Fatalities per 100 000 persons 21.6 17.3 Fatalities per 25 000 vehicles 122.7 23.2 Vehicles per 250 persons 11.0 46.7
Source: (McManus, 2007).
3.1.2 Traffic Crash Patterns in Cities
Figure 6. Traffic fatality rate in cities with population greater than one million
Source: (NCRB, 2007).
Figure 6 shows traffic fatality rates in cities with populations of at least one million for the years 2001 and 2006. Many cities depict a fatality increase of 2-5% in five years duration. Fatality rates have increased regardless of the size of the city or the region. Small cities where newly upgraded highways have been built show highest increase in fatality rates. The issues regarding traffic crashes in urban areas may be understood by the fact that at present less than one in 40 families owns a car in India. The car ownership level in India is so low that even at reasonable economic growth rates (say 5-7% per year) most families are not likely to own a car in the year 2020. Consequently, a majority of the population in India is not likely to use cars for surface travel for the near future. This low ownership level of cars determines the distribution of fatalities by class of road user.
Key Mobility Challenges in Indian Cities
Discussion Paper 2011-18: Geetam Tiwari – ©OECD/ITF 2011 13
Analysis of crash patterns show that the self-segregation of the modes is not sufficient to ensure the safety of vulnerable bicyclists. While mid block crashes are not usually a serious concern in homogenous regimented traffic conditions, this category dominates in Indian cities.
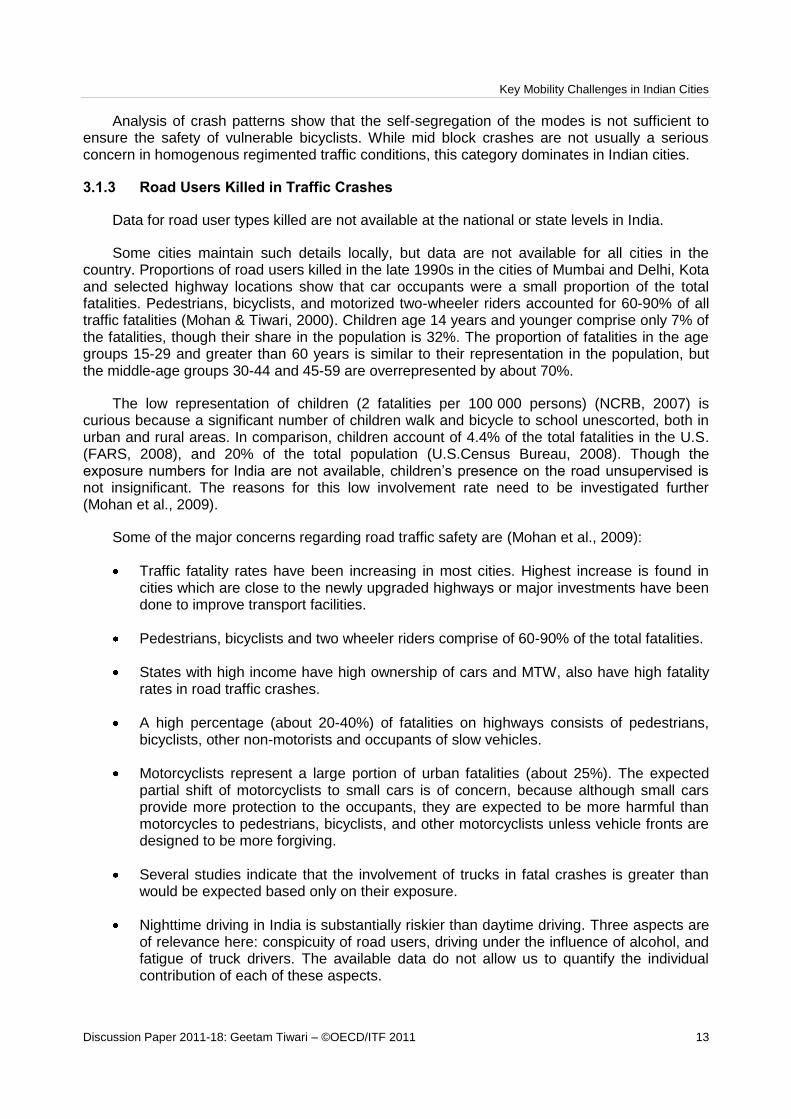
3.1.3 Road Users Killed in Traffic Crashes
Data for road user types killed are not available at the national or state levels in India.
Some cities maintain such details locally, but data are not available for all cities in the country. Proportions of road users killed in the late 1990s in the cities of Mumbai and Delhi, Kota and selected highway locations show that car occupants were a small proportion of the total fatalities. Pedestrians, bicyclists, and motorized two-wheeler riders accounted for 60-90% of all traffic fatalities (Mohan & Tiwari, 2000). Children age 14 years and younger comprise only 7% of the fatalities, though their share in the population is 32%. The proportion of fatalities in the age groups 15-29 and greater than 60 years is similar to their representation in the population, but the middle-age groups 30-44 and 45-59 are overrepresented by about 70%.
The low representation of children (2 fatalities per 100 000 persons) (NCRB, 2007) is curious because a significant number of children walk and bicycle to school unescorted, both in urban and rural areas. In comparison, children account of 4.4% of the total fatalities in the U.S. (FARS, 2008), and 20% of the total population (U.S.Census Bureau, 2008). Though the exposure numbers for India are not available, children’s presence on the road unsupervised is not insignificant. The reasons for this low involvement rate need to be investigated further (Mohan et al., 2009).
Some of the major concerns regarding road traffic safety are (Mohan et al., 2009):
Traffic fatality rates have been increasing in most cities. Highest increase is found in cities which are close to the newly upgraded highways or major investments have been done to improve transport facilities.
Pedestrians, bicyclists and two wheeler riders comprise of 60-90% of the total fatalities.
States with high income have high ownership of cars and MTW, also have high fatality rates in road traffic crashes.
A high percentage (about 20-40%) of fatalities on highways consists of pedestrians, bicyclists, other non-motorists and occupants of slow vehicles.
Motorcyclists represent a large portion of urban fatalities (about 25%). The expected partial shift of motorcyclists to small cars is of concern, because although small cars provide more protection to the occupants, they are expected to be more harmful than motorcycles to pedestrians, bicyclists, and other motorcyclists unless vehicle fronts are designed to be more forgiving.
Several studies indicate that the involvement of trucks in fatal crashes is greater than would be expected based only on their exposure.
Nighttime driving in India is substantially riskier than daytime driving. Three aspects are of relevance here: conspicuity of road users, driving under the influence of alcohol, and fatigue of truck drivers. The available data do not allow us to quantify the individual contribution of each of these aspects.

Key Mobility Challenges in Indian Cities
14 Discussion Paper 2011-18: Geetam Tiwari – ©OECD/ITF 2011
Wrong-way drivers on divided highways. A large proportion of fatalities on divided highways are from head-on collisions. One study found that such crashes accounted for 19% of all fatalities on four-lane, divided highways.
3.2 Fuel Consumption and Green House Gas (GHG) Emissions
The transport sector contributes about 20% of CO2 emissions worldwide and about 15% of CO2 emissions in India, and this share has been increasing over time. This is important for India since about 80% of petroleum requirements are dependent on imports. Moreover, the percentage of imports, the cost of imports and the share of transport fuels -gasoline and diesel are steadily increasing (Figure 7).
Figure 7. Growing petroleum consumption, imports and share of transport fuels
Petroleum product consumption / import cost
27.9 29.3 29.0 27.7
111.794.4 102.3 117.6
0%
10%
20%
30%
40%
50%
60%
70%
80%
90%
100%
2005-06 2006-07 2007-08 2008-09
0
5000
10000
15000
20000
25000
30000
Domestic (MT) Imports (MT)Share of transport fuels Import cost (Rs / ton)
Source: (Ministry of petroleum and natural gas, 2009).
It is expected that mandatory fuel economy standards and an official fuel economy labeling programme will help in reducing these emissions (CSE, 2011).
Road transport dominates the transport activities in India by carrying about 60% of freight (ton-km) and 87% of passenger (pass-km) transport in 2005 and contributing to about 95% of the emissions from freight transport and 92% of emissions from passenger transport. Further, the share of road based freight and passenger transport has also been steadily increasing over time. Figure 9 presents mode-wise trends of passenger transport activity from which it can be seen that the shares of 2-wheelers and cars have been steadily increasing.
Table 5 shows the total fuel being consumed by various city sizes in India. The majority of fuel consumption by vehicles for all cities in category 1 to 5 is contributed by cars and MTW. These modes account approximately for 65 - 90% of the total emissions produced by all modes of transport in these cities. In category 6 cities, although cars and MTW consume less than 50% of the total fuel consumed by all the modes, the total emission produced by these two modes is more than 60%. In category 5 and 6 cities, IPT vehicles account to 18 to 23% of the fuel consumption, respectively while they contribute to approximately quarter of the total emissions by all vehicles.
Key Mobility Challenges in Indian Cities
Discussion Paper 2011-18: Geetam Tiwari – ©OECD/ITF 2011 15
It is expected that mandatory fuel economy standards and an official fuel economy labeling programme will help in reducing these emissions (CSE, 2011).
Road transport dominates the transport activities in India by carrying about 60% of freight (ton-km) and 87% of passenger (pass-km) transport in 2005 and contributing to about 95% of the emissions from freight transport and 92% of emissions from passenger transport. Further, the share of road based freight and passenger transport has also been steadily increasing over time. Figure 9 presents mode-wise trends of passenger transport activity from which it can be seen that the shares of 2-wheelers and cars have been steadily increasing.
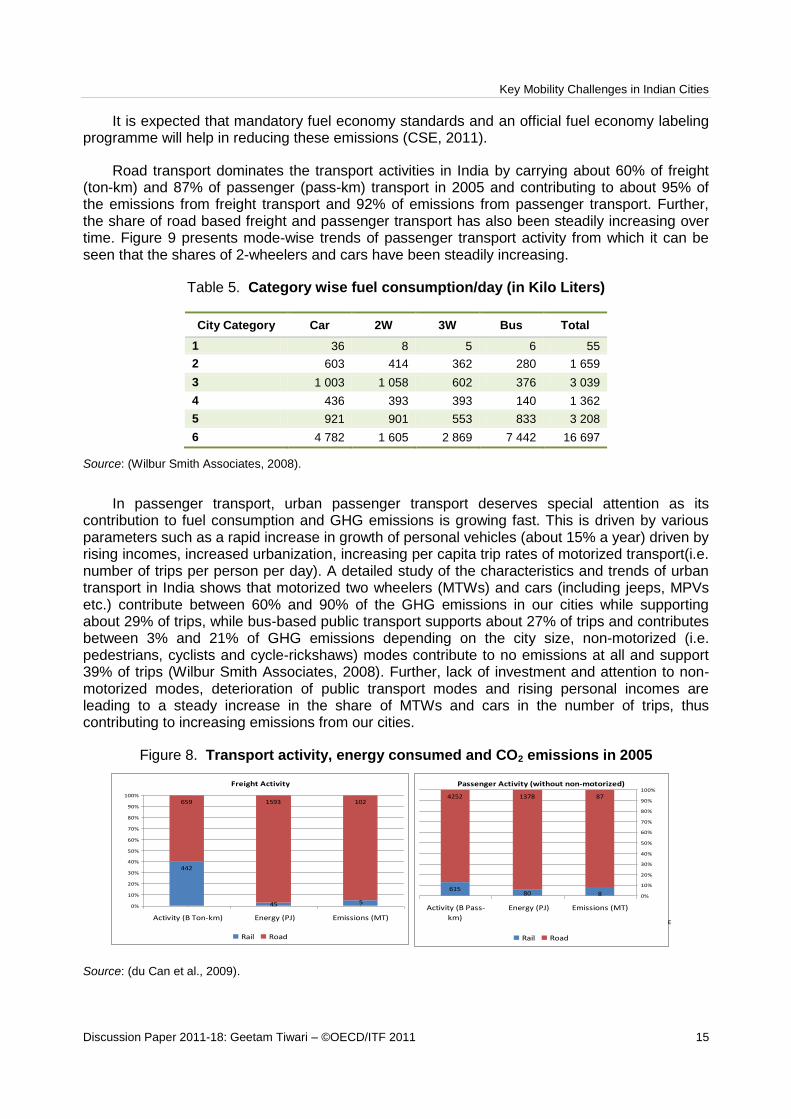
Table 5. Category wise fuel consumption/day (in Kilo Liters)
City Category Car 2W 3W Bus Total
1 36 8 5 6 55
2 603 414 362 280 1 659
3 1 003 1 058 602 376 3 039
4 436 393 393 140 1 362
5 921 901 553 833 3 208
6 4 782 1 605 2 869 7 442 16 697
Source: (Wilbur Smith Associates, 2008).
In passenger transport, urban passenger transport deserves special attention as its contribution to fuel consumption and GHG emissions is growing fast. This is driven by various parameters such as a rapid increase in growth of personal vehicles (about 15% a year) driven by rising incomes, increased urbanization, increasing per capita trip rates of motorized transport(i.e. number of trips per person per day). A detailed study of the characteristics and trends of urban transport in India shows that motorized two wheelers (MTWs) and cars (including jeeps, MPVs etc.) contribute between 60% and 90% of the GHG emissions in our cities while supporting about 29% of trips, while bus-based public transport supports about 27% of trips and contributes between 3% and 21% of GHG emissions depending on the city size, non-motorized (i.e. pedestrians, cyclists and cycle-rickshaws) modes contribute to no emissions at all and support 39% of trips (Wilbur Smith Associates, 2008). Further, lack of investment and attention to non-motorized modes, deterioration of public transport modes and rising personal incomes are leading to a steady increase in the share of MTWs and cars in the number of trips, thus contributing to increasing emissions from our cities.
Figure 8. Transport activity, energy consumed and CO2 emissions in 2005
Freight Activity
442
659 1593 102
45 50%
10%
20%
30%
40%
50%
60%
70%
80%
90%
100%
Activity (B Ton-km) Energy (PJ) Emissions (MT)
Rail Road
Passenger Activity (without non-motorized)
6158
4252 1378 87
80 0%
10%
20%
30%
40%
50%
60%
70%
80%
90%
100%
Activity (B Pass-
km)
Energy (PJ) Emissions (MT)
Rail Road
Excluding Non Motorised
Source: (du Can et al., 2009).

Key Mobility Challenges in Indian Cities
16 Discussion Paper 2011-18: Geetam Tiwari – ©OECD/ITF 2011
Figure 9. Growth in passenger kilometers for different modes of travel, 1990-2004
Based on estimates in (du Can et al., 2009)
Delhi, Ahmedabad, Pune and Kanpur are selected to understand the trends in large (category 6), medium (category 4 and 5) and small cities (category 2 and 3).
Delhi has the largest number of passenger cars in the country. It has a large bus fleet running on CNG and the number of private cars has been increasing at the rate of 900 cars/day. Emissions from cars are nearly 4 times that of MTW. Buses carry 43% of the total trips and emissions from buses are 1/3rd that of cars.
Ahmedabad and Pune show similar level of emissions from cars, MTW and three wheelers. Emissions from buses are much less than other vehicles. In both the cities average trip length is less than 5 km and walking and bicycling share is around 40%. Both cities have MTW as the most dominant mode.
Kanpur shows the highest emissions from MTW. Kanpur’s modal share is predominantly NMV trips. Bus transport is almost nonexistent.
Table 6. CO2 emissions/person/year in different category of cities
City category
CO2 tons/ person/
year
Ratio of CO2 tons/person/
year wrt megacities
Total no. of cities
Total population
CO2 tons/year
Ratio of CO2 tons/ year
wrt to megacity
1 0.026 10 4 208 150508751 3983350 3 2 0.057 4 39 27503626 1575900 7 3 0.080 3 22 27258334 2196706 5 4 0.091 3 6 15985389 1456916 8
5 0.12 2 4 22528737 2634193 4 6 0.26 1 3 42517553 11218937 1
Table 6 shows CO2 emissions per person per year in different category of cities. This is based on fuel consumption data for different category cities (WSA, 2008).To understand CO2 emission trends cities are divided into four categories as follows:
Megacities( category 6) having population of more than 8.million have per capita emission of 0.26 tons/yr;
Cities in the range of 4.0 – 8.0 million population( category 5) have an average per capita emission of 0.12 tons of per capita emission, half as compared to megacities;
Key Mobility Challenges in Indian Cities
Discussion Paper 2011-18: Geetam Tiwari – ©OECD/ITF 2011 17
Cities with a population of1.0– 4.0 million population(category 2) have a per capita emission of 0.09 tons, one third as compared to megacities ;
Smaller cities with a population of less than .5 million(category 1) have a per capita emission of .02 tons, one tenth as compared to megacities;
As shown in Table 6 approximately 50% of the total urban population lives in small cities i.e. of size less than .5 million and 15% lives in megacities. Yet, megacities are the major contributor to the total CO2 emissions made.
Travel trends of megacities (Mumbai, Delhi and Kolkata) show the dominance of PT trips. A large number of short trips less than 5 km are by MTW and bus transport. Bicycle trips are less than 10% in all three mega cities. Approximately, 15% of the total urban population of India lives in the 3 megacities and cities contributes to nearly 50% of the carbon emissions. As of now, about 40% and 30% trips are made using PT and NMV respectively. However, with the increasing income levels and declining PT and NMV share, the carbon emissions from these cities are expected to increase. The potential of reducing carbon emission needs to be thus primarily identified from these cities.
4. CURRENT POLICIES AND INTERVENTIONS
This section discusses the frameworks and strategies that are either proposed or existing. It also discusses the interventions that are required to be made at different levels and in different aspects to attain low carbon emission from transport sector along with local health benefits.
Until the mid 90s, intercity transport was the main concern of planning and decision making authorities. Since a majority of the Indians lived in rural areas, historically, improving connectivity between cities and rural areas has been the priority for transport investments. Moreover, as per the Indian constitution urban transport is a state subject; therefore, the national government could not and did not invest in urban transport. At the State level, governments have been interested in isolated projects like grade separator or a Ring Road in the state capital, and most city level governments are financially too weak to invest in the improvement of city transport infrastructure other than routine maintenance work of roads. Thus urban transport has not been dealt with effectively as of now neither by the central or state government nor by the city authorities. 4.1 Required Interventions:
Three most important aspects of urban transport system in Indian cities which require attention for achieving safe accessible sustainable transport system are:
1. Improving Bus Systems 2. Improving Intermediate Public Transport Systems 3. Enforcement of Urban Speed limits

Key Mobility Challenges in Indian Cities
18 Discussion Paper 2011-18: Geetam Tiwari – ©OECD/ITF 2011
Table 7 shows city, state and National level authorities involved with different aspects of transport decisions. Infrastructure planning and designs are guided by the guidelines issued by Indian Roads Congress at a national level. The IRC guidelines are not mandatory. Safety policies are generally formulated by MORTH in the Motor Vehicles Rules and have to be notified by the state RTO or the transport department.
CTTS or CMPS are prepared at the behest of development authorities or transport department by consultants. NUTP gives some guidance on the requirements of CMP; otherwise the consultants prepare CTTS without any vision for the future. Other stakeholders especially people are not involved at this level. CTTS have been used to primarily justify expansion of road infrastructure.
Small cities (category 1& 2 cities): There are nearly 4 400 cites in this category where nearly 60% of the urban population resides. There are no city level development plans for these size cities. Roads are maintained either by PWD or local municipality and police is responsible for law enforcement. Transport office is responsible for vehicle registration and licensing. Para-transit vehicles (cycle rickshaws, three wheeled taxis, small vans) are operated by private operators after obtaining permit from the transport department.
Medium size cities (category 3 & 4 cities): Nearly 15% of the urban population resides in this category cities. No comprehensive development plans are prepared for these size cities. Transport operations are similar to small cities except some cities have skeletal bus services operated by state transport undertakings, which primarily provide services for intercity operations. Some of the states discontinued the city operations because of financial problems. Majority trips are dependent on Para transit vehicles operated by private operators.
Large cities (category 5 and 6): Nearly 25% of the urban population lives in these cities, 15% in three mega cites (Delhi, Kolkata and Mumbai) and the remaining 10% in 4 other cities. City authorities (municipalities or development authorities) have prepared comprehensive mobility plans, and master plan for the city to plan for the estimated population growth. Public transport systems have been provided by city municipalities or city corporations. All of them have extensive bus network. Indian railways have been running suburban rail operations in Mumbai and Delhi Metro Rail Corporation (DMRC) has been responsible for the construction and operation of metro services in Delhi since 1997. The three megacities also have city traffic police responsible for traffic management, signal control and traffic law enforcement in the city. Often goals listed in master plans are not linked with traffic improvement plans. Traffic plans are aimed at “reducing car congestion”. Master plans mention desirable modal shares, however, road development plans, traffic management, are not linked with the stated goals. Long term or medium term targets for air quality improvement, and traffic safety are not part of any documents prepared at the city, state or national level. Most traffic and transport improvement plans have focused on improving road area for car and two wheeler improvement. Public transport provision and improvements include metro expansion, upgrading bus fleet and clean fuel for buses. However, accessible infrastructure for pedestrians and bicyclists are not included in these projects. Creating dedicated lanes for buses, bicyclists and often pedestrians is seen as “taking away space from cars”. Improvement in pedestrian infrastructure includes construction of either foot over bridges or subways, not ensuring safety and priority at grade facilities.
The existing institutions and authorities do not have any mechanisms for evaluating performance of different measures, use safety data collected by traffic police to identify priorities for actions. It seems that the strategic planning needed to meet the future demands is completely missing in the current institutional framework. Most effort goes into maintaining the status co and resolving daily crisis.

Key Mobility Challenges in Indian Cities
Discussion Paper 2011-18: Geetam Tiwari – ©OECD/ITF 2011 19
4.1 Required Interventions:
Three most important aspects of urban transport system in Indian cities which require attention for achieving safe accessible sustainable transport system are:
1. Improving Bus Systems 2. Improving Intermediate Public Transport Systems 3. Enforcement of Urban Speed limits
Table 7. Institutional structure for travel and transport decisions
Travel Plans Traffic
Management Infrastructure
Vehicle Registration
Environment Fuel Safety
City Level
CTTS or CMP, by transport department, Development Authorities
Traffic Police, Municipality City Bus services (Mumbai, Bangalore)
Municipality or Public works department
Transport Department, Regional Transport Office
Traffic police
State Level
TCPO master plans and regional plans
Urban Development (funding)
State Transport Undertaking (Buses)
SPCB State police (some states)
National Level
NUTP (guidelines for CMP)
JNNURM (funding), NHAI
MORTH, (MVA)
CPCB, MOEF MORTH, MOEF
MORTH NCRB
Abbreviations in Table: CTTS: Comprehensive Traffic and Transport Plans, CMP: Comprehensive Mobility Plans, TCPO: Town and Country Planning Organisation, NUTP: National Urban Transport Policy, JNNURM: Jawaharlal Nehru National Urban Renewal Mission, NHAI: National Highway Authority, MORTH: Ministry of Roads and Highways, MVA: Motor Vehicles Act, CPCB: Central Pollution Control Board, MOEF: Ministry of Environment and Forests
4.1.1 Improving Bus Systems
Public transport organizations (bus systems) are often loss making and unable to run their operations. Incentivizing bus operations and accelerating introduction of modern safe buses would help in making these organizations viable and help achieve a modal share in favor of public transport in future also despite increase in incomes and vehicle ownership. This does not preclude the need for capacity building and institutional strengthening of public transport utilities but is an additional measure to ease their financial situation.
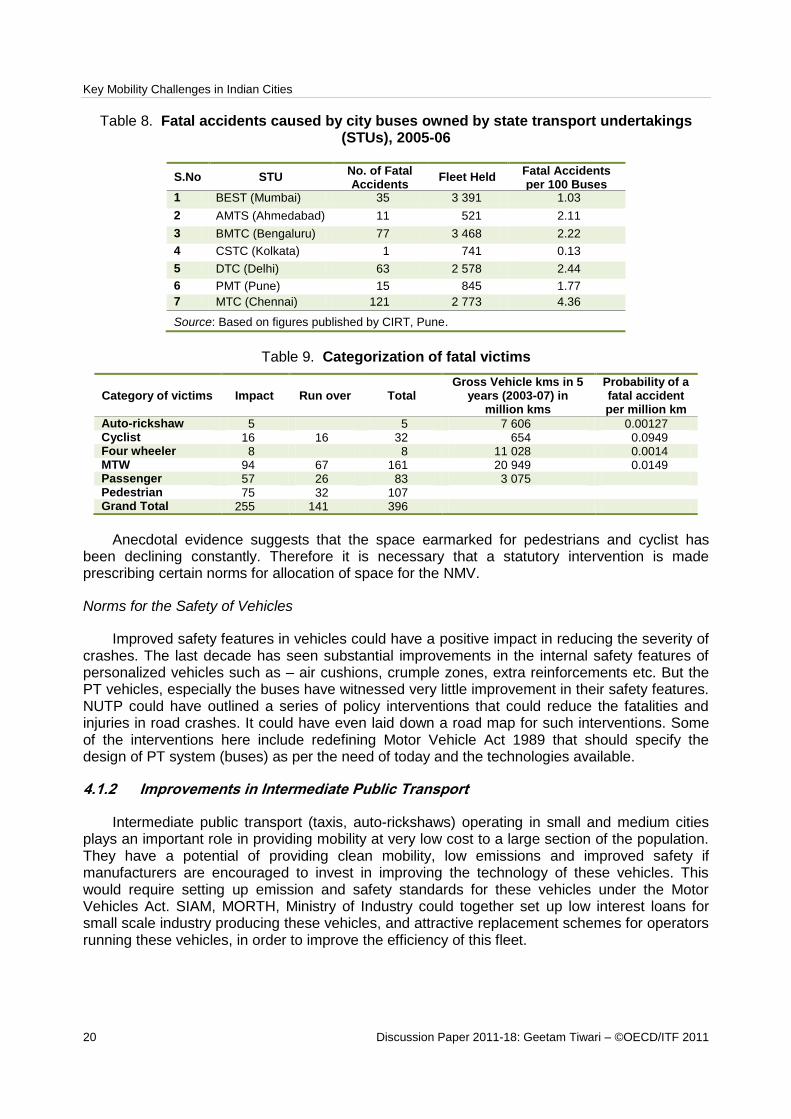
Emphasis on safety efficiency: An analysis of the fatal crashes caused by the urban PT systems is presented in Table 8.
Reducing crashes could be achieved through a number of measures one such being the appropriate policy regime. The policy interventions could be in the form of:
Norms for Physical Infrastructure Supporting NMVs
On the city roads with a heterogeneous mix of traffic, the cyclist jostles for space with the other motorized modes, and being the most vulnerable gets victimized in road accidents. Table 9indicates that most of the deaths of pedestrians/ cyclists/ MTW riders are due to impact with the bus followed by other impacts with other objects/ ground. This once again re-emphasizes that the possibility of physical contact between a running bus and a pedestrian needs to be reduced if not eliminated. However, a substantial percentage of deaths are due to the victim being run over by the bus. This brings to the fore the inadequate space for these NMV.
Key Mobility Challenges in Indian Cities
20 Discussion Paper 2011-18: Geetam Tiwari – ©OECD/ITF 2011
Table 8. Fatal accidents caused by city buses owned by state transport undertakings (STUs), 2005-06
S.No STU No. of Fatal Accidents
Fleet Held Fatal Accidents per 100 Buses
1 BEST (Mumbai) 35 3 391 1.03
2 AMTS (Ahmedabad) 11 521 2.11
3 BMTC (Bengaluru) 77 3 468 2.22
4 CSTC (Kolkata) 1 741 0.13
5 DTC (Delhi) 63 2 578 2.44
6 PMT (Pune) 15 845 1.77
7 MTC (Chennai) 121 2 773 4.36
Source: Based on figures published by CIRT, Pune.
Table 9. Categorization of fatal victims
Category of victims Impact Run over Total Gross Vehicle kms in 5
years (2003-07) in million kms
Probability of a fatal accident per million km
Auto-rickshaw 5 5 7 606 0.00127 Cyclist 16 16 32 654 0.0949 Four wheeler 8 8 11 028 0.0014 MTW 94 67 161 20 949 0.0149 Passenger 57 26 83 3 075 Pedestrian 75 32 107 Grand Total 255 141 396
Anecdotal evidence suggests that the space earmarked for pedestrians and cyclist has been declining constantly. Therefore it is necessary that a statutory intervention is made prescribing certain norms for allocation of space for the NMV.
Norms for the Safety of Vehicles
Improved safety features in vehicles could have a positive impact in reducing the severity of crashes. The last decade has seen substantial improvements in the internal safety features of personalized vehicles such as – air cushions, crumple zones, extra reinforcements etc. But the PT vehicles, especially the buses have witnessed very little improvement in their safety features. NUTP could have outlined a series of policy interventions that could reduce the fatalities and injuries in road crashes. It could have even laid down a road map for such interventions. Some of the interventions here include redefining Motor Vehicle Act 1989 that should specify the design of PT system (buses) as per the need of today and the technologies available.
4.1.2 Improvements in Intermediate Public Transport
Intermediate public transport (taxis, auto-rickshaws) operating in small and medium cities plays an important role in providing mobility at very low cost to a large section of the population. They have a potential of providing clean mobility, low emissions and improved safety if manufacturers are encouraged to invest in improving the technology of these vehicles. This would require setting up emission and safety standards for these vehicles under the Motor Vehicles Act. SIAM, MORTH, Ministry of Industry could together set up low interest loans for small scale industry producing these vehicles, and attractive replacement schemes for operators running these vehicles, in order to improve the efficiency of this fleet.
Key Mobility Challenges in Indian Cities
Discussion Paper 2011-18: Geetam Tiwari – ©OECD/ITF 2011 21
4.1.3 Speed Limits in Cities
Cities need smooth flowing traffic, which is facilitated not by increased speeds but by streamlining of traffic and increasing throughput. While it is well known that increased speeds leads to less safe roads, it has also come to light that greater speeds permit sprawl as people are willing to live farther away. This has a natural correlation to GHG emissions and therefore, the working group on transport is concerned about this aspect. There is a need to revisit laws related to speed limits in the country and the effectiveness of their enforcement mechanisms. There is also a need to review norms related to road-design, so that lanes and lane-widths are designed according to their function and location, and that speeds are largely controlled by design rather than by enforcement. This would, of course, also have the highly desirable co-benefit of bringing down the extremely high rate of fatalities and serious injuries1.
Given the administrative structures governing urban transport, Governments at the centre, state and city levels all have to undertake various policies, legal, institutional and fiscal interventions to achieve a shift towards sustainable low carbon urban transport systems. Some of the more important interventions implemented at national and state level in the recent past are discussed below:
4.2 National Level Policies
4.2.1 National Urban Housing and Habitat Policy (NUHHP)
Indian cities generally have intense mixed land use system and high density, which keeps trip lengths even in mega-cities quite short. Typically, the economically weaker section (EWS) of society lives (legally or illegally) very close to work opportunities, thus, contributing significantly to these short trip lengths. However, newly developed areas of cities are not as dense and mixed as the core areas and Wilbur Smith Associates predicts that average trip length may triple by 2031 in a do-nothing scenario. To prevent this, and thus enable a greater number of trips by non-motorized modes, it is necessary to ensure that mixed land-use dense urban development continue to be the norm. There is thus a need to upgrade and rehabilitate current informal settlements of EWS people, and ensure that all new developments have high mix land use and high density along with provision of affordable housing for EWS.
As per the NUHHP, 10 to 15% of land in every new public/private housing project or 20 to 25% of Floor Area Ratio (FAR)/Floor Space Index (FSI) whichever is greater, should be reserved for EWS housing through appropriate legal stipulations and spatial incentives. There is a need to check whether these norms are adequate, and if adequate whether they are being followed.
The following interventions are suggested:
1. The Central Government should set up an expert group to study the adequacy of these norms, and revise them if required.
2. The Government should also commission a multi-city study to check adherence to these norms, particularly in the newer developments. Central and state grants to cities should be conditional on cities adhering to these norms.
1. According to “Road Safety in India: Challenges and Opportunities” by D. Mohan, O. Tsimhoni, M. Sivak
and M. J. Flannagan, Transportation Research Institute, University of Michigan report of January 2009, India had 98 road fatalities and 1474 serious injuries per million persons.
Key Mobility Challenges in Indian Cities
22 Discussion Paper 2011-18: Geetam Tiwari – ©OECD/ITF 2011
4.2.2 National Urban Transport Policy (NUTP)
The Central Government has formulated the NUTP (2006) with a view to provide affordable, quick, comfortable, reliable and sustainable access for the growing number of city residents to jobs, education, recreation and such other needs. But, NUTP in its current form has some shortcomings that need to be addressed. In particular, the following changes are recommended:
1. It needs to address the issue of rationalizing taxation across different modes accounting for the externalities imposed by them. Currently, taxation on public transport systems is high compared to its impact on society (Tiwari and Kharola, 2008). Rationalizing the tax structure will provide a level playing field for different modes of transport and is also in line with the recommendations made by the Parliamentary Standing Committee on Urban Development2.
2. While the proposal for an Urban Metropolitan Transport Authority (UMTA) is welcome, the roles and responsibilities of UMTAs need to be defined clearly to ensure that it plays a constructive role in the planning, development and provision of transport infrastructure in a city.
3. Demand management is a critical element of improving the efficiency of a sector like transport, but NUTP does not deal with this aspect sufficiently. Innovative demand management – through urban planning and infrastructure management – can significantly reduce the need for supplying more transport services, and will automatically lower GHG emissions.
4. If public transport is accepted as a desirable public good in cities, alternative methods of financing public transport operations should be thought about, so as to make the system viable and still fair.
5. The policy must also clearly define the desired norms for non-motorized transport in the form of parameters by which to judge the quality and quantity of non-motorized transport infrastructure for cities of different sizes and characteristics.
6. A review and revamp of NUTP as suggested above combined with its effective usage through schemes such as JNNURM (see section 4.2.3) can significantly help to improve the patronage of public and non-motorized transport.
4.2.3 Jawaharlal Nehru National Urban Renewal Mission (JNNURM)
JNNURM was set up by the Government of India, and 63 cities were identified for urban renewal and reforms in phase I. JNNURM requires that all cities prepare a city development plan and all projects that are proposed are in tune with the city development plan. Moreover, JNNURM also requires that all proposed transport projects are compliant with NUTP. However, it is not clear that these conditions are being met and projects that are being funded promote public and non-motorized transport. Therefore there is a need to revamp JNNURM along the following lines:
2. Para 2.10 of the 37
th Urban Transport report of the Parliamentary Standing Committee on Urban
Development (submitted in Dec 2008) states that taxes and duties on public transport buses should be exempted and an equivalent amount should be recovered from personal vehicles whose numbers are much greater and therefore, the per-capita additional cost burden would be nominal.
Key Mobility Challenges in Indian Cities
Discussion Paper 2011-18: Geetam Tiwari – ©OECD/ITF 2011 23
All project proposals for funding under JNNURM must clearly state how they further the goals of NUTP.
Cities seeking funding must also be mandated to report (perhaps annually) key transportation related parameters such as modal shares, air quality, accident rates, fuel consumption etc. Subsequent JNNURM funding should be subject to certain improvements in these parameters. If no improvement is found in these parameters, the funding should be stopped and previously granted funds should be turned into loans to be repaid by the city. This will ensure that the cities have a strong incentive to improve their transport performance indices.
There is a strong need to improve the monitoring and verification mechanisms of JNNURM. An apex agency must be identified to deal with this aspect. This agency must be mandated to review and approve proposals for funding only if they are compliant with NUTP. Moreover, this agency should also review the progress reports submitted by the cities and be empowered to ask for an independent verification of the figures reported by cities, if necessary.
If the M&V agency asks for the verification of the report submitted by some city, the Centre must identify and fund an agency to carry out the necessary surveys in the appropriate city within, say, 3 months.
Non-motorized transport should form an important part of the norms for judging progress in cities. This is because cities in categories 1-4 (as defined in [WSA 2008], i.e. cities with population less than 4.0million) are the cities with significant non-motorized transport shares today and with the greatest potential for reduction of these shares. In mega cities like Delhi it has been shown that significant reduction in share of GHGs can be achieved only when conditions for NMT and PT(road based) becomes favorable (Woodcock et al., 2009).
4.2.4 The National Road Safety &Traffic Management Board Bill, 2010
The national government has drafted a bill to provide for the establishment of the National
Road Safety and Traffic Management Board for the purpose of orderly development, regulation,
promotion and optimization of modern and effective road safety and traffic management system and practices in relation to the national highways and improved safety standards in highway design, construction, operation and regulate high standards in production and maintenance of mechanically propelled vehicles.
There is no dedicated agency in India to deal with road safety issues. Though the Ministry of Road Transport and Highways is the administrative ministry responsible for road safety efforts in the country, it does not have the enforcement machinery of its own and other technical resources required to ensure better road safety activities. There are other bodies concerned for road safety issues which are the Transport Departments of the State Governments, automobile testing agencies, highway construction and maintenance agencies, etc. There is also a need to look into the issues as to whether the design, construction and maintenance standards of highways are being followed both by the Government and concessionaires. It is; therefore, felt that an integrated and dedicated statutory body is necessary to provide for continuity, expertise and credibility to combat the rising menace of road accidents and fatalities in the country (Department Related Parliamentary Standing Committee on Transport Tourism and Culture, 2010). The committee set up by the planning commission under the chairmanship of Mr S. Sundar has suggested the following functions for the NTSB:
Key Mobility Challenges in Indian Cities
24 Discussion Paper 2011-18: Geetam Tiwari – ©OECD/ITF 2011
The Board shall, inter alia, perform the following functions, namely:
1. In relation to the national highways, recommend minimum design, construction, operation and maintenance standards for the national highways; recommend minimum standards for establishing and operating trauma facilities and Para-medical facilities for dealing with traffic related injuries on the national highways; conduct or cause to be conducted safety audits to monitor compliance with the standards notified by the Central Government; make recommendations or issue guidelines relating to design, construction, operation and maintenance standards for the national highways.
2. In relation to mechanically propelled vehicles, recommend minimum safety requirements and standards for the design and manufacture of mechanically propelled vehicles; recommend minimum conditions for safe usage of mechanically propelled vehicles including specifying the maximum load bearing and capacity limits; conduct or cause to be conducted safety audits to monitor compliance with the standards notified by the Central Government; recommend standards for vehicular traffic on the national highways including the schemes for segregation of various classes of vehicles in separate speed lanes and their right of way.
3. Without prejudice to aforesaid, in relation to the national highways and mechanically propelled vehicles, establish procedures and centres for multidisciplinary crash investigation; make recommendations or issue guidelines relating to safety features for vehicles other than mechanically propelled vehicles and for safe operating conditions for such vehicles; promote relevant practices in road safety and traffic management, undertake road safety and traffic education programs, and conduct campaigns to create awareness amongst all sections of road users, children and students on matters relating to road safety; involve non-government organizations working in the area of road safety and traffic management, and assist them in promotion of efficient traffic management and road safety; provide for the special requirements for women, children, senior citizens, disabled persons and pedestrians relating to road safety and traffic management, and assist them in promotion of efficient traffic management and road safety; provide for the special requirements for women, children, senior citizens, disabled persons and pedestrians relating to road safety and traffic management; advice the Central Government in matters relating to or arising out of traffic management on the national highways and the mechanically propelled vehicles for the purposes of ensuring road safety; advice the Central Government on administration of the provisions relating to safety as contained in Chapters II, IV, V, VII, VIII and XIII of the Motor Vehicles Act, 1988 and the rules made there under.
4. The Central Government, in consultation with the National Highways Authority of India, would notify the standards relating to the national highways and mechanically propelled vehicles as recommended by the Board.
5. Creation of the National Road Safety and Traffic Management Fund for meeting the expenses of the Board wherein the one per cent of the revenue from the cess on diesel and gasoline allocated under section 10 of the Central Road Fund Act, 2000 for national highways and rail and road over bridges shall be credited.
6. The provision for penalty of 1 million rupees for failing to maintain the standards referred to in the sub-paragraph (ii) above.
7. The bill has not been tabled for discussion in the parliament yet.
Key Mobility Challenges in Indian Cities
Discussion Paper 2011-18: Geetam Tiwari – ©OECD/ITF 2011 25
4.3 State Level Policy Intervention
4.3.1 State Urban Transport Policy (SUTP):
NUTP is a policy that has been framed at the national level. It is not a rule or law that can be enforced. As per the Constitution of India provision of transport infrastructure and services is a state matter and the central or national government does not have much say in it. Hence, the real actions taken up in the sector are the sole responsibility of the states. To achieve the goals and objectives of NUTP by the suggested strategies it is required to evolve a State level transport policy similar to the NUTP. Once this has been done the next step would be to carry out a gap analysis between the policy statement and the existing policy regime. This would have to be followed by necessary changes in the laws and regulations to bring them in consonance with the stated policies. The Union Government should persuade the State Governments to bring about the required changes. It should leverage the financial assistance that gives under various schemes for urban development, to encourage the State Governments to amend the policy regime. The State Governments should in turn persuade the municipal agencies to bring about the required changes.
4.3.2 State Road Safety &Traffic Management Board
The National Road Safety &Traffic Management Board can address vehicles standards, roads standards for highways, however city road standards, data management systems at city and state levels and notification of various safety laws is the responsibility of state authorities. State Road Safety and Traffic Management Boards can be set to ensure smooth functioning between the National policies and state policies. This could be on the same lines as Central pollution Control Board at the national government level and State Pollution Control Board at the state level for implementing pollution norms.
4.4 City Level Policy Interventions
Policy opportunities are also emerging in cities as increasingly stronger clean air action and mobility action are being mandated for city action plans. Therefore, under NUTP cities have been asked to develop Comprehensive Mobility Plan (CMP). Under the aegis of the Supreme Court and the Ministry of Environment and Forests cities are developing Clean Air Action Plans. Now following the declaration of the National Climate Action Plan some state governments are also developing climate action plans.
This is an important opportunity to make significant policy shifts in cities especially, as decision making related to mobility and air quality largely rests with the state governments. Cities are at different level of progress in India. Relatively more advanced action has been initiated in a few metro cities largely in response to early judicial interventions, public campaigns and proactive executive action. The key metro cities enjoy tighter emissions standards than the rest of the country for instance. City action plans have begun to evolve in these cities. Even though the two-step approach helps to address pollution and congestion hotspots on a priority basis, it fails to prevent proliferation of more hotspots. This means stringent mitigation plans and preventive strategies will have to be in place for all types of cities in India.
Safety and environment pollution both local and global is a result of modal shares, kilometers travelled and vehicle and fuel technologies. Woodcock et al (2009) show that unless investments are directed towards creating safe infrastructure for bicyclists, pedestrians and buses, major reduction in CO2, traffic crashes and other health co-benefits cannot be achieved. Expansion of metro systems and improved technologies of buses and vehicles make a marginal

Key Mobility Challenges in Indian Cities
26 Discussion Paper 2011-18: Geetam Tiwari – ©OECD/ITF 2011
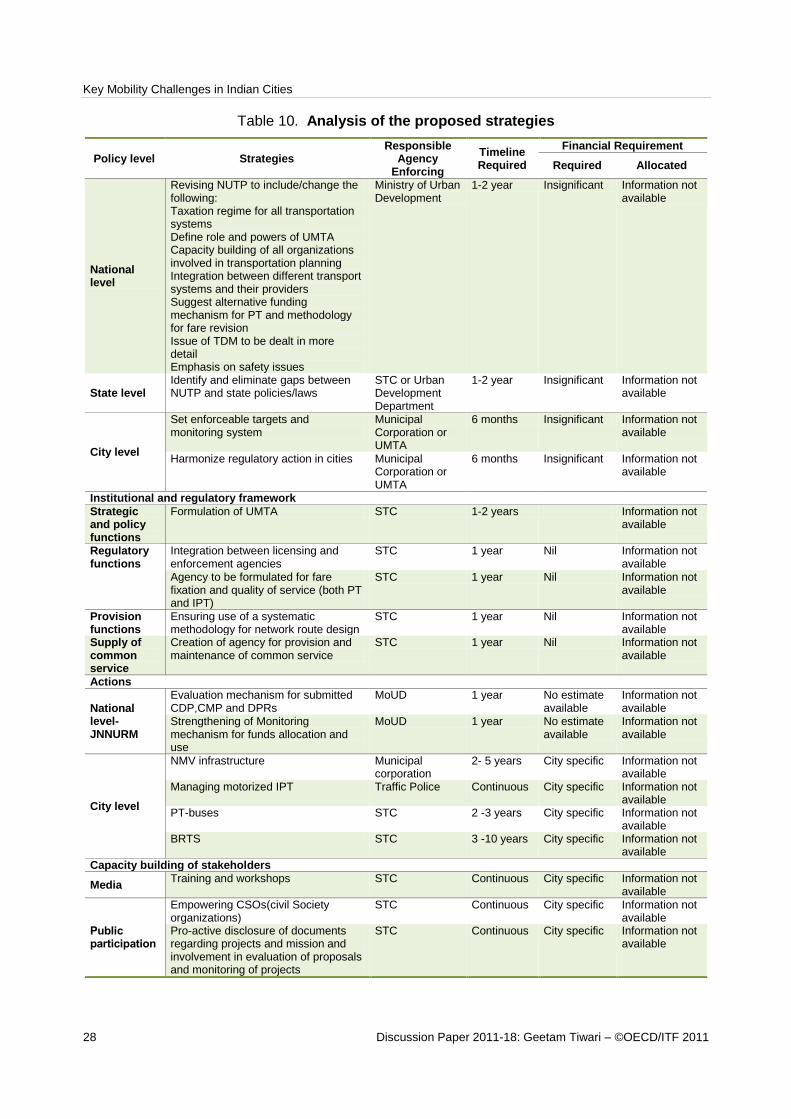
difference. Level of interventions in different city sizes may vary, however, improving walking, and bicycling infrastructure remains the focus for all cities. Table 10 presents summary of required interventions.
At present, car-based mobility solutions disproportionately dominate transport agendas and investments in Indian cities, mocking statements, intentions and policy goals on sustainability, resource management and social inclusion. When they are put forward, sustainable transport proposals are centered around capital-intensive systems like heavy rail, which may not have an extensive catchment area yet require enormous funding streams. The transport modes used by the majority of people in these cities – mainly walking, cycling and microbuses – receive far less attention.
5. CONCLUDING REMARKS
The existing modal share in Indian cities is in favor of Non-motorized transport (NMT) and public transport. However given the hostile conditions for public transport and increasing risk to pedestrians and cyclists, the use of personal motorized vehicle is increasing. This trend is accompanied with the rise in traffic crashes and deteriorating air quality in cities.
Interventions at National, State and city level are required to achieve the targets for safe and accessible transport meeting the goals of low carbon growth. This requires that the focus must be as following:
NMV, and public transport users to be given priority.
Safe speed limits through design (50 km/h on arterial, 30km/h other, 15km/h special zones).
Segregated facilities for NMV on all arterial roads.
Traffic calming for speed management.
5.1 Activities Suggested for Implementing Agencies: Ministry of Urban Development, State PWD, Urban development Authorities, City Municipalities)
1. All road design standards to be reviewed in 2 years.
2. All traffic management standards to be reviewed in 2 years.
3. Audit of hazardous locations should be taken up on a priority basis.
4. Crash data base on standard format to be made available within 2 years.
5. Segregated NMV lanes to be constructed on all arterial roads (10% road length every year, 100% to be covered in 10 yrs).
6. Capacity building of city engineers, town planners, safety auditor, traffic police (every year).

Key Mobility Challenges in Indian Cities
Discussion Paper 2011-18: Geetam Tiwari – ©OECD/ITF 2011 27
5.1.1 All Road Design Standards to be Reviewed (2 yrs)
Ministry of Urban development has established 4 Centers of excellence. In the first two years these centers should be asked to review all urban road standards, and urban traffic management policies in the context of VRU safety. This would require an investment of Rs. 50 million in the first two years. At least 6 more COEs should be set up to expand this activity by 2020. This would require an investment of Rs. 60 0 million by 2020.
5.1.2 Audit of Hazardous Locations (yr 1-10)
City development authorities or municipalities should setup a separate safety cell with dedicated personnel and budget (at least Rs. 100 million/year). Following activities should be taken up by the safety cell.
Select some 5 or 10 most hazardous roads/locations/intersections every year on the basis of accident records in each city/state/district.
Get road safety audit done for these locations.
Apply recommendations as provided by safety auditors.
Monitor the effectiveness of countermeasures.
Safety cell should be established in four metro city (Delhi, Mumbai, Chennai, Kolkata) in the first year. This should be followed with at least 4 cities having more than a million population) under JNNURM every year, targeting at least 35 cities by 2020.
5.1.3 Crash Data Base on Standard Format (1 yr)
City level crash data is being collected by the police. Safety cell can assist police to computerize crash data base in a standard format. Safety cell should also conduct detailed crash investigation of sample crashes and measure effectiveness of various measures implemented by traffic police.
5.1.4 Segregated NMV Lanes:
Segregated NMV lanes should be constructed on all arterial roads ( 10% road length every year, 100% to be covered in 10 yrs). This should become mandatory especially for availing any central assistance. This can be monitored by the safety cell.
5.1.5 Capacity Building City Engineers, Town Planners, Safety Auditor, Traffic Police (every year):
Minimum 5 officers must be trained for road safety in each million plus city every year. Training programs initiated by the MOUD must include special programs for traffic safety.
Key Mobility Challenges in Indian Cities
28 Discussion Paper 2011-18: Geetam Tiwari – ©OECD/ITF 2011
Table 10. Analysis of the proposed strategies
Policy level Strategies Responsible
Agency Enforcing
Timeline Required
Financial Requirement
Required Allocated
National level
Revising NUTP to include/change the following: Taxation regime for all transportation systems Define role and powers of UMTA Capacity building of all organizations involved in transportation planning Integration between different transport systems and their providers Suggest alternative funding mechanism for PT and methodology for fare revision Issue of TDM to be dealt in more detail Emphasis on safety issues
Ministry of Urban Development
1-2 year Insignificant Information not available
State level Identify and eliminate gaps between NUTP and state policies/laws
STC or Urban Development Department
1-2 year Insignificant Information not available
City level
Set enforceable targets and monitoring system
Municipal Corporation or UMTA
6 months Insignificant Information not available
Harmonize regulatory action in cities Municipal Corporation or UMTA
6 months Insignificant Information not available
Institutional and regulatory framework
Strategic and policy functions
Formulation of UMTA STC 1-2 years Information not available
Regulatory functions
Integration between licensing and enforcement agencies
STC 1 year Nil Information not available
Agency to be formulated for fare fixation and quality of service (both PT and IPT)
STC 1 year Nil Information not available
Provision functions
Ensuring use of a systematic methodology for network route design
STC 1 year Nil Information not available
Supply of common service
Creation of agency for provision and maintenance of common service
STC 1 year Nil Information not available
Actions
National level-JNNURM
Evaluation mechanism for submitted CDP,CMP and DPRs
MoUD 1 year No estimate available
Information not available
Strengthening of Monitoring mechanism for funds allocation and use
MoUD 1 year No estimate available
Information not available
City level
NMV infrastructure Municipal corporation
2- 5 years City specific Information not available
Managing motorized IPT Traffic Police Continuous City specific Information not available
PT-buses STC 2 -3 years City specific Information not available
BRTS STC 3 -10 years City specific Information not available
Capacity building of stakeholders
Media Training and workshops STC Continuous City specific Information not
available
Public participation
Empowering CSOs(civil Society organizations)
STC Continuous City specific Information not available
Pro-active disclosure of documents regarding projects and mission and involvement in evaluation of proposals and monitoring of projects
STC Continuous City specific Information not available
Key Mobility Challenges in Indian Cities
Discussion Paper 2011-18: Geetam Tiwari – ©OECD/ITF 2011 29
REFERENCES
Broughton, J., (2008). "Car Driver Casualty Rates in Great Britain by Type of Car." Accident Analysis & Prevention, 40, 1543-1552.
Census of India, (2001), "Metadata and Brief Highlights on Slum Population ." Government Of India.
CSE. "Fuel economy standards for cars a step in the right direction: CSE ." from http://www.cseindia.org/node/65, accessed on 3-31-2011 Center for Science and Environment, New Delhi.
Demirel, H. et al., (2008). "Exploring impacts of road transportation on environment: a spatial approach." Desalination, 226, (1-3) 279-288.
Department Related Parliamentary Standing Committee on Transport Tourism and Culture, (2010), "One Hundred Sixtieth Report on The National Road Safety and Traffic Management Board Bill." Rajya Sabha Secretariat, New Delhi, 160.
du Can, S. d. l. R., Letschert, V., McNeil, M., Zhou, N., & Sathaye, J., (2009), "Residential and Transport Energy Use in India: Past Trend and Future Outlook." Lawrence Berkeley National Laboratory, University of California, LBNL-1753E.
FARS. "Fatatlity Analysis Reporting System Encyclopedia." from http://www-fars.nhtsa.dot.gov, accessed on 5-8-2008 National Highway Traffic Safety Administration.
Grazi, F. & van den Bergh, J.C.J.M., (2008). "Spatial organization, transport, and climate change: Comparing instruments of spatial planning and policy." Ecological Economics, 67, (4) 630-639.
Gururaj, G., (2006). Road traffic injury prevention in India Bangalore, National Institute of Mental Health and Neuro Sciences.
Koornstra, M.J., (2007). "Prediction of traffic fatalities and prospects for mobility becoming sustainable-safe." Sadhana, 32, (4) 365-395
Kundu, A., (2003). "Urbanisation and Urban Governance." Economic and Political Weekly, 44, (48).
McKinsey & Company, (2009), "Environmental and energy sustainability: An approach for India.
McManus, W., (2007), "The economics of road safety: An international perspective." The University of Michigan, Transportation Research Institute, Michigan, UMTRI-2007-23.
Ministry of petroleum and natural gas, (2009), "Basic statistics on Indian petroleum and natural gas: 2008-2009." Government of India.
Mohan, D., Simhoni, O. T., Sivak, M., & Flannagan, M. J., (2009), "Road safety in India: challeneges and oppurtunuties." The University of Michigan, Transportation Research Institute, Michigan, UMTRI-2009-1.
Key Mobility Challenges in Indian Cities
30 Discussion Paper 2011-18: Geetam Tiwari – ©OECD/ITF 2011
Mohan, D. & Tiwari, G., (2000). "Mobility, Environment and Saferty in Megacities: Dealing with a Complex Future." IATSS Research, 24, (1) 39-46.
MORTH. "Road Accident Statistics of India: 1970-2004." from http://morth.nic.in/writereaddata/sublinkimages/table-86816824487.htm, accessed on 8-19-2010.
Mukherjee, S. et al., (2007). "Three-wheeled scooter taxi: A safety analysis." Sadhana, 32, (4) 459-478.
NCRB, (2007), "Accidental Deaths and Suicides in India - 2006." Ministry of Home Affairs, National Crime Records Bureau, New Delhi.
Peden, M., Scurfield, R., Sleet, D., Mohan, D., Hyder, A. A., Jarawan, E., & Colin, M., (2004), "World report on road traffic injury prevention: Summary." World Health Organization, Geneva.
Thynell, M. et al., (2010). "Sustainable transport and the modernisation of urban transport in Delhi and Stockholm." Cities, 27, (6) 421-429 available from: http://www.sciencedirect.com/science/article/B6V9W-50NH0D7-1/2/b83ec1251d9eff4e938885583304e8f9.
Tiwari, G., (1996). "The Indian Transportation Paradigm," In World Resources : A Guide to the Global Environment, NewYork: Oxford University Press, pp. 90-91.
Tiwari, G., (2002). "Urban Transport Priorities: Meeting the Challenge of Socio-economic Diversity in Cities, a Case Study of Delhi, India." Cities, 19, (2) 95-103 available from: http://www.sciencedirect.com/science/article/B6V9W-452WB3H-6/2/f17ee276b67b9e8ae0fe64ac154b7a3a.
Tiwari, G. & Jain, H., (2008). "Bicylces in urban India." IUT Journal, 7, (2) 70-83.
Tiwari, G. & Kharola, P.S., (2008). "Urban public transport systems: Are the taxation policies congenial for their survival and growth?" Economic and Political Weekly, 43, (41) 41-47.
U.S.Census Bureau. "Table 2: Annual estimates of the population by sex and selected age groups for the United States: April 1, 2000 to July 1, 2007." from http://www.census.gov/popest/national/asrh/NC-EST2007-sa.html, accessed on 5-8-2008.
Wilbur Smith Associates, (2008), "Study on traffic and transportation: policies and strategies in urban areas in India." Ministry of Urban Development.
Wilson, D. & Stupnytska, A., (2007). "The N-11: More Than an Acronym." Global Economics Paper (153).
Wood, D. P. & Simms, C. K. "Two Car Frontal Collisions: The Role of Car Mass, Collision Speed Distribution and Frontal Stiffness.", In IRCOBI Conference, pp. 85-96.
Woodcock, J. et al., (2009). "Public health benefits of strategies to reduce greenhouse-gas emissions: urban land transport." Health and Climate Change, 2.

International Transport Forum2 rue André Pascal 75775 Paris Cedex [email protected]