Kenneth H. Cooper, M.D., M.P.H. Founder & Chairman The Cooper Aerobics Center 12200 Preston Road...
34
Kenneth H. Cooper, M.D., M.P.H. Kenneth H. Cooper, M.D., M.P.H. Founder & Chairman Founder & Chairman The Cooper Aerobics Center The Cooper Aerobics Center 12200 Preston Road 12200 Preston Road Dallas, Texas Dallas, Texas Aerobics: Aerobics: Past. Present. Future. Past. Present. Future.
-
Upload
arron-montgomery -
Category
Documents
-
view
216 -
download
0
Transcript of Kenneth H. Cooper, M.D., M.P.H. Founder & Chairman The Cooper Aerobics Center 12200 Preston Road...

Kenneth H. Cooper, M.D., M.P.H.Kenneth H. Cooper, M.D., M.P.H.Founder & Chairman Founder & Chairman
The Cooper Aerobics CenterThe Cooper Aerobics Center12200 Preston Road12200 Preston Road
Dallas, TexasDallas, Texas
Kenneth H. Cooper, M.D., M.P.H.Kenneth H. Cooper, M.D., M.P.H.Founder & Chairman Founder & Chairman
The Cooper Aerobics CenterThe Cooper Aerobics Center12200 Preston Road12200 Preston Road
Dallas, TexasDallas, Texas
Aerobics:Aerobics:Past. Present. Future.Past. Present. Future.
Aerobics:Aerobics:Past. Present. Future.Past. Present. Future.


American Adult Exercise Habits 1968-2008American Adult Exercise Habits 1968-2008American Adult Exercise Habits 1968-2008American Adult Exercise Habits 1968-2008
ExercisingExercisingExercisingExercising19681968
< 24 %< 24 %19681968
< 24 %< 24 %1984198459 %59 %1984198459 %59 %
1990199040 %40 %1990199040 %40 %
JoggingJoggingJoggingJogging < 100,000< 100,000< 100,000< 100,000 34 million34 million34 million34 million 30 million30 million30 million30 million
48 % 48 % CVD CVD
Russia: Russia: 31 %31 %
Poland: Poland: 36 %36 %
Hungary: Hungary: 40 %40 %
Romania: Romania: 60 %60 %

American Adult Exercise Habits 1968-1990American Adult Exercise Habits 1968-1990American Adult Exercise Habits 1968-1990American Adult Exercise Habits 1968-1990
1968 - 19901968 - 19901968 - 19901968 - 1990Medical TreatmentMedical Treatment
33 %33 %Medical TreatmentMedical Treatment
33 %33 %Lifestyle ChangeLifestyle Change
67 %67 %Lifestyle ChangeLifestyle Change
67 %67 %
Cigarette SmokingCigarette Smoking
Blood Pressure ControlBlood Pressure Control
Cholesterol ReductionCholesterol Reduction
Stress ManagementStress Management
Increased ActivityIncreased Activity
CV DeathsCV Deaths 48 % 48 %
CV DeathsCV Deaths 48 % 48 %


Annual Deaths Related to Tobacco UsageAnnual Deaths Related to Tobacco UsageUnited Nations Agency (Feb 2010)United Nations Agency (Feb 2010)
Annual Deaths Related to Tobacco UsageAnnual Deaths Related to Tobacco UsageUnited Nations Agency (Feb 2010)United Nations Agency (Feb 2010)
5 Million5 Million Cardiovascular DiseaseCardiovascular Disease
CancerCancerDiabetesDiabetesOther Chronic DiseasesOther Chronic Diseases
600,000600,000 Secondhand SmokeSecondhand Smoke
5 Million5 Million Cardiovascular DiseaseCardiovascular Disease
CancerCancerDiabetesDiabetesOther Chronic DiseasesOther Chronic Diseases
600,000600,000 Secondhand SmokeSecondhand Smoke

Smoking FrequencySmoking Frequency(WHO Feb 2010)(WHO Feb 2010)
Smoking FrequencySmoking Frequency(WHO Feb 2010)(WHO Feb 2010)
ChinaChina 31.4% (Men 57.4%)31.4% (Men 57.4%)
IndiaIndia 33.9% (Men 57.0%)33.9% (Men 57.0%)
United StatesUnited States 19.8%*19.8%*
ChinaChina 31.4% (Men 57.4%)31.4% (Men 57.4%)
IndiaIndia 33.9% (Men 57.0%)33.9% (Men 57.0%)
United StatesUnited States 19.8%*19.8%*
**Cost: $196 million/yr in medical costs and productivityCost: $196 million/yr in medical costs and productivity

American Adult Exercise Habits 1968-1990American Adult Exercise Habits 1968-1990American Adult Exercise Habits 1968-1990American Adult Exercise Habits 1968-1990
1968 - 19901968 - 19901968 - 19901968 - 1990Medical TreatmentMedical Treatment
33 %33 %Medical TreatmentMedical Treatment
33 %33 %Lifestyle ChangeLifestyle Change
67 %67 %Lifestyle ChangeLifestyle Change
67 %67 %
Cigarette SmokingCigarette Smoking
Blood Pressure ControlBlood Pressure Control
Cholesterol ReductionCholesterol Reduction
Stress ManagementStress Management
Increased ActivityIncreased Activity
CV DeathsCV Deaths 48 % 48 %
CV DeathsCV Deaths 48 % 48 %

Source: JAMA, Mar 10, 2004, Vol. 291, No. 10.
Actual Causes of Death 1990
Tobacco
400
Diet/E
xerc
ise
300
Alcohol
100
Infe
ctio
n
90
GunsSex
M. V
eh.*
Drugs
20
050
100150200250300350400450
De
ath
s (1
000
's)
DrugsDiet/ExerciseAlcoholInfection
TobaccoSex RelatedMotor VehiclesGuns
35 3047
435
365
7529 20
4385
17
*Alcohol-related deaths:1990 – 22,0842000 – 16,653
/2000

Body Mass IndexBody Mass Index
130 130
65 ÷ 6565 ÷ 65 x 703 = 21.7 BMIx 703 = 21.7 BMI
165 165
65 ÷ 6565 ÷ 65 x 703 = 27.5 BMIx 703 = 27.5 BMI
ExamplesExamples
Range BMIRange BMI < 25< 25 NormalNormal25 – 3025 – 30 Overweight (66 %)Overweight (66 %)
> 30> 30 Obese (34 %)Obese (34 %)
BMI =BMI =(Weight in kilograms )(Weight in kilograms )
(Height in meters squared)(Height in meters squared)

Obesity Trends* Among U.S. AdultsBRFSS, 1990
(*BMI ≥30, or ~ 30 lbs overweight for 5’ 4” woman)
No Data <10% 10%–14%


Diabetes Trends* Among Adults in the U.S.,(Includes Gestational Diabetes)
2007
Source: CDC’s Division of Diabetes Translation. National Diabetes Surveillance System availableat http://www.cdc.gov/diabetes/statistics
No Data <4.5% 4.5-5.9% 6.0-7.4% 7.5-8.9% >9.0%

Source: “Mending Broken Hearts,” National Geographic, Feb. 2007

Price-Adjusted Per-Capita Medicare Spending

Percentages of Overweight or Obese Youth Aged Percentages of Overweight or Obese Youth Aged 10-17 Years in 200710-17 Years in 2007
Source: Source: Child and Adolescent Health Measurement Initiative: 2007 National Survey of Children's Health

Worldwide Obesity 2010Worldwide Obesity 2010Worldwide Obesity 2010Worldwide Obesity 2010
HighestHighest
CountryCountry WomenWomen MenMen
United StatesUnited States 36%36% 32%32%
MexicoMexico 35%35% 24%24%
ChileChile 32%32% 19%19%
LowestLowest
CountryCountry WomenWomen MenMen
JapanJapan 3%3% 3%3%
KoreaKorea 4%4% 4%4%
SwitzerlandSwitzerland 8%8% 9%9%
Source: Organization for Economic Cooperation and Development data on OBCD member countriesSource: Organization for Economic Cooperation and Development data on OBCD member countries

Source: George Washington University, 2010
The Annual Cost of Excess Body WeightThe Annual Cost of Excess Body Weight(Sick Days, Productivity, Fuel)(Sick Days, Productivity, Fuel)
Obese (> 30 BMI)Obese (> 30 BMI)
WomenWomen $4,879$4,879
MenMen $2,646$2,646
Overweight (25-30 BMI)Overweight (25-30 BMI)
WomenWomen $524$524
MenMen $432$432

Proportion of Overweight ChildrenProportion of Overweight Childrenin the United Statesin the United States
Proportion of Overweight ChildrenProportion of Overweight Childrenin the United Statesin the United States
4.2%6.5%
15.3%
4.6% 5%
15.5%
0%
5%
10%
15%
20%
6-12-year-olds 12-19-year-olds
1963-1970 1976-1980 1999-2000 2000-2004
Source: Centers for Disease Control and Prevention, 2003.
18.8%

•• 1 out of 3 children will develop diabetes (higher in 1 out of 3 children will develop diabetes (higher in Hispanics and African-Americans)Hispanics and African-Americans)•• 1 out of 3 children will develop diabetes (higher in 1 out of 3 children will develop diabetes (higher in Hispanics and African-Americans)Hispanics and African-Americans)
There is an epidemic of adult-onset diabetes being There is an epidemic of adult-onset diabetes being seen in children. It is estimated that among children seen in children. It is estimated that among children born after the year 2000:born after the year 2000:
There is an epidemic of adult-onset diabetes being There is an epidemic of adult-onset diabetes being seen in children. It is estimated that among children seen in children. It is estimated that among children born after the year 2000:born after the year 2000:
If they develop adult-onset diabetes before 14 years of If they develop adult-onset diabetes before 14 years of age, it is estimated that that will shorten their lifespan age, it is estimated that that will shorten their lifespan by 17 to 27 years. As a result, this may be the first by 17 to 27 years. As a result, this may be the first generation in which parents live longer than their generation in which parents live longer than their children.children.
If they develop adult-onset diabetes before 14 years of If they develop adult-onset diabetes before 14 years of age, it is estimated that that will shorten their lifespan age, it is estimated that that will shorten their lifespan by 17 to 27 years. As a result, this may be the first by 17 to 27 years. As a result, this may be the first generation in which parents live longer than their generation in which parents live longer than their children.children.

The Cooper InstituteThe Cooper InstituteThe Cooper InstituteThe Cooper Institute Cooper ClinicCooper ClinicDallas & Craig RanchDallas & Craig Ranch
Cooper ClinicCooper ClinicDallas & Craig RanchDallas & Craig Ranch
Cooper FitnessCooper Fitness Center & Spa Center & Spa
Dallas & Dallas & Craig RanchCraig Ranch
Cooper FitnessCooper Fitness Center & Spa Center & Spa
Dallas & Dallas & Craig RanchCraig Ranch
The Guest LodgeThe Guest LodgeThe Guest LodgeThe Guest Lodge
Cooper Wellness ProgramCooper Wellness ProgramCooper Wellness ProgramCooper Wellness Program
Cooper VenturesCooper Ventures
Cooper Concepts
CooperBenefits
CooperLife
Cooper Weight Loss


0 2 4 6 8 10 12 14 16 18 20 22 24 26
2
6
10
14
1
8
22BALKE BALKE
PROTOCOLPROTOCOL
At 25:00 min speed
Increases 0.2 mph/per min
Calculated 3.3 mph Speed
Minutes
Gra
de
(%
)

Definitions Of Fitness CategoriesDefinitions Of Fitness CategoriesFor MalesFor Males
Definitions Of Fitness CategoriesDefinitions Of Fitness CategoriesFor MalesFor Males
Fitness Category*
<30 30 - 39 40 - 49 50-59
Very Poor <14:59 <13:59 <12:29 <10:02
Poor 15:00-18:06 14:00 – 16:59 12:30 15:29 10:03 – 12:59
Fair 18:07 – 22:05 17:00 – 20:59 15:30 – 19:59 13:00 – 16:59
Good 22:06 – 26:00 21:00 – 24:42 20:000 – 23:13 17:00 20:29
Excellent 26:01 – 28:59 24:43 – 27:09 23:14 – 26:15 20:30 – 23:59
Superior 29:00+ 27:10+ 26:16+ 24:00+
*Based on the Cooper Clinicmodified Balke treadmillprotocol

FitnessCategory*
<30 30-39 40-49 50-59
Very Poor <10:29 <9:29 <7:59 <6:14
Poor 10:30 – 13:15 9:30 – 11:59 8:00 – 10:29 6:15 – 8:29
Fair 13:16 – 17:27 12:00 – 15:20 10:30 – 13:59 8:30 – 11:20
Good 17:28 – 20:59 15:21 – 18:59 14:00 –16:59 11:21-- 14:03
Excellent 21:00 –24:18 19:00 – 21:59 17:00 – 20:09 14:04 – 17:00
Superior 24:19+ 22:00+ 20:10+ 17:01+
*Based on the Cooper Clinic modified Balke treadmill protocol
Definitions Of Fitness CategoriesDefinitions Of Fitness CategoriesFor FemalesFor Females
Definitions Of Fitness CategoriesDefinitions Of Fitness CategoriesFor FemalesFor Females


Age-Adjusted All-Cause MortalityAge-Adjusted All-Cause Mortalityby Fitness Groups, Menby Fitness Groups, Men
Age-Adjusted All-Cause MortalityAge-Adjusted All-Cause Mortalityby Fitness Groups, Menby Fitness Groups, Men
0
10
20
30
40
50
60
70
Low 2 3 4 High0
10
20
30
40
50
60
70
Low 2 3 4 High
Ag
e-A
dju
ste
d A
ll-C
au
se
Ag
e-A
dju
ste
d A
ll-C
au
se
Mo
rta
lity
Mo
rta
lity /
10,0
00
/10
,000
P
YP
Y
Ag
e-A
dju
ste
d A
ll-C
au
se
Ag
e-A
dju
ste
d A
ll-C
au
se
Mo
rta
lity
Mo
rta
lity /
10,0
00
/10
,000
P
YP
Y
Fitness GroupsFitness GroupsFitness GroupsFitness Groups

Fitness and All-Cause Mortality, MenFitness and All-Cause Mortality, MenFitness and All-Cause Mortality, MenFitness and All-Cause Mortality, Men
0
10
20
30
40
50
60
70
0
10
20
30
40
50
60
70
Ag
e-A
dju
ste
d A
ll-C
au
se
Ag
e-A
dju
ste
d A
ll-C
au
se
Mo
rta
lity/
Mo
rta
lity/
10,
00
0 P
Y1
0,0
00
PY
Ag
e-A
dju
ste
d A
ll-C
au
se
Ag
e-A
dju
ste
d A
ll-C
au
se
Mo
rta
lity/
Mo
rta
lity/
10,
00
0 P
Y1
0,0
00
PY
Very PoorVery PoorVery PoorVery Poor PoorPoorFairFair
PoorPoorFairFair
GoodGoodExcellent/SuperiorExcellent/Superior
GoodGoodExcellent/SuperiorExcellent/Superior
UnfitUnfit
FitFit
Health & Longevity Fitness
Aerobic Fitness

Exercising and AgingExercising and AgingExercising and AgingExercising and Aging
Telomeres are protective tips on bundles Telomeres are protective tips on bundles of genes inside cellsof genes inside cells
Every time a cell divides, telomeres get Every time a cell divides, telomeres get shortershorter
Aging occurs as cells reach the end of the Aging occurs as cells reach the end of the telomere and die telomere and die ── muscle weakens, skin muscle weakens, skin wrinkles, and thinking cloudswrinkles, and thinking clouds
Arch of Int Med, Jan 28, 2008

Exercise and AgingExercise and AgingExercise and AgingExercise and Aging
• 2,401 British Twins2,401 British Twins
Long-term study, length of telomeres measuredLong-term study, length of telomeres measured
• 2,401 British Twins2,401 British Twins
Long-term study, length of telomeres measuredLong-term study, length of telomeres measured
Arch of Int Med, Jan 28, 2008
ExerciseExercise(min/wk)(min/wk)
Reduction in AgeReduction in Age(years)(years)
16:0016:00 BaselineBaseline
100:00100:00 5.0 - 6.05.0 - 6.0
180:00180:00 9.09.0
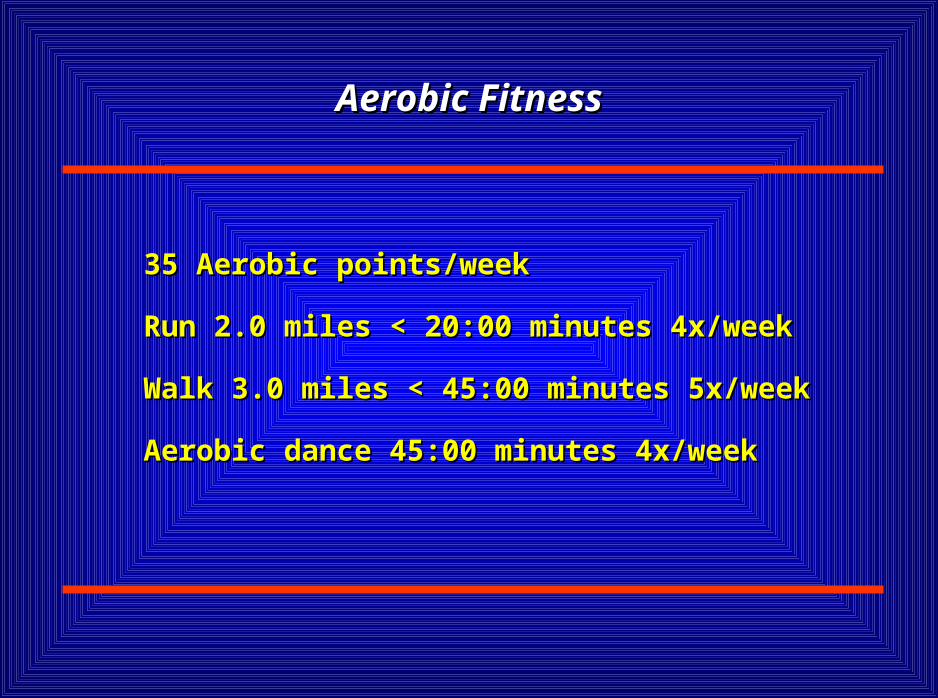
Aerobic FitnessAerobic Fitness
35 Aerobic points/week35 Aerobic points/week
Run 2.0 miles < 20:00 minutes 4x/weekRun 2.0 miles < 20:00 minutes 4x/week
Walk 3.0 miles < 45:00 minutes 5x/weekWalk 3.0 miles < 45:00 minutes 5x/week
Aerobic dance 45:00 minutes 4x/weekAerobic dance 45:00 minutes 4x/week

Health and Longevity FitnessHealth and Longevity Fitness
15 aerobic points /week15 aerobic points /week
Walk 2.0 miles < 30:00 minutes 3x/weekWalk 2.0 miles < 30:00 minutes 3x/week
Walk 2.0 miles < 35:00 minutes 4x/weekWalk 2.0 miles < 35:00 minutes 4x/week
Walk 2.0 miles < 40:00 minutes 5x/weekWalk 2.0 miles < 40:00 minutes 5x/week
Walk 3.0 miles < 45:00 minutes 2x/weekWalk 3.0 miles < 45:00 minutes 2x/week
Aerobic dance 45:00 minutes 2x/weekAerobic dance 45:00 minutes 2x/week


![[FITNESS] the New Aerobics - Dr. Kenneth Cooper](https://static.fdocuments.us/doc/165x107/563dbb78550346aa9aad767e/fitness-the-new-aerobics-dr-kenneth-cooper.jpg)