Keep the Kids Inside: Juvenile Curfews and Urban Gun Violence
23
Keep the Kids Inside: Juvenile Curfews and Urban Gun Violence Jillian B. Carr * and Jennifer L. Doleac † First draft: August 2014 Current draft: September 2015 We thank Mark Anderson, Bill Gale, Sara Heller, Mark Hoekstra, Jonathan Meer, Emily Owens, John Pepper, Ariell Reshef, Josh Teitelbaum, and Carly Urban for helpful comments. We also thank seminar participants at UVA Batten, UVA Law, Georgetown Law, Montana State University, and Purdue University; and conference participants at the Midwest Economics Association annual meeting and the IRP Summer Research Workshop. * Department of Economics, Krannert School of Management, Purdue University, [email protected] † Batten School of Leadership and Public Policy, University of Virginia, [email protected] 1
Transcript of Keep the Kids Inside: Juvenile Curfews and Urban Gun Violence

Keep the Kids Inside:
Juvenile Curfews and Urban Gun Violence
Jillian B. Carr∗and Jennifer L. Doleac†
First draft: August 2014
Current draft: September 2015
We thank Mark Anderson, Bill Gale, Sara Heller, Mark Hoekstra, Jonathan Meer, Emily Owens, John Pepper, AriellReshef, Josh Teitelbaum, and Carly Urban for helpful comments. We also thank seminar participants at UVA Batten, UVALaw, Georgetown Law, Montana State University, and Purdue University; and conference participants at the Midwest EconomicsAssociation annual meeting and the IRP Summer Research Workshop.∗Department of Economics, Krannert School of Management, Purdue University, [email protected]†Batten School of Leadership and Public Policy, University of Virginia, [email protected]
1

Abstract
Gun violence is an important problem across the United States. Due to limited data, it has been
difficult to convincingly test the impacts of government policies on the quantity and geography of gunfire.
This paper uses a new source of data on gunfire incidents, which does not suffer from selective under-
reporting common in other crime datasets, to measure the effects of juvenile curfews in Washington,
DC. Juvenile curfews are a common, but extremely controversial, policy used in cities across the United
States. Their goal is to reduce violent crime by keeping would-be offenders and victims indoors, but their
net effect on public safety is ambiguous for several reasons. They might also increase distrust between law
enforcement and city residents, so it is important to understand whether they are cost-effective. We use
exogenous variation in the hours affected by the DC curfew, in regression discontinuity and difference-
in-RD frameworks, to estimate the policy’s causal impact on gun violence. We find that, contrary to its
goal of improving public safety, DC’s juvenile curfew increases the number of gunfire incidents by 69%
during marginal hours.
2

1 Introduction
Gun violence is a chronic problem in the United States and has long been of interest to academics and
policy-makers. Nationally in 2011, 11,068 people were killed by assault with a firearm.1 Many more people
are injured by firearms each year: in 2010, 557,000 individuals were treated in emergency rooms for injuries
due to assaults by firearms and similar mechanisms.2 Gun violence takes a particularly large toll on young
people: According to the CDC, homicide accounted for 18% of deaths for males ages 15-19 and 20-24,
more than for any other age group. For black males, homicide is the leading cause of death for those age
groups, explaining 48% and 50% of deaths, respectively (CDC, 2013). According to the 2013 Supplemental
Homicide Reports, over 80% of all homicides involving 12-17 year-olds are gun homicides3. As Cohen and
Ludwig (2003) note, “policymakers who are concerned about America’s problem with lethal violence must
ask: how can we prevent young men from shooting one another?”
An unexpected rise in shootings and gun homicides in cities across the country during the summer of 2015
have made this question feel all the more urgent (Davey and Smith, 2015). However, data limitations have
made research on this topic difficult. Like some other types of crime, gun violence is likely underreported in a
highly-selected manner. Particularly in inner-city communities that distrust the police, gunshots may not be
reported unless the bullet hits someone and medical assistance is required (and even then some individuals
might avoid hospitals to avoid arrest). The result is that traditional data on reported gunfire (via 911 calls)
or violent crime (via reported crime data) are extremely noisy and potentially-unrepresentative measures
of the timing and frequency of gunfire incidents. In addition, most policy interventions that aim to reduce
gunfire (such as increasing police patrols) probably also affect reporting rates. Any empirical analysis of a
policy intervention’s impact on gunfire will therefore be biased, and often the direction of the bias will be
unknown (Pepper, Petrie, and Sullivan, 2010).
In order to fully understand the problem of urban gun violence and accurately test policy impacts, we
need better data. In particular, we need data that are more highly correlated with actual gunfire, and where
reporting is unaffected by programs and policies of interest. This paper uses a new source of data on gunfire
that fits these requirements to measure the effects of juvenile curfews on urban gun violence in Washington,
DC. The data are the full universe of gunshots detected in the city by an audio sensor technology called
ShotSpotter (described in more detail below). We exploit exogenous changes in curfew times to test juvenile
curfews’ net effects on gun violence and find that an early curfew actually increases the number of gunfire
incidents during marginal hours. Because of the nature of our data, we are able to rule out the possibility1These numbers do not include suicides. CDC report, “Deaths: Final Data for 2011,” table 10.2CDC: National Hospital Ambulatory Medical Care Survey: 2010 Emergency Department Summary Tables.3Authors’ calculations, based on SHR 2013 data, available at: http://www.icpsr.umich.edu/icpsrweb/NACJD/studies/
36124.
3

that this increase is driven by an increase in reporting — which would be a major concern if our analysis
used a traditional source of crime data.
1.1 Juvenile curfews as a test of incentive-based incapacitation
Violence-prevention policies can work one of two ways: (1) by deterring violence,4 or (2) by incapacitating
would-be offenders.5 If offenders have high discount rates and are unlikely to be deterred by potential
punishments — a la Becker (1968) — then limiting their opportunities to commit crime could be the most
effective crime-prevention policy. Policies that incentivize not carrying a gun,6 or staying away from locations
where violent confrontations are likely, might thus be more effective than policies that incentivize not shooting
people. Such incentive-based incapacitation should be particularly effective when it comes to crimes of passion
or opportunity, relative to premeditated crime.
DC’s city-wide juvenile curfew attempts to reduce violent crime among young people by incentivizing
them to be home during the nighttime hours when crime is most prevalent.7 Juvenile curfews like the one
in DC are common in cities across the country, but they are extremely controversial for several reasons: (1)
they give police officers discretion to stop any young-looking persons who are out in public at night, which
some worry results in disproportionate targeting of racial minorities and contributes to tense relationships
with law enforcement;8 (2) they override the private decisions of parents; and (3) they divert police resources
from other, potentially more productive, activities. Given these concerns, it is unclear whether such policies
are cost-effective.
DC’s curfew time for anyone under age 17 is 11pm on weeknights and midnight on weekends from
September through June, and midnight on all nights during July and August.9 We exploit the discontinuous4Deterring crime requires changing the relative costs and benefits of committing a crime in such a way that would-be offenders
rationally choose not to offend. Deterrence-based policies typically involve increasing the punishment or the probability of gettingcaught.
5Incapacitation is often thought of as synonymous with incarceration. In this paper, we follow the literature and referto policies that operate by changing the relative costs and benefits of being in a particular location at a particular time as“incapacitation polices.“ The idea is that these policies reduce the opportunity to commit a crime, rather than the relativecosts and benefits of committing a crime, per se. Mandatory schooling and summer jobs for teens are examples of policies thatoperate in this manner.
6Much of the literature on gun violence has focused on such policies, testing the impacts of laws that restrict gun ownershipor use (e.g., Cook, 1983; Lott and Mustard, 1997; Black and Nagin, 1998; Ludwig, 1998; Duggan, 2001; Marvell, 2001; Moody,2001; Ayres and Donohue, 2003; Donohue, 2004; Mocan and Tekin, 2006; Duggan, Hjalmarsson, and Jacob, 2011; Cheng andHoekstra, 2013). Overall, there is some evidence that directly restricting access to guns improves public safety.
7Violent crime is often cited as a motivator for juvenile curfew policies (Rothman, 2015).8A recent interview with several DC teenagers provides anecdotal evidence that this is a legitimate concern in the city. An
excerpt: “Benn: And do you feel you’re being protected and served by the police? Doné: No way. I feel more threatened bythem than by anybody else. Benn: Would you all ever help a police officer to apprehend a criminal? Doné: No. Martina: Hellno.” (Politico, 2015)
9The Juvenile Curfew Act of 1995 states that individuals under age 17 cannot be “in a public place or on the premises of anyestablishment within the District of Columbia during curfew hours.” Exceptions are made for several reasons, including if thejuvenile is accompanied by a parent or guardian, is working, or is involved in an emergency. During most of the year, curfewhours are 11:00pm on Sunday, Monday, Tuesday, Wednesday and Thursday nights, until 6:00am the following morning. Theyare 12:01am until 6:00am on Saturday and Sunday (that is, Friday and Saturday nights). During July and August, curfewhours are 12:01am to 6:00am every night. Juveniles who are caught violating curfew are taken to the nearest police station andreleased to the custody of their parents. They can also be sentenced to perform community service. Parents who violate the
4

change in the weekday curfew time from midnight to 11pm on September 1st10 to test for an impact on
gunshot incidents during the 11pm hour, using a combination of regression discontinuity (RD), difference-
in-RD (D-i-RD), and difference-in-difference-in-RD (D-i-D-i-RD) designs. If incentivizing juveniles to be
home during these hours decreases gun violence, we should see a discontinuous decrease in gunfire during the
11pm hour beginning September 1st.11 If reducing the number of witnesses and bystanders on the streets
encourages more violence, we might instead expect a net increase in gunfire during that hour.
Using traditional reported crime data for this analysis would be problematic due to the selective under-
reporting of gun violence. For instance, when juvenile curfews are in effect, some would-be offenders will be
at home instead of on the streets, and so gun violence should fall. This is the goal of the policy. However,
residents who are less law-abiding are probably more likely to break curfew, so the policy might simply clear
the streets of potential witnesses; this could increase violence while also reducing reporting rates. A larger
police presence during curfew hours could make up for this underreporting by increasing the rate at which
gunshot incidents are heard and recorded in the data. Meanwhile, baseline reporting rates, as well as the
elasticity of reporting with respect to gun violence, probably differ by neighborhood. So, if we find — as we
do here — that the juvenile curfew increases the number of reported gunshot incidents, how can we tell if
that represents a real increase in criminal behavior, or simply a change in reporting?
We use a new source of data on gunfire to address this concern. The gunfire data, generated by audio
sensors installed by ShotSpotter, provide information on the full universe of gunfire incidents in a covered
area. They have two key advantages over traditional reported crime data: (1) they have accurate and
precise time stamps and geo-codes, and (2) they are not subject to selective underreporting that could bias
the results. By using better data, we reduce the attenuation bias due to measurement error; remove the
selection bias resulting from variation in reporting rates over time, populations, and geographic areas; and
eliminate the confounding effects of policies’ simultaneous influences on reporting and crime.
Using these new data, we find evidence that an early juvenile curfew increases gun violence. Figure 1 shows
the raw gunfire data for the period of interest for the curfew analysis. As it suggests, there is a statistically-
significant increase in the level of gunshot incidents during the 11pm hour, after the curfew changes from
midnight to 11pm on September 1st. In other words, the curfew policy appears to be counterproductive.
For comparison, we also consider the effects of the curfew on reported crime and 911 calls, using geo-coded
data from the Metropolitan Police Department (MPD). If we wanted to study the impacts of this policy on
curfew law by allowing their child to be in public during curfew hours can be fined up to $500 per day. The curfew policy inWashington, DC, is very similar to policies in cities across the country.
10Due to the confounding effect of the July 4th holiday, we do not use the July 1 curfew time change.11Doleac and Sanders (Accepted) show that criminal activity is not easily shifted from one hour of the day to another, so there
is reason to believe that would-be offenders respond to such policies by staying out of trouble, rather than simply misbehavingat another time.
5

gun violence without ShotSpotter data, these are the data we would have to use. The results are imprecise
but generally suggest that the early curfew decreases gun violence. This different conclusion is likely due to
the simultaneous effect of the curfew on reporting behavior.
There is little previous work on the causal impacts of juvenile curfew policies. Kline (2012) studied the
impact of juvenile curfews on juvenile and non-juvenile arrest rates in cities across the country. Using an
event study design based on the enactment of new curfews, he finds that curfew policies decrease arrest rates
for those directly affected by the law. He also finds evidence that arrest rates for older individuals decline,
suggesting that juvenile curfews have spillover effects. The interpretation of these results is complicated by
the nature of arrest rates: they are a function of criminal behavior, police behavior, and witnesses’ behavior,
and curfew laws likely affect all of these. Of particular concern, arrest rates might fall if witnesses and
victims are less willing to cooperate with police as a result of heavy-handed curfew enforcement; this could
contribute to the reduction in arrests found in the study. The advantage of looking at arrest rates is that
the age of the offender is known; the advantage of using ShotSpotter data is that we are able to measure
effects on actual criminal activity, which we view as the primary outcome of interest.
Another key difference between our paper and Kline (2012) is that our empirical strategies address
slightly different, but highly complementary, questions: Kline considers the effects of new curfew policies,
as a package, including any distrust the implementation of those policies might generate. In contrast, we
consider the effect of incentivizing juveniles to go inside, during a marginal hour, after curfews have been
in effect for some time and parties have adjusted to the policy. This allows us to address the ability of
incentive-based incapacitation to reduce gun violence, but our results will not capture curfew policies’ effects
on residents’ trust of the police (which should not vary hour to hour).
There is a slightly larger literature on other types of (non-incarceration) incapacitation policies. Another
way to keep potential delinquents out of trouble is to require all juveniles to attend school during the day,
when adult supervision is limited. Anderson (2014) uses minimum dropout ages to measure the effect of
mandatory school attendance on crime. He finds that minimum dropout age requirements have statistically
significant and negative effects on arrest rates for individuals aged 16 to 18. Jacob and Lefgren (2003) also
study the impact of school attendance on crime, using exogenous variation in teacher in-service days to
estimate the causal impact of being in school on juvenile delinquency. They find that reported property
crimes go down when school is in session, while reported violent crimes go up. This points to an important
consideration when devising incapacitation strategies: keeping individuals off the streets by gathering them
in one place might increase interpersonal conflict. We do not observe reported or actual domestic violence
incidents in our data, but it is possible that juvenile curfews increase conflict at home – another potential
cost of the policy.
6

We view this study as contributing to the academic literature in several ways: (1) To our knowledge, this
is the first study to use ShotSpotter data, or any data generated by high-tech surveillance tools, to evaluate
policy impacts. In general, using ShotSpotter data allows us to measure policy impacts more accurately, and
provides valuable context for effects on reported crime that could be driven by changes in reporting behavior.
(2) It speaks to the broader potential of surveillance data to strengthen research on crime and crime policy.
(3) It addresses gun violence, which is of particular interest in the United States but is generally very difficult
to study due to the lack of reliable data. (4) It tests for incapacitation effects on criminal behavior, thereby
adding to a growing literature on this topic. (5) It measures the public safety impacts of juvenile curfews,
which are a controversial crime-reduction policy about which there is little empirical evidence.
The paper proceeds as follows: Section 2 presents a simple model of how juvenile curfews affect gun
violence; Section 3 describes the data; Section 4 describes our empirical strategies; Section 5 describes our
results; Section 6 compares the gunfire effects with effects on reported crime and 911 calls; and Section 7
discusses the results and concludes.
2 A simple model
To frame our analysis, we present the following, idea-fixing model of how gun violence is affected by incentive-
based incapacitation policies like juvenile curfews:
The number of gunshot incidents in an area is a function of several factors, including the number of
would-be offenders on the streets (o) and the probability of getting caught (p). The number of would-be
offenders is a function of whether a curfew (c) is in effect. The probability of getting caught is a function of
the number (or activity level) of law enforcement officers (l) and witnesses (w) in the area; both of these are
themselves functions of c. The curfew (c) decreases o, increases l and decreases w.
Gunshots = g[o(c), p(l(c), w(c))]
We hypothesize that dg/do > 0 and do/dc < 0, so we expect the curfew to decrease the number of
gunshots through this channel. We also hypothesize that dg/dp < 0, dp/dl > 0, and dp/dw > 0. However,
dl/dc > 0, and dw/dc < 0, making the impact of the curfew on the probability of getting caught (dp/dc)
ambiguous. The net effect of the curfew on gunfire (dg/dc) is therefore ambiguous.
7

3 Data
3.1 ShotSpotter data
We use ShotSpotter data from Washington, DC, from January 2006 through June 2013, aggregated to the
level of Police Service Areas (PSAs).12 The technology was first implemented in Police District 7 (Anacostia)
in January 2006, then expanded to Police Districts 5 and 6 in March 2008, and to Police District 3 in July
2008. These are the areas of DC that have the highest crime rates, and so were expected to have the highest
rates of gunfire. Figure 2 shows heatmaps of the raw gunshot data for each year.13
ShotSpotter technology consists of audio sensors installed around the city; these sensors detect gunshots,
then triangulate the precise location of the sound. A computer algorithm distinguishes the sound of gunfire
from other loud noises, and human technicians verify those classifications.14 Once verified, this information
is relayed to law enforcement so that police officers can quickly respond to the scene. There will be some false
positives or negatives – that is, noises that aren’t gunshots that are recorded as gunshots, or gunshots that
are missed — but these mistakes will be randomly distributed, and unaffected by the policy intervention
we’re studying. This is far less problematic than the selective underreporting present in reported crime
data. (See Carr and Doleac, 2015, for a review of current evidence on ShotSpotter’s accuracy.) The result
is precisely time-stamped and geo-coded data on the full universe of gunfire incidents in a covered area.
ShotSpotter is currently active in over eighty cities in the United States; while considered proprietary in
most locations, the data used in this paper are available from the MPD via public records request.
The data include the date and time that the gunfire incident was detected, the latitude and longitude of
the incident, and whether the incident consisted of a single gunshot or multiple gunshots. During the period
of interest (July 30th through October 4th, for the years 2006-2012), there were 7.8 gunfire incidents per day
across the Police Districts where ShotSpotter is currently implemented. On average, 0.9 of these occurred
during the 11pm hour. Table 1 presents summary statistics. Carr and Doleac (2015) describe the data in
greater detail.
3.2 Reported crime and 911 call data
For a comparison analysis, we use geo-coded, time-stamped data on reported crime and 911 calls from
the Metropolitan Police Department (MPD), from 2011 and 2012, aggregated to the PSA-level. (Due to a12Each Police District is composed of seven or eight PSAs; there are 31 PSAs in our sample.13We represent the geographic dispersion of gunshots using heat maps because the large quantity of gunshots makes detecting
the most densely concentrated areas difficult if we simply plot points. We construct the maps using a “point density” operationthat creates a grid over the map and then counts the number of gunshots within each grid cell. The darker colors represent thehighest concentration of gunshots.
14The sounds are classified as gunshots, construction, fireworks, car backfire, and so on. Only those classified as gunshotincidents are included in our data.
8
technical problem at the MPD, geo-coded data on reported crime are not available for dates prior to January
2011. The MPD does not maintain 911 call data for more than three years, so these are also unavailable
before January 2011.) We use these datasets to construct outcome measures that, without ShotSpotter data,
would be the best available to study gun violence.
In the reported crime data, offenses include: homicide, sexual abuse, assault with a dangerous weapon,
robbery, burglary, arson, motor vehicle theft, theft from an automobile, and other theft. We code the first
four crime types as “violent crimes.” The data also include information on the weapon used, if any; we code
any crime in which a gun is listed as the weapon as a “gun-involved crime.” The geo-codes and time stamps
will generally be less precise than in the ShotSpotter data. The geo-codes are reported at the block level,
rather then the exact latitude and longitude. The times are often estimates based on victims’ and witnesses’
recollections, and/or the time the incident was reported.
The 911 call data include all calls for service, not necessarily for the police. The outcome measures
of interest in this dataset are: all calls, calls for police, and calls to report gunshots. As for the reported
crime data, the geo-codes and time stamps will be less precise than in the ShotSpotter data. The geo-codes
will often be the address where the caller is calling from, rather than the location of the crime (this will
be particularly problematic for reported gunshots, where the shots could have been fired blocks away from
where they were heard). The time stamp is when the call was received.
As above, we restrict our analysis to the areas covered by ShotSpotter (Police Districts 3, 5, 6, and 7).
Summary statistics are in Table 1. Carr and Doleac (2015) describes the relationship between these data
and the ShotSpotter data during this period.
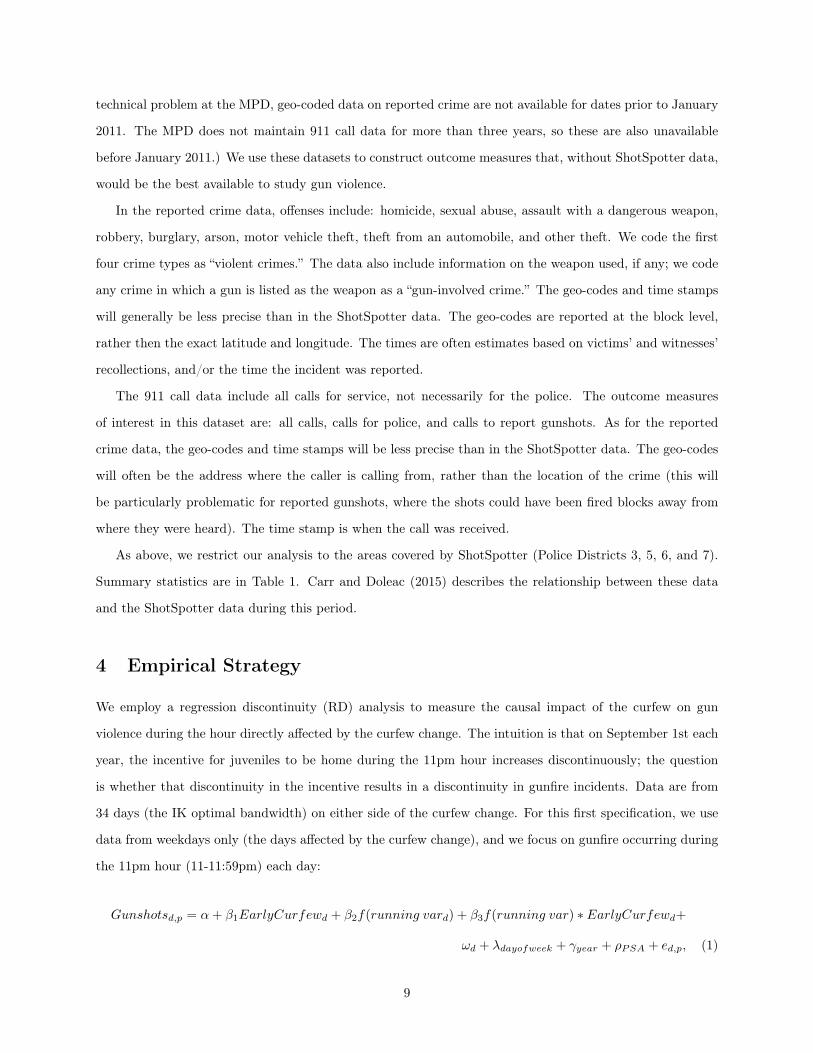
4 Empirical Strategy
We employ a regression discontinuity (RD) analysis to measure the causal impact of the curfew on gun
violence during the hour directly affected by the curfew change. The intuition is that on September 1st each
year, the incentive for juveniles to be home during the 11pm hour increases discontinuously; the question
is whether that discontinuity in the incentive results in a discontinuity in gunfire incidents. Data are from
34 days (the IK optimal bandwidth) on either side of the curfew change. For this first specification, we use
data from weekdays only (the days affected by the curfew change), and we focus on gunfire occurring during
the 11pm hour (11-11:59pm) each day:
Gunshotsd,p = α+ β1EarlyCurfewd + β2f(running vard) + β3f(running var) ∗ EarlyCurfewd+
ωd + λdayofweek + γyear + ρPSA + ed,p, (1)
9
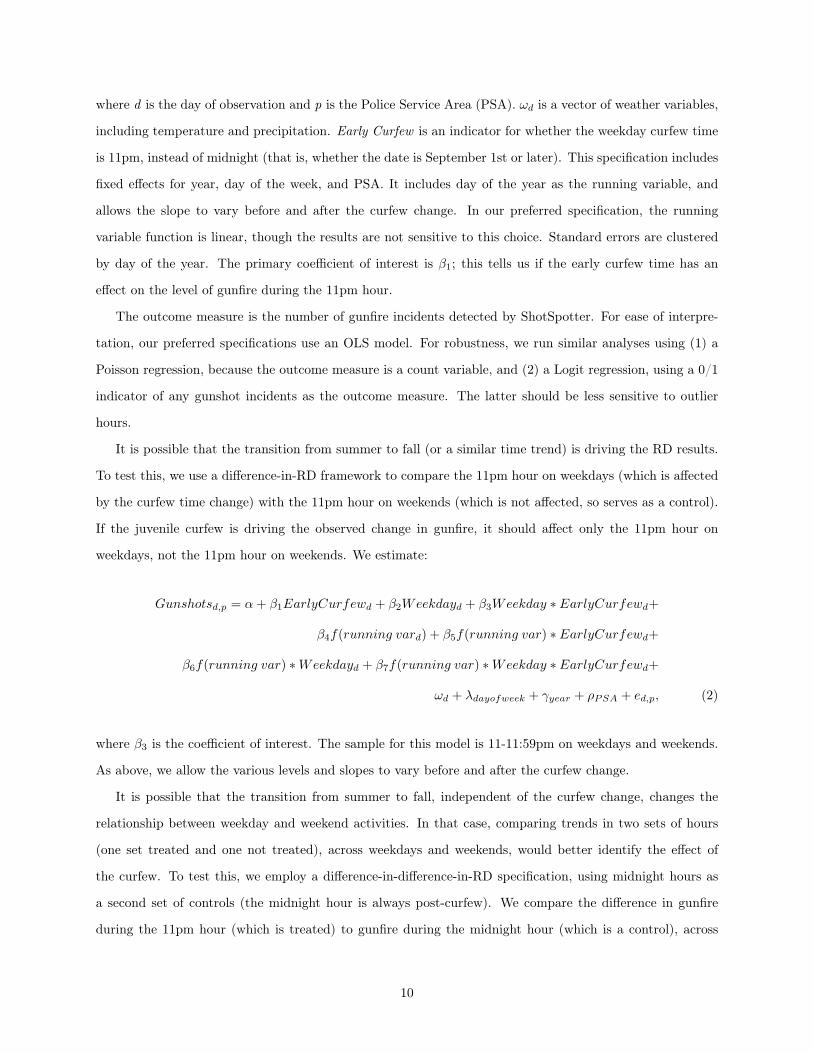
where d is the day of observation and p is the Police Service Area (PSA). ωd is a vector of weather variables,
including temperature and precipitation. Early Curfew is an indicator for whether the weekday curfew time
is 11pm, instead of midnight (that is, whether the date is September 1st or later). This specification includes
fixed effects for year, day of the week, and PSA. It includes day of the year as the running variable, and
allows the slope to vary before and after the curfew change. In our preferred specification, the running
variable function is linear, though the results are not sensitive to this choice. Standard errors are clustered
by day of the year. The primary coefficient of interest is β1; this tells us if the early curfew time has an
effect on the level of gunfire during the 11pm hour.
The outcome measure is the number of gunfire incidents detected by ShotSpotter. For ease of interpre-
tation, our preferred specifications use an OLS model. For robustness, we run similar analyses using (1) a
Poisson regression, because the outcome measure is a count variable, and (2) a Logit regression, using a 0/1
indicator of any gunshot incidents as the outcome measure. The latter should be less sensitive to outlier
hours.
It is possible that the transition from summer to fall (or a similar time trend) is driving the RD results.
To test this, we use a difference-in-RD framework to compare the 11pm hour on weekdays (which is affected
by the curfew time change) with the 11pm hour on weekends (which is not affected, so serves as a control).
If the juvenile curfew is driving the observed change in gunfire, it should affect only the 11pm hour on
weekdays, not the 11pm hour on weekends. We estimate:
Gunshotsd,p = α+ β1EarlyCurfewd + β2Weekdayd + β3Weekday ∗ EarlyCurfewd+
β4f(running vard) + β5f(running var) ∗ EarlyCurfewd+
β6f(running var) ∗Weekdayd + β7f(running var) ∗Weekday ∗ EarlyCurfewd+
ωd + λdayofweek + γyear + ρPSA + ed,p, (2)
where β3 is the coefficient of interest. The sample for this model is 11-11:59pm on weekdays and weekends.
As above, we allow the various levels and slopes to vary before and after the curfew change.
It is possible that the transition from summer to fall, independent of the curfew change, changes the
relationship between weekday and weekend activities. In that case, comparing trends in two sets of hours
(one set treated and one not treated), across weekdays and weekends, would better identify the effect of
the curfew. To test this, we employ a difference-in-difference-in-RD specification, using midnight hours as
a second set of controls (the midnight hour is always post-curfew). We compare the difference in gunfire
during the 11pm hour (which is treated) to gunfire during the midnight hour (which is a control), across
10

weekdays (treated) and weekends (control), testing for a discontinuity at September 1st. If the juvenile
curfew is driving any observed change in gunfire, the curfew time change should affect only the 11pm hour
on weekdays, not the midnight hour. We estimate:
Gunshotsh,d,p = α+ β1EarlyCurfewd + β2Weekdayd + β3Weekday ∗ EarlyCurfewd+
β411pmHourh + β5Weekday ∗ 11pmHourh + β611pmHour ∗ EarlyCurfewh+
β7Weekday ∗ 11pmHour ∗ EarlyCurfewh + β8f(running vard)+
β9f(running var) ∗ EarlyCurfewd + β10f(running var) ∗Weekdayd+
β11f(running var) ∗Weekday ∗ EarlyCurfewd + β12f(running var) ∗ 11pmHourh+
β13f(running var) ∗ 11pmHour ∗ EarlyCurfewh + β14f(running var) ∗Weekday ∗ 11pmHourh+
β15f(running var) ∗Weekday ∗ 11pmHour ∗ EarlyCurfewh+
ωd + λdayofweek + γyear + ρPSA + ed,p, (3)
where the coefficient of interest is β7. The sample is now 11pm–12:59am, on weekdays and weekends. As in
the above specifications, we allow all of the levels and slopes to vary before and after the curfew change.
5 Results
Table 2 presents the results of the juvenile curfew analysis using ShotSpotter data.
Column 1 shows the results of the basic RD specification, where we are interested in the coefficient on
Early Curfew. This reveals that the switch from a midnight to 11pm curfew on weekdays increases gun
violence during the 11pm hour on weekday nights. After the curfew time changes, the number of gunfire
incidents increases by 0.02 during the 11pm hour, or 69% of the late-curfew (pre-September 1) baseline.
(Note that while this estimate is statistically significant, it is imprecise; the 95% confidence interval suggests
that the early curfew increases gunfire incidents by 15% to 123% of the baseline.) Recall that observations
are at the PSA-level, and our data cover 31 PSAs across the city. So, this effect size implies several additional
gunfire incidents per week, during the 11pm hour alone.
Column 2 shows the results of the D-i-RD specification, using the 11pm hour on weekends as a control.
Here we are interested in the coefficient on Early Curfew * Weekday, which is positive and statistically
significant. It reveals that the early curfew on weekdays increases gunfire during the 11pm hour by 0.045
incidents, which is 129% of the baseline, relative to the effect during the 11pm hour on weekends.
Column 3 shows the results of the D-i-D-i-RD specification, using weekends and the midnight hour as
11

controls. This time were are interested in the coefficient on Early Curfew * Weekday * 11pm Hour, which is
positive and marginally significant. This specification implies that the earlier curfew increases the number
of gunfire incidents by 0.037 during the 11pm hour on weekdays, or 112% of the baseline.
Due to limited space, the coefficients for the running variable (and interactions thereof) are omitted; all
are statistically insignificant.
Appendix Figure A.1 plots estimates for the RD specification when different bandwidths are used; results
are quite consistent as the bandwidth shrinks or expands. Also in the Appendix, Table A.1 shows Poisson
and Logit results. The Logit results are similar in magnitude and significance-level to those described above,
confirming that outliers are not driving our results. The Poisson (count regression) results are a bit larger
in magnitude and more highly-significant, which provides assurance that our basic OLS regression is picking
up a real effect.
6 Comparing results using reported crime and 911 call data
We repeat the RD analysis using data on reported crime and 911 calls. These data are only available for
January 2011 through June 2013, so our sample is restricted to only the September 2011 and 2012 curfew
changes. (To ease comparison, we also re-run the above ShotSpotter data analyses using the same, smaller
sample.) The results are presented in Appendix Table A.2. Recall that reporting behavior might change in
response to the curfew, so both sets of comparison results could be biased upward or downward. In addition,
there is a great deal of measurement error in the timestamps and geo-codes.
Overall, the results are less precise than before, but it is striking that all of the coefficients using reported
crime and 911 call data are negative. That is, while the ShotSpotter data reveal that the earlier curfew
increases gunfire incidents, the reported crime and 911 call data suggest that the earlier curfew decreases
gun violence. Using those traditional data sources would therefore lead to the opposite (and, we argue,
incorrect) conclusion about the effectiveness of this policy.
7 Discussion
In this paper, we use a new source of gunshot incident data, from ShotSpotter, to measure the effects of
a city-wide juvenile curfew on gun violence. These data are not affected by the inaccuracies and selective
underreporting that make traditional reported crime data problematic. The resulting empirical estimates do
not suffer from (unsigned) bias that makes empirical results throughout the literature difficult to interpret.
This is crucial for determining the true impact of any policy on public safety.
12

The curfew policy in Washington, DC, was enacted in 1995 as an effort to decrease urban violence.
Similar curfew laws are in effect across the United States, but are controversial, and in some cases have been
ruled unconstitutional. Their impacts depend crucially on how they are implemented and how police officers,
law-abiding citizens, and would-be offenders respond. We show that in this city, at least, the juvenile curfew
policy increases the number of gunfire incidents during marginal curfew hours. This is likely due to the
change in the composition of people on the streets during the hours that juveniles are incentivized to be at
home. The magnitude of the effect ranges from 0.02 to 0.045 additional gunfire incidents, per PSA, during
the 11pm hour. With 31 PSAs in our dataset, this aggregates up to 0.62 to 1.40 extra gunfire incidents per
weekday, or 3.1 to 6.98 extra gunfire incidents per week, across Police Districts 3, 5, 6, and 7.
Our results suggest that curfew laws are not a cost-effective way to reduce gun violence in U.S. cities.
This does not necessarily mean that juvenile curfews are not cost-effective more broadly. We cannot measure
impacts on other types of crime — particularly minor offenses — and so to the extent that such criminal
activity is of concern and is not correlated with gun violence, we might not observe a benefit of curfew
policies. It is also possible that even if curfews do not reduce the number of gunshots, they might reduce
the number of victims when there are fewer innocent bystanders in the area. However, we doubt that most
residents would consider such an impact evidence of a real improvement in public safety — gunfire would
still be audible, and stray bullets would still be a threat. In addition, juvenile curfews might increase the
amount of domestic violence by requiring kids to be home at night. This is an important potential cost that
should be considered.
Empirical evidence on this topic is particularly necessary in light of broader concerns about how to
improve trust between law enforcement and city residents. Juvenile curfews are the type of policy that
many worry worsens tensions between inner-city communities and the police. Ours is only the second
rigorous examination of the effects of juvenile curfews on public safety. Our results differ markedly from
those in Kline (2012); there are a few possible explanations for this. That paper considers the effects of the
implementation of new curfew policies on juvenile arrest rates; we consider the effect of a marginal hour of
curfew enforcement on the number of gunfire incidents during that hour.
Kline’s results capture the net effect of the curfew policy, including any increase in tensions or distrust that
might arise due to its implementation. Our results very likely isolate the incentive-based effects of the curfew
from these background tensions – it is unlikely that the level of trust between police and residents changes
substantially when the curfew is midnight instead of 11pm. Our paper therefore focuses on the effects that
curfews have on the composition of people on city streets during nighttime hours: many juveniles (and their
caregivers) will go home, which could reduce the number of offenders, but the emptier streets might make
remaining offenders more comfortable opening fire. This balance could be affected by the number of police
13

officers present in the neighborhood. Our empirical estimates capture the net effect of these interactions,
and suggest that the curfew leads to more gun violence, not less.
As discussed above, the difference in outcome measures considered in these two papers is also important.
The changing composition of people on the streets, along with the distrust the curfew policy might create,
could decrease not only the reporting of crime (as supported by our analyses of reported crime and 911
call data), but the number of witnesses and those witnesses’ willingness to cooperate with the police. This
could lead to fewer arrests, conditional on the same underlying criminal behavior. While it is very helpful
to know offenders’ ages (which arrest data provide), we argue that measuring actual (not reported) criminal
activity is important for understanding the effects of this policy on public safety. ShotSpotter data on gunfire
incidents provide a unique opportunity to do this.
14

ReferencesAnderson, D. M. (2014): “In school and out of trouble? The minimum dropout age and juvenile crime,”Review of Economics and Statistics, 96(2), 318–331.
Ayres, I., and J. J. Donohue (2003): “Shooting Down the ’More Guns, Less Crime’ Hypothesis,” StanfordLaw Review, 55, 1193–1312.
Becker, G. S. (1968): “Crime and Punishment: An Economic Approach,” Journal of Political Economy, 76,169–217.
Black, D. A., and D. S. Nagin (1998): “Do ’Right to Carry’ Laws Reduce Violent Crime?,” Journal of LegalStudies, 27(1), 209–219.
Carr, J. B., and J. L. Doleac (2015): “The geography, incidence, and underreporting of gun violence: newevidence using ShotSpotter data,” Unpublished manuscript.
CDC (2013): “National Vital Statistics System, Mortality,” Available at: http://www.cdc.gov/nchs/deaths.htm.
Cheng, C., andM. Hoekstra (2013): “Does Strengthening Self-Defense Law Deter Crime or Escalate Violence?Evidence from Expansions to Castle Doctrine,” Journal of Human Resources, 48(3), 821–854.
Cohen, J., and J. Ludwig (2003): “Policing Crime Guns,” in Evaluating gun policy: Effects on crime andviolence, ed. by J. Ludwig, and P. J. Cook. The Brookings Institution.
Cook, P. J. (1983): “The Influence of Gun Availability on Violent Crime Patterns,” Crime and Justice, 4,49–89.
Davey, M., and M. Smith (2015): “Murder Rates Rising Sharply in Many U.S. Cities,” Available at: http://www.nytimes.com/2015/09/01/us/murder-rates-rising-sharply-in-many-us-cities.html?_r=0.
Doleac, J. L., and N. J. Sanders (Accepted): “Under the Cover of Darkness: Using Daylight Saving Time toMeasure How Ambient Light Influences Criminal Behavior,” Review of Economics and Statistics.
Donohue, J. J. (2004): “Guns, crime, and the impact of state right-to-carry laws,” Fordham L. Review, 73,623.
Duggan, M. (2001): “More Guns, More Crime,” Journal of Political Economy, 109(5), 1086–1114.
Duggan, M., R. Hjalmarsson, and B. Jacob (2011): “The Short-Term and Localized Effect of Gun Shows:Evidence from California and Texas,” Review of Economics and Statistics, 93(3), 786–799.
Jacob, B. A., and L. Lefgren (2003): “Are Idle Hands The Devil’s Workshop? Incapacitation, Concentration,And Juvenile Crime,” American Economic Review, 93(5), 1560–1577.
Kline, P. (2012): “The Impact of Juvenile Curfew Laws on Arrests of Youth and Adults,” American Law andEconomics Review, 14(1), 44–67.
Lott, Jr, J. R., and D. B. Mustard (1997): “Crime, Deterrence, and Right-to-Carry Concealed Handguns,”Journal of Legal Studies, 26(1), 1–68.
Ludwig, J. (1998): “Concealed-gun-carrying laws and violent crime: evidence from state panel data,” Inter-national Review of Law and Economics, 18(3), 239–254.
Marvell, T. B. (2001): “The Impact of Banning Juvenile Gun Possession,” Journal of Law and Economics,44(S2), 691–713.
Mocan, H. N., and E. Tekin (2006): “Guns and Juvenile Crime,” Journal of Law and Economics, 49, 507–531.
Moody, C. E. (2001): “Testing for the Effects of Concealed Weapons Laws: Specification Errors and Robust-ness,” Journal of Law and Economics, 44(S2), 799–813.
15

Pepper, J., C. Petrie, and S. Sullivan (2010): “Measurement Error in Criminal Justice Data,” in Handbookof Quantitative Criminology, ed. by A. Piquero, and D. Weisburd. Springer.
Politico (2015): “They just know you up to no good,” Available at: http://www.politico.com/magazine/story/2015/03/southeast-dc-roundtable-115492.html.
Rothman, L. (2015): “How Curfews Have Changed Through History,” Available at: http://time.com/3839427/emergency-curfew-history-juvenile/.
16

8 Main tables and figures
Figure 1: Gunshot Incidents during 11pm Hour, by Week
Notes: Graph shows raw ShotSpotter data for weekdays, aggregated to the PSA-day level and then averaged over each week.It also shows fitted lines from local linear regressions. The vertical line denotes the date of the change in weekday curfew hoursfrom starting at midnight to 11pm.
17

Figure 2: Heatmaps of ShotSpotter-Detected Gunshot Incidents
2
7
4
1
5
6
3
Gunshot Incidents in DC by Police District in 2006
2
7
4
1
5
6
3
Gunshot Incidents in DC by Police District in 2007
2
7
4
1
5
6
3
Gunshot Incidents in DC by Police District in 2008
2
7
4
1
5
6
3
Gunshot Incidents in DC by Police District in 2009
2
7
4
1
5
6
3
Gunshot Incidents in DC by Police District in 2010
2
7
4
1
5
6
3
Gunshot Incidents in DC by Police District in 2011
2
7
4
1
5
6
3
Gunshot Incidents in DC by Police District in 2012
2
7
4
1
5
6
3
Gunshot Incidents in DC by Police District in 2013
Notes: Shaded regions show the location of detected gunfire in Washington, DC, in each year (January 2006 through June2013), along with labeled outlines of the seven Police Districts. Darker regions signify more gunfire. Note that ShotSpottersensors cover primarily Districts, 3, 5, 6, and 7; we restrict our analyses to these regions. Data source: MPD.
18
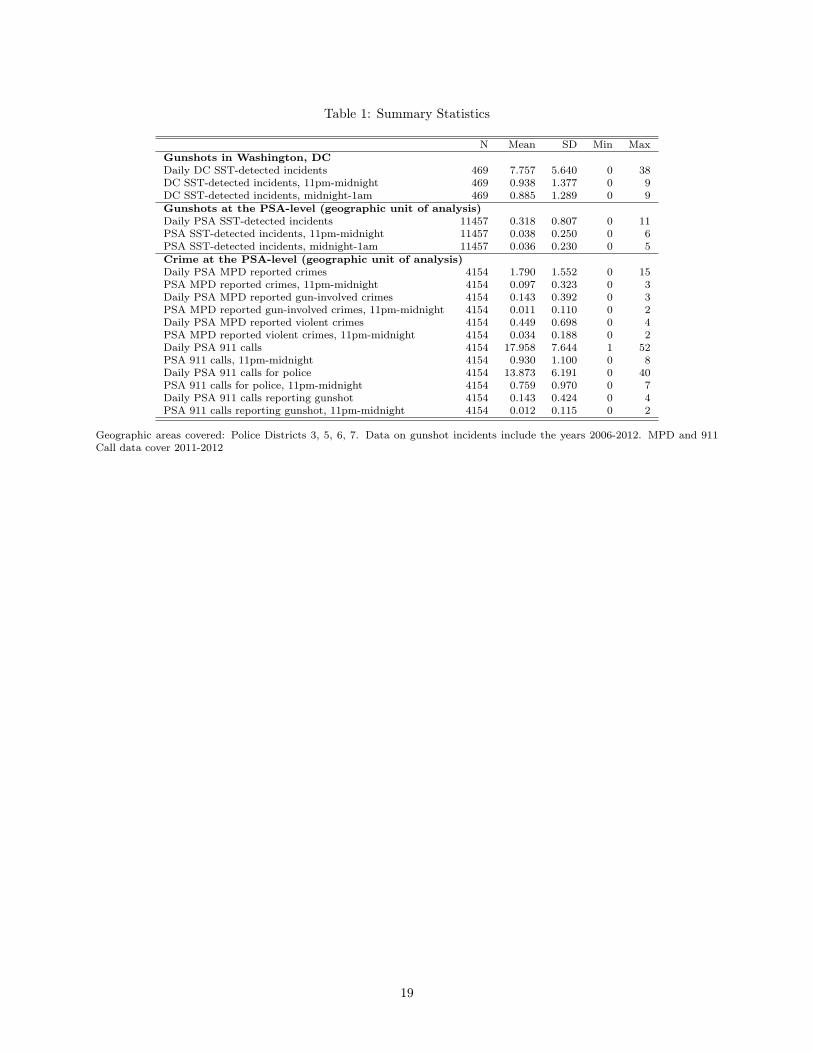
Table 1: Summary Statistics
N Mean SD Min MaxGunshots in Washington, DCDaily DC SST-detected incidents 469 7.757 5.640 0 38DC SST-detected incidents, 11pm-midnight 469 0.938 1.377 0 9DC SST-detected incidents, midnight-1am 469 0.885 1.289 0 9Gunshots at the PSA-level (geographic unit of analysis)Daily PSA SST-detected incidents 11457 0.318 0.807 0 11PSA SST-detected incidents, 11pm-midnight 11457 0.038 0.250 0 6PSA SST-detected incidents, midnight-1am 11457 0.036 0.230 0 5Crime at the PSA-level (geographic unit of analysis)Daily PSA MPD reported crimes 4154 1.790 1.552 0 15PSA MPD reported crimes, 11pm-midnight 4154 0.097 0.323 0 3Daily PSA MPD reported gun-involved crimes 4154 0.143 0.392 0 3PSA MPD reported gun-involved crimes, 11pm-midnight 4154 0.011 0.110 0 2Daily PSA MPD reported violent crimes 4154 0.449 0.698 0 4PSA MPD reported violent crimes, 11pm-midnight 4154 0.034 0.188 0 2Daily PSA 911 calls 4154 17.958 7.644 1 52PSA 911 calls, 11pm-midnight 4154 0.930 1.100 0 8Daily PSA 911 calls for police 4154 13.873 6.191 0 40PSA 911 calls for police, 11pm-midnight 4154 0.759 0.970 0 7Daily PSA 911 calls reporting gunshot 4154 0.143 0.424 0 4PSA 911 calls reporting gunshot, 11pm-midnight 4154 0.012 0.115 0 2
Geographic areas covered: Police Districts 3, 5, 6, 7. Data on gunshot incidents include the years 2006-2012. MPD and 911Call data cover 2011-2012
19

Table 2: Effect of 11pm Curfew on Gun Violence
RD D-i-RD D-i-D-i-RD(1) (2) (3)
SST-Detected Gunshot Incidents
early curfew 0.020*** -0.024 0.006(0.008) (0.019) (0.019)
weekday -0.050*** -0.028**(0.016) (0.013)
early curfew * weekday 0.045** 0.010(0.021) (0.021)
11pm hour 0.012(0.016)
early curfew * 11pm hour -0.031(0.021)
weekday * 11pm hour -0.021(0.015)
early curfew * weekday * 11pm hour 0.037*(0.021)
mean shots .029 .035 .033
Observations 8162 11457 22914Sample is 11-11:59pm only X XSample is 11-12:59am XSample is weekdays only X
* p < .10, ** p < .05, *** p < .01.
Notes: Standard errors are clustered on the running variable (day of year) and are shown in parentheses. Results are from OLSregressions; outcome measure is the number of gunshot incidents. Analysis uses data from Police Districts 3, 5, 6, and 7. Datesincluded: 34 days (the IK optimal bandwidth) on either side of September 1st. All specifications include: year, day of weekand PSA fixed effects; precipitation; temperature. ShotSpotter data source: MPD. Weather data source: NOAA.
20

A Appendix: Additional tables and figures
Figure A.1: Effect of 11pm Curfew on Gunfire Incidents
Notes: The figure plots coefficients on an early curfew indicator and their 95% confidence intervals from RDD regressions(Table 2, column 1 specification) on SST incidents in the 11pm hour using various bandwidths. Bandwidths range from 5 - 50at increments of 5. The vertical line denotes the IK optimal bandwidth, 34.
21

A.1 Alternative specifications
Table A.1: Poisson and Logit Results: Effect of 11pm Curfew on Gun Violence
Poisson Logit(1) (2) (3) (4) (5) (6)
SST-Detected Gunshot Incidents
early curfew 1.975*** 0.621 1.096 1.729** 0.791 1.329(0.485) (0.224) (0.382) (0.437) (0.272) (0.539)
weekday 0.252*** 0.438** 0.302*** 0.432**(0.090) (0.155) (0.107) (0.143)
early curfew * weekday 3.208*** 1.399 2.198* 1.188(1.426) (0.640) (0.987) (0.560)
11pm hour 1.283 1.254(0.403) (0.390)
early curfew * 11pm hour 0.555 0.601(0.219) (0.295)
weekday * 11pm hour 0.551** 0.752(0.165) (0.259)
early curfew * weekday * 11pm hour 2.346** 1.798(0.972) (0.956)
mean shots .029 .035 .033 .024 .027 .026
Observations 8162 11457 22914 6734 10787 22914Sample is 11-11:59pm only X X X XSample is 11-12:59am X XSample is weekdays only X X
* p < .10, ** p < .05, *** p < .01.
Notes: Standard errors are clustered on the running variable (day of year) and are shown in parentheses. Poisson specification:Poisson regression with number of gunshot incidents as the outcome measure. Coefficients are presented as incident-rate ratios;1 = no effect. Logit Specification: outcome measure is a 0/1 indicator of any gunshot incidents. Coefficients reported asodds ratios; 1 = no effect. Dates included: 34 days before and after September 1; years 2006-2012. Analysis uses data fromPolice Districts 3, 5, 6, and 7. All specifications include: year, day of week and PSA fixed effects; precipitation; temperature.ShotSpotter crime data source: MPD. Weather data source: NOAA.
22

A.2 Reported crime and 911 call data
Table A.2: Effect of 11pm Curfew on Gun Violence
ShotSpotter Incidents MPD Reported Crime 911 Calls for ServiceGun- For To Report
All All Involved Violent All Police Gunshots(1) (2) (3) (4) (5) (6) (7)
early curfew 0.015 -0.020 -0.008 -0.007 -0.069 -0.088 -0.012(0.010) (0.019) (0.007) (0.011) (0.081) (0.072) (0.009)
late curfew mean .016 .1 .012 .04 .889 .726 .013
Observations 3007 3007 3007 3007 3007 3007 3007Sample is 11-11:59pm only X X X X X X XSample is weekdays only X X X X X XSample is 2011-2012 X X X X X X X
* p < .10, ** p < .05, *** p < .01.
Notes: Standard errors, clustered by day of year, are shown in parentheses. Results are from OLS regressions. Analysis usesdata from Police Districts 3, 5, 6, and 7. Dates included: 34 days (the IK optimal bandwidth) on either side of September 1st.All specifications include: year, day of week and PSA fixed effects; precipitation; temperature. ShotSpotter, MPD and 911 calldata source: MPD. Weather data source: NOAA.
23