KDDI CORPORATION · KDDI CORPORATION January 28, ... projected data based on the information...
57
Financial Results for the 3rd Quarter of the Fiscal Year Ending March 2013 President Takashi Tanaka KDDI CORPORATION January 28, 2013
Transcript of KDDI CORPORATION · KDDI CORPORATION January 28, ... projected data based on the information...

Financial Results for the 3rd Quarter of the Fiscal Year Ending March 2013
President Takashi Tanaka
KDDI CORPORATION
January 28, 2013

The figures included in the following brief, including the business performance target and the target for the number of subscribers are all projected data based on the information currently available to the KDDI Group, and are subject to variable factors such as economic conditions, a competitive environment and the future prospects for newly introduced services. Accordingly, please be advised that the actual results of business performance or of the number of subscribers may differ substantially from the projections described here.
Disclaimer

2
1. Progress and Benefits of the 3M Strategy
2. Performance in 1-3Q
3. Growth in Communications Revenues Realized
4. Revision of Full-year Results Forecasts
Today’s Presentation

Progress and Benefits of the 3M Strategy

au Smart Value
Expanding telecommunications business customer base

5
March June September December
0.44M
0.66M
2.85M
1.66M
au Smart Value
au subs : 2.85M
Households* : 1.66M
(Progress rate: 90%)
*Total for KDDI group companies and fixed-line allied companies
[Progress rate] Increase in 1-3Q in comparison to FY2013.3 targets (Previous Forecast: 3.10M of au subs and 1.55M of households) *Smart Value is a registered trademark of Energy Management Corporation.
(Progress rate: 110%)
Strong subscriptions for both mobile and fixed-line services Met year-end households target ahead of schedule

6
au smartphone + fixed-line BB bundle discounts
¥1,480/month off maximum discount period of 2 years
Smartphone Tablet Internet Telephone
au smartphone
Mobile Fixed-line BB
All au smartphones in the household are
applicable
For 1 fixed-line BB contract
Robust smartphone lineup
High quality & industry’s No.1* area coverage of 4G LTE
Superiority of au Smartphone
au Smart Pass
Handset
Charge
NW
Service
au Smart Value
*KDDI’s estimates based on the expectation that actual population coverage will be approx. 96% on March 31, 2013. (Target: AndroidTM smartphones) *”Android” is a trademark or a registered trademark of Google Inc.
au Smart Value
au Smart Value

7
Spread of au smartphones throughout households via chain reactions
*Including tax
Discuss
Acceptance
Daughter Daughter Father
Mother
Son Father
Overcome obstacle of price, purchase
smartphone
Chain reactions
Price and handset selection benefits
Fixed-line BB
Maximum discount period of 2 years
for 4 people
¥5,920/month off
au Smart Value
Fixed-line BB
Key Word 1: Chain Reactions
Desire to purchase smartphone
Consider contracting fixed-line BB
“I want a smartphone. I hear “au Smart Value” is good deal.”

8
Alliances with fixed-line companies=Expanding cross-selling area
*FTTH 5 companies include 3 KDDI group companies. (Shikoku covered by both “au HIKARI” and “Pikara”) *CATV companies/channels include CATV 22 companies/22 channels through alliance with STNet. *Household coverage ratio in detached house provision area of FTTH/CATV
FTTH 5 companies
CATV 99 companies, 180 channels
Nationwide household coverage ratio
approx. 80%
Allied CATV companies
FTTH
CATV
(Companies providing au Smart Value)
au HIKARI / au HIKARI Chura (OCT)
Commuf@-hikari (CTC)
eo HIKARI (K-Opticom) Pikara (STNet)
Key Word 2: Alliances
9
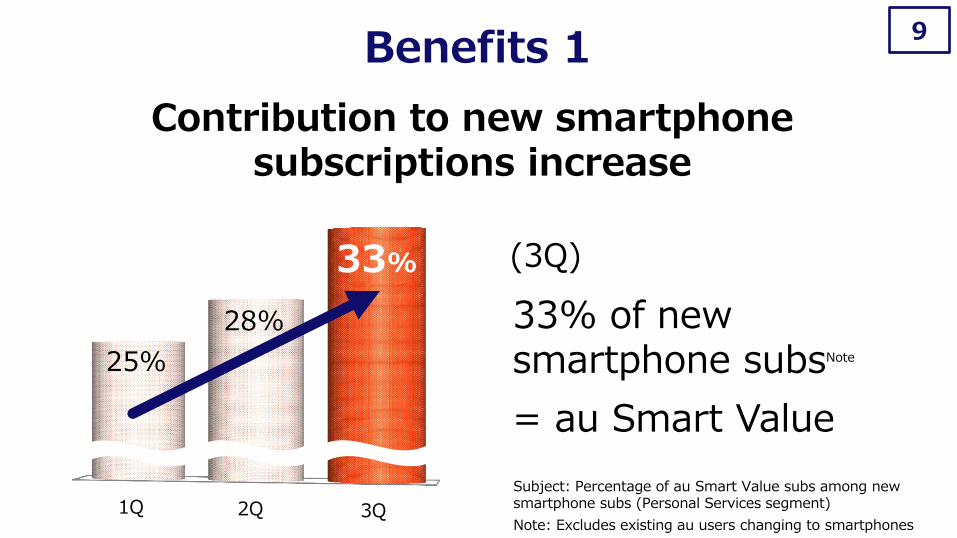
1Q 2Q 3Q
25%
28%
33%
Contribution to new smartphone subscriptions increase
Subject: Percentage of au Smart Value subs among new smartphone subs (Personal Services segment)
33% of new smartphone subsNote
= au Smart Value
(3Q)
Benefits 1
Note: Excludes existing au users changing to smartphones

10
(3Q)
1Q 2Q 3Q
33%
38%
48%
Contribution to new FTTH subscriptions increase
48% of new au HIKARI subsNote
= au Smart Value
Subject: Percentage of au Smart Value subs among new au HIKARI subs (Personal Services segment)
Benefits 2
Note: Excludes existing au users changing to smartphones

11
3Q/FY2013.3
Reduction in FTTH subscribers acquisition costs per unit
Subject: Acquisition costs per au HIKARI user
3Q/FY2012.3
Down
33%
Compared with 3Q/FY2012.3, before introducing au Smart Value
Before introducing au Smart Value 3Q/FY2013.3: down 33%
Benefits 3

12
Promoting chain reactions through “au Smart Value”
Approx. 16M
Fixed-line BB (FTTH/CATV)
Approx. 12M
*As of September 30, 2012
Expansion Expansion
Expanding Customer Base Further
households households
Chain
reactions

au Smart Pass
Value-added revenues expansion

14
Unlimited use of apps
Storage Coupons & points Security
Customer center
Secure verification
©1986-2012 Tecmo Koei Games Co., Ltd. All rights reserved. ©2012 NBGI ©CAPCOM U.S.A., INC. 2012 ALL RIGHTS RESERVED. ©TAITO CORP.1986,2012 ©Mutsumi Inomata ©Kousuke Fujishima ©2012 NAMCO BANDAI Games Inc. ©2012 JustSystems Corporation ©EAST Co., Ltd. 2009-2012 ©Sanseido Co., Ltd. 2012 ©EAST Co., Ltd. 2009-2012 ©KONISHI Tomoshichi, MINAMIDE Kosei and Taishukan, 2006-2011 ©MINAMIDE Kosei, NAKAMURA Mitsuo and Taishukan, 2012 C2 Inc. HOUKEN CORP. ©SOURCENEXT CORPORATION ©ZAPPALLAS,INC. ©niwango, inc. ©NHN Japan Corp. / ©TOMY c2012 San-X Co., Ltd. All Rights Reserved. ©2012 Imagineer Co.,Ltd. Nissen,.Co.LTD ©2010-2011 Mind Palette Co. Ltd. All Rights Reserved. ©2012 Community Factory Inc. ©2011 Vuzz Inc "TRENDMICRO" and "VirusBuster" are registered trademarks of Trend Micro Incorporate.
¥390/month
au ID
Over 500 popular apps
High capacity (50GB)
O2O tie-ups Safer and
more secure
March June September December
0.56
1.47
2.43
3.98
Trends in Members
(Million members)
Exceeded 4.00M members in early January
au Smart Pass
Progress rate:
77%
[Progress rate] Increase in 1-3Q in comparison to FY2013.3 target (5.00M members)

15
Video Pass Uta Pass Book Pass
au ID
Up-selling Up-selling Up-selling
Up-selling efforts and enhance coordination with CATV
Content chain
reactions
Device chain
reactions
Multi-device development
Smartphone Tablet PC TV
Initiatives to Increase Value-added Revenues (1)
au Smart Pass
*Ratio using au Smart Pass compatible handsets as denominator
Target take-up ratio of 80%*

16
Subscription ratio of au Smart Pass exceeded 80%
83%
Subscriptions as a percentage of December smartphone sales
Note: Excludes sales from model upgrades by existing “au Smart Pass” users
Becoming a standard service for au smartphones
83%Note of users purchasing smartphones
au Smart Pass
Initiatives to Increase Value-added Revenues (2)

17
Boosting value-added ARPU with “au Smart Pass”
Overall averageNote1 Smartphone usersNote2
Comparison of 3Q Value-added ARPU
¥240
¥300 Smartphone-user value-added ARPU in 3Q: ¥300
=25% above overall average
Initiatives to Increase Value-added Revenues (3)
Note1: 3Q value-added revenues ÷ average number of feature phones and smartphones in use during 3Q (Personal Services segment) Note2: 3Q value-added revenues from smartphones ÷ average number of smartphones in use during 3Q (Personal Services segment)
Smart Network Accelerating data offloading
through Multi-network development

(Launched February 2012)
(As of December 31, 2012)
1,650k units
0 3 6 9 12 15 18 21
0 3 6 9 12 15 18 21
19
220k spots
Data Offloading via Wi-Fi
Residential Area
Peak hour
(Hour)
Fast food, college/university, stadium, and others
(Hour) *Graph represents KDDI’s average hourly mobile data traffic.
(As of December 31, 2012)
Business Districts
Peak hour (Launched June 2011)
Mobile Data Traffic Trends by hour
Mobile Data Traffic Trends by hour
Station /Train
Commercial facility
Cafe Airport

20
20%
March 2012 June December March 2013
32% 43% Target for
50% 39%
September
Data Offloading Performance
Numerator:
Denominator: Definition
Data traffic during peak hour (11-12PM) over one month
Data offloading to Wi-Fi+WiMAX
Total smartphone data traffic (3G+Wi-Fi+WiMAX)
*"Wi-Fi" is a registered trademark of Wi-Fi Alliance®. *WiMAX is a trademark or a registered trademark of WiMAX Forum.

Performance in 1-3Q

Highlights of Performance in 1-3Q 22
YOY
Mobile Communications Revenues
Personal Services
Income growth realized over 1-3Q
Substantial income growth
+40%
Revenues growth realized
Overall communications revenues including fixed-line, up in 1-3Q
3Q (from October to December)
+1%
3Q (from October to December)
Consolidated Operating Income
YOY

Operating revenues 2,645.4 2,710.6 +2.5% 3,580.0 75.7%
Operating income 384.2 395.6 +3.0% 500.0 79.1%
Operating margin 14.5% 14.6% - 14.0% -
Ordinary income 364.7 394.0 +8.0% 490.0 80.4%
Net income 194.4 180.2 -7.3% 250.0 72.1%
EBITDA 701.2 716.7 +2.2% 974.0 73.6%
EBITDA margin 26.5% 26.4% - 27.2% -
Free cash flow 252.1 -43.8 - 150.0 -
Progressyoy FY13.3(Previous Forecast)
FY12.3
1-3Q
FY13.3
1-3Q
23
(Billions of yen)
Consolidated Performance

Operating revenues 99.1 104.9 +5.9% 164.0 64.0%
Operating income 33.8 31.0 -8.3% 45.0 69.0%
Operating margin 34.1% 29.6% - 27.4% -
EBITDA 38.5 38.1 -1.0% 57.0 66.8%
EBITDA margin 38.8% 36.3% - 34.8% -
FY12.3
1-3Q
FY13.3
1-3Q yoy FY13.3(Previous Forecast)
Progress
Operating revenues 2,080.1 2,107.7 +1.3% 2,760.0 76.4%
Operating income 284.1 291.8 +2.7% 370.0 78.9%
Operating margin 13.7% 13.8% - 13.4% -
EBITDA 553.5 560.0 +1.2% 767.0 73.0%
EBITDA margin 26.6% 26.6% - 27.8% -
FY13.3
1-3Q
FY12.3
1-3Q Progressyoy FY13.3(Previous Forecast)
24
Value Services
Personal Services
(Billions of yen)
(Billions of yen)
Segment Performance 1

Operating revenues 126.4 148.5 +17.5% 195.0 76.2%
Operating income 3.3 5.4 +64.3% 6.0 89.5%
Operating margin 2.6% 3.6% - 3.1% -
EBITDA 10.3 14.9 +45.7% 19.0 78.7%
EBITDA margin 8.1% 10.1% - 9.7% -
FY12.3
1-3Q
FY13.3
1-3Q Progressyoy FY13.3(Previous Forecast)
Operating revenues 469.3 470.3 +0.2% 630.0 74.6%
Operating income 58.0 60.1 +3.7% 71.0 84.7%
Operating margin 12.3% 12.8% - 11.3% -
EBITDA 93.4 96.2 +3.0% 122.0 78.9%
EBITDA margin 19.9% 20.5% - 19.4% -
FY12.3
1-3Q
FY13.3
1-3Q yoy FY13.3(Previous Forecast)
Progress
25
Global Services
Business Services
(Billions of yen)
(Billions of yen)
Segment Performance 2

26
1Q 2Q 3Q 4Q
140.1 126.7
117.5
93.4 94.2
137.0
164.3
3Q/FY2013.3 (From October to December)
¥164.3B
+40% YOY
(Billions of yen)
Left: FY2012.3/Right: FY2013.3
Consolidated Operating Income by Quarter

27
3Q/FY2012.3 3Q/FY2013.3
117.5
164.3
+4.6
+11.1
+46.9
(Personal Services) Mobile communications
revenues
(Personal Services) Fixed-line
communications revenues
Others
Higher communications revenues and elimination of bandwidth reorganization costs contributed
+15.7 +31.1
(Personal Services) Elimination of bandwidth
reorganization costs
Of which, +18.0
(Billions of yen)
Consolidated Operating Income: Factor for Increase in 3Q YOY
Communications revenues

Strong Operating Results
Progress of Focus KPI

29
0.79%
1.06%
1Q 2Q 3Q 4Q 1Q 2Q 3Q
Maintaining lowest rate
in the industry
SOFTBANK MOBILE
NTT DOCOMO
FY2012.3 FY2013.3
0.58%
au Churn Rate
Quarterly Basis
Personal Services
*au churn rate is calculated for ordinary handsets based on Personal Services segment, which exclude module-type terminals. *Based on financial results materials, etc. of each company.
30
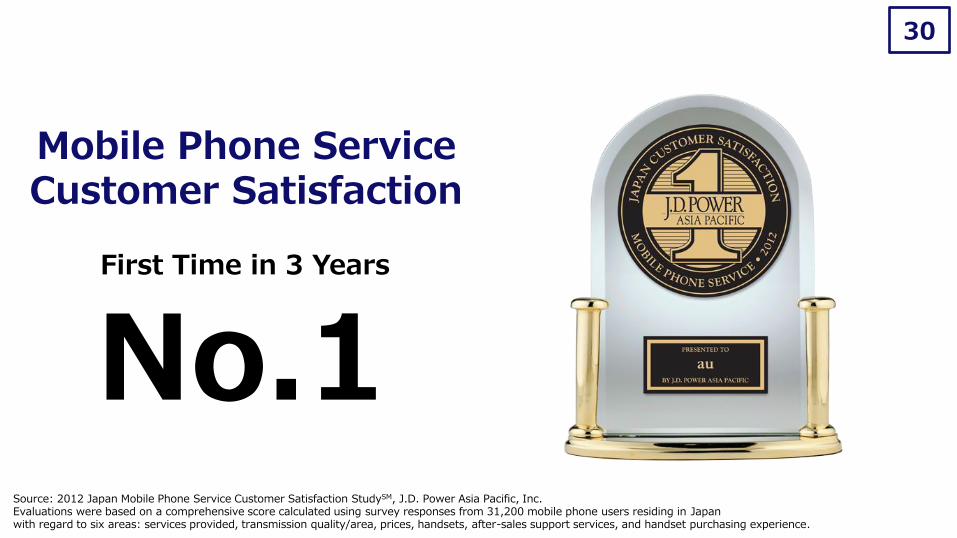
Mobile Phone Service Customer Satisfaction
First Time in 3 Years
No.1 Source: 2012 Japan Mobile Phone Service Customer Satisfaction StudySM, J.D. Power Asia Pacific, Inc. Evaluations were based on a comprehensive score calculated using survey responses from 31,200 mobile phone users residing in Japan with regard to six areas: services provided, transmission quality/area, prices, handsets, after-sales support services, and handset purchasing experience.

31
SOFTBANK MOBILE
NTT DOCOMO
FY2012.3 FY2013.3
0
200k
-100k
100k
-200k
Period: from October 2010 to December 2012
No.1 for 15 consecutive
months
Monthly Basis
from October 2011
Consolidated
MNP Net Additions
*Created by KDDI based on telecommunications sector analyst reports, etc.

32
(‘000) 1-3Q YOY Comparison
9 times YOY
Consolidated
FY2012.3 FY2013.3
82
742 MNP Net Additions (1-3Q)
Exceeded

FY2012.3 FY2013.3
1.30 1.71
0.81
33
2.11 2.10 (Previous F)
+32% YOY
Rate of progress toward FY2013.3 targets: 81%
YOY Change
1-3Q
4Q
Consolidated
(Million subs)
au Net Additions (1-3Q)

34
4,670 4,620 4,490 4,370 4,240 4,240 4,220 4,160
220 260 280 270 250 240 240 280
FY2012.3 FY2013.3
4,890 4,880 4,770 4,640 4,490 4,480
2Q 1Q 4Q 3Q 2Q 1Q
4,440 4,460
3Q
Personal Services
Value Services
Full-year (Previous F)
Value ARPU
au ARPU
(yen)
3Q: down 6.5% YOY
au ARPU/Value ARPU

35
-90 -170 -260 -380 -520 -580 -680 -670
2,350 2,310 2,220 2,140 2,040 2,030 2,020 1,930
2,410 2,480 2,530 2,610 2,720 2,790 2,880 2,900
FY2012.3 FY2013.3
4,670 4,620 4,490 4,370 4,240 4,240
2Q 1Q 4Q 3Q 2Q 1Q
4,160 4,220
3Q
Personal Services
Full-year (Previous F)
Data
Voice (before application of discount)
Amount of discount applied
(yen)
Improvement accelerates
3Q: down 6.0% YOY
Break Down of au ARPU

36
5.0%
2.4%
1Q 2Q 3Q 4Q 1Q 2Q 3Q
SOFTBANK MOBILE
NTT DOCOMO
FY2012.3 FY2013.3
+13.8%
Data ARPU
Rise Ratio of Data ARPU (YOY)
*Based on financial results materials, etc. of each company. Figures for NTT DOCOMO based on former definition of data ARPU used in materials disclosed up until 1Q of FY2013.3.
Personal Services
No.1 Growth
3Q/FY2013.3: ¥2,880
37
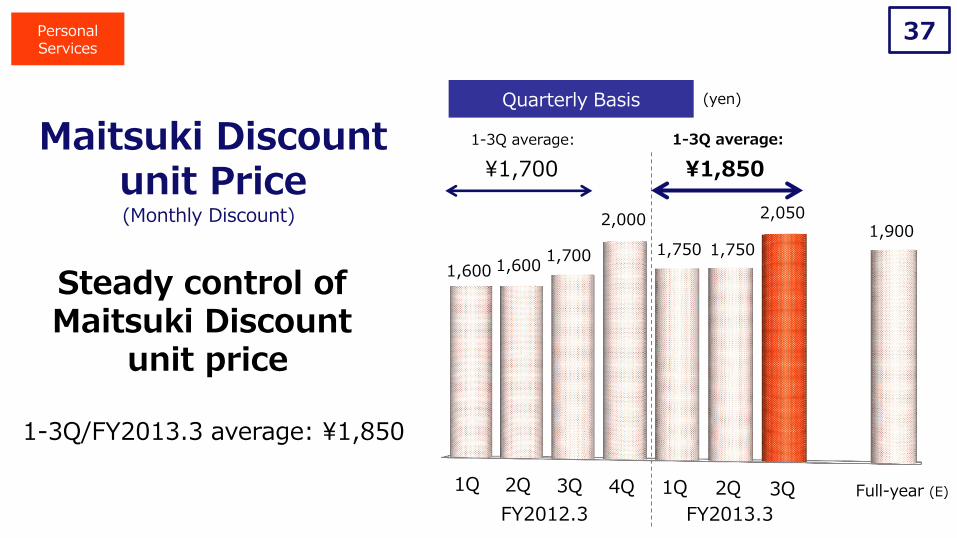
1Q 2Q 3Q 4Q 1Q 2Q 3Q
1,600 1,600 1,700
2,000
1,750 1,750
2,050 1,900
FY2012.3 FY2013.3
Maitsuki Discount unit Price
(yen)
¥1,850 ¥1,700
Quarterly Basis
Personal Services
Full-year (E)
Steady control of Maitsuki Discount
unit price
1-3Q/FY2013.3 average: ¥1,850
1-3Q average: 1-3Q average:
(Monthly Discount)

Growth in Communications Revenues Realized

39
1Q 2Q 3Q 4Q
404.3
401.9
393.5 391.4
FY2012.3
1Q 2Q 3Q 4Q
387.2
392.2
FY2013.3
398.2
Mobile Communications
Revenues
Quarterly Basis
YOY growth in revenues
3Q: +1.2%
Personal Services
(Billions of yen)
▲4.2%
▲2.4%
+1.2% YOY

40
1Q 2Q 3Q 4Q
28.2 29.4 30.7 32.4
FY2012.3
1Q 2Q 3Q 4Q
36.2 38.8 41.2
FY2013.3
93.6
79.8 81.4 82.6 84.0
87.6 88.9
FTTH
Others
FTTH Others (Cable-plus phone, CATV, Metal-plus, etc.)
Greater revenues increases
Strong rise in FTTH contracts drove revenues growth
Personal Services
Fixed-line Communications
Revenues
Quarterly Basis (Billions of yen)

41
1Q 2Q 3Q 4Q
404.3 401.9 393.5 391.4
79.8 81.4 82.6 84.0
FY2012.3
1Q 2Q 3Q 4Q
387.2 392.2 398.2
87.6 88.9 93.6
FY2013.3
Revenues growth realized in 1-3Q
(Mobile & Fixed-line)
484.1 475.4 483.4 476.1 474.7 481.0
491.8
Mobile
Fixed -line
Transform into a business growth driver for next fiscal year and onward
Personal Services
Total Amount of Communications
Revenues
1,443.6 1,447.6 (+0.3%)
Quarterly Basis (Billions of yen)

Revision of Full-year Results Forecasts

Summary of Revisions 43
Operating revenues and operating income forecasts raised to reflect strong operating results
¥3,630.0B
Consolidated Operating Revenues
(+¥50.0B) ¥505.0B (+¥5.0B)
Consolidated Operating Income
au Net Additions
au Handset Sales
Consolidated
au subs Households
2.42M (+0.32M)
11.00M (+0.60M)
3.60M (+0.50M)
Of Smartphone Sales
8.00M
au Smart Value
2.00M (+0.45M) (+0.45M)
Personal Services
Figures in parentheses are comparisons with previous forecasts.

Operating revenues 3,580.0 3,630.0 +50.0 +1.4%
Operating income 500.0 505.0 +5.0 +1.0%
Operating margin 14.0% 13.9% -0.1% -
Ordinary income 490.0 500.0 +10.0 +2.0%
Net income 250.0 235.0 -15.0 -6.0%
EBITDA 974.0 954.0 -20.0 -2.1%
EBITDA margin 27.2% 26.3% -0.9% -
Free cash flow 150.0 68.0 -82.0 -54.7%
Previous
Forecast
Latest
ForecastChange Change rate
44
(Billions of yen)
Consolidated Performance Forecasts (Rev.)

Operating revenues 164.0 139.0 -25.0 -15.2%
Operating income 45.0 40.0 -5.0 -11.1%
Operating margin 27.4% 28.8% +1.3% -
EBITDA 57.0 50.0 -7.0 -12.3%
EBITDA margin 34.8% 36.0% +1.2% -
Change Change ratePrevious
Forecast
Latest
Forecast
Operating revenues 2,760.0 2,820.0 +60.0 +2.2%
Operating income 370.0 372.0 +2.0 +0.5%
Operating margin 13.4% 13.2% -0.2% -
EBITDA 767.0 745.0 -22.0 -2.9%
EBITDA margin 27.8% 26.4% -1.4% -
Change Change ratePrevious
Forecast
Latest
Forecast
45
Value Services
Personal Services
(Billions of yen)
(Billions of yen)
Performance Forecast by Segment 1 (Rev.)

Operating revenues 195.0 206.0 +11.0 +5.6%
Operating income 6.0 8.0 +2.0 +33.3%
Operating margin 3.1% 3.9% +0.8% -
EBITDA 19.0 20.0 +1.0 +5.3%
EBITDA margin 9.7% 9.7% -0.0% -
Latest
Forecast
Previous
ForecastChange Change rate
Operating revenues 630.0 634.0 +4.0 +0.6%
Operating income 71.0 77.0 +6.0 +8.5%
Operating margin 11.3% 12.1% +0.9% -
EBITDA 122.0 127.0 +5.0 +4.1%
EBITDA margin 19.4% 20.0% +0.7% -
Change Change ratePrevious
Forecast
Latest
Forecast
46
Global Services
Business Services
(Billions of yen)
(Billions of yen)
Performance Forecast by Segment 2 (Rev.)

Summary 47
Advance to income growth phase starting next fiscal year
Strengthen competitiveness of mobile and FTTH services through the 3M Strategy
Definitely surpass full-year operating income goal of ¥500.0B
Realized growth in communication revenues of Personal Services segment

48
Reduce share-trading units to expand investor base
Stock Split
Overview of Stock Split
1:2 stock split
:March 31, 2013
Individual Investor Percentages for KDDI and TOPIX Core 30
TOPIX Core 30 average
17.3%
3.9%
*Figures in parentheses represent the percentage of shares held by private investors.
【Year-end dividends for FY2013.3】 As the effective date for the stock split is April 1, 2013, year-end dividends for FY2013.3 will be based on stocks before the split.
:April 1, 2013
Increasing individual investors is essential
(Shares of KDDI stock will be issued at a ratio of 1:2)
* Calculated by KDDI based on data for each company at the end of FY2011
Record date
Effective date

Appendix

3/'12 12/'12 Change 3/’13(E)
【Utilizing au Smart Value】
au subscriptions
【Utilizing au Smart Value】
Households
au Smart Pass members '000 560 3,980 +3,420 5,000
'000
'000 +1,220
3,600
2,000
+2,190660
440
2,850
1,660
3/'12 12/'12 Change 3/’13(E)
Data offload rate % 20 43 +23 50
12.3/1-3Q 13.3/1-3Q Change 13.3(E)
Smartphone sales '000 - 263 - 450
12.3-3Q 13.3-3Q Change 13.3(E) yoy
au churn rate % 0.52 0.58 +0.06 0.61 -
au ARPU yen 4,490 4,220 -270 4,160 -6.0%
Value ARPU yen 280 240 -40 240 -14.3%
50
Personal Services
& Value
Services
Business Services
-
Changes in Focus KPI in FY2013.3
*Figures under 13.3(E) and 3/’13(E) reflect latest forecasts.

Previous Forecast Latest Forecast Change Change rate
au ARPU yen 4,160 4,160 - -
Value ARPU yen 280 240 -40 -14.3%
au handset sales '000 10,400 11,000 +600 +5.8%
of smartphone sales '000 7,550 8,000 +450 +6.0%
au handset shipments '000 10,100 10,300 +200 +2.0%
【Utilizing au Smart Value】
au subscriptions
【Utilizing au Smart Value】
Households
au Smart Pass members '000 5,000 5,000 - -
'000 3,100 3,600 +500 +16.1%
'000 1,550 2,000 +450 +29.0%
Previous Forecast Latest Forecast Change Change rate
au Net Additions '000 2,100 2,420 +320 +15.2%
51 Forecasted KPI Changes (Rev.)
Personal Services
& Value
Services
Consolidated
* Only items for which forecasts were revised are presented. (However, au ARPU and au Smart Pass members are unchanged.) * Figures for au subscriptions and households utilizing au Smart Value as well as au Smart Pass members are forecasts for March 31, 2013.

52
1Q 2Q 3Q 4Q 1Q 2Q 3Q
49.3 63.9 79.3 111.5
68.2 82.9 84.5 26.9
27.9 24.3
36.5
31.4 32.6 30.2
FY2011.3 FY2012.3 FY2013.3
338.7 304.2
350.0
103.1 115.6
99.0
1-3Q/FY2013.3: ¥330.4B (+¥57.5B, YOY/Progress 73.4%)
443.7 421.6
450.0
76.9 92.2
103.9
148.6
99.9 115.6
(Billions of yen)
(Billions of yen)
FY2013.3 FY2012.3
(E)
Fixed-line
Mobile
Quarterly Basis
Full-year Basis
115.0
Consolidated Capital Expenditures

53
1Q 2Q 3Q 4Q
353 306
639
811
566
435
707
3/'11 9/'11 3/'12 9/'12
33.00 33.35 33.66
34.30 35.11 35.68 36.11 36.82
(Million subs) (‘000)
Left: FY2012.3/Right: FY2013.3
au Net Additions au Subscriptions
12/’12
Consolidated au Net Additions/au Subscriptions

54
1Q 2Q 3Q 4Q 1Q 2Q 3Q
0.64 1.21 1.55
2.01 1.67 1.81
2.30
FY2012.3 FY2013.3
24,000 22,000
24,000 25,000
26,000 24,000
23,000 24,000
2.97 3.05 2.90 3.31
2.74 2.83
8.00
11.00
Full-year
(Bar graph: Million units/Line graph: yen)
Average au sales commissions/unit
au handset unit sold
Of which, smartphones
2.62
Personal Services
(Latest Forecast)
au Handset Sales/au Sales Commissions

55
(Million subs) (‘000)
Left: FY2012.3/Right: FY2013.3
1Q 2Q 3Q 4Q
78 78 93
103
173 167 150
3/'11 9/'11 3/'12 9/'12
1.87 1.95 2.03
2.12 2.22 2.39
2.56 2.71
FTTH Net Additions FTTH subscriptions
*FTTH net additions/FTTH subscriptions: Total for KDDI group’s FTTH services (au HIKARI, au HIKARI Chura, and Commuf@-hikari)
12/’12
Personal Services FTTH Net Additions/FTTH Subscriptions