KBC SMALL CAP CONFERENCE - recticel.com · polyurethane based rigid ... Global PU applications...
43
KBC Small Cap Conference – Brussels, 10 December 2015 1 KBC SMALL CAP CONFERENCE Olivier Chapelle – CEO Recticel Jean-Pierre Mellen – CFO Recticel Michel De Smedt – IRO Recticel Brussels, 10 December 2015
Transcript of KBC SMALL CAP CONFERENCE - recticel.com · polyurethane based rigid ... Global PU applications...

KBC Small Cap Conference – Brussels, 10 December 2015 1
139
145
146
0
171
169
97
176
73
255
139
0
254
203
0
127
127
127
KBC SMALL CAP CONFERENCE
Olivier Chapelle – CEO Recticel
Jean-Pierre Mellen – CFO Recticel
Michel De Smedt – IRO Recticel
Brussels, 10 December 2015

KBC Small Cap Conference – Brussels, 10 December 2015 2
139
145
146
0
171
169
97
176
73
255
139
0
254
203
0
127
127
127
Agenda
1 Introduction to the Recticel Group
2 Strategy
3 Key highlights 9M2015
4 Financial situation
5 Outlook Full Year 2015
6 9M2015 Comments per Business Line

KBC Small Cap Conference – Brussels, 10 December 2015 3
139
145
146
0
171
169
97
176
73
255
139
0
254
203
0
127
127
127
Recticel at a glance ► Recticel is an important innovator in the industry, being the European #1 & Worldwide #2 in polyurethane
applications
► Its activities are concentrated in Europe (94% of sales) and growing in Asia and USA
► Recticel generates, on a combined basis, sales of €1.28bn and REBITDA of €65.9m with 7,578 employees spread
over 99 locations in 27 countries
► 4 business lines serve Recticel’s key end-use markets (2014 combined figures):
► #2 European provider of
high performance,
polyurethane based rigid
thermal insulation boards for
the building market
► Portfolio of strong brands
Eurowall®, Powerdeck®,
Powerroof®, Powerwall®,
etc.
► Strong presence in Benelux,
France and UK
► Segment with high growth
potential
► #2 European provider of
mattresses and bed bases
► Ongoing development of
strong ingredient brands
such as GELTEX® inside
► Portfolio of strong local
brands such as
Schlaraffia®, Beka®,
Swissflex®, etc.
► Brands = 58% of sales
► #1 provider of comfort foams
and technical foams in
Western and Eastern
Europe
► Broad range of high value
added and differentiated
Technical Foams
applications
► Globally active in Technical
Foams (#1 in Europe)
► Interiors division is the sole
worldwide provider of
patented polyurethane
sprayed (Colo-Sense® Lite)
skins for car interiors
► Well positioned via Proseat
(51/49 joint venture) in the
European Seating foam and
trim parts markets, with
recent expansion in
lightweight EPP (expanded
polypropylene) parts
Sales: €227.0m
REBITDA: €27.1m
REBITDA margin: 11.9%
Sales: €281.60m
REBITDA: €13.5m
REBITDA margin: 4.8%
Sales: €593.0m
REBITDA: €27.7m
REBITDA margin: 4.7%
Sales: €264.0m
REBITDA: €14.9m
REBITDA margin: 5.6%

KBC Small Cap Conference – Brussels, 10 December 2015 4
139
145
146
0
171
169
97
176
73
255
139
0
254
203
0
127
127
127
Leading player offering specific polyurethane solutions to global
customers Global polyurethane markets¹
Global production of polyurethane¹
1. Prognosis 2014 in volumes – source Ceresana
46%
26%
19%
4% 3% 2%
Asia-Pacific
Europe
North America
South America
Middle East
Africa
► Global PU applications market of €50bn
► Worldwide annual PU raw materials consumption of ~13.5
million tons
► Highly attractive PU applications market:
Broad and diversified end-markets
Large markets which are regionally driven due to
high transportation costs
PU is versatile material with high performance
characteristics, enabling value enhancing solutions
Global and long-term mega trends driving several PU
applications:
• Environmental protection
• Energy conservation
• Increasing consumer appetite for premium quality
and comfort
Recticel is an important innovator in the industry,
being the European #1 & Worldwide #2 in
polyurethane applications
28%
26% 17%
12%
17%
Furniture
Construction
Industry
Transportation
Others

KBC Small Cap Conference – Brussels, 10 December 2015 5
139
145
146
0
171
169
97
176
73
255
139
0
254
203
0
127
127
127
Production process serving all 4 business lines ► Type and characteristics of final products depend on the manufacturing process:
Laminated foaming resulting in rigid foam panels
Traditional foaming of raw materials resulting in flexible foam blocks or moulded parts
Sprayed raw materials forming PU elastomers
Rigid foams Flexible foams Spray
Blocks Panels Blocks Moulding
Conversion
1 2 3
Conversion
1
2
3

KBC Small Cap Conference – Brussels, 10 December 2015 6
139
145
146
0
171
169
97
176
73
255
139
0
254
203
0
127
127
127
Significant synergies within the Group
► Centralized R&D as a platform for innovations in multiple segments
► Sharing of experience and know-how in both foam manufacturing and converting leading to cross-fertilization
throughout the organization
Strong technology synergies throughout the organization 1
► Broad supplier-customer internal relationship and sharing of production sites between Bedding and Flexible
Foams leads to faster innovation
► Strong product synergy between Insulation and Flexible Foams for acoustic combined with thermal insulation
High level of complementarity between business lines 2
► Centralized purchasing organization leveraging the size of the Group
► Purchasing synergies particularly realized in the sourcing of chemical raw materials (polyols and isocyanates)
Central purchasing leading to increased purchasing power 3
► Foam waste from the conversion process is recycled and subsequently compounded for use in many
applications and markets
Recycling within the different production processes leading to additional benefits 4

KBC Small Cap Conference – Brussels, 10 December 2015 7
139
145
146
0
171
169
97
176
73
255
139
0
254
203
0
127
127
127
Agenda
1 Introduction to the Recticel Group
2 Strategy
3 Key highlights 9M2015
4 Financial situation
5 Outlook Full Year 2015
6 9M2015 Comments per Business Line

KBC Small Cap Conference – Brussels, 10 December 2015 8
139
145
146
0
171
169
97
176
73
255
139
0
254
203
0
127
127
127
Strategy focused on being the leading provider of high value
added solutions in its core markets… ► The building blocks of the Group’s strategy are illustrated as follows:
► Overall group wide strategic priorities supported by specific business line strategy:
Innovation in high value added applications, products and materials
Overall simplification of the Group and finalizing the rationalization of the manufacturing footprint
Pursue prudent international expansion outside Europe
Integration of sustainable development criteria in all business decisions
Business Line Strategy
Simplification International Expansion Innovation
Sustainability

KBC Small Cap Conference – Brussels, 10 December 2015 9
139
145
146
0
171
169
97
176
73
255
139
0
254
203
0
127
127
127
…implemented through a thorough business line
assessment… ► The strategic plan prioritizes resource allocation
based on the relative attractiveness of the end-
markets and the competitive strength of the
Group in each market
Grow
Improve profitability through efficiency +
Selective growth
Considered non-core
Business Line Strategy
Simplification International
Expansion Innovation
Sustainability

KBC Small Cap Conference – Brussels, 10 December 2015 10
139
145
146
0
171
169
97
176
73
255
139
0
254
203
0
127
127
127
►Growth through international expansion, innovation and the Growth through international expansion, innovation and the introduction of new products, modules and distribution channels, supported by capacity expansion, selective growth initiatives and acquisitions. ►introduction of new products, modules and distribution channels, supported by capacity expansion, selective growth initiatives and acquisitions.
…leading to differentiated business line strategies
► Strong growth driven by:
Innovation and introduction of new products
Development of new and complementary distribution channels
Organic growth potentially coupled with complementary acquisitions
International expansion, primarily in Europe
► Improvement of profitability through operational efficiency and industrial footprint
optimization
► Organic growth through strong product innovation and the right marketing and brand
strategy
► Improvement of profitability through operational efficiency and industrial footprint
optimization
► Selective growth initiatives based on capacity expansion in Eastern Europe
► New products and further geographical expansion in higher added value Technical
Foams
► Enhancement of profitability through operational excellence and technological
leadership
► Fully leveraging the existing production capacity
► Tight investment control
Insulation
Bedding
Flexible Foams
Automotive
Business Line Strategy
Simplification International
Expansion Innovation
Sustainability

KBC Small Cap Conference – Brussels, 10 December 2015 11
139
145
146
0
171
169
97
176
73
255
139
0
254
203
0
127
127
127
Large number of recent innovations and product
launches in the Insulation business line
Business Line Strategy
Simplification International
Expansion Innovation
Sustainability
► Product line Home® (all-in-one isolation
system for DIY)
► Lambda-21 Eurowall (new generation of
PIR panels offering a 10% improvement in
thermal insulation)
► Iso-finish® (external insulation concept)
► Glow: ETICS (external thermal insulation
composite systems)
► L-MentsTM (fully integrated and self-supporting thermal insulation structures for pitched roofs)

KBC Small Cap Conference – Brussels, 10 December 2015 12
139
145
146
0
171
169
97
176
73
255
139
0
254
203
0
127
127
127
Launch of GELTEX® inside, the largest and most
important innovation of the last decade in Bedding
Business Line Strategy
Simplification International
Expansion Innovation
Sustainability
► GELTEX® inside combines optimal pressure distribution,
ideal support and maximum permeability/climate control
properties

KBC Small Cap Conference – Brussels, 10 December 2015 13
139
145
146
0
171
169
97
176
73
255
139
0
254
203
0
127
127
127
New generation of foams launched within the
Flexible Foams business line
Business Line Strategy
Simplification International
Expansion Innovation
Sustainability
► New acoustic foams leading to new contracts
for Boeing and SpaceX
► Development of new comfort foams:
GELTEX® and angelpearl® for the bedding
sector

KBC Small Cap Conference – Brussels, 10 December 2015 14
139
145
146
0
171
169
97
176
73
255
139
0
254
203
0
127
127
127
Launch of Colo-sense® Lite, a new high
performance skin, in the automotive business line
Business Line Strategy
Simplification International
Expansion Innovation
Sustainability
► Colo-sense® Lite high performance skin allows for a
25% weight reduction, responding to the OEM’s
constant search for lighter products

KBC Small Cap Conference – Brussels, 10 December 2015 15
139
145
146
0
171
169
97
176
73
255
139
0
254
203
0
127
127
127
Overall simplification of the Group leading to
increased efficiency and reduced fixed costs
Business Line Strategy
Simplification International
Expansion Innovation
Sustainability
► # Locations:
36 locations closed or sold : 30 closed in
EU, 1 closed in USA and 5 sold in EU
Interiors -5, Proseat -5, Bedding -1,
Flexible Foams -23 and Insulation -2
► # Employees: expected < 7,500 employees
end 2015
► # Joint ventures: reduction from 22 to 12
► # Legal entities: reduction from 119 to 85
► # SKU’s reduction in most segments or
factories
► Procurement activities now centralized in a
Group Purchasing Organization
► Transactional accounting services now
optimized, standardized and centralized in a
European Shared Service Centre
► The Group is committed to continue its efforts
to streamline the organization
Further streamlining the Bedding and
Flexible Foams operations
Further optimization of central and
corporate functions (2015-2016)
Further work on standardization of
product ranges, rationalization customer
portfolio, number of joint ventures,
number of consolidated entities, ...
Realized streamlining 2010-2015 Future actions 2016-2017

KBC Small Cap Conference – Brussels, 10 December 2015 16
139
145
146
0
171
169
97
176
73
255
139
0
254
203
0
127
127
127
International expansion strategy backed by strong
market positions in Europe ► Recticel is a true international group pursuing further growth through international expansion
inside and outside Europe
Recently realized growth initiatives in some core European countries as well as outside Europe
Europe: France (Insulation), UK (Insulation) and Germany (Proseat)
China: Shengyang (Interiors), Beijing (Interiors), Ningbo (Interiors), Langfang (Interiors), Changchun
(Interiors) and Shanghai (Flexible Foams)
India: Mumbai (Flexible Foams) and Bangalore (Flexible Foams)
Turkey: Istanbul (Flexible Foams)
USA: Auburn Hills (Interiors), Tuscaloosa (Interiors), New-York (Flexible Foams) and San Diego
(Flexible Foams)
Pursue growth via international expansion, inside as well as outside Europe
Grow Insulation sales in regions/countries specifying and valuing high performance insulation materials
Expand Branded Bedding sales in countries valuing Recticel brands
Grow Technical Foams’ presence and activities outside Europe (USA and Asia)
Expand Interiors activities by following end-customers and OEM’s via a plant-in-plant concept (mainly
in China and Mexico)
Business Line Strategy
Simplification International
Expansion Innovation
Sustainability

KBC Small Cap Conference – Brussels, 10 December 2015 17
139
145
146
0
171
169
97
176
73
255
139
0
254
203
0
127
127
127
Embracing sustainability creates a significant competitive edge, reduces cost, fosters innovation and
thus creates value for all stakeholders
► Prioritizing investments in solutions fulfilling societal needs (e.g. insulation = energy saving)
► Managing production processes and supply chain efficiently to minimize raw material, energy & water
consumption, waste and transport
► R&D focused on sustainable innovations uncovering new solutions for the circular economy, including
chemistry research programmes with leading universities
► Operating to the highest standards of health, safety and environment for the wellbeing of all stakeholders
► Sustainability Report 2015 to be published in 2016
Embracing sustainability to create value for all
stakeholders
Business Line Strategy
Simplification International
Expansion Innovation
Sustainability
RECTICEL PRODUCTS HELP
AVOID 20x MORE CO2 EMISSIONS THAN THEIR OWN CO2 IMPACT

KBC Small Cap Conference – Brussels, 10 December 2015 18
139
145
146
0
171
169
97
176
73
255
139
0
254
203
0
127
127
127
Agenda
1 Introduction to the Recticel Group
2 Strategy
3 Key highlights 9M2015
4 Financial situation
5 Outlook Full Year 2015
6 9M2015 Comments per Business Line

KBC Small Cap Conference – Brussels, 10 December 2015 19
139
145
146
0
171
169
97
176
73
255
139
0
254
203
0
127
127
127
Successful capital increase of € 75.9 million (13 May 2015)
Divestment of 50% participation in joint venture KTII (Insulation) (February 2015)
Sales (9M2015) +5.1%, driven mainly by Insulation (+9.2%) and Bedding (+6.7%)
Further progress in the streamlining of the company drives efficiency gains
Reduced net financial debt and Gearing (net financial debt/equity) ratio
1
2
3
4
5
6
Operational issues in Flexible Foams (cfr 4Q2014) solved
Key highlights 9M2015

KBC Small Cap Conference – Brussels, 10 December 2015 20
139
145
146
0
171
169
97
176
73
255
139
0
254
203
0
127
127
127
Key market developments 9M2015
► Tailwinds
• € depreciation vs $ (-11%), £ (-9%) and Yuan (-8%), together with increasing volatility,
• Oil price decreased to 40$/bl leads to average raw material price reduction
• No inflation, except on labor ~2%
► Macro-environment
• Automotive : solid growth in Automotive EU and US, has compensated for collapse in
Russia and Brazil, China remaining stable,
• Construction only slightly positive in EU, with strong UK and weak France,
• Bedding and Furniture became slightly positive during the year with estimate y-o-y
growth of 1-2% in value
• Decreasing momentum in industrial sectors

KBC Small Cap Conference – Brussels, 10 December 2015 21
139
145
146
0
171
169
97
176
73
255
139
0
254
203
0
127
127
127
Development of building market in Europe 2011-2017F (%)*
* Euroconstruct June 2015
• New building activities in
Belgium and France
decreasing; growth is mostly
triggered by renovation
• Strong market growth in UK
Total building Total New Reno Forecast
2011 2012 2013 2014 2015 2016 2017
Austria 3,2 2,9 -2,0 0,1 0,6 0,6 0,5 1,1 1,6
Belgium 4,4 -0,5 -0,4 1,4 0,7 -1,3 2,6 1,9 2,0
Denmark 5,5 -5,5 -1,5 3,9 1,6 5,2 0,3 3,0 3,4
Finland 4,4 -4,2 -3,8 -0,9 0,2 -3,2 3,2 4,3 2,7
France 5,2 -0,8 -1,4 -4,7 -0,2 -1,4 0,8 3,4 2,8
Germany 5,2 -0,6 -0,3 2,6 1,3 3,1 0,4 0,7 0,0
Ireland -8,1 -13,5 5,0 10,4 10,1 11,6 8,0 19,9 10,2
Italy -2,2 -6,4 -2,7 -1,9 -0,4 -5,0 1,1 1,4 1,7
Netherlands -1,2 -8,5 -3,7 1,5 3,6 5,3 2,3 3,3 4,5
Norway 6,4 4,5 -0,8 0,1 1,7 -0,1 3,5 1,9 1,7
Portugal -10,9 -15,1 -13,6 -2,0 2,5 1,2 3,8 3,5 4,3
Spain -14,2 -25,6 -15,0 -3,4 1,2 0,3 2,2 4,6 6,2
Sweden 3,4 -4,6 2,7 8,3 7,8 13,3 4,1 -0,6 0,8
Switzerland 2,9 1,9 1,8 0,3 0,0 -0,7 1,1 -1,1 0,3
United Kingdom 0,6 -7,4 0,8 8,1 4,9 6,1 3,0 3,4 2,7
Western Europe (EC-15) 0,8 -5,0 -1,9 1,0 1,6 1,9 1,4 2,3 2,1
Czech Republic -0,9 -6,9 -6,0 3,5 4,0 3,0 5,6 3,9 4,6
Hungary -12,3 -1,9 -3,9 3,1 2,6 4,1 1,2 2,9 3,7
Poland 7,8 3,0 -1,4 4,5 4,7 5,3 3,4 2,8 5,2
Slovak Republic -3,2 -8,9 -8,3 -4,3 0,1 -2,1 4,3 -0,2 0,0
Eastern Europe (EC-4) 2,2 -1,0 -3,3 3,5 4,1 4,2 3,7 2,9 4,6
Euroconstruct Countries (EC-19)
0,9 -4,9 -2,0 1,1 1,8 2,1 1,5 2,3 2,2
New residential building markets have been negative in 2012 & 2013,
stabilised in 2014, and expected to grow slightly in 2015

KBC Small Cap Conference – Brussels, 10 December 2015 22
139
145
146
0
171
169
97
176
73
255
139
0
254
203
0
127
127
127
European Bedding markets have shrunk in value in 2013 and 2014.
Data only partially available for 2015, but slight growth expected
• Recticel gained market share in 2013 (we lost -5.5% compared to -7% in the market) and in 2014
(we lost -2% vs -2.7% in the market).
• Expecting to have gained market share in 2015
Bedding market (mattresses and bases), value development vs previous period, %
Country 2013 2014 2015 H1
DE * -7% 7% 4% BE 0% -2% n/a AT -3% -8% n/a CH ** -7% -1% -17% NL -4% -3% n/a FRA -1% 1% n/a Weighted Average -7% -2.7% n/a N.B. EBIA covers 78% of Recticel Bedding’s Core Markets (excl Poland and Nordics), but only 60% of all suppliers Sources: World Mattress Report 7/2015 and EBIA 9/2015 * Statistisches Bundesamt 2015 ** GfK 8/2015

KBC Small Cap Conference – Brussels, 10 December 2015 23
139
145
146
0
171
169
97
176
73
255
139
0
254
203
0
127
127
127
Automotive – EU28 new Passenger car registrations increased by 8.2% yoy
in 2015, but remained ~20% below 2007 October October %Change Jan - Oct Jan - Oct %Change
'15 '14 15/14 '15 '14 15/14
AUSTRIA 25,149 26,945 -6.7 262,342 264,308 -0.7
BELGIUM 39,474 38,115 +3.6 431,996 426,210 +1.4
BULGARIA 1,941 1,682 +15.4 19,022 16,832 +13.0
CROATIA 2,411 2,425 -0.6 30,760 29,819 +3.2
CYPRUS 905 707 +28.0 8,464 7,050 +20.1
CZECH REPUBLIC 19,658 17,791 +10.5 190,668 159,261 +19.7
DENMARK 16,872 16,366 +3.1 171,983 158,359 +8.6
ESTONIA 1,867 2,060 -9.4 17,529 18,024 -2.7
FINLAND 9,166 8,838 +3.7 91,895 91,925 -0.0
FRANCE 161,737 160,149 +1.0 1,583,172 1,497,464 +5.7
GERMANY 278,372 275,320 +1.1 2,686,310 2,556,991 +5.1
GREECE 4,946 6,003 -17.6 63,130 59,848 +5.5
HUNGARY 8,192 6,115 +34.0 63,491 55,496 +14.4
IRELAND 2,562 2,011 +27.4 123,660 95,162 +29.9
ITALY 132,929 122,445 +8.6 1,330,005 1,159,833 +14.7
LATVIA 1,291 1,207 +7.0 11,577 10,446 +10.8
LITHUANIA 1,576 1,252 +25.9 14,440 12,323 +17.2
LUXEMBOURG 4,398 4,522 -2.7 40,425 42,669 -5.3
NETHERLANDS 39,006 35,112 +11.1 340,057 319,168 +6.5
POLAND 29,062 28,690 +1.3 287,302 273,732 +5.0
PORTUGAL 13,696 11,795 +16.1 151,964 119,203 +27.5
ROMANIA 7,562 7,344 +3.0 64,401 58,908 +9.3
SLOVAKIA 6,691 7,282 -8.1 63,699 60,536 +5.2
SLOVENIA 6,123 5,697 +7.5 56,872 51,636 +10.1
SPAIN 80,055 76,073 +5.2 863,973 716,746 +20.5
SWEDEN 31,563 28,252 +11.7 280,216 250,888 +11.7
UNITED KINGDOM 177,664 179,714 -1.1 2,274,550 2,137,910 +6.4
EUROPEAN UNION1 1,104,868 1,073,912 +2.9 11,523,903 10,650,747 +8.2
EU152 1,017,589 991,660 +2.6 10,695,678 9,896,684 +8.1
EU123 87,279 82,252 +6.1 828,225 754,063 +9.8
ICELAND 808 551 +46.6 12,394 8,721 +42.1
NORWAY 13,197 12,963 +1.8 125,008 120,067 +4.1
SWITZERLAND 25,236 26,277 -4.0 264,829 245,413 +7.9
EFTA 39,241 39,791 -1.4 402,231 374,201 +7.5
EU + EFTA 1,144,109 1,113,703 +2.7 11,926,134 11,024,948 +8.2
EU15 + EFTA 1,056,830 1,031,451 +2.5 11,097,909 10,270,885 +8.1SOURCE: NATIONAL AUTOMOBILE MANUFACTURERS' ASSOCIATIONS

KBC Small Cap Conference – Brussels, 10 December 2015 24
139
145
146
0
171
169
97
176
73
255
139
0
254
203
0
127
127
127
Automotive – China new Passenger car registrations increased by 4% in
2015
Monthly passenger car sales in China from January 2014 to October 2015, by country of brand origin (in 1,000 units)
0
500
1000
1500
2000
2500
Jan '14 Feb '14 Mar '14 Apr '14 May '14 Jun '14 Jul '14 Aug '14 Sep '14 Oct '14 Nov '14 Dec '14 Jan '15 Feb '15 Mar '15 Apr '15 May '15 Jun '15 Jul '15 Aug '15 Sep '15 Oct '15
Sale
s in
1,0
00 u
nits
China Germany Japan United States South Korea France

KBC Small Cap Conference – Brussels, 10 December 2015 25
139
145
146
0
171
169
97
176
73
255
139
0
254
203
0
127
127
127
1H2015 : Sales +4.7%, REBITDA + 15.7%, REBIT +29.1%
in million EUR1H2014
(restated)11H2015 D
Flexible Foams 16,6 20,4 23,1%
Bedding 3,3 6,0 79,9%
Insulation 12,4 16,1 29,9%
Automotive 12,8 9,5 -25,3%
Corporate ( 8,0) ( 9,2) 14,1%
TOTAL COMBINED REBITDA 37,0 42,9 15,7%
1 Restated for IFRIC 21 and excluding the contribution of REBITDA by the joint venture
Kingspan Tarec Industrial Insulation, which was sold in February 2015

KBC Small Cap Conference – Brussels, 10 December 2015 26
139
145
146
0
171
169
97
176
73
255
139
0
254
203
0
127
127
127
3Q2015 and 9M2015 Trading Update
► Restated like-for-like1 3Q combined sales have increased by +5.9%; and 9M combined sales have
increased by +5.1%.
► All business lines have grown

KBC Small Cap Conference – Brussels, 10 December 2015 27
139
145
146
0
171
169
97
176
73
255
139
0
254
203
0
127
127
127
Agenda
1 Introduction to the Recticel Group
2 Strategy
3 Key highlights 9M2015
4 Financial situation
5 Outlook Full Year 2015
6 9M2015 Comments per Business Line
KBC Small Cap Conference – Brussels, 10 December 2015 28
139
145
146
0
171
169
97
176
73
255
139
0
254
203
0
127
127
127
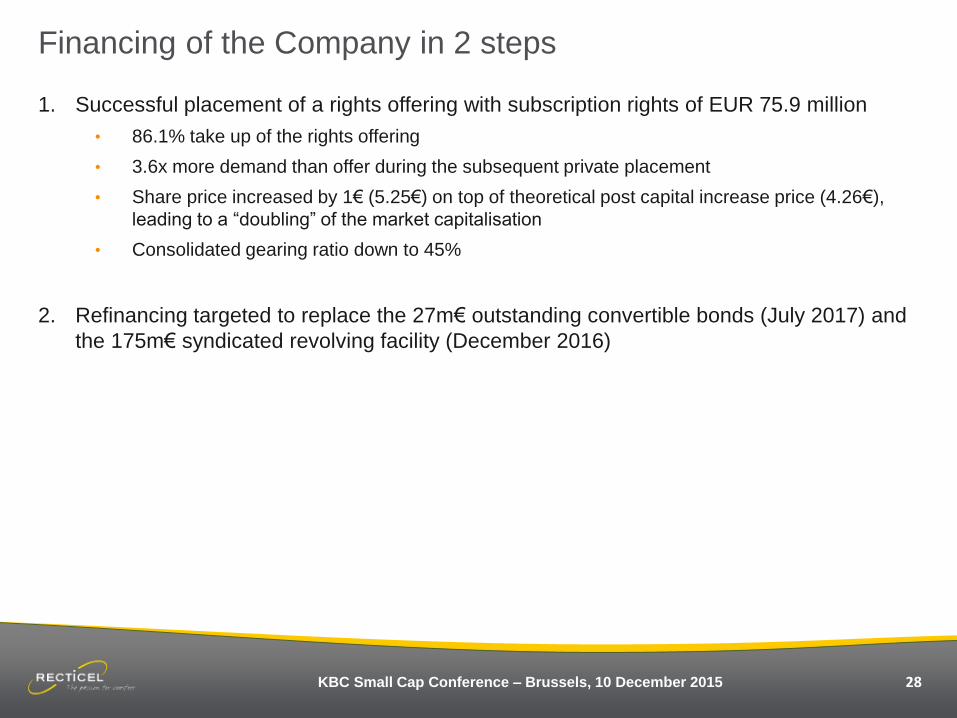
Financing of the Company in 2 steps
1. Successful placement of a rights offering with subscription rights of EUR 75.9 million
• 86.1% take up of the rights offering
• 3.6x more demand than offer during the subsequent private placement
• Share price increased by 1€ (5.25€) on top of theoretical post capital increase price (4.26€),
leading to a “doubling” of the market capitalisation
• Consolidated gearing ratio down to 45%
2. Refinancing targeted to replace the 27m€ outstanding convertible bonds (July 2017) and
the 175m€ syndicated revolving facility (December 2016)

KBC Small Cap Conference – Brussels, 10 December 2015 29
139
145
146
0
171
169
97
176
73
255
139
0
254
203
0
127
127
127
Use of proceeds of the net 73m€ proceeds of the rights issue
► Investment projects
Expansion and modernization of the Insulation factory in Wevelgem (Belgium) (2015-2016)
Continued investment in Bedding marketing and advertising (cfr GELTEX ® inside ingredient
brand) and product innovation
Expansion of Eurofoam’s Flexible Foams capacity in Romania (2015)
Expansion of foam converting operations in the USA (2015)
25%
► Streamlining of the organisation
Streamlining European Bedding organisation and footprint by 2017
Optimisation of the central and corporate functions in the period 2015-2016
25%
► Initial proceeds will be fully used to repay the revolving credit facility (lines remaining available
until December 2016) in order to reduce the gearing ratio, after which 50% will be used in ‘2’ and ‘3’ 50%
Strengthening Recticel’s balance sheet structure and decrease the gearing ratio 1
2 Engage in profitable growth projects and business opportunities in the various business lines
3 Finalize streamlining of industrial footprint and organization (2015-2017)
Settled in 2014 cartel investigations for a total cost of 40m€
6.5m€ paid in 2015 and 6.9m€ still payable in 2016, but already fully provisioned Past

KBC Small Cap Conference – Brussels, 10 December 2015 30
139
145
146
0
171
169
97
176
73
255
139
0
254
203
0
127
127
127
► Combined versus Consolidated net financial debt*
The decrease of the net financial debt is largely explained by the fact that the net proceeds of the right’s issue of May 2015
were used for the repayment of debt.
► Total financial debt per 30 September 2015
Consolidated financial debt amounted to EUR 160.5 million, including EUR 65.0 million factoring/forfeiting programs
Combined financial debt amounted to EUR 194.2 million, including EUR 71.1 million factoring/forfeiting programs
Lower net financial debt*, as a consequence of the capital increase
317,5 300,5
267,0 261,1
189,7
157,6 149,6 172,6 165,1
194,5
123,1 137,7 138,2
168,3
95,5
0
50
100
150
200
250
300
350
2005 2006 2007 2008 2009 2010 2011 2012 2013 2014 30Sep15
in m
illiio
n E
UR
Combined Consolidated
* Excluding the drawn amounts under non-recourse factoring/forfeiting programs
► Gearing ratio (net debt*-to-equity): The rights’ issue of May 2015 strengthened the company’s equity
position
Consolidated gearing ratio: from 101.3% (end 2014) to 45.0% (end June 2015)
Combined gearing ratio: from 117.1% (end 2014) to 55.1% (end June 2015)
* Excluding the drawn amounts under non-recourse factoring/forfeiting programs

KBC Small Cap Conference – Brussels, 10 December 2015 31
139
145
146
0
171
169
97
176
73
255
139
0
254
203
0
127
127
127
Agenda
1 Introduction to the Recticel Group
2 Strategy
3 Key highlights 9M2015
4 Financial situation
5 Outlook Full Year 2015
6 9M2015 Comments per Business Line

KBC Small Cap Conference – Brussels, 10 December 2015 32
139
145
146
0
171
169
97
176
73
255
139
0
254
203
0
127
127
127
Outlook
In the first nine months of 2015, Recticel experienced a more favorable business environment
which, supported by successful market initiatives and despite growing uncertainty and volatile
global economic context, will lead to combined sales growth for the full year 2015. Combined
REBITDA1 for the full year 2015 is expected to increase by about 15%.
1Excluding the contribution of the joint venture Kingspan Tarec Industrial Insulation (KTII), which was sold in February 2015.
KBC Small Cap Conference – Brussels, 10 December 2015 33
139
145
146
0
171
169
97
176
73
255
139
0
254
203
0
127
127
127
Agenda
1 Introduction to the Recticel Group
2 Strategy
3 Key highlights 9M2015
4 Financial situation
5 Outlook Full Year 2015
6 9M2015 Comments per Business Line
KBC Small Cap Conference – Brussels, 10 December 2015 34
139
145
146
0
171
169
97
176
73
255
139
0
254
203
0
127
127
127
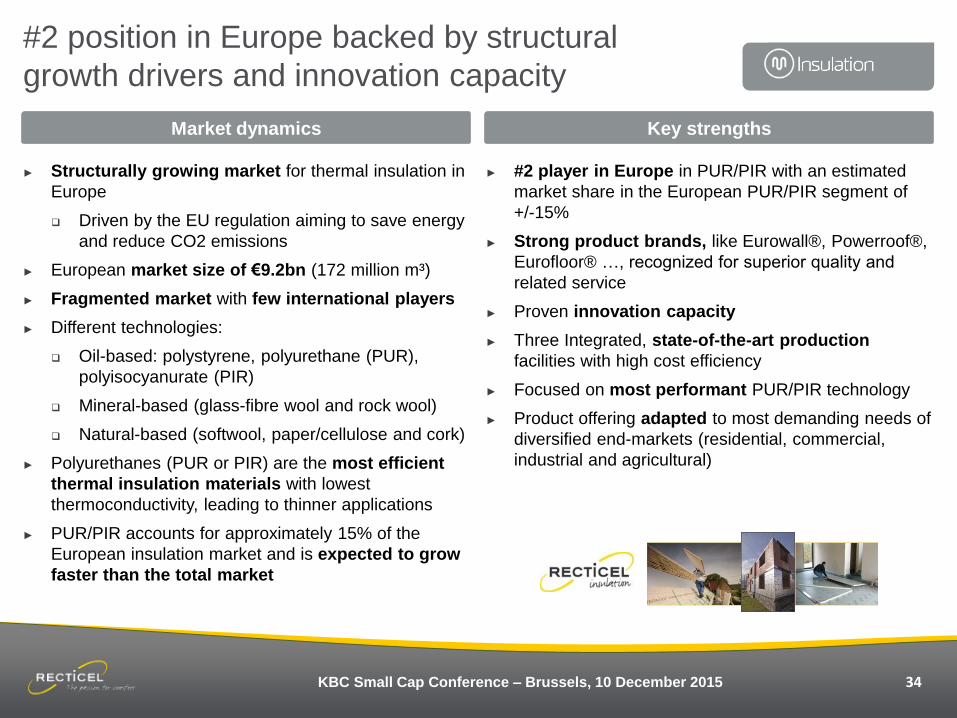
► Structurally growing market for thermal insulation in
Europe
Driven by the EU regulation aiming to save energy
and reduce CO2 emissions
► European market size of €9.2bn (172 million m³)
► Fragmented market with few international players
► Different technologies:
Oil-based: polystyrene, polyurethane (PUR),
polyisocyanurate (PIR)
Mineral-based (glass-fibre wool and rock wool)
Natural-based (softwool, paper/cellulose and cork)
► Polyurethanes (PUR or PIR) are the most efficient
thermal insulation materials with lowest
thermoconductivity, leading to thinner applications
► PUR/PIR accounts for approximately 15% of the
European insulation market and is expected to grow
faster than the total market
► #2 player in Europe in PUR/PIR with an estimated
market share in the European PUR/PIR segment of
+/-15%
► Strong product brands, like Eurowall®, Powerroof®,
Eurofloor® …, recognized for superior quality and
related service
► Proven innovation capacity
► Three Integrated, state-of-the-art production
facilities with high cost efficiency
► Focused on most performant PUR/PIR technology
► Product offering adapted to most demanding needs of
diversified end-markets (residential, commercial,
industrial and agricultural)
Market dynamics Key strengths
#2 position in Europe backed by structural
growth drivers and innovation capacity
KBC Small Cap Conference – Brussels, 10 December 2015 35
139
145
146
0
171
169
97
176
73
255
139
0
254
203
0
127
127
127
► Still relatively soft construction markets
► Price erosion in some of the most competitive
markets, compensated by cost reduction initiatives
and lower raw material prices
► Divestment in February 2015 of the 50% participation
in the joint venture Kingspan Tarec Industrial
Insulation (KTII) (capital gain: 1.6m€)
► 2015-2016: preparation of expansion of site in
Wevelgem (Belgium)
► Sales 3Q2015: €60.3m (+8.3%1), including positive
impact of currency exchange rate differences (+4.2%).
► Sales 9M2015: € 173.6m (+9.2%1), including positive
impact of currency exchange rate differences (+4.0%).
1 excluding the 50% participation in the KTII joint venture,
which was sold in February 2015
Key financials Recent developments
Financial performance driven by recent
product launches and expansion projects
3Q2015 trading update
in million € 1H2015 2014 2013 2012
Sales 113.3 227.0 220.0 220.7
REBITDA 16.1 27.1 27.7 36.0
as % of sales 14.2% 11.9% 12.6% 16.3%
REBIT 13.3 21.1 22.0 32.0
as % of sales 11.7% 9.3% 10.0% 14.5%
EBIT 14.9 21.1 21.9 31.8
as % of sales 13.1% 9.3% 10.0% 14.4%
Investments 3.6 6.2 4.8 25.9
as % of sales 3.2% 2.7% 2.2% 11.7%
30
35
40
45
50
55
60
65
1Q 2Q 3Q 4Q
in m
illio
n E
UR
Combined sales Insulation (2012-2015)
2012 2013 2014 2015
KBC Small Cap Conference – Brussels, 10 December 2015 36
139
145
146
0
171
169
97
176
73
255
139
0
254
203
0
127
127
127
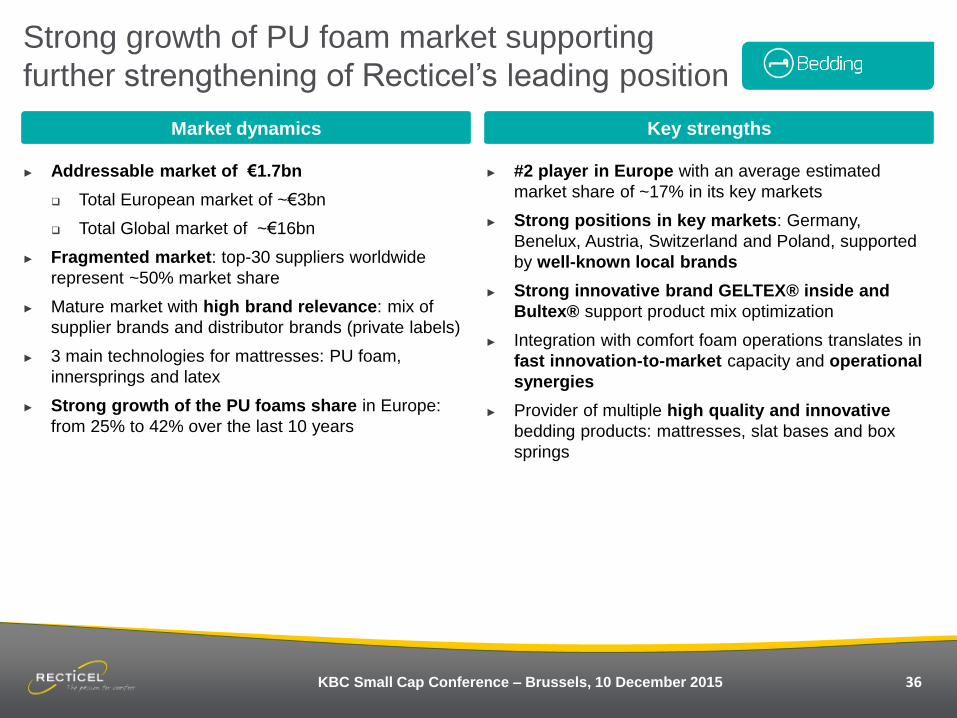
► Addressable market of €1.7bn
Total European market of ~€3bn
Total Global market of ~€16bn
► Fragmented market: top-30 suppliers worldwide
represent ~50% market share
► Mature market with high brand relevance: mix of
supplier brands and distributor brands (private labels)
► 3 main technologies for mattresses: PU foam,
innersprings and latex
► Strong growth of the PU foams share in Europe:
from 25% to 42% over the last 10 years
► #2 player in Europe with an average estimated
market share of ~17% in its key markets
► Strong positions in key markets: Germany,
Benelux, Austria, Switzerland and Poland, supported
by well-known local brands
► Strong innovative brand GELTEX® inside and
Bultex® support product mix optimization
► Integration with comfort foam operations translates in
fast innovation-to-market capacity and operational
synergies
► Provider of multiple high quality and innovative
bedding products: mattresses, slat bases and box
springs
Market dynamics Key strengths
Strong growth of PU foam market supporting
further strengthening of Recticel’s leading position

KBC Small Cap Conference – Brussels, 10 December 2015 37
139
145
146
0
171
169
97
176
73
255
139
0
254
203
0
127
127
127
► Sales 3Q2015: €73.1m (+8.4%), including positive
impact of currency exchange rate differences (+0.6%).
External sales increased by +9.5% to €68.5m.
► Sales 9M2015: €216.6m (+6.7%), including positive
impact of currency exchange rate differences (+1.0%).
External sales increased by +8.3% to €203.0m.
Brands: +9.7% supported by 19% growth of
GELTEX® inside products
Non-brands/Private label: +6.3%
► Successful commercial performance of innovative
GELTEX® inside products
► Improved product-mix due to further expansion of
Branded Products segment
► Sales growth rate significantly higher than
estimated market growth rates in reference markets
► Restructuring in Germany and The Netherlands
Key financials Recent developments
3Q2015 trading update
Successful introduction of GELTEX® inside as a
platform for future growth
in million € 1H2015 2014 2013 2012
Sales 143.5 281.6 283.0 276.5
REBITDA 6.0 13.5 12.8 13.9
as % of sales 4.2% 4.8% 4.5% 5.0%
REBIT 2.8 7.2 6.3 8.4
as % of sales 2.0% 2.5% 2.2% 3.0%
EBIT 1.9 (3.5) 3.8 6.5
as % of sales 1.3% (1.2%) 1.4% 2.4%
Investments 1.0 3.5 1.7 3.8
as % of sales 0.7% 1.3% 0.6% 1.4%
40
45
50
55
60
65
70
75
80
85
1Q 2Q 3Q 4Q
in m
illio
n E
UR
Combined Sales Bedding (2012-2015)
2012 2013 2014 2015
Brands 59%
Non-Brands & Private Label 41%
Combined sales 9M2015

KBC Small Cap Conference – Brussels, 10 December 2015 38
139
145
146
0
171
169
97
176
73
255
139
0
254
203
0
127
127
127
► European market of ~5.9m tons
Expected volume CAGR ‘11-’18 of +5%
► Very versatile material used in a wide variety of
applications
► Mainly used in furniture & upholstery ‘comfort’
applications (including Bedding) followed by
applications for the transport sector
► Competitive landscape in Europe characterized by:
8 players representing ~65% of the European
flexible foams market
And more than 50 other players
► #1 provider of comfort foams and technical foams in
Europe
► Proven innovation capacity related to development
of specific foam qualities for a variety of applications
► Strong presence in Central & Eastern Europe,
developed via the Eurofoam JV
► Capacity to increase global reach in Technical
Foams, through development of global key accounts
#1 position in Europe and recent innovations
adding to the capacity to increase global reach
Market dynamics Key strengths

KBC Small Cap Conference – Brussels, 10 December 2015 39
139
145
146
0
171
169
97
176
73
255
139
0
254
203
0
127
127
127
► Sales 3Q2015: €145.0m (+0.6%), including positive
impact of currency exchange rate differences (+0.6%).
External sales increased by +1.8% to €129.6m.
► Sales 9M2015: €450.9m (+1.9%), including positive
impact of currency exchange rate differences (+1.9%).
External sales increased by +2.5% to €406.8m.
Comfort: -0.6%
Technical Foams: +4.9%
Key financials Recent developments
3Q2015 trading update
New generation of innovative foam products
leading to important contract wins
in million € 1H2015 2014 2013 2012
Sales 305.9 593.0 583.4 588.3
REBITDA 20.4 27.7 30.3 29.2
as % of sales 6.7% 4.7% 5.2% 5.0%
REBIT 14.6 16.5 18.0 15.6
as % of sales 4.8% 2.8% 3.1% 2.7%
EBIT 13.3 13.2 (16.4) 9.0
as % of sales 4.3% 2.2% -2.8% 1.5%
Investments 4.3 10.3 11.0 10.9
as % of sales 1.4% 1.7% 1.9% 1.8%
► Improved product/market-mix (i.e. Technical Foams)
► Higher sales in non-European markets
► Restored industrial performance (cfr 4Q2014)
► Positive impact of cost management initiatives
► Lower raw material prices
► Reorganisation in Spain and Sweden
125
130
135
140
145
150
155
160
1Q 2Q 3Q 4Q
in m
illio
n E
UR
Combined Sales Flexible Foams (2012-2015)
2012 2013 2014 2015
Comfort 60%
Technical Foams
40%
Combined sales 9M2015

KBC Small Cap Conference – Brussels, 10 December 2015 40
139
145
146
0
171
169
97
176
73
255
139
0
254
203
0
127
127
127
► 2008-2010: Significant disruptions due to global
economic crisis
Industry is recovering and resuming growth
► Main drivers for OEM customers are cost
competitiveness of the products, maximum design
freedom and weight reduction
► Complex and high-demanding relationship between
customers, OEM’s and Tier1 / Tier2 suppliers
► Innovation driven sector
Interiors
► Unique patented Interiors technology (Colo-fast®
Spray and Colo-Sense® Lite) for the production of
light stable skins in PU for dashboards and door
panels
► Durability, high design freedom and best-in-class
gloss characteristics
► Strong position with premium OEM’s: Optimized
footprint to serve customers globally (Europe, China
and USA)
Proseat (JV)
► #2 European player
► One-stop-shop: moulded seat cushions, head and
arm rests, consoles, trim parts and lightweight EPP
(expanded polypropylene) parts
► Combining strength of 2 partners in chemical
engineering and process technology leads to strong
innovation capacity
Unique technology and strong position serving a
recovering industry
Market dynamics Key strengths

KBC Small Cap Conference – Brussels, 10 December 2015 41
139
145
146
0
171
169
97
176
73
255
139
0
254
203
0
127
127
127
► Sales 3Q2015: €65.1m (+8.7%)
Interiors: €27.4m (+14.1%)
Seating: €34.6m (+4.1%)
Exteriors: €3.0m (+16.5%).
► Sales 9M2015: €207.9m (+3.7%)
Interiors: €88.6m (+5.8%)
Seating: €110.0m (+1.2%)
Exteriors: €9.4m (+15.6%).
► As expected, higher start-up costs due to newly
acquired Interiors programs - with new production
sites in China (Changchun and Langfang)
► Seating: restructuring due to announced closure of
Rüsselsheim (Germany) plant and further
rationalisation of overheads
Key financials Recent developments
3Q2015 trading update
Recovering sales supported by strong order
books
in million € 1H2015 2014 2013 2012
Sales 142.9 264.0 258.4 289.7
REBITDA 9.5 14.9 18.8 24.2
as % of sales 6.7% 5.6% 7.3% 8.4%
REBIT 3.8 4.2 4.8 8.2
as % of sales 2.6% 1.6% 1.8% 2.8%
EBIT (0.1) 1.8 (5.3) 6.0
as % of sales -0.1% 0.7% -2.1% 2.1%
Investments 9.5 13.0 9.3 6.3
as % of sales 6.7% 4.9% 3.6% 2.2%
00
10
20
30
40
50
60
70
80
90
100
1Q 2Q 3Q 4Q
in m
illio
n E
UR
Combined sales Automotive (2012-2015)
2012 2013 2014 2015
Interiors 43%
Exteriors 4%
Seating 53%
Combined sales 9M2015

KBC Small Cap Conference – Brussels, 10 December 2015 42
139
145
146
0
171
169
97
176
73
255
139
0
254
203
0
127
127
127
Thank you for your attention!
Q&A
KBC Small Cap Conference – Brussels, 10 December 2015 43
139
145
146
0
171
169
97
176
73
255
139
0
254
203
0
127
127
127
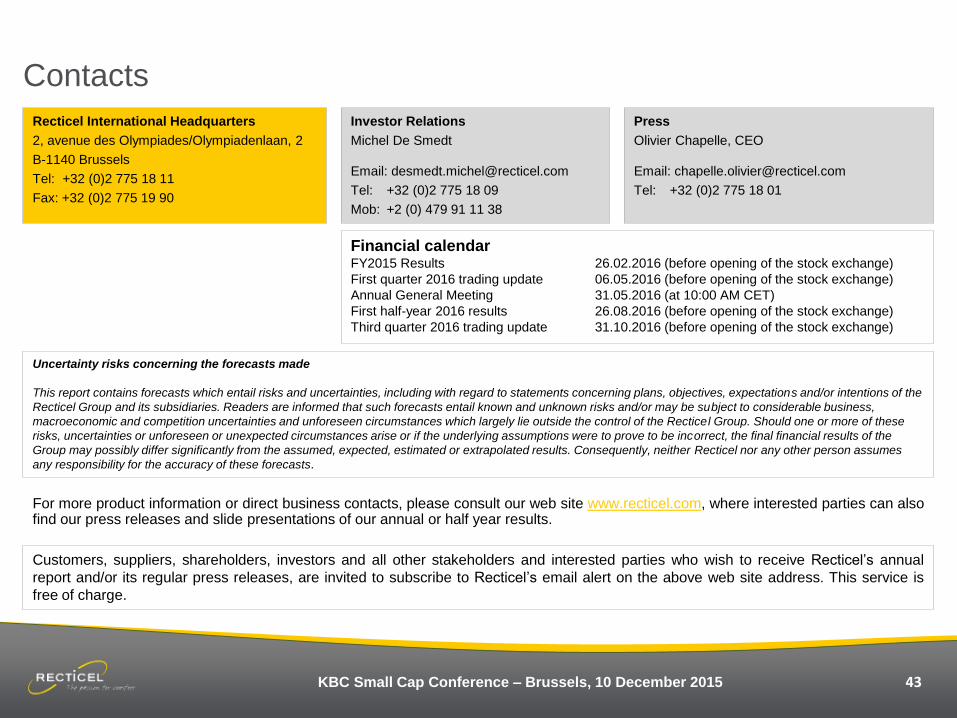
Contacts
Recticel International Headquarters
2, avenue des Olympiades/Olympiadenlaan, 2
B-1140 Brussels
Tel: +32 (0)2 775 18 11
Fax: +32 (0)2 775 19 90
For more product information or direct business contacts, please consult our web site www.recticel.com, where interested parties can also find our press releases and slide presentations of our annual or half year results.
Customers, suppliers, shareholders, investors and all other stakeholders and interested parties who wish to receive Recticel’s annual
report and/or its regular press releases, are invited to subscribe to Recticel’s email alert on the above web site address. This service is
free of charge.
Investor Relations
Michel De Smedt
Email: [email protected]
Tel: +32 (0)2 775 18 09
Mob: +2 (0) 479 91 11 38
Press
Olivier Chapelle, CEO
Email: [email protected]
Tel: +32 (0)2 775 18 01
Financial calendar FY2015 Results 26.02.2016 (before opening of the stock exchange)
First quarter 2016 trading update 06.05.2016 (before opening of the stock exchange)
Annual General Meeting 31.05.2016 (at 10:00 AM CET)
First half-year 2016 results 26.08.2016 (before opening of the stock exchange)
Third quarter 2016 trading update 31.10.2016 (before opening of the stock exchange)
Uncertainty risks concerning the forecasts made
This report contains forecasts which entail risks and uncertainties, including with regard to statements concerning plans, objectives, expectations and/or intentions of the
Recticel Group and its subsidiaries. Readers are informed that such forecasts entail known and unknown risks and/or may be subject to considerable business,
macroeconomic and competition uncertainties and unforeseen circumstances which largely lie outside the control of the Recticel Group. Should one or more of these
risks, uncertainties or unforeseen or unexpected circumstances arise or if the underlying assumptions were to prove to be incorrect, the final financial results of the
Group may possibly differ significantly from the assumed, expected, estimated or extrapolated results. Consequently, neither Recticel nor any other person assumes
any responsibility for the accuracy of these forecasts.