International presence of the KBC Group · International Factors KBC Asset Management KBC Bank KBC...
154
Annual Report 2001
Transcript of International presence of the KBC Group · International Factors KBC Asset Management KBC Bank KBC...
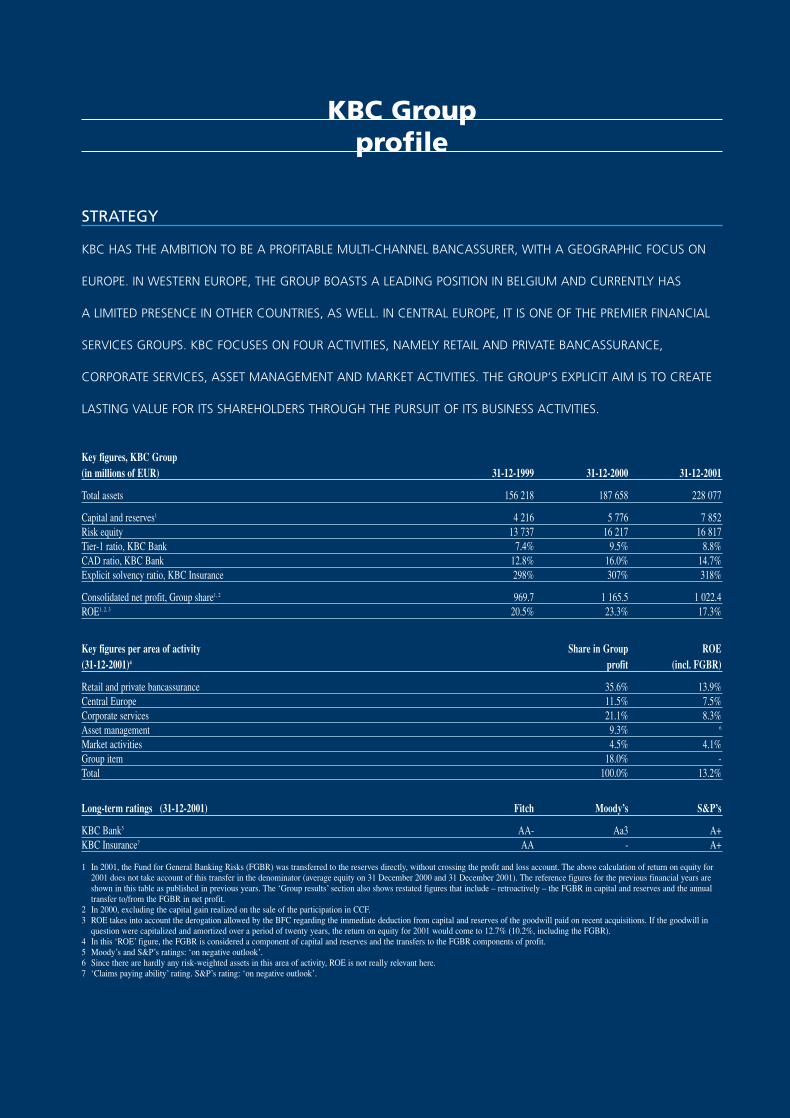
FIRST HOME MARKET:BELGIUM
ADDAlmariskAntwerpse DiamantbankCBC BanqueCentea & KrefimaFideaFin-ForceInternational FactorsKBC Asset ManagementKBC BankKBC Financial Products BrusselsKBC InvestcoKBC LeaseKBC SecuritiesKBC InsuranceSecura
SECOND HOME MARKET: CENTRAL EUROPE*
Agropolisa (Poland)Argosz (Hungary)CSOB (Czech Republic andSlovakia)CSOB Pojist’ovna (Czech Republic)
IPB Pojist’ovna (Czech Republic,since 2000)K&H Bank (Hungary)K&H Life (Hungary)Kredyt Bank (Poland)Patria Finance (Czech Republic)Warta (Poland)
REST OF EUROPE
Assurisk (Luxemburg)Banque Diamantaire Anversoise(Suisse) (Switzerland)FBD (Ireland)IIB Bank (Ireland)KBC Asset Management Limited(Ireland)KBC Bank (representative officesin Italy and Turkey; branches inIreland, the UK, France and theNetherlands; structured financeunits in the UK and Ireland; and a network desk at Banco Urquijoin Spain)KBC Clearing (Netherlands)KBC Bank Deutschland (Germany)KBC Finance Ireland (Ireland)KBC Financial Products (UK, France, Italy)
KBC InternationaleFinancieringsmaatschappij(Netherlands)KBC Lease (UK, Netherlands, France,Luxemburg, Germany)KBC Bank Nederland(Netherlands)KBC Peel Hunt (UK)KBC Securities (France,Netherlands)Lucare (Luxemburg)VITIS Life (Luxemburg)
OUTSIDE EUROPE
KBC Bank (representative officesin Iran and Mexico; a marketingoffice in Malaysia; branches in theUS, Singapore, Hong Kong,Taiwan, the Philippines, thePeople’s Republic of China,Malaysia and India; structuredfinance units in the US, Australiaand Hong Kong)KBC Bank Singapore (Singapore)KBC Financial Products (US, Japan, Hong Kong)KBC Securities (US)
International presence of the KBC Group
Annual Report 2001
2001 An
nu
al R
ep
ort
KBCBa
nk &
Insu
ran
ce
Gro
up
THIS TABLE PROVIDES AN OVERVIEW OF THE INTERNATIONAL NETWORK OF KBC BANK, AS WELL AS
THE MAIN SUBSIDIARIES, SUB-SUBSIDIARIES AND PARTICIPATING INTERESTS OF THE KBC GROUP IN
BELGIUM AND ABROAD.
* Via the representative offices and subsidiaries of CSOB and Kredyt Bank, KBC is also present in Russia, Lithuania and the Ukraine. At the beginning of 2002, the Slovenian government entered into exclusive negotiations with KBC regarding the acquisition of a 34% stake in Nova Ljubljanska banka.However, these negotiations were still ongoing at the time this annual report went to press.
KBC Group profile
STRATEGY
KBC HAS THE AMBITION TO BE A PROFITABLE MULTI-CHANNEL BANCASSURER, WITH A GEOGRAPHIC FOCUS ON
EUROPE. IN WESTERN EUROPE, THE GROUP BOASTS A LEADING POSITION IN BELGIUM AND CURRENTLY HAS
A LIMITED PRESENCE IN OTHER COUNTRIES, AS WELL. IN CENTRAL EUROPE, IT IS ONE OF THE PREMIER FINANCIAL
SERVICES GROUPS. KBC FOCUSES ON FOUR ACTIVITIES, NAMELY RETAIL AND PRIVATE BANCASSURANCE,
CORPORATE SERVICES, ASSET MANAGEMENT AND MARKET ACTIVITIES. THE GROUP’S EXPLICIT AIM IS TO CREATE
LASTING VALUE FOR ITS SHAREHOLDERS THROUGH THE PURSUIT OF ITS BUSINESS ACTIVITIES.
Key figures, KBC Group (in millions of EUR) 31-12-1999 31-12-2000 31-12-2001
Total assets 156 218 187 658 228 077
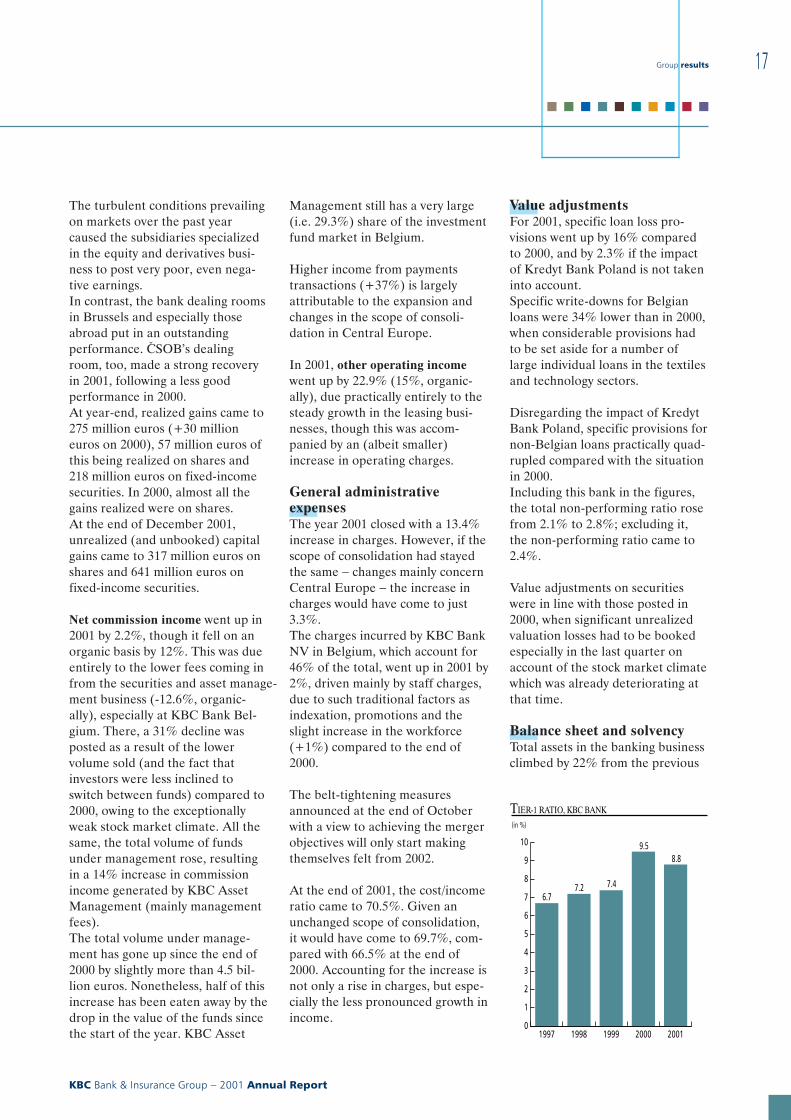
Capital and reserves1 4 216 5 776 7 852Risk equity 13 737 16 217 16 817Tier-1 ratio, KBC Bank 7.4% 9.5% 8.8%CAD ratio, KBC Bank 12.8% 16.0% 14.7%Explicit solvency ratio, KBC Insurance 298% 307% 318%
Consolidated net profit, Group share1, 2 969.7 1 165.5 1 022.4ROE1, 2, 3 20.5% 23.3% 17.3%
Key figures per area of activity Share in Group ROE(31-12-2001)4 profit (incl. FGBR)
Retail and private bancassurance 35.6% 13.9%Central Europe 11.5% 7.5%Corporate services 21.1% 8.3%Asset management 9.3% 6
Market activities 4.5% 4.1%Group item 18.0% -Total 100.0% 13.2%
Long-term ratings (31-12-2001) Fitch Moody’s S&P’s
KBC Bank5 AA- Aa3 A+KBC Insurance7 AA - A+
1 In 2001, the Fund for General Banking Risks (FGBR) was transferred to the reserves directly, without crossing the profit and loss account. The above calculation of return on equity for2001 does not take account of this transfer in the denominator (average equity on 31 December 2000 and 31 December 2001). The reference figures for the previous financial years areshown in this table as published in previous years. The ‘Group results’ section also shows restated figures that include – retroactively – the FGBR in capital and reserves and the annualtransfer to/from the FGBR in net profit.
2 In 2000, excluding the capital gain realized on the sale of the participation in CCF. 3 ROE takes into account the derogation allowed by the BFC regarding the immediate deduction from capital and reserves of the goodwill paid on recent acquisitions. If the goodwill in
question were capitalized and amortized over a period of twenty years, the return on equity for 2001 would come to 12.7% (10.2%, including the FGBR).4 In this ‘ROE’ figure, the FGBR is considered a component of capital and reserves and the transfers to the FGBR components of profit.5 Moody’s and S&P’s ratings: ‘on negative outlook’.6 Since there are hardly any risk-weighted assets in this area of activity, ROE is not really relevant here.7 ‘Claims paying ability’ rating. S&P’s rating: ‘on negative outlook’.
International presence of the KBC Group
At the beginning of 2002, the Slovenian government entered into exclusive negotiations with KBC regarding the acquisition of a 34% stake in Nova Ljubljanska banka.However, these negotiations were still ongoing at the time this annual report went to press.
USE OF THE ANNUAL REPORTFOR THE PROVISION OF INFORMATION VIA SEPARATE DOCUMENTS
On 27 March 2002, the Belgian Banking and Finance Commission granted the KBC Bank and Insurance Holding Company NV authorization touse the present annual report as a reference document to solicit savings from the public under Title II of Royal Decree No. 185 of 9 July 1935,by means of the procedure for the provision of information via separate documents, and this until such time as the KBC Bank and InsuranceHolding Company NV publishes its next annual report.For the purpose of the above procedure, this annual report must be accompanied by a transaction memorandum in order to constitute a pro-spectus in the sense of Article 29 of the Royal Decree referred to above.This prospectus will be submitted to the Banking and Finance Commission for approval in accordance with Article 29ter, §1, paragraph one,of Royal Decree No. 185 of 9 July 1935.
Annual Report 2001
THE
PIC
TURE
SIN
THIS
AN
NU
AL
REPO
RTW
ERE
USE
DIN
THE
AD
VER
TISI
NG
CA
MPA
IGN
LAU
NC
HED
BYTH
EKB
CBA
NK
&IN
SURA
NC
EG
ROU
PIN
2001
.
P IC
TURE
USE
DIN
THE
2001
KBC
IMA
GE
CAM
PAIG
N.
Report of the Board of Directors to the annual meeting of shareholders
" Statement by the Chairmanof the Board of Directors andthe President of the Executive Committee ............ 4
" Executive Committee .............................................. 7
" Strategy ................................................................... 8
Area of operation and activities ............................ 8Geographic focus .............................................. 8Focus on activities ............................................. 8Focus on clientele ............................................. 8
Financial targets for 2000-2004 ............................. 9Measures taken to meet the merger objectives .... 9
" Shareholder information ..................................... 10
Shareholders ......................................................... 10Annual return ....................................................... 10Ratings .................................................................. 10Key figures per share ............................................ 11Net asset value ...................................................... 11
" Group results ........................................................ 12
Key figures, KBC Group ...................................... 12Transfer of the fund for general banking risksto the reserves ....................................................... 12Consolidated balance sheet, KBC Group ........... 13Consolidated results, KBC Group ....................... 14Comments ............................................................. 15
General ............................................................ 15Operating activities − banking ....................... 16Operating activities − insurance .................... 18Holding-company activities ............................ 20Extraordinary result and taxation .................. 21Profit outlook .................................................. 21
Breakdown by area of activity .............................. 21
" Results and activities per business area ............. 24
Retail and private bancassurance ........................ 24Contribution to the result .............................. 24Highlights ........................................................ 25Key figures for the main subsidiaries ............ 30
Central Europe ..................................................... 31Contribution to the result .............................. 31Highlights ........................................................ 32Key figures for the main subsidiaries ............ 35
Corporate services ................................................ 36Contribution to the result .............................. 36Highlights ........................................................ 37Key figures for the main subsidiaries ............ 40
Asset management ............................................... 41Contribution to the result .............................. 41Highlights ........................................................ 42Key figures for the main subsidiaries ............ 44
Market activities ................................................... 45Contribution to the result .............................. 45Highlights ........................................................ 46Key figures for the main subsidiaries ............ 47
" Risk management ................................................. 48
Risk management within the Group ................... 48Risk management at KBC Bank .......................... 48
Counterparty risk ............................................ 48Country risk ..................................................... 53Internal credit risk models ............................. 55Market risks .................................................... 56Liquidity risk ................................................... 59
Risk management at KBC Insurance .................. 59Risk governance .............................................. 59Investment risks .............................................. 59Underwriting risks .......................................... 60Value management ......................................... 62
Operational risks .................................................. 62Internal Control Policy Manual ..................... 62Risk identification andmeasurement pilot project ............................. 62Further developments in 2002 ....................... 63
Compliance ........................................................... 63
Report of the Board of Directors to the annual meeting of shareholders
KBC Bank & Insurance Group − 2001 Annual Report
2
Table of contentsAnnual Report 2001
" Personnel .............................................................. 64
Personnel policy .................................................... 64Employee satisfaction ..................................... 64Negotiations with the social partners ............ 64Training ............................................................ 64Measures taken to complete the merger ....... 65
Staffing levels ........................................................ 65
" Group structure and corporate governance ....... 67
Group structure .................................................... 67Corporate Governance ......................................... 68
1 Management structure ................................ 682 Board of Directors ....................................... 683 Executive Committee .................................. 714 Committees set up by
the Board of Directors ................................. 725 Profit allocation policy ................................ 736 Relations with the principal shareholders .. 737 Appointments ............................................... 738 Prospects for the KBC Bank
and Insurance Holding Company ............... 739 Board of Directors of
KBC Bank and of KBC Insurance .............. 73Open communication with shareholders ............ 74
" Consolidated annual accounts − KBC Bank andInsurance Holding Company NV ........................ 78
Consolidated balance sheet afterprofit appropriation .............................................. 78Consolidated profit and loss account .................. 80Basis of consolidation and valuation rules:general principles ................................................. 82
Criteria for consolidation and for inclusionin the consolidated accounts according tothe equity method ........................................... 82Accounting principles and valuation rules:general principles ............................................ 85
Explanatory notes and comments ........................ 911 Balance sheet ............................................... 912 Profit and loss account .............................. 1113 Off-balance-sheet headings ....................... 1244 Miscellaneous ............................................. 129
Solvency ............................................................... 132KBC Bank ..................................................... 132KBC Insurance .............................................. 134
Statutory auditor’s report on the consolidatedfinancial statements ............................................ 135
" Company annual accounts − KBC Bank andInsurance Holding Company NV ...................... 136
Balance sheet, profit and loss account and profitappropriation ...................................................... 136Notes to the company annual accounts ............. 139General information ........................................... 142
" Additional information ...................................... 143
Financial snapshot 1997-2001 ............................ 143Quarterly results for 2000 and 2001 .................. 144Pending litigation ................................................ 145KBC and socially responsible business .............. 146Information for shareholders and the generalpublic ................................................................... 148
Report of the Board of Directors to the annual meeting of shareholders
KBC Bank & Insurance Group − 2001 Annual Report
3
■ ■ ■ ■ ■ ■ ■ ■ ■ ■
Statement by the Chairmanof the Board of Directors and the
President of the Executive Committee
IN MANY RESPECTS, LAST YEAR WAS A DIFFICULT ONE. BESIDES
MINIMAL ECONOMIC GROWTH − WITH SOME COUNTRIES ACTUALLY IN
THE THROES OF RECESSION − AND A CONTINUING UNSTABLE FINANCIAL
CLIMATE CHARACTERIZED BY FALLING INTEREST RATES AND WEAK SHARE
PRICES, A NUMBER OF UNEXPECTED AND INDEED DRAMATIC EVENTS
UNFOLDED. FOREMOST AMONG THEM WERE OF COURSE THE
11 SEPTEMBER ATTACKS ON THE US AND THE FINANCIAL DIFFICULTIES
THAT ONCE-PROMINENT COMPANIES ENCOUNTERED, WHETHER AS A
RESULT OF THESE OR OTHER EVENTS.
All this had an adverse impact onour banking business. The unfavour-able stock market climate de-pressed income from the securitiesbusiness, resulting in our having tobook unrealized losses on ourequity portfolio. The general eco-nomic situation also accounted forhigher write-downs on the loanportfolio in Belgium and the US, aswell as in other countries. Althoughthe increase in costs was able to becontained within reasonablebounds, bank earnings fell by amarked 20.4%.
As to our insurance company, itmade an excellent showing, record-ing earnings growth of 12.2%. Onceagain, this fine performance can beattributed to the quality and astutemanagement of the non-life insur-ance portfolio and to the growth in
the life assurance portfolio, whichstems in part from the progress wehave made in the field of banc-assurance.
After consolidation, the KBCGroup consequently recorded a netprofit of 1 022 million euros,a decline of 12.3% on last year.Changes in the scope of consoli-dation, e.g. the inclusion of PeelHunt after its acquisition at thestart of 2001, the merger of ourK&H Bank with ABN AMROMagyar in Hungary and the fullconsolidation of Kredyt Bank(Poland) in the fourth quarter, hadlittle impact on these results on thewhole.
However, given the low payoutratio in 2000 and particularly givenour confidence in the Group’s
future, the Board of Directors willstill propose to the General Meet-ing of Shareholders that the divi-dend be raised by 4.2% to 1.48euros.
Our confidence in KBC’s continuedexpansion is based in part on theprogress made in the past turbulentyear in growing our businesses.Despite the keen competition thatprevailed, we again succeeded inraising our shares of the bankingmarket in Belgium. All the while,work continued on implementingthe merger, with the number ofKBC Bank and subsidiary CBCBanque branches in Belgium beingreduced even further from 1 454 to1 312. The merged bank’srevamped IT platform also con-tinued to be expanded and, by theend of 2001, it was serving nearly70% of our customers. By the endof this year, we are expecting tohave completed some 80% of allwork relating to the merger. In themeantime, we will continue stead-fastly to develop our specific banc-assurance concept. By the close oflast year, approximately 40% ofKBC Bank customers had pur-chased at least one KBC Insuranceproduct.
In 2001, we continued to build upour presence in Central Europe,where we are generally regarded asthe premier Western financial insti-tution.Without making any substantialnew investments in the region, wemanaged to significantly strengthenour position in a number of coun-
Statement by the Chairman of the Board of Directors and the President of the Executive Committee
KBC Bank & Insurance Group − 2001 Annual Report
4
REM
IVE
RMEI
REN
tries. In the Czech Republic, ourCzech subsidiary C{SOB became thelargest financial institution afterintegrating IPB, which it hadacquired in mid-2000. In Hungary,our K&H Bank merged with ABNAMRO Magyar to become thesecond largest bank in that country,and is now 59%-owned by KBC.In Poland, we acquired an absolutemajority shareholding in KredytBank, and raised it to 56.6% at thestart of this year following a man-datory public bid. In December2001, we made a bid for a 34%stake in Nova Ljubljanska banka(NLB), the largest bank in Slo-venia. At the beginning of January2002, the Slovenian authoritiesdecided to enter into exclusivenegotiations with KBC on the saleof this shareholding. In those Cen-tral European countries where wehave already established a pres-ence, the bancassurance activitieswill also continue to be developed.Warta, the second largest non-lifeinsurer in Poland (40%-owned byKBC), and Kredyt Bank, forinstance, have entered into a banc-assurance agreement. In Hungary,our non-life insurer Argosz madeits first contribution to profit with afine technical result, while in theCzech Republic, C{SOB Pojist’ovnabecame a wholly-ownedKBC Insurance subsidiary, and thefirst steps were taken in bancassur-ance, mainly through the much big-ger branch network created by theacquisition of IPB.
In 2001, our activities in CentralEurope accounted for 11.5% of
Group profit. Account taken of thestrategic developments describedabove, one of our primary object-ives where Central Europe is con-cerned − namely that it should con-tribute some 15% to total Groupprofit over the next one to twoyears − is within our grasp.
We are well aware of the fact thatimportant challenges lie ahead. Theeconomic environment will remainunstable, with major sectors stillhaving to complete restructuringexercises or cope with earlierexcesses, financial markets subjectto volatility and significant changespossibly occurring in the Europeanbanking and insurance landscape asa result of mergers and alliances.
Given these prospects and based onthe clear insight we have nowgained into the ultimate effects ofthe merger, we have drawn up aplan for reducing the number ofemployees at KBC Bank NV by1 650 full-time equivalents over thenext three years. This will not beaccompanied by outright dismissals,but will be achieved primarily byhaving employees whose job hasbeen made redundant as a result ofthe merger replace those leavingKBC voluntarily or through naturalattrition.This plan has also resulted in thereduction in the ranks of seniormanagement by more than 10%and will lead to the resignation atthe April 2002 General Meeting ofthree of the eight members of theExecutive Committee. During theirlong careers, these individuals
made an enormous contribution toCERA Bank and the Kredietbank,respectively. By their willingness tostep down, they are helping thesebanks to reap the fruits of theirmerger and become an efficient andprosperous institution. We thankthem sincerely for their dedication,their achievements and their loyaltytowards our company.
With a view to enhancing the inte-gration of the bank and the insur-ance company, the ICT, communi-cation and marketing divisions ofthe two have now been combined inorder to improve co-operation andefficiency.
All these measures will serve tosignificantly increase the efficiencyand profitability of KBC Bank.Starting in the year 2004, all elsebeing equal, they should yield costsavings of over 100 million euros ayear, savings which are wholly inline with the merger objectives setin 1998.
As our banking income returns toits traditional pace of growth afterthe slump in 2001, the objective ofachieving a 15% rise in earnings pershare for the 2000-2004 periodremains within reach. Among theforces driving our income growthwill be the continued developmentof our bancassurance concept, ourpresence in Central Europe and thehigh level of profitability of ourasset management activities.
Over the past year, our institutionwas again able to rely fully on its
Statement by the Chairman of the Board of Directors and the President of the Executive Committee
KBC Bank & Insurance Group − 2001 Annual Report
5
■ ■ ■ ■ ■ ■ ■ ■ ■ ■
dedicated employees. In the bank,our people had to deal not onlywith more difficult circumstances inboth the lending and investmentbusinesses, they also had to handleall the work occasioned by themerger, while making the necessarypreparations for the transition toeuro notes and coins. The fact thatthis serious logistical challengewent off without a hitch is duewholly to the dedication of ouremployees, particularly those in thebranch network.Our employees in the insurancebusiness also merit a special wordof thanks for finalizing the mergerof our various insurance activities,while our independent agents aredeserving of our particular grati-tude for their exemplary co-oper-ation with the bank branches, con-sistent with our bancassurance con-cept.
Over the past year, the KBC shareprice fell by some 18%, more orless in line with the trend in the DJEuro Stoxx Banks index. The valueof the KBC share was depressed tosome extent by the reduction of itsweighting in a number of indicesthat are now based mainly on theequity market capitalization of thefree float, rather than on the totalvalue of all shares. Indeed, majorinstitutional investors are attachingever more importance to the freefloat and the liquidity of shares inwhich they invest.
By means of presentations and bycontinually increasing the availabil-ity and transparency of informationon our activities, we are endeavour-ing to inform our shareholders andpotential investors as comprehen-sively as possible. We trust that thisannual report will be a testimony to
our regard for and our gratitude toour shareholders.
Remi VermeirenPresident of theExecutive Committee
Willy BreeschChairman of the Board of Directors
Statement by the Chairman of the Board of Directors and the President of the Executive Committee
KBC Bank & Insurance Group − 2001 Annual Report
6
WIL
LYBR
EESC
H

Executive Committee
THE EXECUTIVE COMMITTEE OF THE KBC BANK AND INSURANCE
HOLDING COMPANY NV CONSISTS OF THE MEMBERS OF THE
EXECUTIVE COMMITTEES OF KBC BANK NV AND KBC INSURANCE NV.
EACH MEMBER OF THE EXECUTIVE COMMITTEE IS RESPONSIBLE FOR
SUPERVISING THE ACTIVITIES OF A NUMBER OF SPECIFIC BUSINESS UNITS.
IN 2001, THE MEMBERS OF THE EXECUTIVE COMMITTEEOF THE KBC BANK AND INSURANCE HOLDINGCOMPANY NV WERE AS FOLLOWS:
Executive Committee
KBC Bank & Insurance Group − 2001 Annual Report
7
■ ■ ■ ■ ■ ■ ■ ■ ■ ■
REMI VERMEIREN(President)
WILLY DURON(Vice-President)
HERMAN AGNEESSENS RUDY BROECKAERT EMILE CELIS
CHRISTIAN DEFRANCQ FRANS FLORQUIN GHUNALD LOYAERTS
LUC PHILIPS CLÉMENT SELLESLAGH JAN VANHEVEL
Messrs. Ghunald Loyaerts, Rudy Broeckaert and Clément Selleslagh,managing directors and members of the Executive Committee ofKBC Bank and the KBC Bank and Insurance Holding Company, will stepdown following the General Meeting of Shareholders in April 2002.
Strategy
■ ■ ■ KBC HAS THE AMBITION TO BE A PROFITABLE MULTI-CHANNEL
BANCASSURER, WITH A GEOGRAPHIC FOCUS ON EUROPE.
IN WESTERN EUROPE, THE GROUP BOASTS A LEADING POSITION IN
BELGIUM AND CURRENTLY HAS A LIMITED PRESENCE IN OTHER
COUNTRIES, AS WELL.
IN CENTRAL EUROPE, IT IS ONE OF THE PREMIER FINANCIAL
SERVICES GROUPS. KBC FOCUSES ON FOUR ACTIVITIES, NAMELY
RETAIL AND PRIVATE BANCASSURANCE, CORPORATE SERVICES,
ASSET MANAGEMENT AND MARKET ACTIVITIES.
THE GROUP’S EXPLICIT AIM IS TO CREATE LASTING VALUE FOR ITS
SHAREHOLDERS THROUGH THE PURSUIT OF ITS BUSINESS
ACTIVITIES. ■ ■ ■
AREA OF OPERATION ANDACTIVITIES
Geographic focusIt is our ambition to be a profitablemulti-channel bancassurer with ageographic focus on Europe.
One of the leading financial groupsin our first home market, Belgium,we are also present in various otherWest European countries throughsubsidiaries, branches and represen-tative offices. We have developeda second home market in CentralEurope, where we have become one
of the premier financial servicesgroups, thanks to a leading positionin the Czech Republic and the sig-nificant presence we have built upin Hungary, Poland and Slovakia.
Through our international networkof representative offices, branchesand subsidiaries, we are currentlypresent in over thirty countriesworldwide.
It is our intention to continue orexpand activities outside Europeonly if they are necessary for theprovision of services to KBC’s core
European customers and/or if theygenerate a higher return on equitythan is generally targeted for theGroup.
Focus on activitiesBancassurance is our core business,and we aim to develop it extensivelyin our two home markets.
In addition, we are also active inthe business of asset management,in various market activities and inthe provision of services to corpor-ations. One of our goals is to grad-ually build up a pan-European plat-form to cater for the needs ofmedium-sized companies in thearea of ‘corporate finance’ (capitalmarket operations, mergers andacquisitions, etc.).
Our focus with regard to activitiesis reflected in their segmentationin 2000 into the following fivebusiness areas: retail and privatebancassurance, Central Europe,corporate services, asset manage-ment and market activities. Eacharea of activity has its own specificmanagement committee, whichplays a preliminary policy-makingand supportive role vis-à-vis theexecutive committees of the bank,the insurer and the holding com-pany. For each of these businessareas, profitability targets havebeen set and equity allocated.
Focus on clienteleWe define our core clientele as pri-vate persons and small andmedium-sized enterprises, to whomwe intend to offer the broadest pos-sible range of financial productsand services via a multi-channelapproach. The product offering tocorporate and institutional cus-tomers has been tailored to meettheir particular needs and is basedon the specific know-how and geo-graphic presence of our Group.
Strategy
KBC Bank & Insurance Group − 2001 Annual Report
8
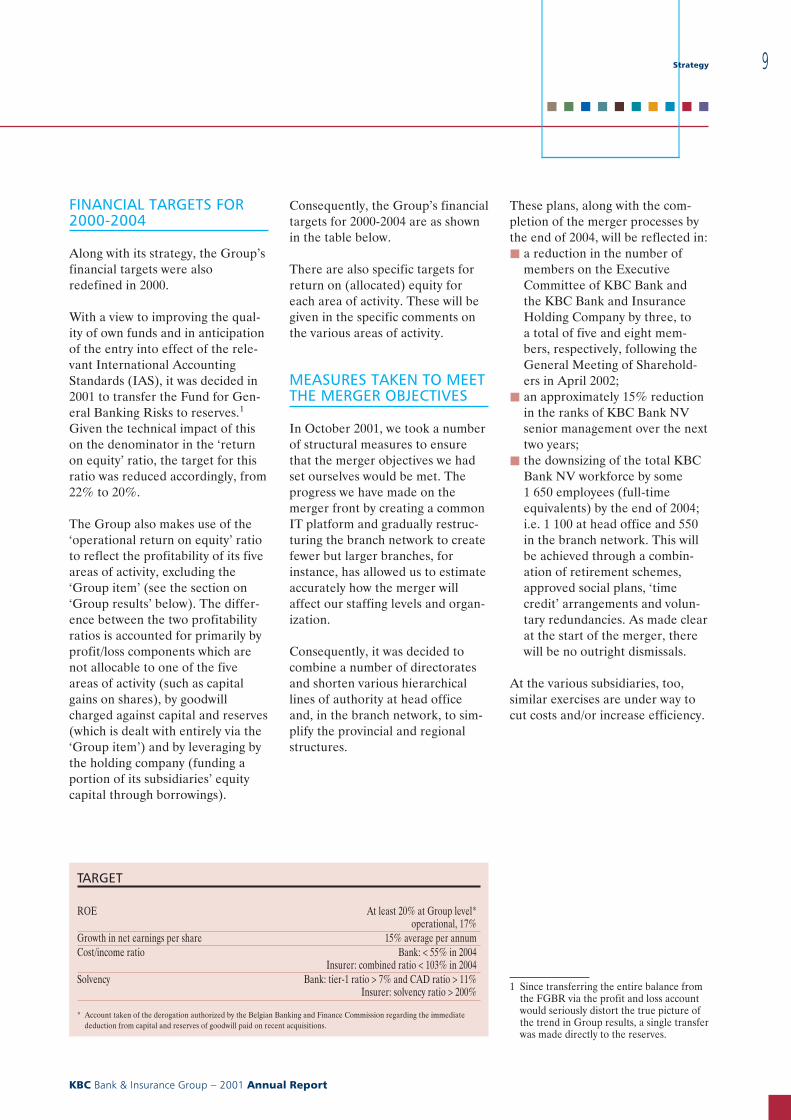
FINANCIAL TARGETS FOR2000-2004
Along with its strategy, the Group’sfinancial targets were alsoredefined in 2000.
With a view to improving the qual-ity of own funds and in anticipationof the entry into effect of the rele-vant International AccountingStandards (IAS), it was decided in2001 to transfer the Fund for Gen-eral Banking Risks to reserves.1
Given the technical impact of thison the denominator in the ‘returnon equity’ ratio, the target for thisratio was reduced accordingly, from22% to 20%.
The Group also makes use of the‘operational return on equity’ ratioto reflect the profitability of its fiveareas of activity, excluding the‘Group item’ (see the section on‘Group results’ below). The differ-ence between the two profitabilityratios is accounted for primarily byprofit/loss components which arenot allocable to one of the fiveareas of activity (such as capitalgains on shares), by goodwillcharged against capital and reserves(which is dealt with entirely via the‘Group item’) and by leveraging bythe holding company (funding aportion of its subsidiaries’ equitycapital through borrowings).
Consequently, the Group’s financialtargets for 2000-2004 are as shownin the table below.
There are also specific targets forreturn on (allocated) equity foreach area of activity. These will begiven in the specific comments onthe various areas of activity.
MEASURES TAKEN TO MEETTHE MERGER OBJECTIVES
In October 2001, we took a numberof structural measures to ensurethat the merger objectives we hadset ourselves would be met. Theprogress we have made on themerger front by creating a commonIT platform and gradually restruc-turing the branch network to createfewer but larger branches, forinstance, has allowed us to estimateaccurately how the merger willaffect our staffing levels and organ-ization.
Consequently, it was decided tocombine a number of directoratesand shorten various hierarchicallines of authority at head officeand, in the branch network, to sim-plify the provincial and regionalstructures.
These plans, along with the com-pletion of the merger processes bythe end of 2004, will be reflected in:j a reduction in the number of
members on the ExecutiveCommittee of KBC Bank andthe KBC Bank and InsuranceHolding Company by three, toa total of five and eight mem-bers, respectively, following theGeneral Meeting of Sharehold-ers in April 2002;
j an approximately 15% reductionin the ranks of KBC Bank NVsenior management over the nexttwo years;
j the downsizing of the total KBCBank NV workforce by some1 650 employees (full-timeequivalents) by the end of 2004;i.e. 1 100 at head office and 550in the branch network. This willbe achieved through a combin-ation of retirement schemes,approved social plans, ‘timecredit’ arrangements and volun-tary redundancies. As made clearat the start of the merger, therewill be no outright dismissals.
At the various subsidiaries, too,similar exercises are under way tocut costs and/or increase efficiency.
1 Since transferring the entire balance fromthe FGBR via the profit and loss accountwould seriously distort the true picture ofthe trend in Group results, a single transferwas made directly to the reserves.
TARGET
ROE At least 20% at Group level*operational, 17%
Growth in net earnings per share 15% average per annumCost/income ratio Bank: < 55% in 2004
Insurer: combined ratio < 103% in 2004Solvency Bank: tier-1 ratio > 7% and CAD ratio > 11%
Insurer: solvency ratio > 200%
* Account taken of the derogation authorized by the Belgian Banking and Finance Commission regarding the immediatededuction from capital and reserves of goodwill paid on recent acquisitions.
Strategy
KBC Bank & Insurance Group − 2001 Annual Report
9
■ ■ ■ ■ ■ ■ ■ ■ ■ ■
Shareholder information
SHAREHOLDERS
31-12-2001 % No. ofshares
Almanij and Group companies:- Almanij 67.91% 204 984 572- KBC Bank & Insurance Group companies* 3.68% 11 118 319Total 71.59% 216 102 891Free float 28.41% 85 753 669
Total shares issued 100.00% 301 856 560
Mandatory convertible bonds (MCBs),number of shares on conversion
11 176 780
of which: held by Almanij andKBC Bank & Insurance Group companies
1 842 040
* With the exception of shares held by KBC Securities and the KBC Financial Products Group (trading purposes).
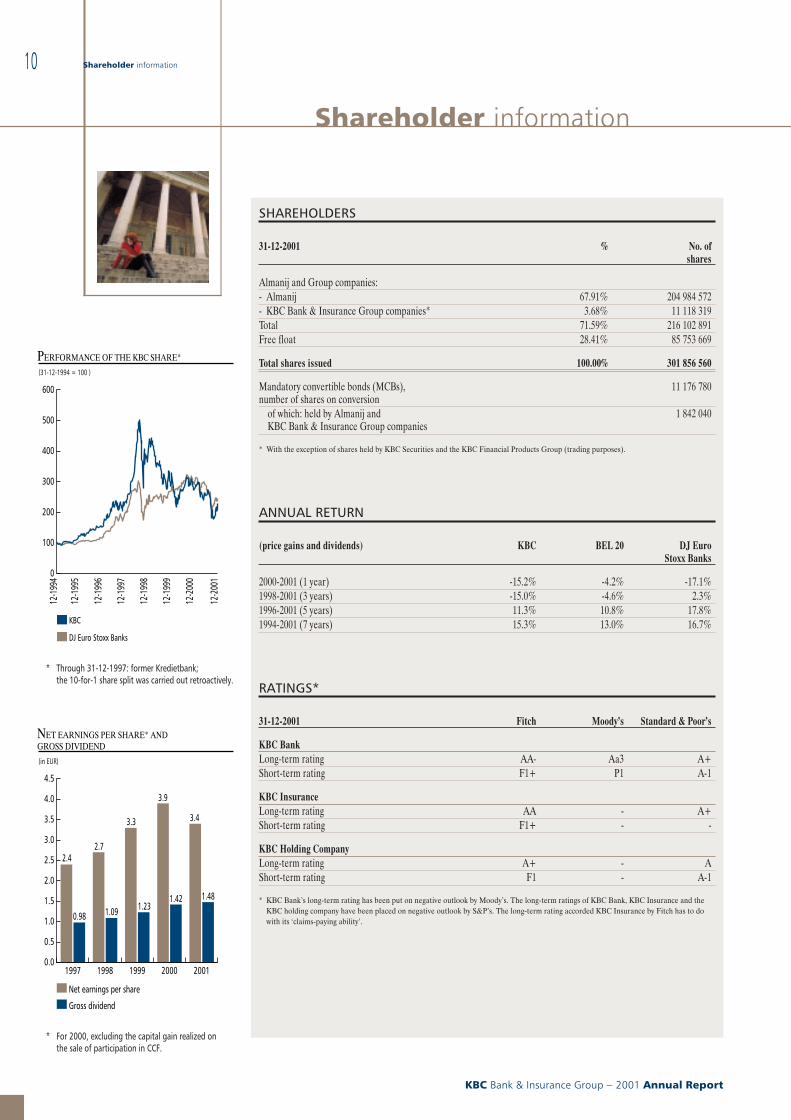
ANNUAL RETURN
(price gains and dividends) KBC BEL 20 DJ EuroStoxx Banks
2000-2001 (1 year) -15.2% -4.2% -17.1%1998-2001 (3 years) -15.0% -4.6% 2.3%1996-2001 (5 years) 11.3% 10.8% 17.8%1994-2001 (7 years) 15.3% 13.0% 16.7%
RATINGS*
31-12-2001 Fitch Moody’s Standard & Poor’s
KBC BankLong-term rating AA- Aa3 A+Short-term rating F1+ P1 A-1
KBC InsuranceLong-term rating AA - A+Short-term rating F1+ - -
KBC Holding CompanyLong-term rating A+ - AShort-term rating F1 - A-1
* KBC Bank’s long-term rating has been put on negative outlook by Moody’s. The long-term ratings of KBC Bank, KBC Insurance and theKBC holding company have been placed on negative outlook by S&P’s. The long-term rating accorded KBC Insurance by Fitch has to dowith its ‘claims-paying ability’.
PERFORMANCE OF THE KBC SHARE*
(31-12-1994 = 100 )
0
100
200
300
400
500
600
12-2
001
12-2
000
12-1
999
12-1
998
12-1
997
12-1
996
12-1
995
12-1
994
* Through 31-12-1997: former Kredietbank; the 10-for-1 share split was carried out retroactively.
KBC
DJ Euro Stoxx Banks
NET EARNINGS PER SHARE* AND GROSS DIVIDEND
(in EUR)
* For 2000, excluding the capital gain realized on the sale of participation in CCF.
Net earnings per share
Gross dividend
0.0
0.5
1.0
1.5
2.0
2.5
3.0
3.5
4.0
4.5
20012000199919981997
2.4
0.98 1.09 1.231.42 1.48
2.7
3.3
3.9
3.4
Shareholder information
KBC Bank & Insurance Group − 2001 Annual Report
10
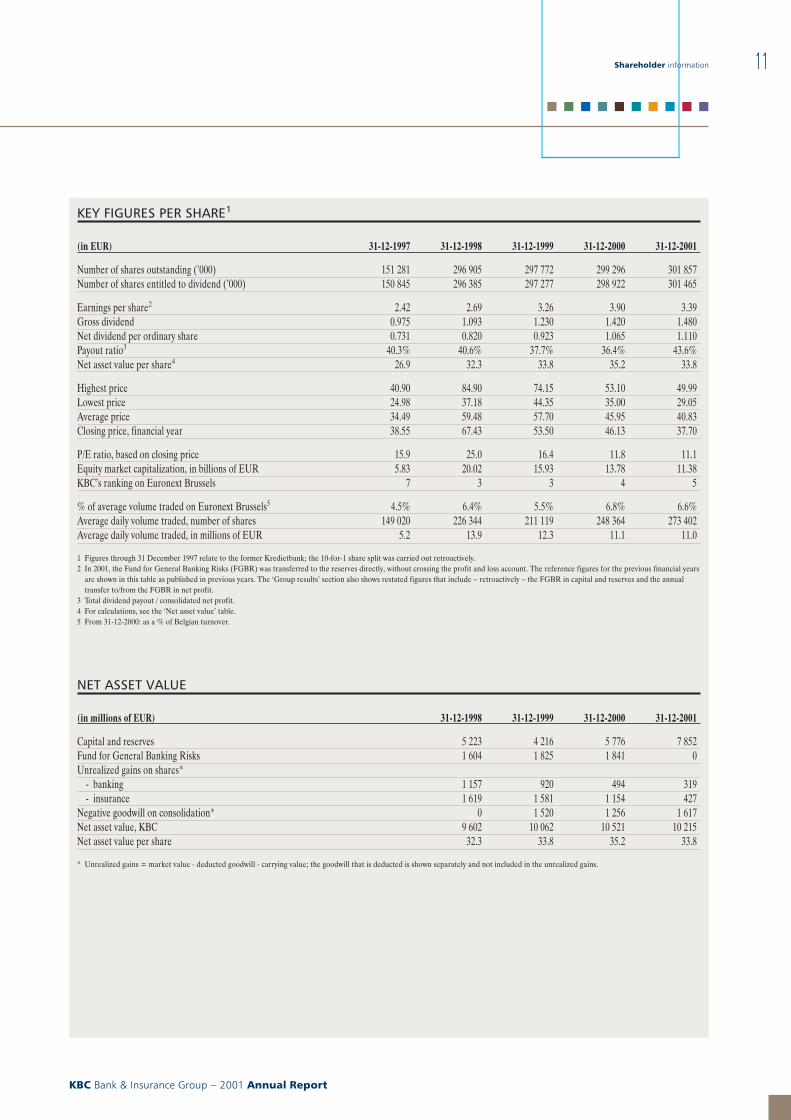
KEY FIGURES PER SHARE1
(in EUR) 31-12-1997 31-12-1998 31-12-1999 31-12-2000 31-12-2001
Number of shares outstanding (’000) 151 281 296 905 297 772 299 296 301 857Number of shares entitled to dividend (’000) 150 845 296 385 297 277 298 922 301 465
Earnings per share2 2.42 2.69 3.26 3.90 3.39Gross dividend 0.975 1.093 1.230 1.420 1.480Net dividend per ordinary share 0.731 0.820 0.923 1.065 1.110Payout ratio3 40.3% 40.6% 37.7% 36.4% 43.6%Net asset value per share4 26.9 32.3 33.8 35.2 33.8
Highest price 40.90 84.90 74.15 53.10 49.99Lowest price 24.98 37.18 44.35 35.00 29.05Average price 34.49 59.48 57.70 45.95 40.83Closing price, financial year 38.55 67.43 53.50 46.13 37.70
P/E ratio, based on closing price 15.9 25.0 16.4 11.8 11.1Equity market capitalization, in billions of EUR 5.83 20.02 15.93 13.78 11.38KBC’s ranking on Euronext Brussels 7 3 3 4 5
% of average volume traded on Euronext Brussels5 4.5% 6.4% 5.5% 6.8% 6.6%Average daily volume traded, number of shares 149 020 226 344 211 119 248 364 273 402Average daily volume traded, in millions of EUR 5.2 13.9 12.3 11.1 11.0
1 Figures through 31 December 1997 relate to the former Kredietbank; the 10-for-1 share split was carried out retroactively.2 In 2001, the Fund for General Banking Risks (FGBR) was transferred to the reserves directly, without crossing the profit and loss account. The reference figures for the previous financial years
are shown in this table as published in previous years. The ‘Group results’ section also shows restated figures that include − retroactively − the FGBR in capital and reserves and the annualtransfer to/from the FGBR in net profit.
3 Total dividend payout / consolidated net profit.4 For calculations, see the ‘Net asset value’ table.5 From 31-12-2000: as a % of Belgian turnover.
NET ASSET VALUE
(in millions of EUR) 31-12-1998 31-12-1999 31-12-2000 31-12-2001
Capital and reserves 5 223 4 216 5 776 7 852Fund for General Banking Risks 1 604 1 825 1 841 0Unrealized gains on shares*
- banking 1 157 920 494 319- insurance 1 619 1 581 1 154 427
Negative goodwill on consolidation* 0 1 520 1 256 1 617Net asset value, KBC 9 602 10 062 10 521 10 215Net asset value per share 32.3 33.8 35.2 33.8
* Unrealized gains = market value - deducted goodwill - carrying value; the goodwill that is deducted is shown separately and not included in the unrealized gains.
Shareholder information
KBC Bank & Insurance Group − 2001 Annual Report
11
■ ■ ■ ■ ■ ■ ■ ■ ■ ■
Group results
TRANSFER OF THE FUNDFOR GENERAL BANKINGRISKS TO THE RESERVES
At the end of 2001, KBC trans-ferred the Fund for General Bank-ing Risks (FGBR) to reserves inanticipation of the introduction ofIAS 30, when the FGBR will nolonger be considered a provision,but part of own funds. The BelgianBanking and Finance Commission(BFC) has allowed KBC a deroga-tion to carry out this non-recurringtransfer directly without having to
go via the profit and loss account;this with a view to assuring a trueand fair picture is given of the trendin results. Shown below is a retro-active restatement of the relevantkey figures, with the FGBR beingadded to capital and reserves andthe annual transfer to/from theFGBR being included in net profitfor each reference year. Unlessotherwise specified, however, thereference figures for previous finan-cial years elsewhere in this annualreport will be given as published inthe relevant annual reports.
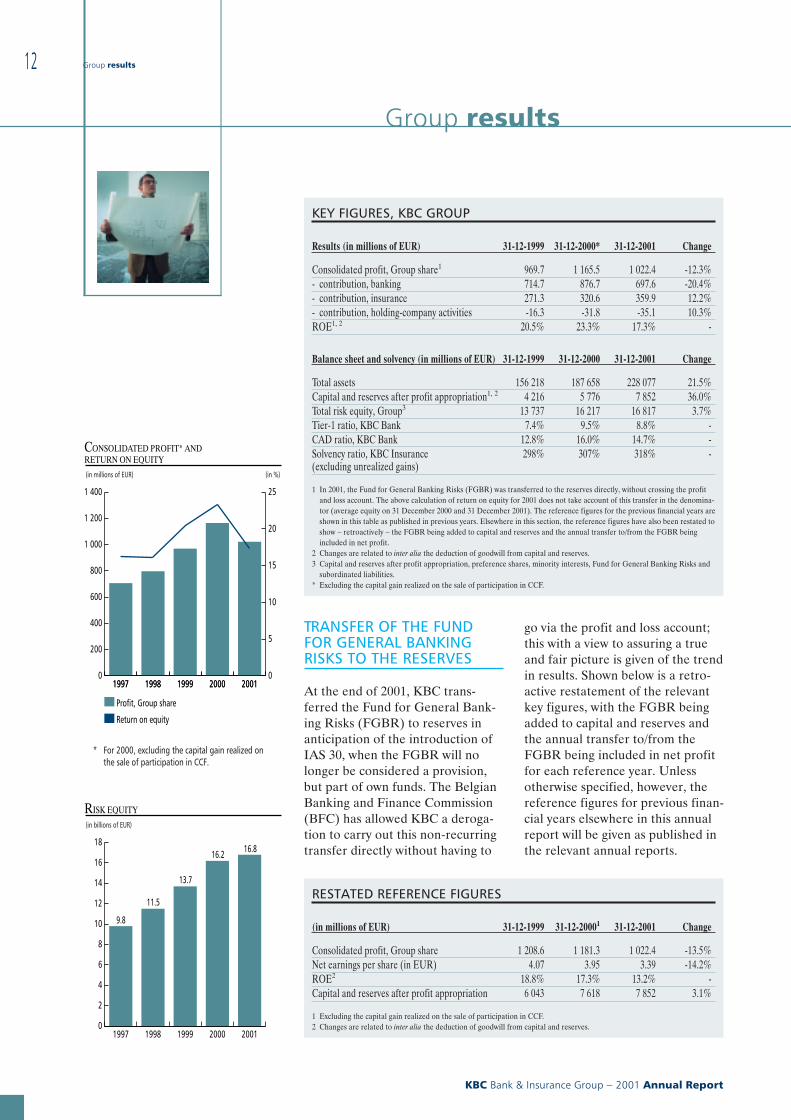
KEY FIGURES, KBC GROUP
Results (in millions of EUR) 31-12-1999 31-12-2000* 31-12-2001 Change
Consolidated profit, Group share1 969.7 1 165.5 1 022.4 -12.3%- contribution, banking 714.7 876.7 697.6 -20.4%- contribution, insurance 271.3 320.6 359.9 12.2%- contribution, holding-company activities -16.3 -31.8 -35.1 10.3%ROE1, 2 20.5% 23.3% 17.3% -
Balance sheet and solvency (in millions of EUR) 31-12-1999 31-12-2000 31-12-2001 Change
Total assets 156 218 187 658 228 077 21.5%Capital and reserves after profit appropriation1, 2 4 216 5 776 7 852 36.0%Total risk equity, Group3 13 737 16 217 16 817 3.7%Tier-1 ratio, KBC Bank 7.4% 9.5% 8.8% -CAD ratio, KBC Bank 12.8% 16.0% 14.7% -Solvency ratio, KBC Insurance(excluding unrealized gains)
298% 307% 318% -
1 In 2001, the Fund for General Banking Risks (FGBR) was transferred to the reserves directly, without crossing the profitand loss account. The above calculation of return on equity for 2001 does not take account of this transfer in the denomina-tor (average equity on 31 December 2000 and 31 December 2001). The reference figures for the previous financial years areshown in this table as published in previous years. Elsewhere in this section, the reference figures have also been restated toshow − retroactively − the FGBR being added to capital and reserves and the annual transfer to/from the FGBR beingincluded in net profit.
2 Changes are related to inter alia the deduction of goodwill from capital and reserves.3 Capital and reserves after profit appropriation, preference shares, minority interests, Fund for General Banking Risks and
subordinated liabilities.* Excluding the capital gain realized on the sale of participation in CCF.
RESTATED REFERENCE FIGURES
(in millions of EUR) 31-12-1999 31-12-20001 31-12-2001 Change
Consolidated profit, Group share 1 208.6 1 181.3 1 022.4 -13.5%Net earnings per share (in EUR) 4.07 3.95 3.39 -14.2%ROE2 18.8% 17.3% 13.2% -Capital and reserves after profit appropriation 6 043 7 618 7 852 3.1%
1 Excluding the capital gain realized on the sale of participation in CCF.2 Changes are related to inter alia the deduction of goodwill from capital and reserves.
0
200
400
600
800
1 000
1 200
1 400
200120001999199819970
5
10
15
20
25
20012000199919981997
CONSOLIDATED PROFIT* AND RETURN ON EQUITY
(in millions of EUR) (in %)
* For 2000, excluding the capital gain realized on the sale of participation in CCF.
Profit, Group share
Return on equity
0
2
4
6
8
10
12
14
16
18
20012000199919981997
RISK EQUITY
(in billions of EUR)
16.816.2
13.7
11.5
9.8
Group results
KBC Bank & Insurance Group − 2001 Annual Report
12
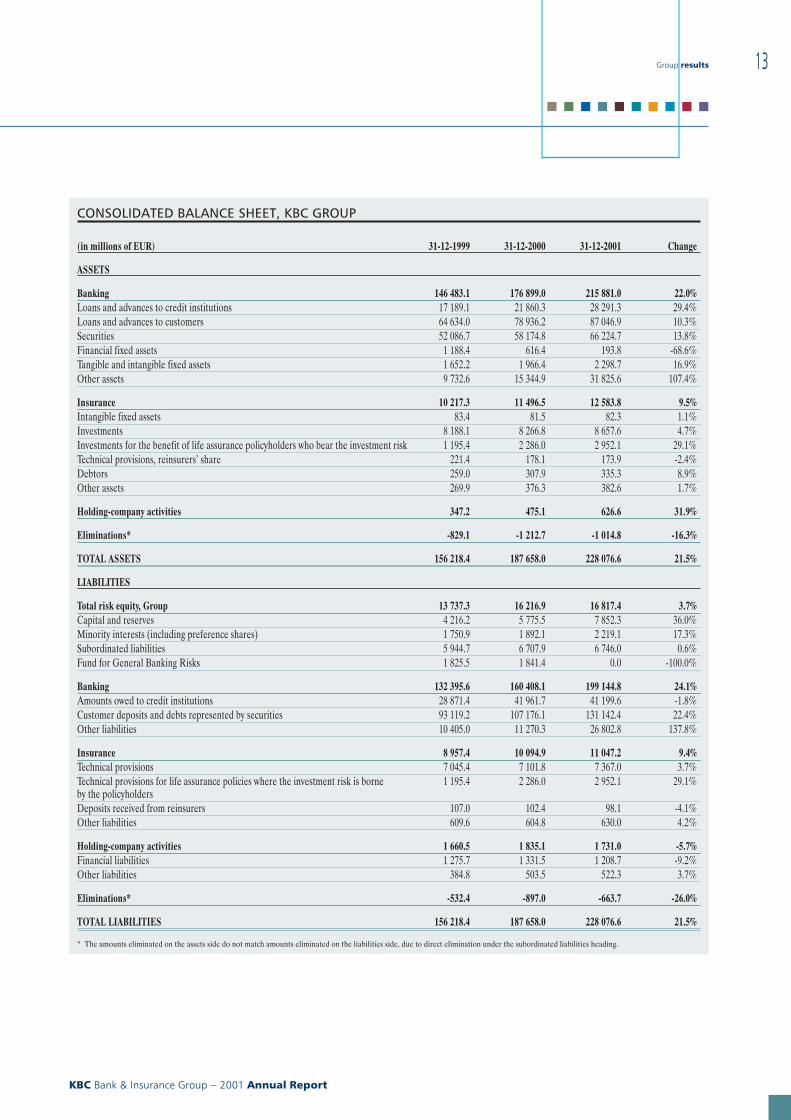
CONSOLIDATED BALANCE SHEET, KBC GROUP
(in millions of EUR) 31-12-1999 31-12-2000 31-12-2001 Change
ASSETS
Banking 146 483.1 176 899.0 215 881.0 22.0%Loans and advances to credit institutions 17 189.1 21 860.3 28 291.3 29.4%Loans and advances to customers 64 634.0 78 936.2 87 046.9 10.3%Securities 52 086.7 58 174.8 66 224.7 13.8%Financial fixed assets 1 188.4 616.4 193.8 -68.6%Tangible and intangible fixed assets 1 652.2 1 966.4 2 298.7 16.9%Other assets 9 732.6 15 344.9 31 825.6 107.4%
Insurance 10 217.3 11 496.5 12 583.8 9.5%Intangible fixed assets 83.4 81.5 82.3 1.1%Investments 8 188.1 8 266.8 8 657.6 4.7%Investments for the benefit of life assurance policyholders who bear the investment risk 1 195.4 2 286.0 2 952.1 29.1%Technical provisions, reinsurers’ share 221.4 178.1 173.9 -2.4%Debtors 259.0 307.9 335.3 8.9%Other assets 269.9 376.3 382.6 1.7%
Holding-company activities 347.2 475.1 626.6 31.9%
Eliminations* -829.1 -1 212.7 -1 014.8 -16.3%
TOTAL ASSETS 156 218.4 187 658.0 228 076.6 21.5%
LIABILITIES
Total risk equity, Group 13 737.3 16 216.9 16 817.4 3.7%Capital and reserves 4 216.2 5 775.5 7 852.3 36.0%Minority interests (including preference shares) 1 750.9 1 892.1 2 219.1 17.3%Subordinated liabilities 5 944.7 6 707.9 6 746.0 0.6%Fund for General Banking Risks 1 825.5 1 841.4 0.0 -100.0%
Banking 132 395.6 160 408.1 199 144.8 24.1%Amounts owed to credit institutions 28 871.4 41 961.7 41 199.6 -1.8%Customer deposits and debts represented by securities 93 119.2 107 176.1 131 142.4 22.4%Other liabilities 10 405.0 11 270.3 26 802.8 137.8%
Insurance 8 957.4 10 094.9 11 047.2 9.4%Technical provisions 7 045.4 7 101.8 7 367.0 3.7%Technical provisions for life assurance policies where the investment risk is borneby the policyholders
1 195.4 2 286.0 2 952.1 29.1%
Deposits received from reinsurers 107.0 102.4 98.1 -4.1%Other liabilities 609.6 604.8 630.0 4.2%
Holding-company activities 1 660.5 1 835.1 1 731.0 -5.7%Financial liabilities 1 275.7 1 331.5 1 208.7 -9.2%Other liabilities 384.8 503.5 522.3 3.7%
Eliminations* -532.4 -897.0 -663.7 -26.0%
TOTAL LIABILITIES 156 218.4 187 658.0 228 076.6 21.5%
* The amounts eliminated on the assets side do not match amounts eliminated on the liabilities side, due to direct elimination under the subordinated liabilities heading.
Group results
KBC Bank & Insurance Group − 2001 Annual Report
13
■ ■ ■ ■ ■ ■ ■ ■ ■ ■
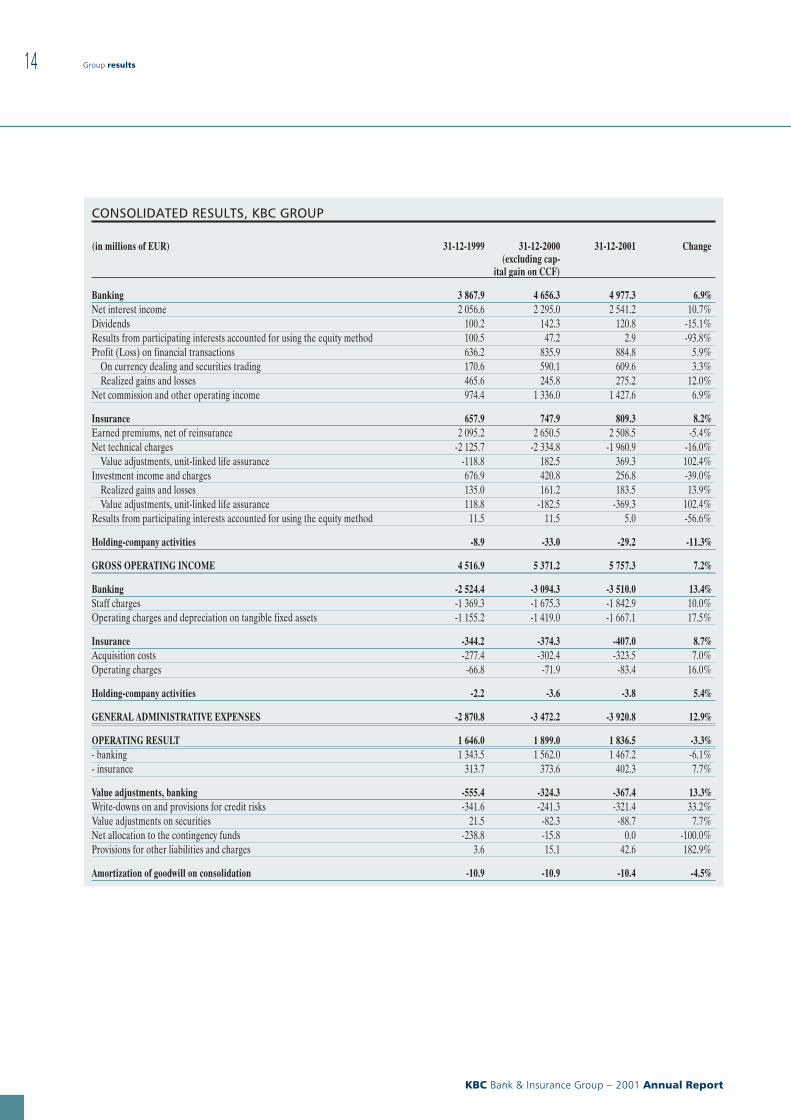
CONSOLIDATED RESULTS, KBC GROUP
(in millions of EUR) 31-12-1999 31-12-2000(excluding cap-
ital gain on CCF)
31-12-2001 Change
Banking 3 867.9 4 656.3 4 977.3 6.9%Net interest income 2 056.6 2 295.0 2 541.2 10.7%Dividends 100.2 142.3 120.8 -15.1%Results from participating interests accounted for using the equity method 100.5 47.2 2.9 -93.8%Profit (Loss) on financial transactions 636.2 835.9 884.8 5.9%
On currency dealing and securities trading 170.6 590.1 609.6 3.3%Realized gains and losses 465.6 245.8 275.2 12.0%
Net commission and other operating income 974.4 1 336.0 1 427.6 6.9%
Insurance 657.9 747.9 809.3 8.2%Earned premiums, net of reinsurance 2 095.2 2 650.5 2 508.5 -5.4%Net technical charges -2 125.7 -2 334.8 -1 960.9 -16.0%
Value adjustments, unit-linked life assurance -118.8 182.5 369.3 102.4%Investment income and charges 676.9 420.8 256.8 -39.0%
Realized gains and losses 135.0 161.2 183.5 13.9%Value adjustments, unit-linked life assurance 118.8 -182.5 -369.3 102.4%
Results from participating interests accounted for using the equity method 11.5 11.5 5.0 -56.6%
Holding-company activities -8.9 -33.0 -29.2 -11.3%
GROSS OPERATING INCOME 4 516.9 5 371.2 5 757.3 7.2%
Banking -2 524.4 -3 094.3 -3 510.0 13.4%Staff charges -1 369.3 -1 675.3 -1 842.9 10.0%Operating charges and depreciation on tangible fixed assets -1 155.2 -1 419.0 -1 667.1 17.5%
Insurance -344.2 -374.3 -407.0 8.7%Acquisition costs -277.4 -302.4 -323.5 7.0%Operating charges -66.8 -71.9 -83.4 16.0%
Holding-company activities -2.2 -3.6 -3.8 5.4%
GENERAL ADMINISTRATIVE EXPENSES -2 870.8 -3 472.2 -3 920.8 12.9%
OPERATING RESULT 1 646.0 1 899.0 1 836.5 -3.3%- banking 1 343.5 1 562.0 1 467.2 -6.1%- insurance 313.7 373.6 402.3 7.7%
Value adjustments, banking -555.4 -324.3 -367.4 13.3%Write-downs on and provisions for credit risks -341.6 -241.3 -321.4 33.2%Value adjustments on securities 21.5 -82.3 -88.7 7.7%Net allocation to the contingency funds -238.8 -15.8 0.0 -100.0%Provisions for other liabilities and charges 3.6 15.1 42.6 182.9%
Amortization of goodwill on consolidation -10.9 -10.9 -10.4 -4.5%
Group results
KBC Bank & Insurance Group − 2001 Annual Report
14
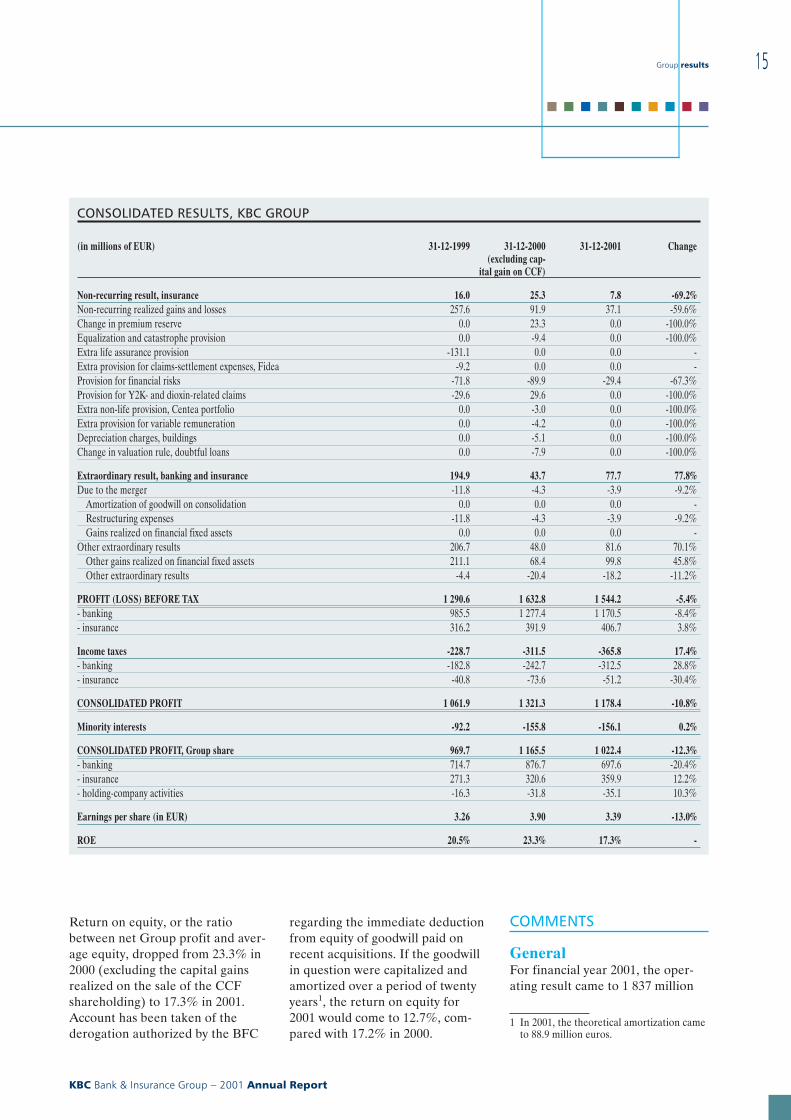
CONSOLIDATED RESULTS, KBC GROUP
(in millions of EUR) 31-12-1999 31-12-2000(excluding cap-
ital gain on CCF)
31-12-2001 Change
Non-recurring result, insurance 16.0 25.3 7.8 -69.2%Non-recurring realized gains and losses 257.6 91.9 37.1 -59.6%Change in premium reserve 0.0 23.3 0.0 -100.0%Equalization and catastrophe provision 0.0 -9.4 0.0 -100.0%Extra life assurance provision -131.1 0.0 0.0 -Extra provision for claims-settlement expenses, Fidea -9.2 0.0 0.0 -Provision for financial risks -71.8 -89.9 -29.4 -67.3%Provision for Y2K- and dioxin-related claims -29.6 29.6 0.0 -100.0%Extra non-life provision, Centea portfolio 0.0 -3.0 0.0 -100.0%Extra provision for variable remuneration 0.0 -4.2 0.0 -100.0%Depreciation charges, buildings 0.0 -5.1 0.0 -100.0%Change in valuation rule, doubtful loans 0.0 -7.9 0.0 -100.0%
Extraordinary result, banking and insurance 194.9 43.7 77.7 77.8%Due to the merger -11.8 -4.3 -3.9 -9.2%
Amortization of goodwill on consolidation 0.0 0.0 0.0 -Restructuring expenses -11.8 -4.3 -3.9 -9.2%Gains realized on financial fixed assets 0.0 0.0 0.0 -
Other extraordinary results 206.7 48.0 81.6 70.1%Other gains realized on financial fixed assets 211.1 68.4 99.8 45.8%Other extraordinary results -4.4 -20.4 -18.2 -11.2%
PROFIT (LOSS) BEFORE TAX 1 290.6 1 632.8 1 544.2 -5.4%- banking 985.5 1 277.4 1 170.5 -8.4%- insurance 316.2 391.9 406.7 3.8%
Income taxes -228.7 -311.5 -365.8 17.4%- banking -182.8 -242.7 -312.5 28.8%- insurance -40.8 -73.6 -51.2 -30.4%
CONSOLIDATED PROFIT 1 061.9 1 321.3 1 178.4 -10.8%
Minority interests -92.2 -155.8 -156.1 0.2%
CONSOLIDATED PROFIT, Group share 969.7 1 165.5 1 022.4 -12.3%- banking 714.7 876.7 697.6 -20.4%- insurance 271.3 320.6 359.9 12.2%- holding-company activities -16.3 -31.8 -35.1 10.3%
Earnings per share (in EUR) 3.26 3.90 3.39 -13.0%
ROE 20.5% 23.3% 17.3% -
Return on equity, or the ratiobetween net Group profit and aver-age equity, dropped from 23.3% in2000 (excluding the capital gainsrealized on the sale of the CCFshareholding) to 17.3% in 2001.Account has been taken of thederogation authorized by the BFC
regarding the immediate deductionfrom equity of goodwill paid onrecent acquisitions. If the goodwillin question were capitalized andamortized over a period of twentyyears1, the return on equity for2001 would come to 12.7%, com-pared with 17.2% in 2000.
COMMENTS
GeneralFor financial year 2001, the oper-ating result came to 1 837 million
1 In 2001, the theoretical amortization cameto 88.9 million euros.
Group results
KBC Bank & Insurance Group − 2001 Annual Report
15
■ ■ ■ ■ ■ ■ ■ ■ ■ ■
euros, 3.3% down on the 2000figure, while net group profit endedat 1 022 million euros, a 12.3%decline on a year earlier. Earningsper share fell 13%.KBC’s performance in 2001 wasquite creditable, having beenachieved during a worldwide eco-nomic slowdown and despite thecontinuing weakness on equitymarkets. The stock market malaisehad an adverse impact especially inthe first nine months of 2001 on theresults of the equity-linked busi-nesses and the subsidiaries special-ized in equity trading and deriva-tives and led to, among otherthings, considerable unrealizedvaluation losses on shares in theinvestment portfolio. As to the eco-nomic slowdown, this made itselffelt particularly in the latter part ofthe year and resulted in consider-able write-downs being made onloans. These less favourable con-ditions, together with the increasein charges, had a negative impactparticularly on bank earnings, withpre-tax profit falling by 8.4%.Higher taxes ultimately pushed netprofit 20.4% lower.The insurance business, on theother hand, turned in a very strongperformance, with profit up 12.2%and another high technical returnbeing posted in the non-life busi-ness. Although sales of unit-linkedlife assurance products were lessbuoyant than in 2000, which hadbeen an exceptional year, they ral-lied again starting in the fourthquarter of 2001. On top of this,sales of traditional fixed-income lifeassurance products went up by7.1%, evidence that the life assur-ance business was holding up welldespite the more difficult con-ditions prevailing on the stockmarket.
Numerous changes were also madein the scope of the KBC Group’sconsolidation in 2001, following on
the merger of K&H Bank withABN AMRO Magyar in Hungary,the increase in the shareholding inKredyt Bank Poland, the inclusionof IPB in the results (the first timefor a full year) and the acquisitionof Peel Hunt, Patria and Investco.However, with the participatinginterest in CCF no longer contrib-uting to profit, the impact of thesechanges on the result was ultimatelylimited, on balance. If the scope ofconsolidation had remainedunchanged, KBC Group profitwould have gone down by 10.5%.
Operating activities −bankingFor 2001, the operating result andnet profit contribution ended down6.1% and 20.4%, respectively, onthe year-earlier figure. On balance,the impact of the changes in thescope of consolidation was a nega-tive 13.5 million euros.
The impact of the sale of the invest-ment in CCF in 2000 and the result-ing loss of income (equity method)on the contribution to profit madeby the banking business came to anegative 20 million euros. Althoughthis was offset by the positive effectof the inclusion of IPB in the con-solidated accounts (+23 millioneuros), the profit contribution(after allocation of the fundingcost) made by the other newly con-solidated companies was slightlynegative.
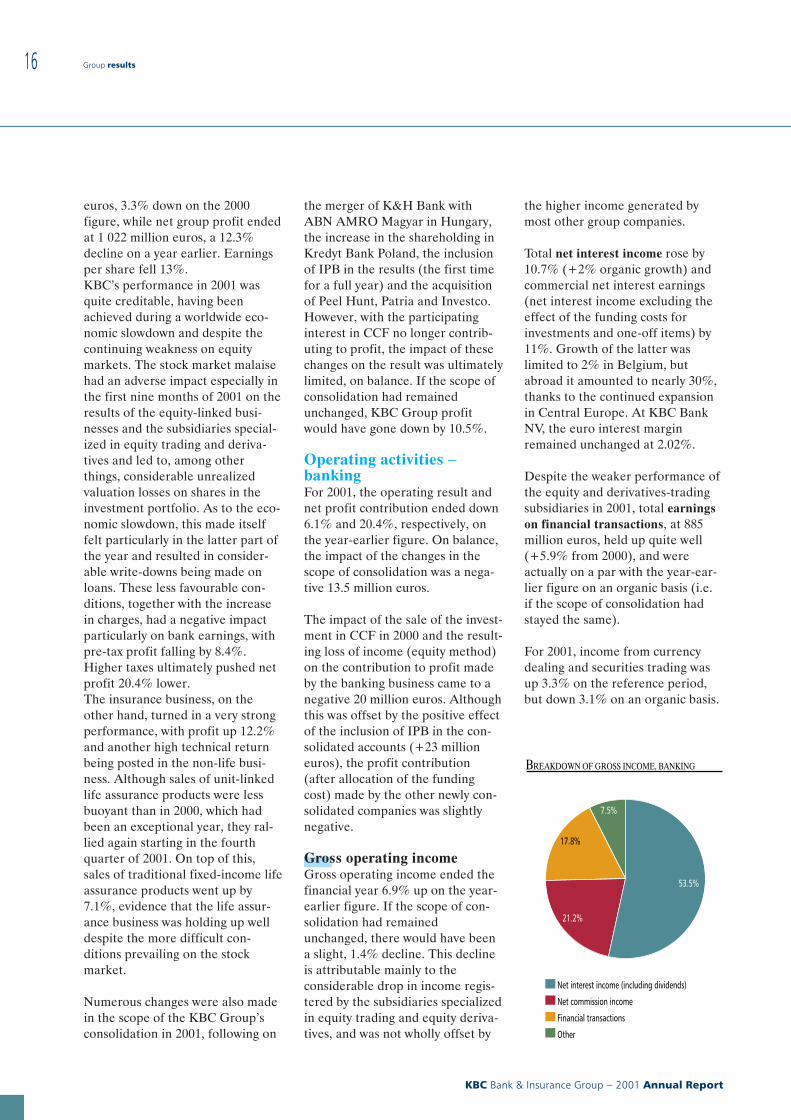
Gross operating incomeGross operating income ended thefinancial year 6.9% up on the year-earlier figure. If the scope of con-solidation had remainedunchanged, there would have beena slight, 1.4% decline. This declineis attributable mainly to theconsiderable drop in income regis-tered by the subsidiaries specializedin equity trading and equity deriva-tives, and was not wholly offset by
the higher income generated bymost other group companies.
Total net interest income rose by10.7% (+2% organic growth) andcommercial net interest earnings(net interest income excluding theeffect of the funding costs forinvestments and one-off items) by11%. Growth of the latter waslimited to 2% in Belgium, butabroad it amounted to nearly 30%,thanks to the continued expansionin Central Europe. At KBC BankNV, the euro interest marginremained unchanged at 2.02%.
Despite the weaker performance ofthe equity and derivatives-tradingsubsidiaries in 2001, total earningson financial transactions, at 885million euros, held up quite well(+5.9% from 2000), and wereactually on a par with the year-ear-lier figure on an organic basis (i.e.if the scope of consolidation hadstayed the same).
For 2001, income from currencydealing and securities trading wasup 3.3% on the reference period,but down 3.1% on an organic basis.
BREAKDOWN OF GROSS INCOME, BANKING
Net interest income (including dividends)
Net commission income
Financial transactions
Other
7.5%
17.8%
21.2%
53.5%
Group results
KBC Bank & Insurance Group − 2001 Annual Report
16
The turbulent conditions prevailingon markets over the past yearcaused the subsidiaries specializedin the equity and derivatives busi-ness to post very poor, even nega-tive earnings.In contrast, the bank dealing roomsin Brussels and especially thoseabroad put in an outstandingperformance. C{SOB’s dealingroom, too, made a strong recoveryin 2001, following a less goodperformance in 2000.At year-end, realized gains came to275 million euros (+30 millioneuros on 2000), 57 million euros ofthis being realized on shares and218 million euros on fixed-incomesecurities. In 2000, almost all thegains realized were on shares.At the end of December 2001,unrealized (and unbooked) capitalgains came to 317 million euros onshares and 641 million euros onfixed-income securities.
Net commission income went up in2001 by 2.2%, though it fell on anorganic basis by 12%. This was dueentirely to the lower fees coming infrom the securities and asset manage-ment business (-12.6%, organic-ally), especially at KBC Bank Bel-gium. There, a 31% decline wasposted as a result of the lowervolume sold (and the fact thatinvestors were less inclined toswitch between funds) compared to2000, owing to the exceptionallyweak stock market climate. All thesame, the total volume of fundsunder management rose, resultingin a 14% increase in commissionincome generated by KBC AssetManagement (mainly managementfees).The total volume under manage-ment has gone up since the end of2000 by slightly more than 4.5 bil-lion euros. Nonetheless, half of thisincrease has been eaten away by thedrop in the value of the funds sincethe start of the year. KBC Asset
Management still has a very large(i.e. 29.3%) share of the investmentfund market in Belgium.
Higher income from paymentstransactions (+37%) is largelyattributable to the expansion andchanges in the scope of consoli-dation in Central Europe.
In 2001, other operating incomewent up by 22.9% (15%, organic-ally), due practically entirely to thesteady growth in the leasing busi-nesses, though this was accom-panied by an (albeit smaller)increase in operating charges.
General administrativeexpensesThe year 2001 closed with a 13.4%increase in charges. However, if thescope of consolidation had stayedthe same − changes mainly concernCentral Europe − the increase incharges would have come to just3.3%.The charges incurred by KBC BankNV in Belgium, which account for46% of the total, went up in 2001 by2%, driven mainly by staff charges,due to such traditional factors asindexation, promotions and theslight increase in the workforce(+1%) compared to the end of2000.
The belt-tightening measuresannounced at the end of Octoberwith a view to achieving the mergerobjectives will only start makingthemselves felt from 2002.
At the end of 2001, the cost/incomeratio came to 70.5%. Given anunchanged scope of consolidation,it would have come to 69.7%, com-pared with 66.5% at the end of2000. Accounting for the increase isnot only a rise in charges, but espe-cially the less pronounced growth inincome.
Value adjustmentsFor 2001, specific loan loss pro-visions went up by 16% comparedto 2000, and by 2.3% if the impactof Kredyt Bank Poland is not takeninto account.Specific write-downs for Belgianloans were 34% lower than in 2000,when considerable provisions hadto be set aside for a number oflarge individual loans in the textilesand technology sectors.
Disregarding the impact of KredytBank Poland, specific provisions fornon-Belgian loans practically quad-rupled compared with the situationin 2000.Including this bank in the figures,the total non-performing ratio rosefrom 2.1% to 2.8%; excluding it,the non-performing ratio came to2.4%.
Value adjustments on securitieswere in line with those posted in2000, when significant unrealizedvaluation losses had to be bookedespecially in the last quarter onaccount of the stock market climatewhich was already deteriorating atthat time.
Balance sheet and solvencyTotal assets in the banking businessclimbed by 22% from the previous
0
1
2
3
4
5
6
7
8
9
10
20012000199919981997
TIER-1 RATIO, KBC BANK
(in %)
8.89.5
7.47.26.7
Group results
KBC Bank & Insurance Group − 2001 Annual Report
17
■ ■ ■ ■ ■ ■ ■ ■ ■ ■
year to end at 216 billion euros.If the scope of consolidation hadremained unchanged, the increasewould have come to 17.2%. CentralEurope accounted for 13.5% oftotal assets in the banking businessat the end of December 2001.
Risk-weighted assets went up by8.9% (8 billion euros) to 99.1 bil-lion euros, compared to year-end2000. The impact of the inclusion ofKredyt Bank Poland in the figurescomes to 6 billion euros.
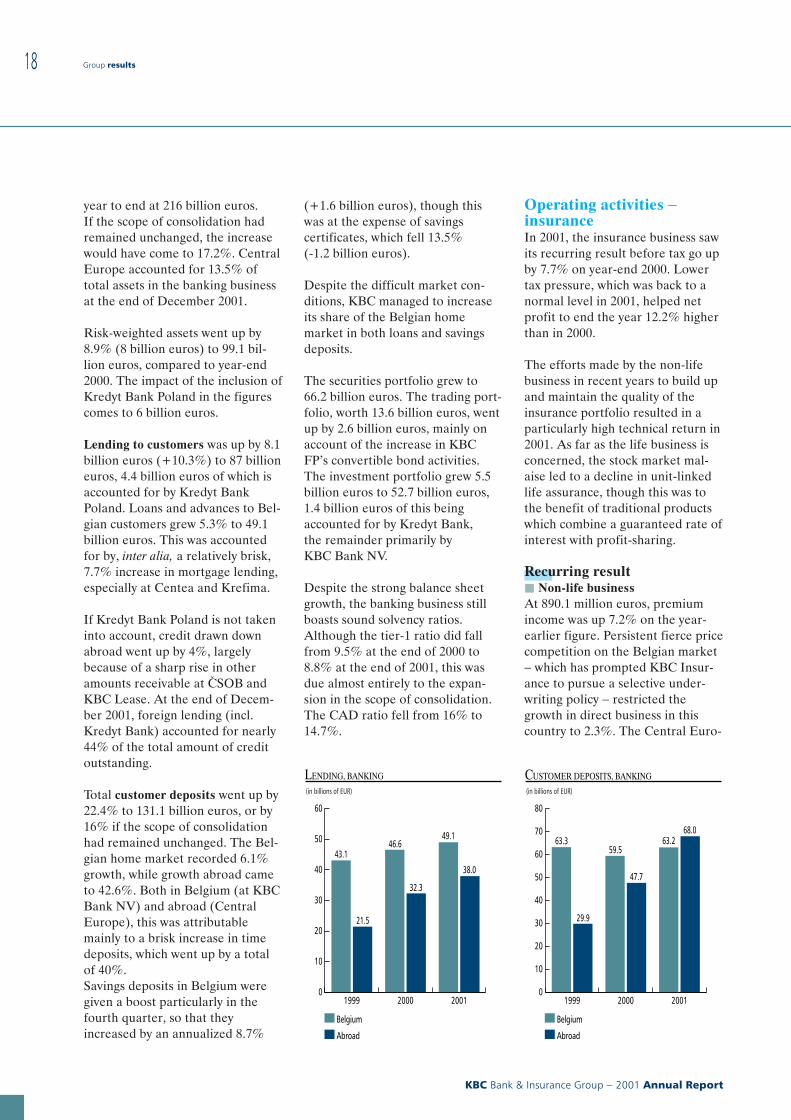
Lending to customers was up by 8.1billion euros (+10.3%) to 87 billioneuros, 4.4 billion euros of which isaccounted for by Kredyt BankPoland. Loans and advances to Bel-gian customers grew 5.3% to 49.1billion euros. This was accountedfor by, inter alia, a relatively brisk,7.7% increase in mortgage lending,especially at Centea and Krefima.
If Kredyt Bank Poland is not takeninto account, credit drawn downabroad went up by 4%, largelybecause of a sharp rise in otheramounts receivable at C{SOB andKBC Lease. At the end of Decem-ber 2001, foreign lending (incl.Kredyt Bank) accounted for nearly44% of the total amount of creditoutstanding.
Total customer deposits went up by22.4% to 131.1 billion euros, or by16% if the scope of consolidationhad remained unchanged. The Bel-gian home market recorded 6.1%growth, while growth abroad cameto 42.6%. Both in Belgium (at KBCBank NV) and abroad (CentralEurope), this was attributablemainly to a brisk increase in timedeposits, which went up by a totalof 40%.Savings deposits in Belgium weregiven a boost particularly in thefourth quarter, so that theyincreased by an annualized 8.7%
(+1.6 billion euros), though thiswas at the expense of savingscertificates, which fell 13.5%(-1.2 billion euros).
Despite the difficult market con-ditions, KBC managed to increaseits share of the Belgian homemarket in both loans and savingsdeposits.
The securities portfolio grew to66.2 billion euros. The trading port-folio, worth 13.6 billion euros, wentup by 2.6 billion euros, mainly onaccount of the increase in KBCFP’s convertible bond activities.The investment portfolio grew 5.5billion euros to 52.7 billion euros,1.4 billion euros of this beingaccounted for by Kredyt Bank,the remainder primarily byKBC Bank NV.
Despite the strong balance sheetgrowth, the banking business stillboasts sound solvency ratios.Although the tier-1 ratio did fallfrom 9.5% at the end of 2000 to8.8% at the end of 2001, this wasdue almost entirely to the expan-sion in the scope of consolidation.The CAD ratio fell from 16% to14.7%.
Operating activities −insuranceIn 2001, the insurance business sawits recurring result before tax go upby 7.7% on year-end 2000. Lowertax pressure, which was back to anormal level in 2001, helped netprofit to end the year 12.2% higherthan in 2000.
The efforts made by the non-lifebusiness in recent years to build upand maintain the quality of theinsurance portfolio resulted in aparticularly high technical return in2001. As far as the life business isconcerned, the stock market mal-aise led to a decline in unit-linkedlife assurance, though this was tothe benefit of traditional productswhich combine a guaranteed rate ofinterest with profit-sharing.
Recurring resultj Non-life businessAt 890.1 million euros, premiumincome was up 7.2% on the year-earlier figure. Persistent fierce pricecompetition on the Belgian market− which has prompted KBC Insur-ance to pursue a selective under-writing policy − restricted thegrowth in direct business in thiscountry to 2.3%. The Central Euro-
0
10
20
30
40
50
60
200120001999
LENDING, BANKING
(in billions of EUR)
43.1
21.5
46.6
32.3
49.1
38.0
Belgium
Abroad
0
10
20
30
40
50
60
70
80
200120001999
CUSTOMER DEPOSITS, BANKING
(in billions of EUR)
63.3
29.9
59.5
47.7
63.268.0
Belgium
Abroad
Group results
KBC Bank & Insurance Group − 2001 Annual Report
18
pean subsidiaries posted a 39.6%increase in non-life premiums, illus-trating the potential for growth inthese burgeoning insurancemarkets. Where reinsurance accept-ance is concerned (mainly reinsur-ance subsidiary, Secura), premiumincome rose by 18.6%, partly as aresult of a number of rate increases,which will however result in volumeincreases especially from 2002.
The fine result in the non-life busi-ness is attributable mainly to thereduction in the net loss ratio (theratio between claims incurred, netof reinsurance, and earned pre-miums, net of reinsurance) by3.2 percentage points to 69.4%.The loss ratio in the direct insur-ance business in Belgium fell from66.6% in 2000 to a very low 63.9%last year, thanks to disciplined andsustained risk management at bothKBC Insurance NV and Fidea.Claims arising at the Hungariansubsidiary, Argosz, developed alongfavourable lines for the second yearin a row, with the loss ratio fallingby as much as 8 percentage pointsto 61.0%. The limited impact (max-imum 3 million euros) of the terror-ist attacks in the US, along withother factors, brought this ratio to88.2% at Secura, from 95.8% in2000.
The net expense ratio (the ratio ofnet expenses to net written pre-miums) rose from 34.0% in 2000 to34.4% last year. Meanwhile, a pro-gramme has been launched which −via a variety of measures − shouldlower this ratio in the mediumterm. The combined ratio fell from106.6% at the end of 2000 to103.8% at the end of last year,which means that the targeted ratioof 103% by 2004 has almost beenachieved.
The recurring result in the non-lifebusiness came to 139.6 million
euros at the end of 2001, up 12.1%on the year-earlier figure.
j Life businessThe stock market malaise damp-ened demand for unit-linked lifeassurance, with sales hitting a lowafter 11 September. In the fourthquarter, sales of a number of newunit-linked products reached cruis-ing speed, which enabled very cred-itable sales figures to be returnedfor 2001.
Premium income generated by unit-linked life assurance amounted to1 229.2 million euros, a fairlylimited decline of 15.7% comparedwith the figure for 2000, which hadbeen an excellent year for sales.In spite of this, initial estimatesindicate that KBC Insurance wasable to step up its share of the Bel-gian market from 19.7% in 2000 to20.2% in 2001.
In contrast to the trend for unit-linked products, traditional lifeassurance achieved a return togrowth, with premium income up
7.1% on the figure for 2000. Groupassurance accounted for 40% or12 million euros of this growth.
In 2001, total gross written lifepremiums came to 1 693.8 millioneuros, down by a limited 191.9million euros (-10%) on the year-earlier figure.
The actuarial reserves in the lifebusiness went up by 11.9% to 7 590million euros at year-end, despitethe slight decline in premiumincome and the 369.3 million eurosin write-downs on unit-linked lifeassurance assets. Write-downs forunit-linked products are, however,borne by policyholders.
Net operating expenses rose by9.5% and the cost/income ratio (netoperating expenses to operatingincome) remained more or lessunchanged at 40%. The furtherautomation planned of unit-linkedlife and group assurance processesshould help reduce this ratio in thefuture.
In 2001, the life business posted arecurring result of 173.5 millioneuros, which is an increase of 7.5%on the year-earlier figure.
j Non-technical resultThe non-technical result rose to87.5 million euros, up 1.7% on thefigure for 2000, with investmentincome increasing by 8.0 millioneuros. However, income from par-ticipating interests accounted forusing the equity method fell by 6.5million euros as a result of:j CCF no longer contributing to
profit (good for 2.8 millioneuros), following the sale of theinvestment in 2000;
j the Irish FBD’s profit contri-bution falling in 2001 by 2 mil-lion euros to 7 million euros;
j the 2001 result from the PolishAgropolisa and Warta share-
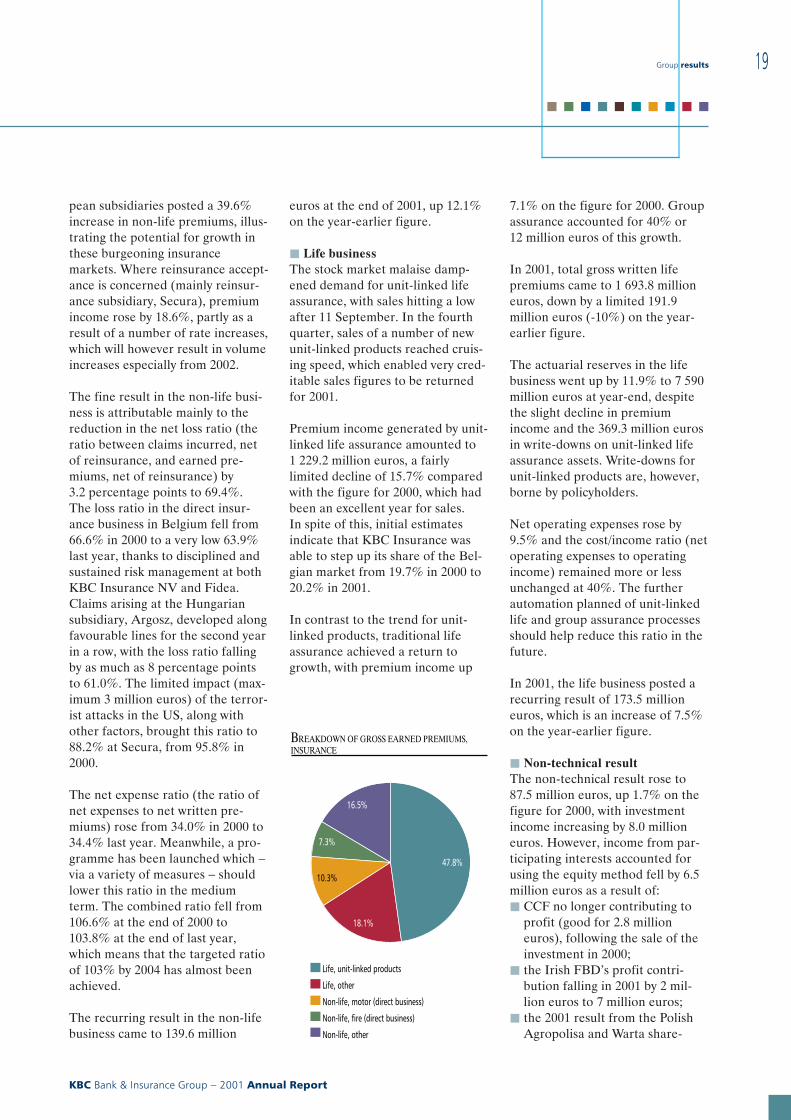
BREAKDOWN OF GROSS EARNED PREMIUMS, INSURANCE
Life, unit-linked products
Life, other
Non-life, motor (direct business)
Non-life, fire (direct business)
Non-life, other
16.5%
7.3%
10.3%
18.1%
47.8%
Group results
KBC Bank & Insurance Group − 2001 Annual Report
19
■ ■ ■ ■ ■ ■ ■ ■ ■ ■
holdings falling by 1.7 millioneuros to -2 million euros.
Non-recurring resultThe non-recurring result includesall income and charges specific toordinary activities that are of a non-recurring nature.
The positive difference betweenreal and normalized income fromthe share portfolio is considered asnon-recurring, surplus realizedgains. These came to 37.2 and 91.9million euros in 2001 and 2000,respectively. Normalized income iscalculated by multiplying thepresent value of the portfolio at thestart of the financial year by a nor-malized return. Including the divi-dend yield, this amounted to 7.6%in 2001, compared to 6.9% in 2000.In 2001, 29.4 million euros wereallocated to the provision for finan-cial risks (89.9 million euros in2000).
Besides the above items, the 2000non-recurring result included theadditional write-back of 23.3 mil-lion euros from the provision forunearned premiums due to thechange to the way in which this pro-vision is calculated, the write-backof the full 29.6 million euros fromthe technical provision for Y2K, aswell as a number of further allo-cations to provisions and valueadjustments, likewise for a total of29.6 million euros.
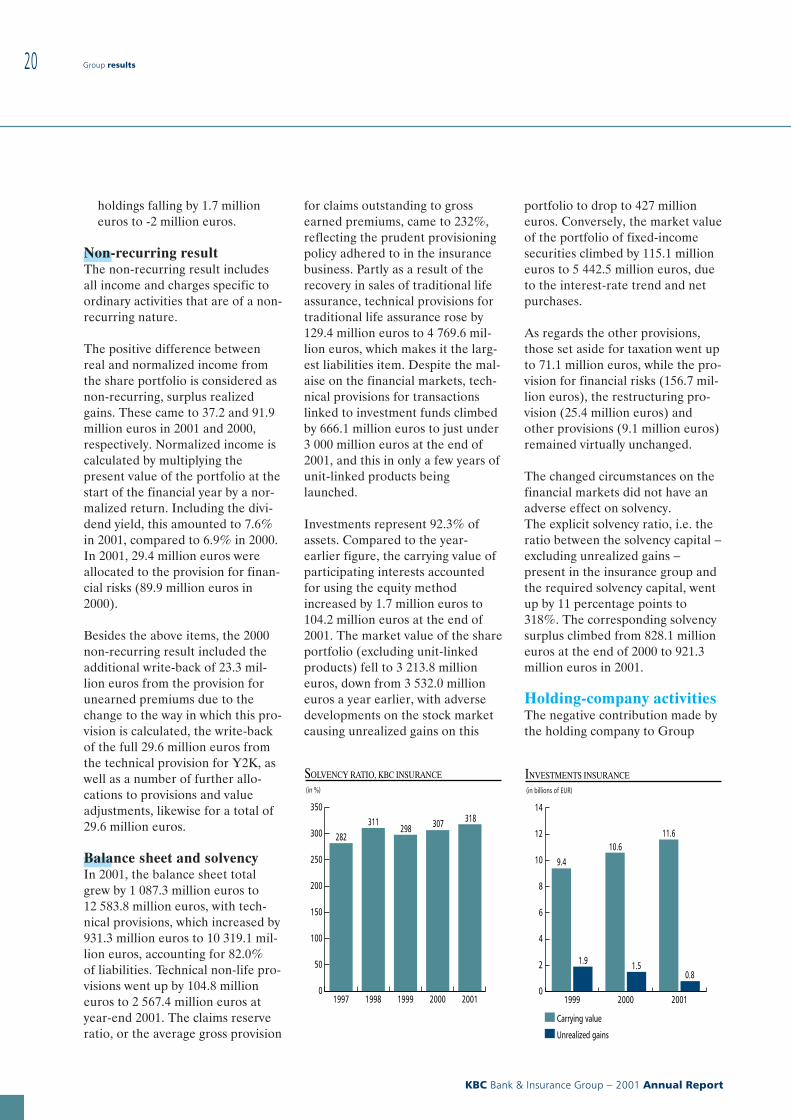
Balance sheet and solvencyIn 2001, the balance sheet totalgrew by 1 087.3 million euros to12 583.8 million euros, with tech-nical provisions, which increased by931.3 million euros to 10 319.1 mil-lion euros, accounting for 82.0%of liabilities. Technical non-life pro-visions went up by 104.8 millioneuros to 2 567.4 million euros atyear-end 2001. The claims reserveratio, or the average gross provision
for claims outstanding to grossearned premiums, came to 232%,reflecting the prudent provisioningpolicy adhered to in the insurancebusiness. Partly as a result of therecovery in sales of traditional lifeassurance, technical provisions fortraditional life assurance rose by129.4 million euros to 4 769.6 mil-lion euros, which makes it the larg-est liabilities item. Despite the mal-aise on the financial markets, tech-nical provisions for transactionslinked to investment funds climbedby 666.1 million euros to just under3 000 million euros at the end of2001, and this in only a few years ofunit-linked products beinglaunched.
Investments represent 92.3% ofassets. Compared to the year-earlier figure, the carrying value ofparticipating interests accountedfor using the equity methodincreased by 1.7 million euros to104.2 million euros at the end of2001. The market value of the shareportfolio (excluding unit-linkedproducts) fell to 3 213.8 millioneuros, down from 3 532.0 millioneuros a year earlier, with adversedevelopments on the stock marketcausing unrealized gains on this
portfolio to drop to 427 millioneuros. Conversely, the market valueof the portfolio of fixed-incomesecurities climbed by 115.1 millioneuros to 5 442.5 million euros, dueto the interest-rate trend and netpurchases.
As regards the other provisions,those set aside for taxation went upto 71.1 million euros, while the pro-vision for financial risks (156.7 mil-lion euros), the restructuring pro-vision (25.4 million euros) andother provisions (9.1 million euros)remained virtually unchanged.
The changed circumstances on thefinancial markets did not have anadverse effect on solvency.The explicit solvency ratio, i.e. theratio between the solvency capital −excluding unrealized gains −present in the insurance group andthe required solvency capital, wentup by 11 percentage points to318%. The corresponding solvencysurplus climbed from 828.1 millioneuros at the end of 2000 to 921.3million euros in 2001.
Holding-company activitiesThe negative contribution made bythe holding company to Group
0
50
100
150
200
250
300
350
20012000199919981997
SOLVENCY RATIO, KBC INSURANCE
(in %)
318307298311
282
0
2
4
6
8
10
12
14
200120001999
INVESTMENTS INSURANCE
(in billions of EUR)
9.4
1.9
10.6
1.5
11.6
0.8
Carrying value
Unrealized gains
Group results
KBC Bank & Insurance Group − 2001 Annual Report
20
profit increased to -35 million eurosin 2001, from -32 million euros in2000. This is due primarily to thehigher funding costs resulting fromhigher short-term interest rates inthe first half of 2001.
Extraordinary result andtaxationExtraordinary income was almostentirely attributable to the bankingbusiness, where gains of 80.7 mil-lion euros were realized on the saleof the investment in Telenet in thefirst quarter of 2001. It should benoted that the insurance businessalso realized gains of 39 millioneuros on the sale of its stake inTelenet, but that it allocated virtu-ally all of these gains to the pro-vision for financial risks (both takeninto account in the non-recurringresult), in accordance with its valu-ation rules. For the KBC Group,therefore, 75% of the gain2 realizedon the sale of Telenet is reflected innet Group profit.
There was a 28.8% rise in taxes inthe banking business, partly as aresult of tax being assessed forprevious financial years at KBCBank NV (23.4 million euros) andthe higher taxable profits of a num-ber of subsidiaries (certain profitshad not yet been taxable in 2000).In the insurance business, taxeswere 30% lower than in 2000, whenthe tax burden had been exception-ally high due to the realization oftaxable gains from the sale of prop-erty and the sale of Centea’s insur-ance portfolio to Fidea, and toother financial assets.
Profit outlookNow that the difficult year 2001 hascome to a close, KBC expects itsgross income to head up in 2002,powered by higher net interestearnings and better results from itsequity-linked activities, provided of
course that conditions on the finan-cial markets continue to improve.In addition, the belt-tighteningmeasures announced last Octoberwith a view to achieving the mergerobjectives will have a positiveimpact on the cost trend.However, given the uncertaintyregarding economic growth and theinfluence this has on credit volumeand the quality of the loan port-folio, as well as on the financialmarkets, the outlook for financialyear 2002 is itself uncertain andearnings growth difficult to predict.Nevertheless, KBC is convincedthat it is a competitive player, andfaces the year 2002 with confidence.
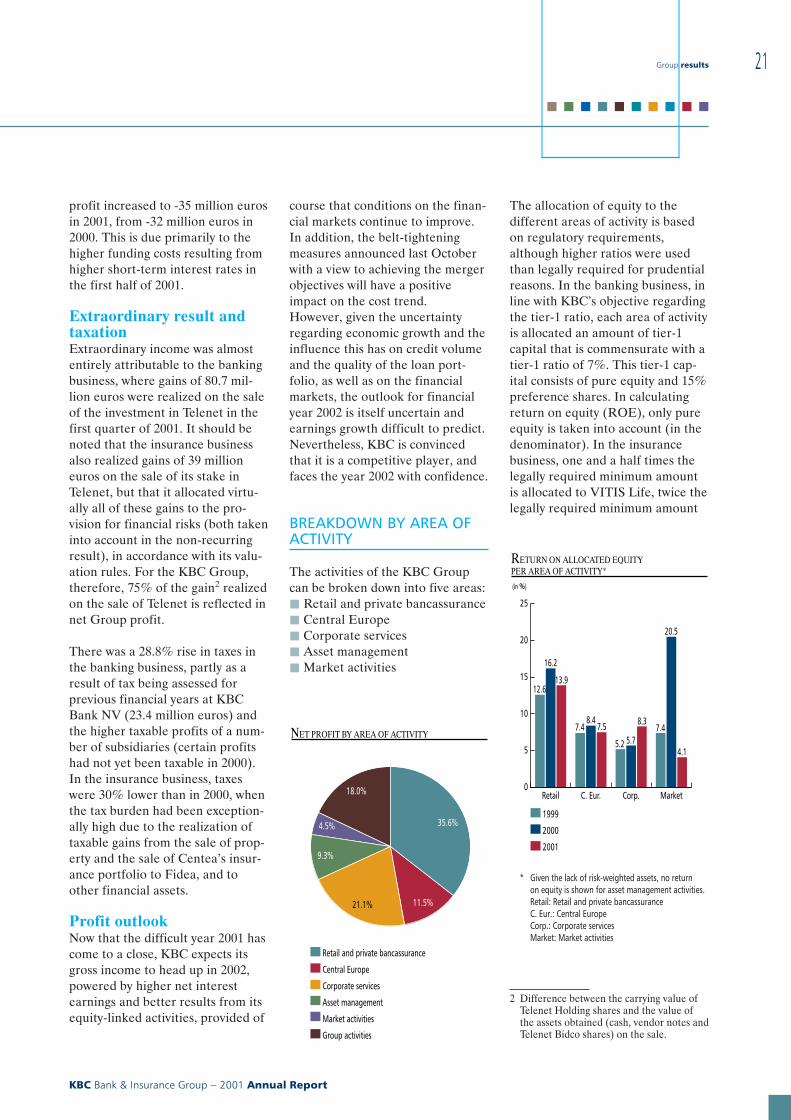
BREAKDOWN BY AREA OFACTIVITY
The activities of the KBC Groupcan be broken down into five areas:j Retail and private bancassurancej Central Europej Corporate servicesj Asset managementj Market activities
The allocation of equity to thedifferent areas of activity is basedon regulatory requirements,although higher ratios were usedthan legally required for prudentialreasons. In the banking business, inline with KBC’s objective regardingthe tier-1 ratio, each area of activityis allocated an amount of tier-1capital that is commensurate with atier-1 ratio of 7%. This tier-1 cap-ital consists of pure equity and 15%preference shares. In calculatingreturn on equity (ROE), only pureequity is taken into account (in thedenominator). In the insurancebusiness, one and a half times thelegally required minimum amountis allocated to VITIS Life, twice thelegally required minimum amount
2 Difference between the carrying value ofTelenet Holding shares and the value ofthe assets obtained (cash, vendor notes andTelenet Bidco shares) on the sale.
NET PROFIT BY AREA OF ACTIVITY
Retail and private bancassurance
Central Europe
Corporate services
Asset management
Market activities
Group activities
18.0%
4.5%
9.3%
21.1% 11.5%
35.6%
Group results
KBC Bank & Insurance Group − 2001 Annual Report
21
■ ■ ■ ■ ■ ■ ■ ■ ■ ■
RETURN ON ALLOCATED EQUITY PER AREA OF ACTIVITY*
(in %)
* Given the lack of risk-weighted assets, no return on equity is shown for asset management activities.Retail: Retail and private bancassuranceC. Eur.: Central EuropeCorp.: Corporate servicesMarket: Market activities
1999
2000
2001
0
5
10
15
20
25
MarketCorp.C. Eur.Retail
12.6
16.2
13.9
7.48.4
7.5
5.2 5.7
8.37.4
20.5
4.1
to the retail businesses and threetimes the legally required minimumamount to corporate services andthe activities in Central Europe.
The ‘Group item’ includes capitalgains in the banking business,adjustments made to the value ofsecurities, income and charges thatcan not, or only arbitrarily, be allo-cated to the specific areas of activ-ity, goodwill that is deducted fromequity, and leveraging (funding ofsubsidiaries’ equity capital with bor-rowings) by the holding company.Consequently, the positive impactof the deduction of goodwill and ofleveraging on ROE is only reflectedin the ROE for the whole Group,but not in the ROE for the differ-ent areas of activity.
Since the previous annual report,a few structural changes − mainlythe introduction of a new profit-centre-based reporting system inthe banking business − andmethodological improvements havebeen made (for 2001 and the refer-ence periods).
These include mainly:j The inclusion of the Fund for
General Banking Risks in netprofit and own funds (and thusalso in the ROE).
j The inclusion of minority inter-ests in net profit (and ROE) forthe various areas of activity(since 100% of the risk-weightedassets are consolidated, allocatedequity also reflects 100% of therisk-weighted assets). Minorityinterests are deducted from netprofit for the ‘Group item’.
j Net profit (and ROE) for theareas of activity being shownbefore the amortization of cap-italized goodwill. The (relativelylimited) amortization of capital-ized goodwill is included underthe ‘Group item’.
The overview table shows the keyfigures per area of activity. In thenext section, a description, detailedfinancial figures and a brief reporton each area of activity is provided.
Group results
KBC Bank & Insurance Group − 2001 Annual Report
22
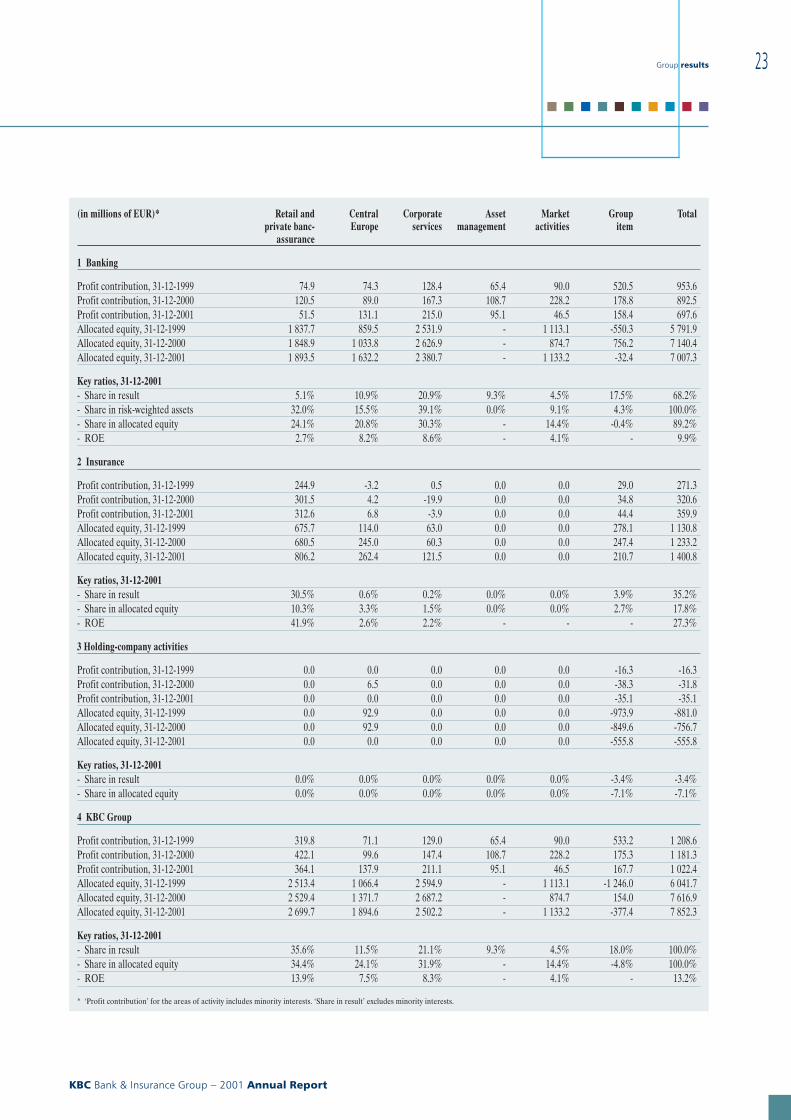
(in millions of EUR)* Retail andprivate banc-
assurance
CentralEurope
Corporateservices
Assetmanagement
Marketactivities
Groupitem
Total
1 Banking
Profit contribution, 31-12-1999 74.9 74.3 128.4 65.4 90.0 520.5 953.6Profit contribution, 31-12-2000 120.5 89.0 167.3 108.7 228.2 178.8 892.5Profit contribution, 31-12-2001 51.5 131.1 215.0 95.1 46.5 158.4 697.6Allocated equity, 31-12-1999 1 837.7 859.5 2 531.9 - 1 113.1 -550.3 5 791.9Allocated equity, 31-12-2000 1 848.9 1 033.8 2 626.9 - 874.7 756.2 7 140.4Allocated equity, 31-12-2001 1 893.5 1 632.2 2 380.7 - 1 133.2 -32.4 7 007.3
Key ratios, 31-12-2001- Share in result 5.1% 10.9% 20.9% 9.3% 4.5% 17.5% 68.2%- Share in risk-weighted assets 32.0% 15.5% 39.1% 0.0% 9.1% 4.3% 100.0%- Share in allocated equity 24.1% 20.8% 30.3% - 14.4% -0.4% 89.2%- ROE 2.7% 8.2% 8.6% - 4.1% - 9.9%
2 Insurance
Profit contribution, 31-12-1999 244.9 -3.2 0.5 0.0 0.0 29.0 271.3Profit contribution, 31-12-2000 301.5 4.2 -19.9 0.0 0.0 34.8 320.6Profit contribution, 31-12-2001 312.6 6.8 -3.9 0.0 0.0 44.4 359.9Allocated equity, 31-12-1999 675.7 114.0 63.0 0.0 0.0 278.1 1 130.8Allocated equity, 31-12-2000 680.5 245.0 60.3 0.0 0.0 247.4 1 233.2Allocated equity, 31-12-2001 806.2 262.4 121.5 0.0 0.0 210.7 1 400.8
Key ratios, 31-12-2001- Share in result 30.5% 0.6% 0.2% 0.0% 0.0% 3.9% 35.2%- Share in allocated equity 10.3% 3.3% 1.5% 0.0% 0.0% 2.7% 17.8%- ROE 41.9% 2.6% 2.2% - - - 27.3%
3 Holding-company activities
Profit contribution, 31-12-1999 0.0 0.0 0.0 0.0 0.0 -16.3 -16.3Profit contribution, 31-12-2000 0.0 6.5 0.0 0.0 0.0 -38.3 -31.8Profit contribution, 31-12-2001 0.0 0.0 0.0 0.0 0.0 -35.1 -35.1Allocated equity, 31-12-1999 0.0 92.9 0.0 0.0 0.0 -973.9 -881.0Allocated equity, 31-12-2000 0.0 92.9 0.0 0.0 0.0 -849.6 -756.7Allocated equity, 31-12-2001 0.0 0.0 0.0 0.0 0.0 -555.8 -555.8
Key ratios, 31-12-2001- Share in result 0.0% 0.0% 0.0% 0.0% 0.0% -3.4% -3.4%- Share in allocated equity 0.0% 0.0% 0.0% 0.0% 0.0% -7.1% -7.1%
4 KBC Group
Profit contribution, 31-12-1999 319.8 71.1 129.0 65.4 90.0 533.2 1 208.6Profit contribution, 31-12-2000 422.1 99.6 147.4 108.7 228.2 175.3 1 181.3Profit contribution, 31-12-2001 364.1 137.9 211.1 95.1 46.5 167.7 1 022.4Allocated equity, 31-12-1999 2 513.4 1 066.4 2 594.9 - 1 113.1 -1 246.0 6 041.7Allocated equity, 31-12-2000 2 529.4 1 371.7 2 687.2 - 874.7 154.0 7 616.9Allocated equity, 31-12-2001 2 699.7 1 894.6 2 502.2 - 1 133.2 -377.4 7 852.3
Key ratios, 31-12-2001- Share in result 35.6% 11.5% 21.1% 9.3% 4.5% 18.0% 100.0%- Share in allocated equity 34.4% 24.1% 31.9% - 14.4% -4.8% 100.0%- ROE 13.9% 7.5% 8.3% - 4.1% - 13.2%
* ‘Profit contribution’ for the areas of activity includes minority interests. ‘Share in result’ excludes minority interests.
Group results
KBC Bank & Insurance Group − 2001 Annual Report
23
■ ■ ■ ■ ■ ■ ■ ■ ■ ■

Results and activitiesper business area
Retail and private bancassurance
■ ■ ■ ‘RETAIL AND PRIVATE BANCASSURANCE’ ENCOMPASSES THE
ACTIVITIES (INCLUDING THOSE PURSUED VIA ELECTRONIC
CHANNELS) OF THE BANK BRANCHES, AGENTS AND BROKERS THAT
CATER FOR PRIVATE PERSONS, THE SELF-EMPLOYED AND LOCAL
BUSINESSES (RETAIL BANCASSURANCE) AND FOR HIGH-NET-
WORTH INDIVIDUALS (PRIVATE BANCASSURANCE). ■ ■ ■
CONTRIBUTION TO THE RESULT
(in millions of EUR) 31-12-1999 31-12-2000 31-12-2001 Change
BankingGross income 1 608.5 1 887.7 1 815.7 -3.8%General administrative expenses -1 392.7 -1 635.0 -1 682.2 2.9%Write-downs and provisions -72.6 -49.7 -46.4 -6.6%Income taxes -68.7 -82.5 -35.7 -56.8%Other 0.5 0.0 0.0 -Profit contribution 74.9 120.5 51.5 -57.3%Profit contribution, Group share 72.3 120.3 52.1 -56.7%
Risk-weighted assets 30 781.4 30 932.3 31 705.4 2.5%Allocated equity 1 837.7 1 848.9 1 893.5 2.4%
Share in Group profit (2000: excl. CCF) 6.0% 10.2% 5.1% -Cost/income ratio 86.6% 86.6% 92.6% -ROE 4.0% 6.5% 2.7% -
InsuranceEarned premiums, net of reinsurance 1 930.8 2 452.9 2 263.8 -7.7%Net technical charges -1 987.3 -2 157.5 -1 753.5 -18.7%Investment income and charges 655.9 398.1 214.1 -46.2%General administrative expenses -293.8 -310.0 -330.8 6.7%Non-recurring and extraordinary results 4.3 19.4 5.9 -69.4%Income taxes -40.5 -73.1 -50.2 -31.3%Other -24.4 -28.3 -36.7 29.7%Profit contribution 244.9 301.5 312.6 3.7%Profit contribution, Group share 244.7 301.2 311.4 3.4%
Allocated equity 675.7 680.5 806.2 18.5%Share in Group profit (2000: excl. CCF) 20.2% 25.5% 30.5% -Combined ratio 103.9% 101.6% 100.0% -ROE 36.1% 41.3% 41.9% -
KBC GroupProfit contribution 319.8 422.1 364.1 -13.7%Profit contribution, Group share 317.0 421.5 363.5 -13.8%
Allocated equity 2 513.4 2 529.4 2 699.7 6.7%Share in Group profit (2000: excl. CCF) 26.2% 35.7% 35.6% -ROE 12.6% 16.2% 13.9% -
0
2
4
6
8
10
12
14
16
18
200120001999
RETURN ON ALLOCATED EQUITY
(in %)
12.6
16.2
13.9
SHARE IN GROUP PROFIT
Retail and private bancassurance
Other business areas
35.6%
64.4%
Retail and private bancassurance
KBC Bank & Insurance Group − 2001 Annual Report
24
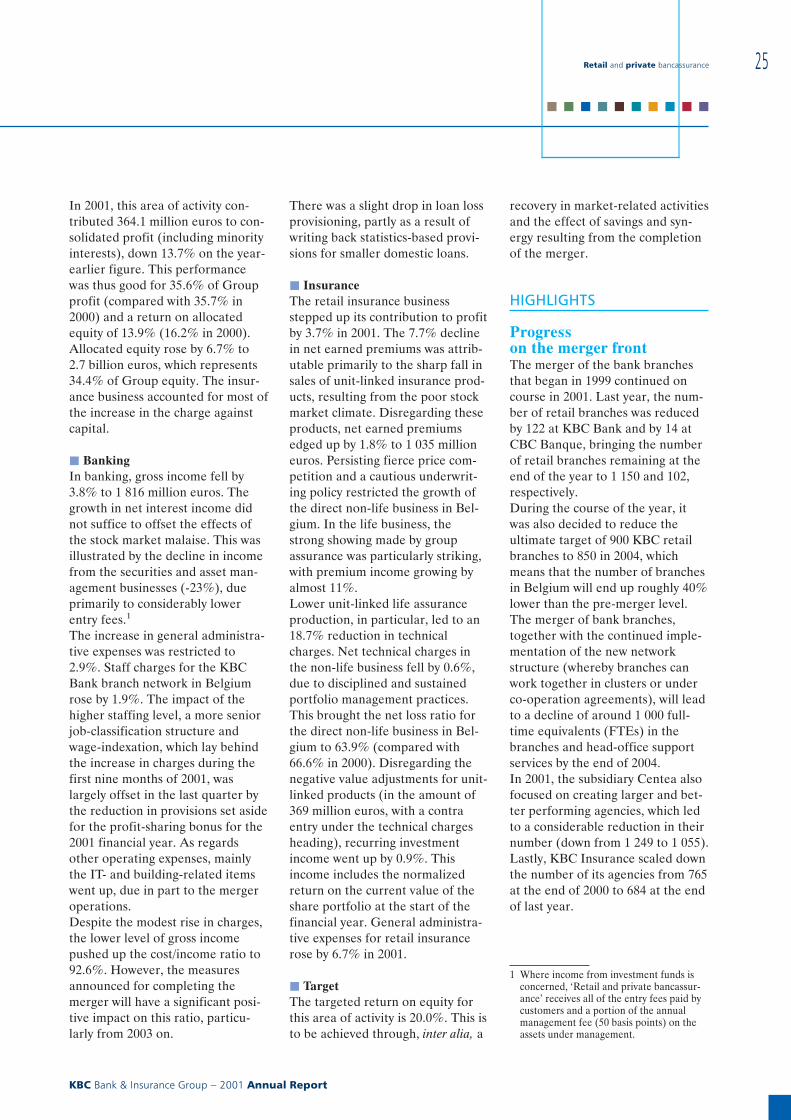
In 2001, this area of activity con-tributed 364.1 million euros to con-solidated profit (including minorityinterests), down 13.7% on the year-earlier figure. This performancewas thus good for 35.6% of Groupprofit (compared with 35.7% in2000) and a return on allocatedequity of 13.9% (16.2% in 2000).Allocated equity rose by 6.7% to2.7 billion euros, which represents34.4% of Group equity. The insur-ance business accounted for most ofthe increase in the charge againstcapital.
j BankingIn banking, gross income fell by3.8% to 1 816 million euros. Thegrowth in net interest income didnot suffice to offset the effects ofthe stock market malaise. This wasillustrated by the decline in incomefrom the securities and asset man-agement businesses (-23%), dueprimarily to considerably lowerentry fees.1
The increase in general administra-tive expenses was restricted to2.9%. Staff charges for the KBCBank branch network in Belgiumrose by 1.9%. The impact of thehigher staffing level, a more seniorjob-classification structure andwage-indexation, which lay behindthe increase in charges during thefirst nine months of 2001, waslargely offset in the last quarter bythe reduction in provisions set asidefor the profit-sharing bonus for the2001 financial year. As regardsother operating expenses, mainlythe IT- and building-related itemswent up, due in part to the mergeroperations.Despite the modest rise in charges,the lower level of gross incomepushed up the cost/income ratio to92.6%. However, the measuresannounced for completing themerger will have a significant posi-tive impact on this ratio, particu-larly from 2003 on.
There was a slight drop in loan lossprovisioning, partly as a result ofwriting back statistics-based provi-sions for smaller domestic loans.
j InsuranceThe retail insurance businessstepped up its contribution to profitby 3.7% in 2001. The 7.7% declinein net earned premiums was attrib-utable primarily to the sharp fall insales of unit-linked insurance prod-ucts, resulting from the poor stockmarket climate. Disregarding theseproducts, net earned premiumsedged up by 1.8% to 1 035 millioneuros. Persisting fierce price com-petition and a cautious underwrit-ing policy restricted the growth ofthe direct non-life business in Bel-gium. In the life business, thestrong showing made by groupassurance was particularly striking,with premium income growing byalmost 11%.Lower unit-linked life assuranceproduction, in particular, led to an18.7% reduction in technicalcharges. Net technical charges inthe non-life business fell by 0.6%,due to disciplined and sustainedportfolio management practices.This brought the net loss ratio forthe direct non-life business in Bel-gium to 63.9% (compared with66.6% in 2000). Disregarding thenegative value adjustments for unit-linked products (in the amount of369 million euros, with a contraentry under the technical chargesheading), recurring investmentincome went up by 0.9%. Thisincome includes the normalizedreturn on the current value of theshare portfolio at the start of thefinancial year. General administra-tive expenses for retail insurancerose by 6.7% in 2001.
j TargetThe targeted return on equity forthis area of activity is 20.0%. This isto be achieved through, inter alia, a
recovery in market-related activitiesand the effect of savings and syn-ergy resulting from the completionof the merger.
HIGHLIGHTS
Progresson the merger frontThe merger of the bank branchesthat began in 1999 continued oncourse in 2001. Last year, the num-ber of retail branches was reducedby 122 at KBC Bank and by 14 atCBC Banque, bringing the numberof retail branches remaining at theend of the year to 1 150 and 102,respectively.During the course of the year, itwas also decided to reduce theultimate target of 900 KBC retailbranches to 850 in 2004, whichmeans that the number of branchesin Belgium will end up roughly 40%lower than the pre-merger level.The merger of bank branches,together with the continued imple-mentation of the new networkstructure (whereby branches canwork together in clusters or underco-operation agreements), will leadto a decline of around 1 000 full-time equivalents (FTEs) in thebranches and head-office supportservices by the end of 2004.In 2001, the subsidiary Centea alsofocused on creating larger and bet-ter performing agencies, which ledto a considerable reduction in theirnumber (down from 1 249 to 1 055).Lastly, KBC Insurance scaled downthe number of its agencies from 765at the end of 2000 to 684 at the endof last year.
1 Where income from investment funds isconcerned, ‘Retail and private bancassur-ance’ receives all of the entry fees paid bycustomers and a portion of the annualmanagement fee (50 basis points) on theassets under management.
Retail and private bancassurance
KBC Bank & Insurance Group − 2001 Annual Report
25
■ ■ ■ ■ ■ ■ ■ ■ ■ ■
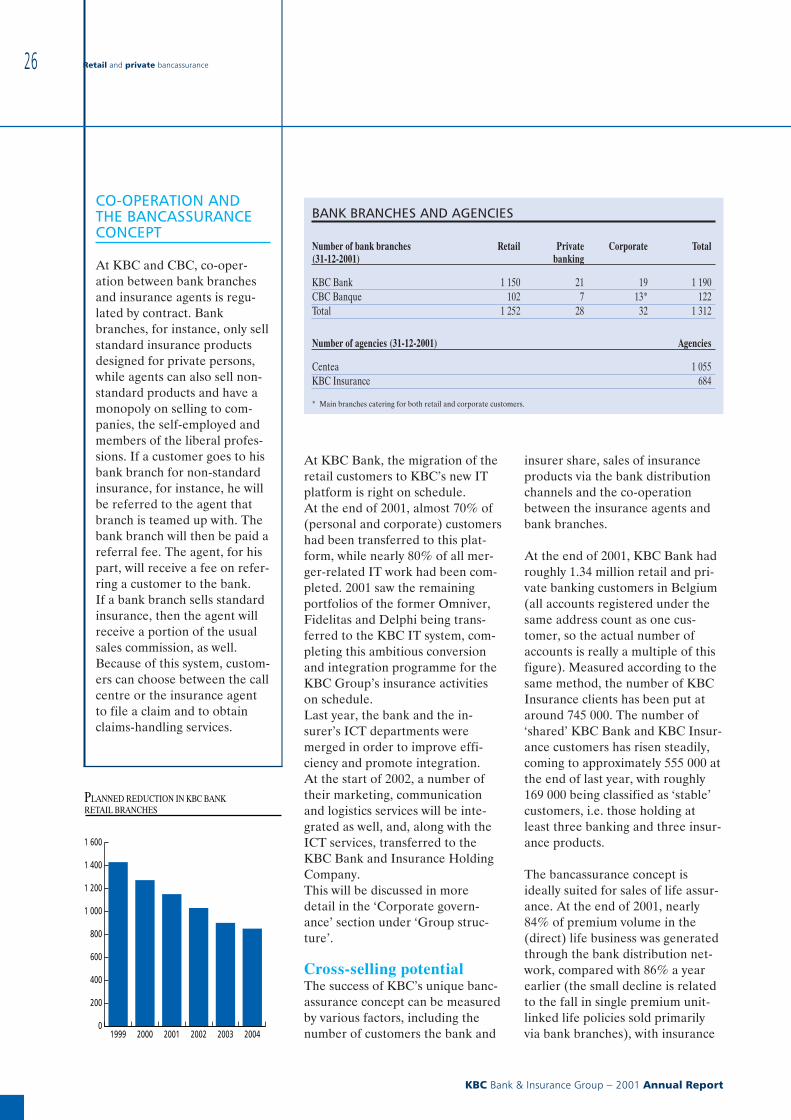
At KBC Bank, the migration of theretail customers to KBC’s new ITplatform is right on schedule.At the end of 2001, almost 70% of(personal and corporate) customershad been transferred to this plat-form, while nearly 80% of all mer-ger-related IT work had been com-pleted. 2001 saw the remainingportfolios of the former Omniver,Fidelitas and Delphi being trans-ferred to the KBC IT system, com-pleting this ambitious conversionand integration programme for theKBC Group’s insurance activitieson schedule.Last year, the bank and the in-surer’s ICT departments weremerged in order to improve effi-ciency and promote integration.At the start of 2002, a number oftheir marketing, communicationand logistics services will be inte-grated as well, and, along with theICT services, transferred to theKBC Bank and Insurance HoldingCompany.This will be discussed in moredetail in the ‘Corporate govern-ance’ section under ‘Group struc-ture’.
Cross-selling potentialThe success of KBC’s unique banc-assurance concept can be measuredby various factors, including thenumber of customers the bank and
insurer share, sales of insuranceproducts via the bank distributionchannels and the co-operationbetween the insurance agents andbank branches.
At the end of 2001, KBC Bank hadroughly 1.34 million retail and pri-vate banking customers in Belgium(all accounts registered under thesame address count as one cus-tomer, so the actual number ofaccounts is really a multiple of thisfigure). Measured according to thesame method, the number of KBCInsurance clients has been put ataround 745 000. The number of‘shared’ KBC Bank and KBC Insur-ance customers has risen steadily,coming to approximately 555 000 atthe end of last year, with roughly169 000 being classified as ‘stable’customers, i.e. those holding atleast three banking and three insur-ance products.
The bancassurance concept isideally suited for sales of life assur-ance. At the end of 2001, nearly84% of premium volume in the(direct) life business was generatedthrough the bank distribution net-work, compared with 86% a yearearlier (the small decline is relatedto the fall in single premium unit-linked life policies sold primarilyvia bank branches), with insurance
BANK BRANCHES AND AGENCIES
Number of bank branches(31-12-2001)
Retail Privatebanking
Corporate Total
KBC Bank 1 150 21 19 1 190CBC Banque 102 7 13* 122Total 1 252 28 32 1 312
Number of agencies (31-12-2001) Agencies
Centea 1 055KBC Insurance 684
* Main branches catering for both retail and corporate customers.
0
200
400
600
800
1 000
1 200
1 400
1 600
200420032002200120001999
PLANNED REDUCTION IN KBC BANK RETAIL BRANCHES
CO-OPERATION ANDTHE BANCASSURANCECONCEPT
At KBC and CBC, co-oper-ation between bank branchesand insurance agents is regu-lated by contract. Bankbranches, for instance, only sellstandard insurance productsdesigned for private persons,while agents can also sell non-standard products and have amonopoly on selling to com-panies, the self-employed andmembers of the liberal profes-sions. If a customer goes to hisbank branch for non-standardinsurance, for instance, he willbe referred to the agent thatbranch is teamed up with. Thebank branch will then be paid areferral fee. The agent, for hispart, will receive a fee on refer-ring a customer to the bank.If a bank branch sells standardinsurance, then the agent willreceive a portion of the usualsales commission, as well.Because of this system, custom-ers can choose between the callcentre or the insurance agentto file a claim and to obtainclaims-handling services.
Retail and private bancassurance
KBC Bank & Insurance Group − 2001 Annual Report
26
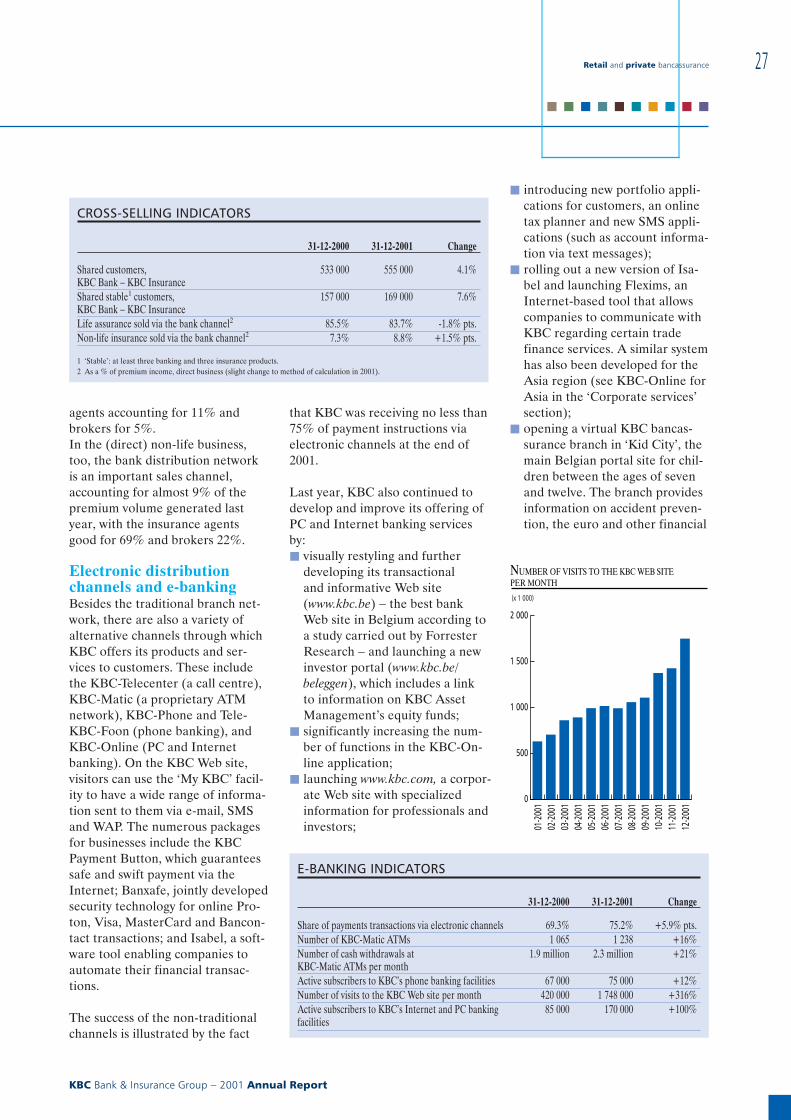
agents accounting for 11% andbrokers for 5%.In the (direct) non-life business,too, the bank distribution networkis an important sales channel,accounting for almost 9% of thepremium volume generated lastyear, with the insurance agentsgood for 69% and brokers 22%.
Electronic distributionchannels and e-bankingBesides the traditional branch net-work, there are also a variety ofalternative channels through whichKBC offers its products and ser-vices to customers. These includethe KBC-Telecenter (a call centre),KBC-Matic (a proprietary ATMnetwork), KBC-Phone and Tele-KBC-Foon (phone banking), andKBC-Online (PC and Internetbanking). On the KBC Web site,visitors can use the ‘My KBC’ facil-ity to have a wide range of informa-tion sent to them via e-mail, SMSand WAP. The numerous packagesfor businesses include the KBCPayment Button, which guaranteessafe and swift payment via theInternet; Banxafe, jointly developedsecurity technology for online Pro-ton, Visa, MasterCard and Bancon-tact transactions; and Isabel, a soft-ware tool enabling companies toautomate their financial transac-tions.
The success of the non-traditionalchannels is illustrated by the fact
that KBC was receiving no less than75% of payment instructions viaelectronic channels at the end of2001.
Last year, KBC also continued todevelop and improve its offering ofPC and Internet banking servicesby:j visually restyling and further
developing its transactionaland informative Web site(www.kbc.be) − the best bankWeb site in Belgium according toa study carried out by ForresterResearch − and launching a newinvestor portal (www.kbc.be/beleggen), which includes a linkto information on KBC AssetManagement’s equity funds;
j significantly increasing the num-ber of functions in the KBC-On-line application;
j launching www.kbc.com, a corpor-ate Web site with specializedinformation for professionals andinvestors;
j introducing new portfolio appli-cations for customers, an onlinetax planner and new SMS appli-cations (such as account informa-tion via text messages);
j rolling out a new version of Isa-bel and launching Flexims, anInternet-based tool that allowscompanies to communicate withKBC regarding certain tradefinance services. A similar systemhas also been developed for theAsia region (see KBC-Online forAsia in the ‘Corporate services’section);
j opening a virtual KBC bancas-surance branch in ‘Kid City’, themain Belgian portal site for chil-dren between the ages of sevenand twelve. The branch providesinformation on accident preven-tion, the euro and other financial
CROSS-SELLING INDICATORS
31-12-2000 31-12-2001 Change
Shared customers,KBC Bank − KBC Insurance
533 000 555 000 4.1%
Shared stable1 customers,KBC Bank − KBC Insurance
157 000 169 000 7.6%
Life assurance sold via the bank channel2 85.5% 83.7% -1.8% pts.Non-life insurance sold via the bank channel2 7.3% 8.8% +1.5% pts.
1 ‘Stable’: at least three banking and three insurance products.2 As a % of premium income, direct business (slight change to method of calculation in 2001).
E-BANKING INDICATORS
31-12-2000 31-12-2001 Change
Share of payments transactions via electronic channels 69.3% 75.2% +5.9% pts.Number of KBC-Matic ATMs 1 065 1 238 +16%Number of cash withdrawals atKBC-Matic ATMs per month
1.9 million 2.3 million +21%
Active subscribers to KBC’s phone banking facilities 67 000 75 000 +12%Number of visits to the KBC Web site per month 420 000 1 748 000 +316%Active subscribers to KBC’s Internet and PC bankingfacilities
85 000 170 000 +100%
0
500
1 000
1 500
2 000
12-2
001
11-2
001
10-2
001
09-2
001
08-2
001
07-2
001
06-2
001
05-2
001
04-2
001
03-2
001
02-2
001
01-2
001
NUMBER OF VISITS TO THE KBC WEB SITE PER MONTH
(x 1 000)
Retail and private bancassurance
KBC Bank & Insurance Group − 2001 Annual Report
27
■ ■ ■ ■ ■ ■ ■ ■ ■ ■
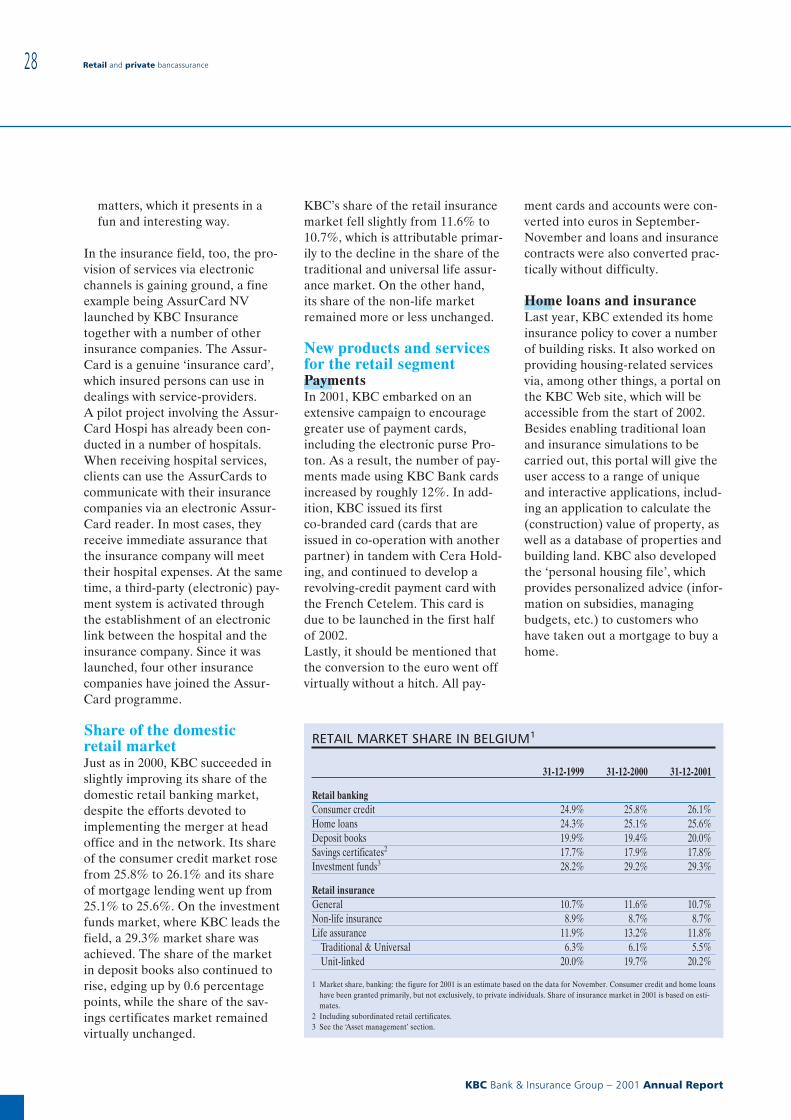
matters, which it presents in afun and interesting way.
In the insurance field, too, the pro-vision of services via electronicchannels is gaining ground, a fineexample being AssurCard NVlaunched by KBC Insurancetogether with a number of otherinsurance companies. The Assur-Card is a genuine ‘insurance card’,which insured persons can use indealings with service-providers.A pilot project involving the Assur-Card Hospi has already been con-ducted in a number of hospitals.When receiving hospital services,clients can use the AssurCards tocommunicate with their insurancecompanies via an electronic Assur-Card reader. In most cases, theyreceive immediate assurance thatthe insurance company will meettheir hospital expenses. At the sametime, a third-party (electronic) pay-ment system is activated throughthe establishment of an electroniclink between the hospital and theinsurance company. Since it waslaunched, four other insurancecompanies have joined the Assur-Card programme.
Share of the domesticretail marketJust as in 2000, KBC succeeded inslightly improving its share of thedomestic retail banking market,despite the efforts devoted toimplementing the merger at headoffice and in the network. Its shareof the consumer credit market rosefrom 25.8% to 26.1% and its shareof mortgage lending went up from25.1% to 25.6%. On the investmentfunds market, where KBC leads thefield, a 29.3% market share wasachieved. The share of the marketin deposit books also continued torise, edging up by 0.6 percentagepoints, while the share of the sav-ings certificates market remainedvirtually unchanged.
KBC’s share of the retail insurancemarket fell slightly from 11.6% to10.7%, which is attributable primar-ily to the decline in the share of thetraditional and universal life assur-ance market. On the other hand,its share of the non-life marketremained more or less unchanged.
New products and servicesfor the retail segmentPaymentsIn 2001, KBC embarked on anextensive campaign to encouragegreater use of payment cards,including the electronic purse Pro-ton. As a result, the number of pay-ments made using KBC Bank cardsincreased by roughly 12%. In add-ition, KBC issued its firstco-branded card (cards that areissued in co-operation with anotherpartner) in tandem with Cera Hold-ing, and continued to develop arevolving-credit payment card withthe French Cetelem. This card isdue to be launched in the first halfof 2002.Lastly, it should be mentioned thatthe conversion to the euro went offvirtually without a hitch. All pay-
ment cards and accounts were con-verted into euros in September-November and loans and insurancecontracts were also converted prac-tically without difficulty.
Home loans and insuranceLast year, KBC extended its homeinsurance policy to cover a numberof building risks. It also worked onproviding housing-related servicesvia, among other things, a portal onthe KBC Web site, which will beaccessible from the start of 2002.Besides enabling traditional loanand insurance simulations to becarried out, this portal will give theuser access to a range of uniqueand interactive applications, includ-ing an application to calculate the(construction) value of property, aswell as a database of properties andbuilding land. KBC also developedthe ‘personal housing file’, whichprovides personalized advice (infor-mation on subsidies, managingbudgets, etc.) to customers whohave taken out a mortgage to buy ahome.
RETAIL MARKET SHARE IN BELGIUM1
31-12-1999 31-12-2000 31-12-2001
Retail bankingConsumer credit 24.9% 25.8% 26.1%Home loans 24.3% 25.1% 25.6%Deposit books 19.9% 19.4% 20.0%Savings certificates2 17.7% 17.9% 17.8%Investment funds3 28.2% 29.2% 29.3%
Retail insuranceGeneral 10.7% 11.6% 10.7%Non-life insurance 8.9% 8.7% 8.7%Life assurance 11.9% 13.2% 11.8%
Traditional & Universal 6.3% 6.1% 5.5%Unit-linked 20.0% 19.7% 20.2%
1 Market share, banking: the figure for 2001 is an estimate based on the data for November. Consumer credit and home loanshave been granted primarily, but not exclusively, to private individuals. Share of insurance market in 2001 is based on esti-mates.
2 Including subordinated retail certificates.3 See the ‘Asset management’ section.
Retail and private bancassurance
KBC Bank & Insurance Group − 2001 Annual Report
28
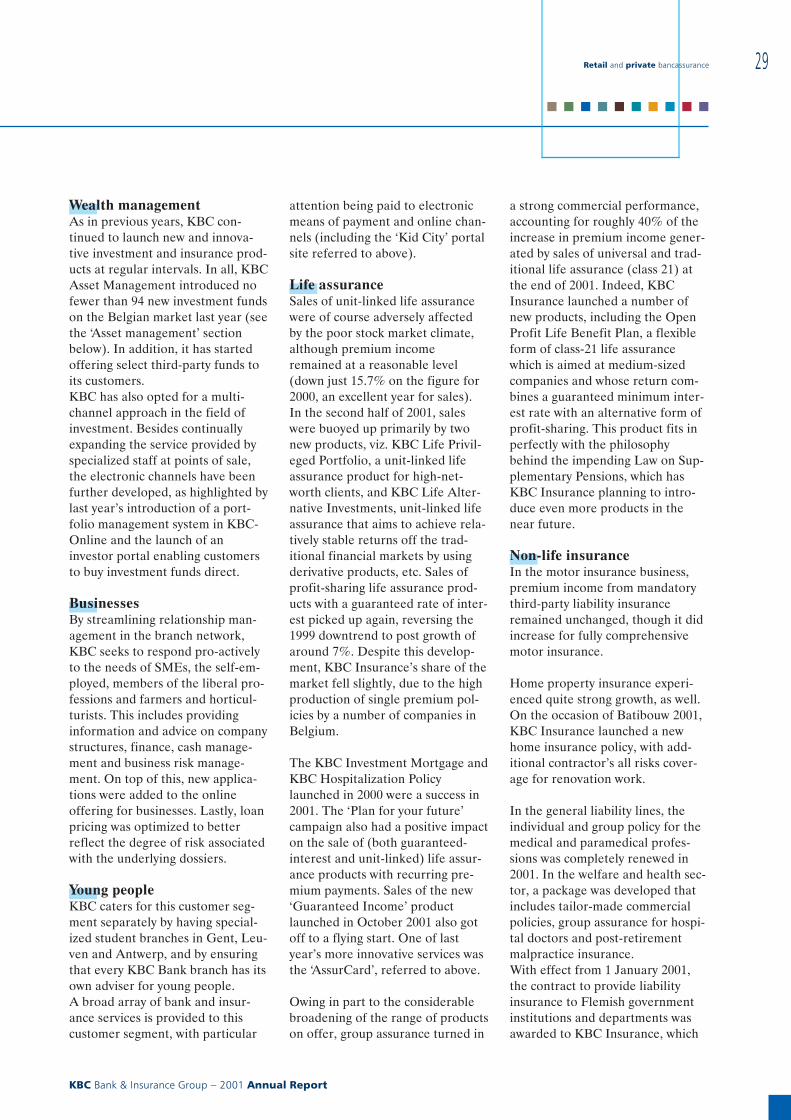
Wealth managementAs in previous years, KBC con-tinued to launch new and innova-tive investment and insurance prod-ucts at regular intervals. In all, KBCAsset Management introduced nofewer than 94 new investment fundson the Belgian market last year (seethe ‘Asset management’ sectionbelow). In addition, it has startedoffering select third-party funds toits customers.KBC has also opted for a multi-channel approach in the field ofinvestment. Besides continuallyexpanding the service provided byspecialized staff at points of sale,the electronic channels have beenfurther developed, as highlighted bylast year’s introduction of a port-folio management system in KBC-Online and the launch of aninvestor portal enabling customersto buy investment funds direct.
BusinessesBy streamlining relationship man-agement in the branch network,KBC seeks to respond pro-activelyto the needs of SMEs, the self-em-ployed, members of the liberal pro-fessions and farmers and horticul-turists. This includes providinginformation and advice on companystructures, finance, cash manage-ment and business risk manage-ment. On top of this, new applica-tions were added to the onlineoffering for businesses. Lastly, loanpricing was optimized to betterreflect the degree of risk associatedwith the underlying dossiers.
Young peopleKBC caters for this customer seg-ment separately by having special-ized student branches in Gent, Leu-ven and Antwerp, and by ensuringthat every KBC Bank branch has itsown adviser for young people.A broad array of bank and insur-ance services is provided to thiscustomer segment, with particular
attention being paid to electronicmeans of payment and online chan-nels (including the ‘Kid City’ portalsite referred to above).
Life assuranceSales of unit-linked life assurancewere of course adversely affectedby the poor stock market climate,although premium incomeremained at a reasonable level(down just 15.7% on the figure for2000, an excellent year for sales).In the second half of 2001, saleswere buoyed up primarily by twonew products, viz. KBC Life Privil-eged Portfolio, a unit-linked lifeassurance product for high-net-worth clients, and KBC Life Alter-native Investments, unit-linked lifeassurance that aims to achieve rela-tively stable returns off the trad-itional financial markets by usingderivative products, etc. Sales ofprofit-sharing life assurance prod-ucts with a guaranteed rate of inter-est picked up again, reversing the1999 downtrend to post growth ofaround 7%. Despite this develop-ment, KBC Insurance’s share of themarket fell slightly, due to the highproduction of single premium pol-icies by a number of companies inBelgium.
The KBC Investment Mortgage andKBC Hospitalization Policylaunched in 2000 were a success in2001. The ‘Plan for your future’campaign also had a positive impacton the sale of (both guaranteed-interest and unit-linked) life assur-ance products with recurring pre-mium payments. Sales of the new‘Guaranteed Income’ productlaunched in October 2001 also gotoff to a flying start. One of lastyear’s more innovative services wasthe ‘AssurCard’, referred to above.
Owing in part to the considerablebroadening of the range of productson offer, group assurance turned in
a strong commercial performance,accounting for roughly 40% of theincrease in premium income gener-ated by sales of universal and trad-itional life assurance (class 21) atthe end of 2001. Indeed, KBCInsurance launched a number ofnew products, including the OpenProfit Life Benefit Plan, a flexibleform of class-21 life assurancewhich is aimed at medium-sizedcompanies and whose return com-bines a guaranteed minimum inter-est rate with an alternative form ofprofit-sharing. This product fits inperfectly with the philosophybehind the impending Law on Sup-plementary Pensions, which hasKBC Insurance planning to intro-duce even more products in thenear future.
Non-life insuranceIn the motor insurance business,premium income from mandatorythird-party liability insuranceremained unchanged, though it didincrease for fully comprehensivemotor insurance.
Home property insurance experi-enced quite strong growth, as well.On the occasion of Batibouw 2001,KBC Insurance launched a newhome insurance policy, with add-itional contractor’s all risks cover-age for renovation work.
In the general liability lines, theindividual and group policy for themedical and paramedical profes-sions was completely renewed in2001. In the welfare and health sec-tor, a package was developed thatincludes tailor-made commercialpolicies, group assurance for hospi-tal doctors and post-retirementmalpractice insurance.With effect from 1 January 2001,the contract to provide liabilityinsurance to Flemish governmentinstitutions and departments wasawarded to KBC Insurance, which
Retail and private bancassurance
KBC Bank & Insurance Group − 2001 Annual Report
29
■ ■ ■ ■ ■ ■ ■ ■ ■ ■
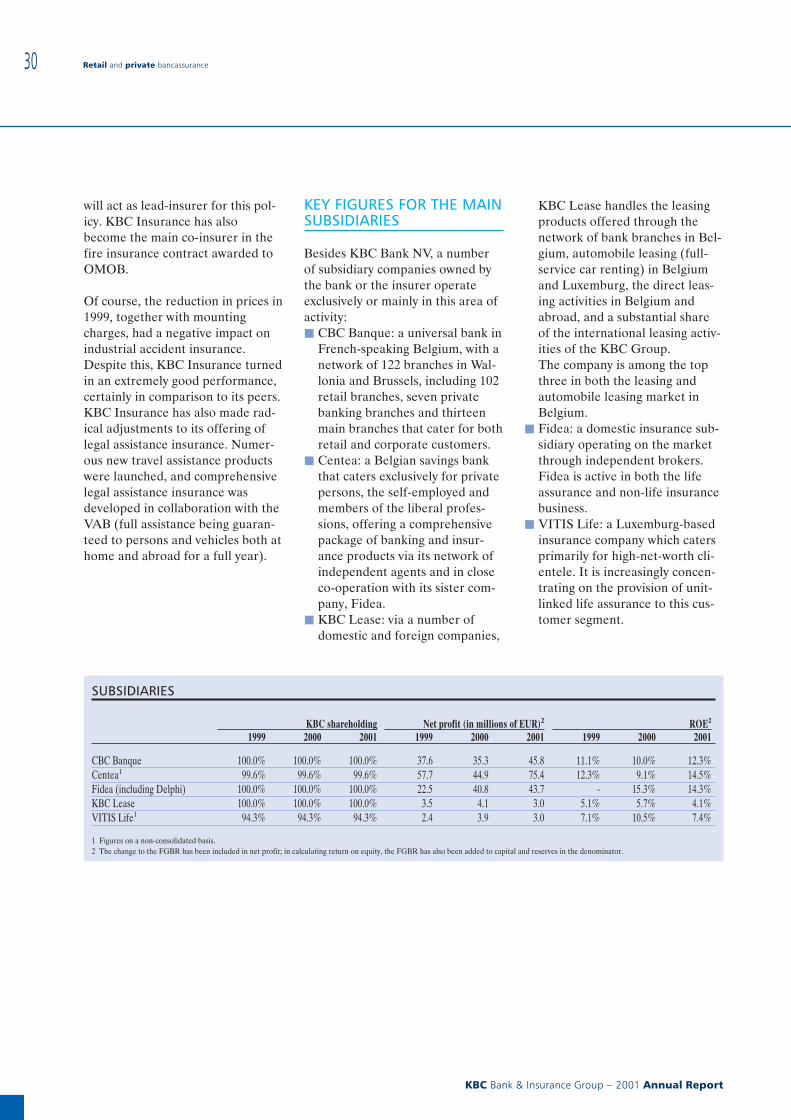
will act as lead-insurer for this pol-icy. KBC Insurance has alsobecome the main co-insurer in thefire insurance contract awarded toOMOB.
Of course, the reduction in prices in1999, together with mountingcharges, had a negative impact onindustrial accident insurance.Despite this, KBC Insurance turnedin an extremely good performance,certainly in comparison to its peers.KBC Insurance has also made rad-ical adjustments to its offering oflegal assistance insurance. Numer-ous new travel assistance productswere launched, and comprehensivelegal assistance insurance wasdeveloped in collaboration with theVAB (full assistance being guaran-teed to persons and vehicles both athome and abroad for a full year).
KEY FIGURES FOR THE MAINSUBSIDIARIES
Besides KBC Bank NV, a numberof subsidiary companies owned bythe bank or the insurer operateexclusively or mainly in this area ofactivity:j CBC Banque: a universal bank in
French-speaking Belgium, with anetwork of 122 branches in Wal-lonia and Brussels, including 102retail branches, seven privatebanking branches and thirteenmain branches that cater for bothretail and corporate customers.
j Centea: a Belgian savings bankthat caters exclusively for privatepersons, the self-employed andmembers of the liberal profes-sions, offering a comprehensivepackage of banking and insur-ance products via its network ofindependent agents and in closeco-operation with its sister com-pany, Fidea.
j KBC Lease: via a number ofdomestic and foreign companies,
KBC Lease handles the leasingproducts offered through thenetwork of bank branches in Bel-gium, automobile leasing (full-service car renting) in Belgiumand Luxemburg, the direct leas-ing activities in Belgium andabroad, and a substantial shareof the international leasing activ-ities of the KBC Group.The company is among the topthree in both the leasing andautomobile leasing market inBelgium.
j Fidea: a domestic insurance sub-sidiary operating on the marketthrough independent brokers.Fidea is active in both the lifeassurance and non-life insurancebusiness.
j VITIS Life: a Luxemburg-basedinsurance company which catersprimarily for high-net-worth cli-entele. It is increasingly concen-trating on the provision of unit-linked life assurance to this cus-tomer segment.
SUBSIDIARIES
KBC shareholding Net profit (in millions of EUR)2 ROE2
1999 2000 2001 1999 2000 2001 1999 2000 2001
CBC Banque 100.0% 100.0% 100.0% 37.6 35.3 45.8 11.1% 10.0% 12.3%Centea1 99.6% 99.6% 99.6% 57.7 44.9 75.4 12.3% 9.1% 14.5%Fidea (including Delphi) 100.0% 100.0% 100.0% 22.5 40.8 43.7 - 15.3% 14.3%KBC Lease 100.0% 100.0% 100.0% 3.5 4.1 3.0 5.1% 5.7% 4.1%VITIS Life1 94.3% 94.3% 94.3% 2.4 3.9 3.0 7.1% 10.5% 7.4%
1 Figures on a non-consolidated basis.2 The change to the FGBR has been included in net profit; in calculating return on equity, the FGBR has also been added to capital and reserves in the denominator.
Retail and private bancassurance
KBC Bank & Insurance Group − 2001 Annual Report
30
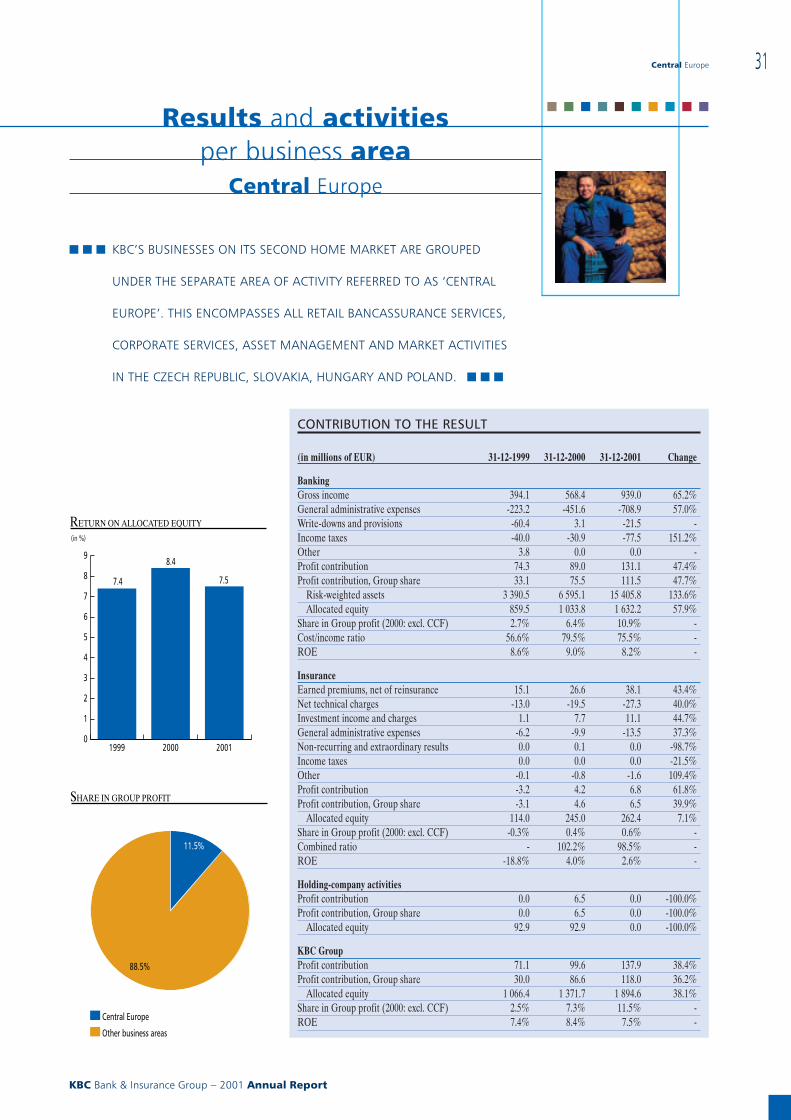
Results and activitiesper business area
Central Europe
■ ■ ■ KBC’S BUSINESSES ON ITS SECOND HOME MARKET ARE GROUPED
UNDER THE SEPARATE AREA OF ACTIVITY REFERRED TO AS ‘CENTRAL
EUROPE’. THIS ENCOMPASSES ALL RETAIL BANCASSURANCE SERVICES,
CORPORATE SERVICES, ASSET MANAGEMENT AND MARKET ACTIVITIES
IN THE CZECH REPUBLIC, SLOVAKIA, HUNGARY AND POLAND. ■ ■ ■
CONTRIBUTION TO THE RESULT
(in millions of EUR) 31-12-1999 31-12-2000 31-12-2001 Change
BankingGross income 394.1 568.4 939.0 65.2%General administrative expenses -223.2 -451.6 -708.9 57.0%Write-downs and provisions -60.4 3.1 -21.5 -Income taxes -40.0 -30.9 -77.5 151.2%Other 3.8 0.0 0.0 -Profit contribution 74.3 89.0 131.1 47.4%Profit contribution, Group share 33.1 75.5 111.5 47.7%
Risk-weighted assets 3 390.5 6 595.1 15 405.8 133.6%Allocated equity 859.5 1 033.8 1 632.2 57.9%
Share in Group profit (2000: excl. CCF) 2.7% 6.4% 10.9% -Cost/income ratio 56.6% 79.5% 75.5% -ROE 8.6% 9.0% 8.2% -
InsuranceEarned premiums, net of reinsurance 15.1 26.6 38.1 43.4%Net technical charges -13.0 -19.5 -27.3 40.0%Investment income and charges 1.1 7.7 11.1 44.7%General administrative expenses -6.2 -9.9 -13.5 37.3%Non-recurring and extraordinary results 0.0 0.1 0.0 -98.7%Income taxes 0.0 0.0 0.0 -21.5%Other -0.1 -0.8 -1.6 109.4%Profit contribution -3.2 4.2 6.8 61.8%Profit contribution, Group share -3.1 4.6 6.5 39.9%
Allocated equity 114.0 245.0 262.4 7.1%Share in Group profit (2000: excl. CCF) -0.3% 0.4% 0.6% -Combined ratio - 102.2% 98.5% -ROE -18.8% 4.0% 2.6% -
Holding-company activitiesProfit contribution 0.0 6.5 0.0 -100.0%Profit contribution, Group share 0.0 6.5 0.0 -100.0%
Allocated equity 92.9 92.9 0.0 -100.0%
KBC GroupProfit contribution 71.1 99.6 137.9 38.4%Profit contribution, Group share 30.0 86.6 118.0 36.2%
Allocated equity 1 066.4 1 371.7 1 894.6 38.1%Share in Group profit (2000: excl. CCF) 2.5% 7.3% 11.5% -ROE 7.4% 8.4% 7.5% -
0
1
2
3
4
5
6
7
8
9
200120001999
RETURN ON ALLOCATED EQUITY
(in %)
7.4
8.4
7.5
SHARE IN GROUP PROFIT
Central Europe
Other business areas
11.5%
88.5%
Central Europe
KBC Bank & Insurance Group − 2001 Annual Report
31
■ ■ ■ ■ ■ ■ ■ ■ ■ ■
In 2001, this area of activity con-tributed 137.9 million euros to con-solidated profit (19.9 million ofwhich minority interests), up 38.4%on the year-earlier figure. This per-formance was thus good for 11.5%of Group profit (compared with7.3% in 2000) and a return on allo-cated equity of 7.5% (8.4% in2000). The slight decline in returnon equity − despite the sharpincrease in the contribution toprofit − is attributable to the inclu-sion of Kredyt Bank and ABNAMRO Magyar (cf. merger withK&H Bank, see below) in risk-weighted assets. This served to pushaverage allocated equity up by 55%(account taken of changes in thescope of consolidation).On 31 December 2001, the equityallocated to this area of activityamounted to 1 895 million euros,or 24.1% of Group equity.
j BankingThe robust growth in gross income(+65.2%) and general administra-tive expenses (+57.0%) was relatedprimarily to the above-mentionedchanges in the scope of consolida-tion and the inclusion of IPB in theresults of C{SOB (fully consolidatedas of mid-2000). Not taking thesefactors into account, gross incomewent up by approximately 4% andoperating costs by roughly 1%.Loan loss provisions of 21.5 millioneuros include a write-back for alarge loan at C{SOB in the firstquarter of 2001 and considerableextra provisioning at Kredyt Bankin the fourth quarter; one of the
reasons why Kredyt Bank made aslightly negative contribution toprofit in this area of activity (seebelow).
j InsuranceAlthough still marginal, the profitcontribution made by the insurancebusiness rose by 62% in 2001, duein part to the much improved per-formance turned in by Argosz.It also includes the 5.71% stakewhich KBC Insurance holds inC{SOB.
j TargetThis area of activity has a targetedreturn on equity of 15% and shouldcome to account for 15% of Groupprofit in the foreseeable future(one to two years).
HIGHLIGHTS
The Czech Republic andSlovakiaMain participating interests:j C{SOB (universal bank, 83.8%
shareholding)j Patria Finance (investment bank,
100% shareholding)j C{SOB Pojist’ovna (mainly non-
life insurance, 100% sharehold-ing)
j Since the end of February 2002:IPB Pojist’ovna (non-life and lifeinsurance)
C{SOB is one of the leadingfinancial groups in CentralEurope, thanks to theacquisition of the assets andliabilities of IPBSince acquiring the assets andliabilities of IPB, C{SOB hasbecome not only the leading finan-cial institution in the Czech Repub-lic, but one of the premier playersin Central Europe, as well. C{SOBhas some 3.3 million customers,which it serves via a network of 267branches (47 of which are in Slo-
vakia) and about 3 400 points ofsale located in post offices. Besidesleading the field in the CzechRepublic, C{SOB occupies fourthplace on the Slovakian bankingmarket. In the Czech Republic,C{SOB − after rejecting IPB loanswhich did not fit in with its prudentlending policy (see below) − nowhas a market share of roughly12.2% in lending and no less than24.8% in customer deposits. In Slo-vakia, its corresponding marketshare comes to 3.9% (loans) and7.7% (customer deposits), well upon the figures for 2000.In addition, C{SOB has a consider-able share of the leasing, pensionfund and mortgage loan markets,among others, in the Czech Repub-lic, thanks to the activities pursuedby its specialized subsidiaries.In 2001, agreement was reachedwith the Czech authorities regard-ing the implementation of theagreement concluded when IPBwas acquired, especially in relationto the then specified state guaran-tees. The agreement stipulated,among other things, which IPBassets were to be retained by C{SOBand which were to be taken over bythe government (C{eská konsoli-dacní agentura).1
The actual operational integrationof IPB’s activities into C{SOB, whichstarted immediately after the acqui-sition, was virtually completed bythe end of 2001. This was the mainfactor leading to an approximately10% reduction in the combinedC{SOB and IPB workforce to 8 355full-time equivalents in 2001.2
1 Although some assets continue to bemanaged by C{SOB, it reserves the right totransfer them to the government, whichalso has a call right on them.
2 The decline in the Czech Republic (alone),where of course synergies are in place withthe former IPB, was 12%.
Central Europe
KBC Bank & Insurance Group − 2001 Annual Report
32
THE
NEW
C{SO
BLO
GO
THE
NEW
LOG
OC
LEA
RLY
ILLU
STRA
TES
C{SO
B’S
CO
NN
ECTI
ON
WIT
HA
ND
INTE
GRA
TIO
NIN
TOTH
EKB
CG
ROU
P
Progress on the insurancefront in the Czech RepublicBy taking measures such as step-ping up its stake in C{SOBPojist’ovna from 75.8% to 100% viathe purchase of shares from thefounder, Chmelarství, KBC Insur-ance continued to develop its insur-ance activities in the Czech Repub-lic. Although C{SOB Pojist’ovna’sshare of the Czech non-life insur-ance market (estimated at 0.9%,compared to 0.6% at the end of2000) is still modest, it is growing.Moreover, after agreement wasreached in February 2002 on thedispute concerning the ownershipof IPB Pojist’ovna, C{SOB acquiredthis Czech insurance company.With an estimated market share ofjust under 7% (11.2% in the lifeand 4.6% in the non-life busi-nesses), IPB Pojist’ovna is thefourth largest insurer in the CzechRepublic.KBC aims to gradually integrate itsinsurance activities during 2002 andto develop the bancassurance con-cept in the Czech Republic and Slo-vakia along the lines of the modelbeing implemented in Belgium.
HungaryMain participating interests:j K&H Bank (universal bank,
59.01% shareholding)j K&H Life (life assurance, 50%
shareholding (+50% via K&HBank))
j Argosz (non-life insurance,98.8% shareholding)
Merger of K&H Bank with theHungarian subsidiary of ABNAMRO leads to the creation ofthe country’s second largestbank groupOn 1 July 2001, the new K&H Bankwas officially registered at the com-mercial court, signalling the com-pletion of the legal merger betweenthe old K&H Bank and ABNAMRO Magyar Bank. The new
K&H Bank Group is ranked secondin Hungary, with more than 550 000customers and a market share ofsome 14.3% in commercial lendingand 7.4% in retail lending (a con-siderable improvement on the 5.9%share of the retail market at theend of 2000). KBC owns 59.01% ofthe new bank and ABN AMRO40.2%, the remainder being held bysmall shareholders.
The process of integration is aheadof schedule and will be completedbefore mid-2002. This will result in,among other things, the merger ofthe commercial networks intoapproximately 175 branches, thirtyof which will provide services toboth private persons and corporatecustomers, while the rest will catersolely for the needs of private per-sons. The integration of the IT sys-tems is largely complete, as well.Thanks to a number of factors,including lower staff charges (thecombined K&H Bank and ABNAMRO Magyar Bank workforcewas reduced by almost 20% to3 938 full-time equivalents in 2001)and accelerated cost-savings, K&Hposted a strong operating result in2001, though this was ultimatelydepressed somewhat by one-offwrite-downs and higher merger-related costs (associated with thewrite-off of old IT systems andbuildings that were obsolete in therationalized merger bank, etc.).
Bancassurance on track inHungaryIn 2001, KBC Insurance upped itsstake in the non-life insurer,Argosz, from 95.4% to 98.8% via acapital increase of 7.3 million eurosand the acquisition of a package ofshares from a group of smallershareholders. Argosz, which turnedin a good performance in 2001(recovering from the loss sufferedin the reference period to record aprofit at the end of 2001), currently
sells its insurance products primar-ily via its network of self-employedtied agents, though it is graduallybeginning to sell them via thebranch network of K&H Bank, aswell. Moreover, a number ofArgosz agents also started selling‘K&H Life’ products in 2001. Previ-ously, K&H Life had sold all itsproducts exclusively through thebank channel.
PolandMain participating interests:j Kredyt Bank (universal bank,
54.6% shareholding)j Warta (mainly non-life insurance,
40% shareholding)j Agropolisa (non-life insurance,
49.9% shareholding (+47.9% viaKredyt Bank))
KBC acquires majority stakein Kredyt BankKredyt Bank is ranked fifth1 inPoland, with over 750 000 custom-ers and a distribution network of382 branches. In September 2001,both the Polish banking and stockexchange supervisory bodies gaveKBC the go-ahead to acquire add-itional shares in Kredyt Bank in thefuture, whereby it would be able tocast 50% or more (though 75% atmost) of the votes at the generalmeeting of shareholders. By sub-scribing to the capital increase,KBC acquired a majority stake inKredyt Bank in the fourth quarterof 2001 and was, therefore requiredto launch a public bid for theremaining shares. The bid closed on31 January 2002, at which timeKBC owned 56.6% of Kredyt Bank.
Last year, Kredyt Bank continuedto expand its activities, which led toits market share in lending risingfrom 5.9% to 6.2%. Nevertheless, itmade a negative contribution toprofit in 2001, which was attribut-
3 Based on its share of the market for loans.
Central Europe
KBC Bank & Insurance Group − 2001 Annual Report
33
■ ■ ■ ■ ■ ■ ■ ■ ■ ■
able to a considerable increase incosts (for finalizing, as planned, theexpansion of the branch networkand introducing a new IT system,etc.). Furthermore, the bankingsector in Poland was affected by themiserable economic climate there,which set in during the secondquarter of 2001 and led to anincrease in the number of problemloans and related provisioning.As far as its problem loans are con-cerned (roughly 12-13% of the loanportfolio) though, Kredyt Bank stillremains well below the average forits peers in Poland (estimated at19%). Lastly, profit was alsodepressed by additional provision-ing at its (relatively small) subsid-iary, Polski Kredyt Bank, and(albeit diminishing) initial losses atits pension fund subsidiary.
Bancassurance taking off inPoland, thanks to co-operationbetween Kredyt Bank andWartaIn 2000, KBC Insurance acquired a40% stake in the Polish non-lifeinsurer, Warta. With an estimated13% of the non-life market, and −via a subsidiary company − 0.9% ofthe life assurance market, Warta isthe second-biggest non-life insurerand the eighth-biggest life assurerin Poland.In the first half of 2001, Warta andKredyt Bank signed an agreementto develop the bancassurance con-cept jointly in Poland. Since thestart of 2002, there has been struc-tured co-operation between Wartaand Kredyt Bank throughout the
country, with the bank sellingstandard insurance products andthe insurance agents offering bankproducts. These arrangements aresupported by committees at variouslevels, comprising representativesof both parties who are responsiblefor realizing the objectives.
SloveniaKBC bids for NovaLjubljanska banka, Slovenia’slargest bankAt the end of 2001, KBC made abid for a 34% stake in Nova Ljub-ljanska banka (NLB), the largestbank in Slovenia. At the beginningof January 2002, the Slovenianauthorities decided to enter intoexclusive negotiations with KBC onthe sale of this shareholding.However, these negotiations werestill ongoing at the time this annualreport went to press.
MARKET SHARE
Market share in Central Europe1 31-12-1999 31-12-2000 31-12-2001
BankingCzech Republic 8.6% 18.2%2 18.5%2
Hungary 8.6% 14.1% 13.4%Poland 5.5% 5.5% 5.5%Slovakia 4.5% 4.8% 5.8%
InsuranceCzech Republic 0.3% 0.4% 0.6% (7.5%3)Hungary 1.8% 1.9% 2.1%Poland 0.3% 8.2% 8.6%
1 31 December 2001, based on provisional figures. In banking, this is the average share of the market for loans and customerdeposits held by KBC Group subsidiaries and companies in which it has a participating interest. In insurance, this is an esti-mate of the (weighted) average share of the life assurance and non-life insurance markets.
2 C{SOB, including the IPB loans which C{SOB wants to retain.3 Estimate, including IPB Pojist’ovna.
Central Europe
KBC Bank & Insurance Group − 2001 Annual Report
34
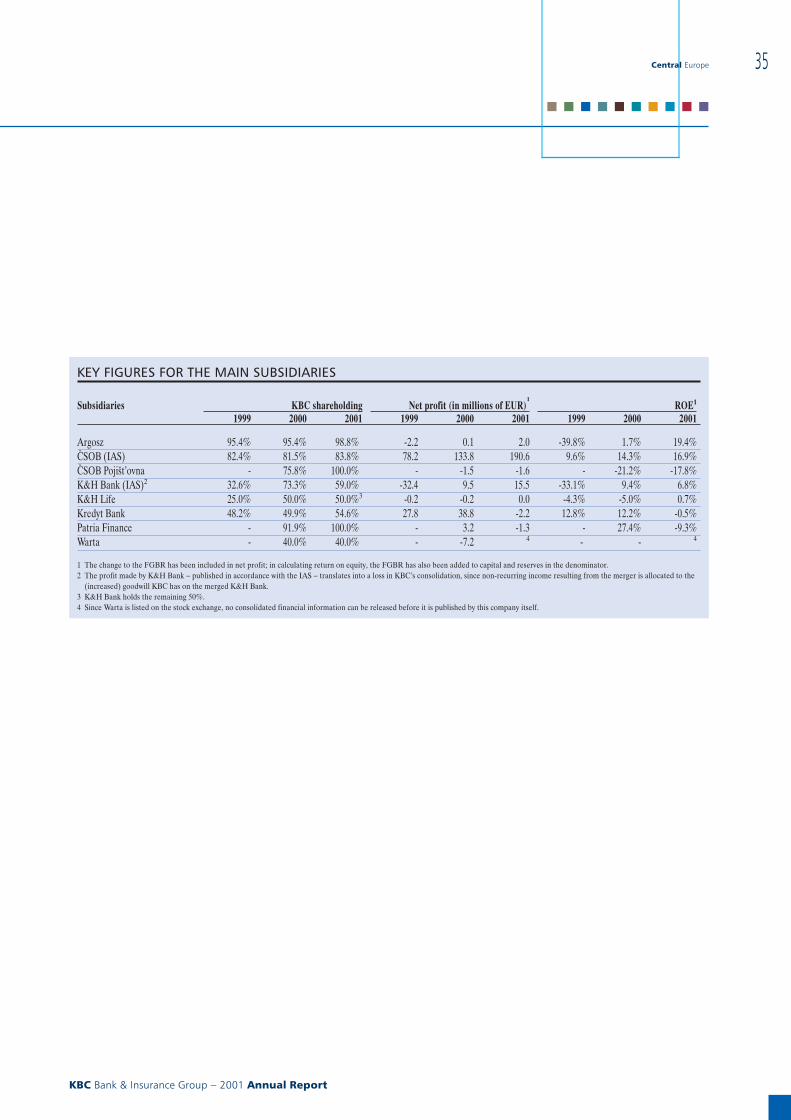
KEY FIGURES FOR THE MAIN SUBSIDIARIES
Subsidiaries KBC shareholding Net profit (in millions of EUR)1
ROE1
1999 2000 2001 1999 2000 2001 1999 2000 2001
Argosz 95.4% 95.4% 98.8% -2.2 0.1 2.0 -39.8% 1.7% 19.4%C{SOB (IAS) 82.4% 81.5% 83.8% 78.2 133.8 190.6 9.6% 14.3% 16.9%C{SOB Pojist’ovna - 75.8% 100.0% - -1.5 -1.6 - -21.2% -17.8%K&H Bank (IAS)2 32.6% 73.3% 59.0% -32.4 9.5 15.5 -33.1% 9.4% 6.8%K&H Life 25.0% 50.0% 50.0%3 -0.2 -0.2 0.0 -4.3% -5.0% 0.7%Kredyt Bank 48.2% 49.9% 54.6% 27.8 38.8 -2.2 12.8% 12.2% -0.5%Patria Finance - 91.9% 100.0% - 3.2 -1.3 - 27.4% -9.3%Warta - 40.0% 40.0% - -7.2 4 - - 4
1 The change to the FGBR has been included in net profit; in calculating return on equity, the FGBR has also been added to capital and reserves in the denominator.2 The profit made by K&H Bank − published in accordance with the IAS − translates into a loss in KBC’s consolidation, since non-recurring income resulting from the merger is allocated to the
(increased) goodwill KBC has on the merged K&H Bank.3 K&H Bank holds the remaining 50%.4 Since Warta is listed on the stock exchange, no consolidated financial information can be released before it is published by this company itself.
Central Europe
KBC Bank & Insurance Group − 2001 Annual Report
35
■ ■ ■ ■ ■ ■ ■ ■ ■ ■
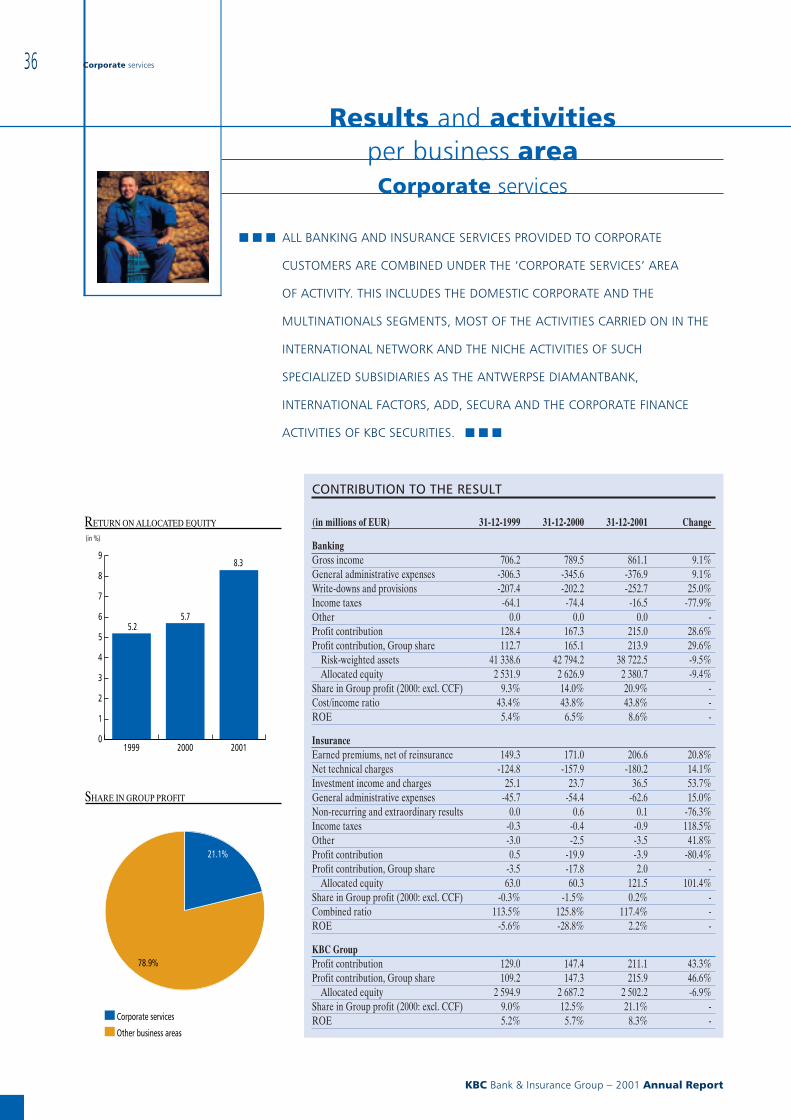
Results and activitiesper business areaCorporate services
■ ■ ■ ALL BANKING AND INSURANCE SERVICES PROVIDED TO CORPORATE
CUSTOMERS ARE COMBINED UNDER THE ‘CORPORATE SERVICES’ AREA
OF ACTIVITY. THIS INCLUDES THE DOMESTIC CORPORATE AND THE
MULTINATIONALS SEGMENTS, MOST OF THE ACTIVITIES CARRIED ON IN THE
INTERNATIONAL NETWORK AND THE NICHE ACTIVITIES OF SUCH
SPECIALIZED SUBSIDIARIES AS THE ANTWERPSE DIAMANTBANK,
INTERNATIONAL FACTORS, ADD, SECURA AND THE CORPORATE FINANCE
ACTIVITIES OF KBC SECURITIES. ■ ■ ■
CONTRIBUTION TO THE RESULT
(in millions of EUR) 31-12-1999 31-12-2000 31-12-2001 Change
BankingGross income 706.2 789.5 861.1 9.1%General administrative expenses -306.3 -345.6 -376.9 9.1%Write-downs and provisions -207.4 -202.2 -252.7 25.0%Income taxes -64.1 -74.4 -16.5 -77.9%Other 0.0 0.0 0.0 -Profit contribution 128.4 167.3 215.0 28.6%Profit contribution, Group share 112.7 165.1 213.9 29.6%
Risk-weighted assets 41 338.6 42 794.2 38 722.5 -9.5%Allocated equity 2 531.9 2 626.9 2 380.7 -9.4%
Share in Group profit (2000: excl. CCF) 9.3% 14.0% 20.9% -Cost/income ratio 43.4% 43.8% 43.8% -ROE 5.4% 6.5% 8.6% -
InsuranceEarned premiums, net of reinsurance 149.3 171.0 206.6 20.8%Net technical charges -124.8 -157.9 -180.2 14.1%Investment income and charges 25.1 23.7 36.5 53.7%General administrative expenses -45.7 -54.4 -62.6 15.0%Non-recurring and extraordinary results 0.0 0.6 0.1 -76.3%Income taxes -0.3 -0.4 -0.9 118.5%Other -3.0 -2.5 -3.5 41.8%Profit contribution 0.5 -19.9 -3.9 -80.4%Profit contribution, Group share -3.5 -17.8 2.0 -
Allocated equity 63.0 60.3 121.5 101.4%Share in Group profit (2000: excl. CCF) -0.3% -1.5% 0.2% -Combined ratio 113.5% 125.8% 117.4% -ROE -5.6% -28.8% 2.2% -
KBC GroupProfit contribution 129.0 147.4 211.1 43.3%Profit contribution, Group share 109.2 147.3 215.9 46.6%
Allocated equity 2 594.9 2 687.2 2 502.2 -6.9%Share in Group profit (2000: excl. CCF) 9.0% 12.5% 21.1% -ROE 5.2% 5.7% 8.3% -
0
1
2
3
4
5
6
7
8
9
200120001999
RETURN ON ALLOCATED EQUITY
(in %)
5.25.7
8.3
SHARE IN GROUP PROFIT
Corporate services
Other business areas
21.1%
78.9%
Corporate services
KBC Bank & Insurance Group − 2001 Annual Report
36
In 2001, this area of activity con-tributed 211.1 million euros to con-solidated profit (including minorityinterests), up 43.3% on the year-earlier figure. This performancewas thus good for 21.1% of Groupprofit (compared with 12.5% in2000) and a return on allocatedequity of 8.3% (5.7% in 2000).Allocated equity fell by 6.9% to 2.5billion euros (almost 10% for thebanking business alone), which rep-resents 31.9% of Group equity. Thedecline in the capital charge stemsfrom a number of factors, includingthe growing focus on productsrequiring less capital to be held, theongoing rationalization of both thedomestic and international net-works (see below) and securitiza-tion. This last is illustrated by thesecuritization of a portfolio of com-mercial credit and bonds worth2 billion euros at the close of lastyear. A comprehensive overview ofall outstanding securitization oper-ations is given in the ‘Risk manage-ment’ section.This area of activity focuses mainlyon ‘mid-cap’ clientele, who areoffered a wide range of services,including specialized trade, acquisi-tion and real estate finance.
j BankingIn banking, gross income rose by9.1% due to a number of factors,including the vigorous growth incommercial net interest earnings inthe domestic corporate and multi-national segments. There was alsoan increase in income generated by,inter alia, structured finance activ-ities (due primarily to higher com-mission income) and real estateactivities (thanks to, among otherthings, the capital gains realized onthe sale of a number of real estatecompanies). The stock market cli-mate again lay behind the fall inincome stemming from corporatefinance activities (-15%). The 9.1%increase in general administrative
expenses was attributable primarilyto higher staff charges in thebranches in Belgium and abroad,resulting from an increase in theworkforce, the more senior job-classification structure and wage-indexation.There were a number of quite size-able new problem loans in 2001requiring provisioning. On balance,net allocations to provisions forcorporate credit risks was up 25%on the figure for 2000, which hadalso been characterized by a num-ber of large problem loans, chieflyin the textiles and technology sec-tors in Belgium.On the whole, the sharp fall in taxesis due entirely to the transfer of theconsiderable taxable provisions forloans with an uncertain outcome in2000 to tax-reclaimable provisionsfor irrecoverable loans in 2001.
j InsuranceLast year, the insurance businesssuffered a loss of 3.9 million eurosin this area of activity (-19.9 millioneuros in 2000).1 The negative fig-ures in both years were accountedfor by the reinsurance subsidiary,Secura, whose results in 2000 wereadversely affected by the repercus-sions of the December 1999 storms,and − despite the fact that it doesnot pursue activities directly on theUS market − by a bill for an esti-mated maximum of 3 million eurosin 2001 after the attacks on theWTC.
j TargetThe targeted return on equity forthis area of activity is 12.5%.
HIGHLIGHTS
Changes in the networkAs a consequence of the organiza-tional review that got under way in2000 with the aim of bringing thecorporate branch network as much
as possible into line with marketdevelopments, the number of cor-porate branches in Belgium wasreduced from twenty-two to nine-teen via mergers and changes to thebranches’ areas of operation. Thisoptimization process will continuein 2002. The three ‘social profitbranches’ and the specialized ‘gov-ernment branch’ were also mergedto form three branches that caterfor customers in both these sectors.
The international network, too,continued to be rationalized in2001, inter alia, via the closure ofthe KBC Bank branch in Frankfurt(with the bulk of its customersbeing acquired by KBC BankDeutschland), the conversion of therepresentative office in Munich intoa fully fledged KBC Bank Deutsch-land branch, the consolidation ofeight KBC Bank Nederland cor-porate branches into three regionalbranches, and the closure of therepresentative offices in Johannes-burg (Sandton) and Madrid.In Spain, KBC has a network deskat Banco Urquijo to serve its cus-tomers. At the start of 2002, therepresentative office in Cairo willalso be closed and the branch inMumbai transformed into a repre-sentative office.
In addition, KBC converted its rep-resentative office in Nanjing(People’s Republic of China) intoa fully operational branch, the thirdsuch establishment of its kind inthat country, after Shanghai andShenzen. Located in the prosperousJiangsu province, KBC Nanjing tar-gets an existing customer base of
1 Although Secura posted a negative result(before deduction of minority interests),the Group’s share of the result was posi-tive, due to the fact that KBC Insurancestepped up its participating interest on1 October 2001 (see below) and Securawas able in the final quarter of 2001 tomake good most of the loss suffered duringthe first nine months of the year.
Corporate services
KBC Bank & Insurance Group − 2001 Annual Report
37
■ ■ ■ ■ ■ ■ ■ ■ ■ ■
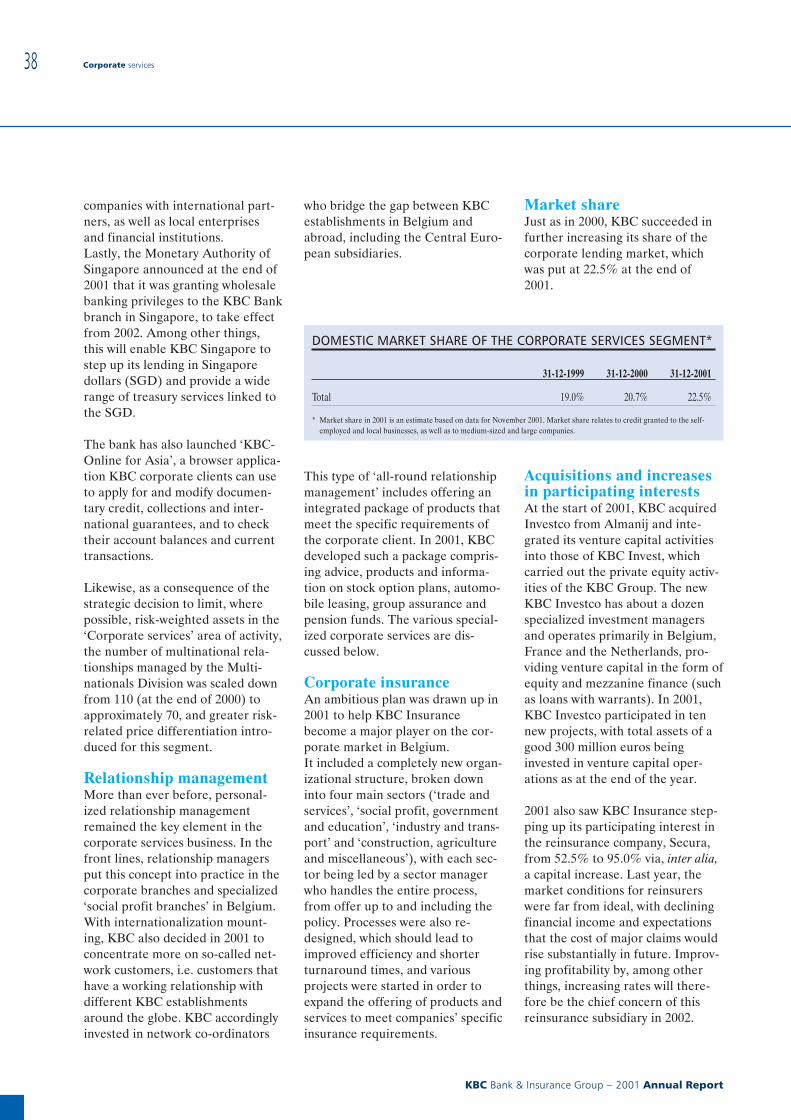
companies with international part-ners, as well as local enterprisesand financial institutions.Lastly, the Monetary Authority ofSingapore announced at the end of2001 that it was granting wholesalebanking privileges to the KBC Bankbranch in Singapore, to take effectfrom 2002. Among other things,this will enable KBC Singapore tostep up its lending in Singaporedollars (SGD) and provide a widerange of treasury services linked tothe SGD.
The bank has also launched ‘KBC-Online for Asia’, a browser applica-tion KBC corporate clients can useto apply for and modify documen-tary credit, collections and inter-national guarantees, and to checktheir account balances and currenttransactions.
Likewise, as a consequence of thestrategic decision to limit, wherepossible, risk-weighted assets in the‘Corporate services’ area of activity,the number of multinational rela-tionships managed by the Multi-nationals Division was scaled downfrom 110 (at the end of 2000) toapproximately 70, and greater risk-related price differentiation intro-duced for this segment.
Relationship managementMore than ever before, personal-ized relationship managementremained the key element in thecorporate services business. In thefront lines, relationship managersput this concept into practice in thecorporate branches and specialized‘social profit branches’ in Belgium.With internationalization mount-ing, KBC also decided in 2001 toconcentrate more on so-called net-work customers, i.e. customers thathave a working relationship withdifferent KBC establishmentsaround the globe. KBC accordinglyinvested in network co-ordinators
who bridge the gap between KBCestablishments in Belgium andabroad, including the Central Euro-pean subsidiaries.
This type of ‘all-round relationshipmanagement’ includes offering anintegrated package of products thatmeet the specific requirements ofthe corporate client. In 2001, KBCdeveloped such a package compris-ing advice, products and informa-tion on stock option plans, automo-bile leasing, group assurance andpension funds. The various special-ized corporate services are dis-cussed below.
Corporate insuranceAn ambitious plan was drawn up in2001 to help KBC Insurancebecome a major player on the cor-porate market in Belgium.It included a completely new organ-izational structure, broken downinto four main sectors (‘trade andservices’, ‘social profit, governmentand education’, ‘industry and trans-port’ and ‘construction, agricultureand miscellaneous’), with each sec-tor being led by a sector managerwho handles the entire process,from offer up to and including thepolicy. Processes were also re-designed, which should lead toimproved efficiency and shorterturnaround times, and variousprojects were started in order toexpand the offering of products andservices to meet companies’ specificinsurance requirements.
Market shareJust as in 2000, KBC succeeded infurther increasing its share of thecorporate lending market, whichwas put at 22.5% at the end of2001.
Acquisitions and increasesin participating interestsAt the start of 2001, KBC acquiredInvestco from Almanij and inte-grated its venture capital activitiesinto those of KBC Invest, whichcarried out the private equity activ-ities of the KBC Group. The newKBC Investco has about a dozenspecialized investment managersand operates primarily in Belgium,France and the Netherlands, pro-viding venture capital in the form ofequity and mezzanine finance (suchas loans with warrants). In 2001,KBC Investco participated in tennew projects, with total assets of agood 300 million euros beinginvested in venture capital oper-ations as at the end of the year.
2001 also saw KBC Insurance step-ping up its participating interest inthe reinsurance company, Secura,from 52.5% to 95.0% via, inter alia,a capital increase. Last year, themarket conditions for reinsurerswere far from ideal, with decliningfinancial income and expectationsthat the cost of major claims wouldrise substantially in future. Improv-ing profitability by, among otherthings, increasing rates will there-fore be the chief concern of thisreinsurance subsidiary in 2002.
DOMESTIC MARKET SHARE OF THE CORPORATE SERVICES SEGMENT*
31-12-1999 31-12-2000 31-12-2001
Total 19.0% 20.7% 22.5%
* Market share in 2001 is an estimate based on data for November 2001. Market share relates to credit granted to the self-employed and local businesses, as well as to medium-sized and large companies.
Corporate services
KBC Bank & Insurance Group − 2001 Annual Report
38
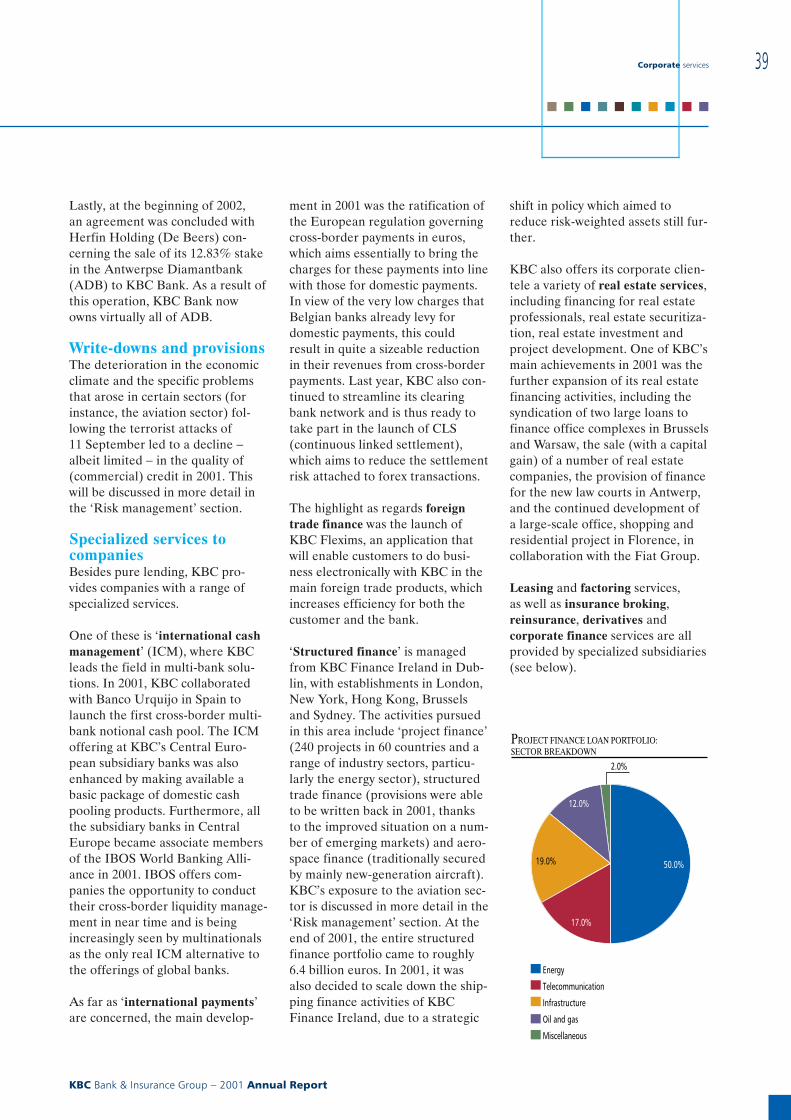
Lastly, at the beginning of 2002,an agreement was concluded withHerfin Holding (De Beers) con-cerning the sale of its 12.83% stakein the Antwerpse Diamantbank(ADB) to KBC Bank. As a result ofthis operation, KBC Bank nowowns virtually all of ADB.
Write-downs and provisionsThe deterioration in the economicclimate and the specific problemsthat arose in certain sectors (forinstance, the aviation sector) fol-lowing the terrorist attacks of11 September led to a decline −albeit limited − in the quality of(commercial) credit in 2001. Thiswill be discussed in more detail inthe ‘Risk management’ section.
Specialized services tocompaniesBesides pure lending, KBC pro-vides companies with a range ofspecialized services.
One of these is ‘international cashmanagement’ (ICM), where KBCleads the field in multi-bank solu-tions. In 2001, KBC collaboratedwith Banco Urquijo in Spain tolaunch the first cross-border multi-bank notional cash pool. The ICMoffering at KBC’s Central Euro-pean subsidiary banks was alsoenhanced by making available abasic package of domestic cashpooling products. Furthermore, allthe subsidiary banks in CentralEurope became associate membersof the IBOS World Banking Alli-ance in 2001. IBOS offers com-panies the opportunity to conducttheir cross-border liquidity manage-ment in near time and is beingincreasingly seen by multinationalsas the only real ICM alternative tothe offerings of global banks.
As far as ‘international payments’are concerned, the main develop-
ment in 2001 was the ratification ofthe European regulation governingcross-border payments in euros,which aims essentially to bring thecharges for these payments into linewith those for domestic payments.In view of the very low charges thatBelgian banks already levy fordomestic payments, this couldresult in quite a sizeable reductionin their revenues from cross-borderpayments. Last year, KBC also con-tinued to streamline its clearingbank network and is thus ready totake part in the launch of CLS(continuous linked settlement),which aims to reduce the settlementrisk attached to forex transactions.
The highlight as regards foreigntrade finance was the launch ofKBC Flexims, an application thatwill enable customers to do busi-ness electronically with KBC in themain foreign trade products, whichincreases efficiency for both thecustomer and the bank.
‘Structured finance’ is managedfrom KBC Finance Ireland in Dub-lin, with establishments in London,New York, Hong Kong, Brusselsand Sydney. The activities pursuedin this area include ‘project finance’(240 projects in 60 countries and arange of industry sectors, particu-larly the energy sector), structuredtrade finance (provisions were ableto be written back in 2001, thanksto the improved situation on a num-ber of emerging markets) and aero-space finance (traditionally securedby mainly new-generation aircraft).KBC’s exposure to the aviation sec-tor is discussed in more detail in the‘Risk management’ section. At theend of 2001, the entire structuredfinance portfolio came to roughly6.4 billion euros. In 2001, it wasalso decided to scale down the ship-ping finance activities of KBCFinance Ireland, due to a strategic
shift in policy which aimed toreduce risk-weighted assets still fur-ther.
KBC also offers its corporate clien-tele a variety of real estate services,including financing for real estateprofessionals, real estate securitiza-tion, real estate investment andproject development. One of KBC’smain achievements in 2001 was thefurther expansion of its real estatefinancing activities, including thesyndication of two large loans tofinance office complexes in Brusselsand Warsaw, the sale (with a capitalgain) of a number of real estatecompanies, the provision of financefor the new law courts in Antwerp,and the continued development ofa large-scale office, shopping andresidential project in Florence, incollaboration with the Fiat Group.
Leasing and factoring services,as well as insurance broking,reinsurance, derivatives andcorporate finance services are allprovided by specialized subsidiaries(see below).
PROJECT FINANCE LOAN PORTFOLIO:SECTOR BREAKDOWN
Energy
Telecommunication
Infrastructure
Oil and gas
Miscellaneous
2.0%
12.0%
19.0%
17.0%
50.0%
Corporate services
KBC Bank & Insurance Group − 2001 Annual Report
39
■ ■ ■ ■ ■ ■ ■ ■ ■ ■
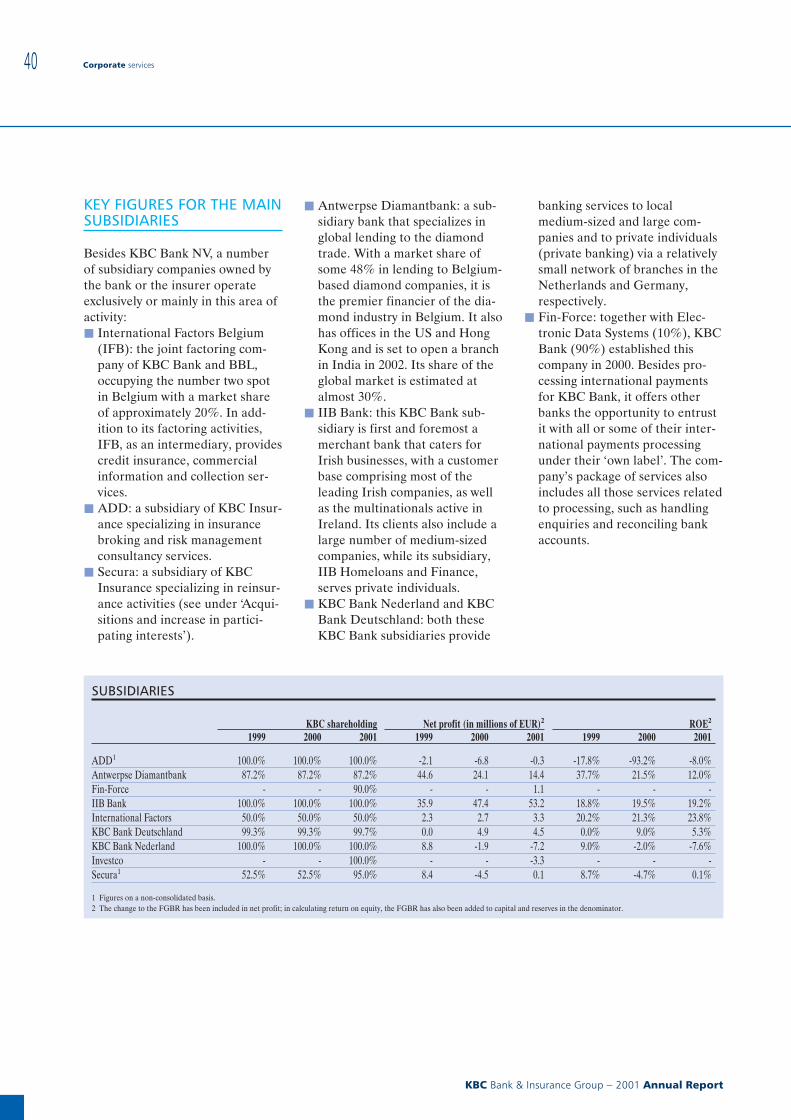
KEY FIGURES FOR THE MAINSUBSIDIARIES
Besides KBC Bank NV, a numberof subsidiary companies owned bythe bank or the insurer operateexclusively or mainly in this area ofactivity:j International Factors Belgium
(IFB): the joint factoring com-pany of KBC Bank and BBL,occupying the number two spotin Belgium with a market shareof approximately 20%. In add-ition to its factoring activities,IFB, as an intermediary, providescredit insurance, commercialinformation and collection ser-vices.
j ADD: a subsidiary of KBC Insur-ance specializing in insurancebroking and risk managementconsultancy services.
j Secura: a subsidiary of KBCInsurance specializing in reinsur-ance activities (see under ‘Acqui-sitions and increase in partici-pating interests’).
j Antwerpse Diamantbank: a sub-sidiary bank that specializes inglobal lending to the diamondtrade. With a market share ofsome 48% in lending to Belgium-based diamond companies, it isthe premier financier of the dia-mond industry in Belgium. It alsohas offices in the US and HongKong and is set to open a branchin India in 2002. Its share of theglobal market is estimated atalmost 30%.
j IIB Bank: this KBC Bank sub-sidiary is first and foremost amerchant bank that caters forIrish businesses, with a customerbase comprising most of theleading Irish companies, as wellas the multinationals active inIreland. Its clients also include alarge number of medium-sizedcompanies, while its subsidiary,IIB Homeloans and Finance,serves private individuals.
j KBC Bank Nederland and KBCBank Deutschland: both theseKBC Bank subsidiaries provide
banking services to localmedium-sized and large com-panies and to private individuals(private banking) via a relativelysmall network of branches in theNetherlands and Germany,respectively.
j Fin-Force: together with Elec-tronic Data Systems (10%), KBCBank (90%) established thiscompany in 2000. Besides pro-cessing international paymentsfor KBC Bank, it offers otherbanks the opportunity to entrustit with all or some of their inter-national payments processingunder their ‘own label’. The com-pany’s package of services alsoincludes all those services relatedto processing, such as handlingenquiries and reconciling bankaccounts.
SUBSIDIARIES
KBC shareholding Net profit (in millions of EUR)2 ROE2
1999 2000 2001 1999 2000 2001 1999 2000 2001
ADD1 100.0% 100.0% 100.0% -2.1 -6.8 -0.3 -17.8% -93.2% -8.0%Antwerpse Diamantbank 87.2% 87.2% 87.2% 44.6 24.1 14.4 37.7% 21.5% 12.0%Fin-Force - - 90.0% - - 1.1 - - -IIB Bank 100.0% 100.0% 100.0% 35.9 47.4 53.2 18.8% 19.5% 19.2%International Factors 50.0% 50.0% 50.0% 2.3 2.7 3.3 20.2% 21.3% 23.8%KBC Bank Deutschland 99.3% 99.3% 99.7% 0.0 4.9 4.5 0.0% 9.0% 5.3%KBC Bank Nederland 100.0% 100.0% 100.0% 8.8 -1.9 -7.2 9.0% -2.0% -7.6%Investco - - 100.0% - - -3.3 - - -Secura1 52.5% 52.5% 95.0% 8.4 -4.5 0.1 8.7% -4.7% 0.1%
1 Figures on a non-consolidated basis.2 The change to the FGBR has been included in net profit; in calculating return on equity, the FGBR has also been added to capital and reserves in the denominator.
Corporate services
KBC Bank & Insurance Group − 2001 Annual Report
40
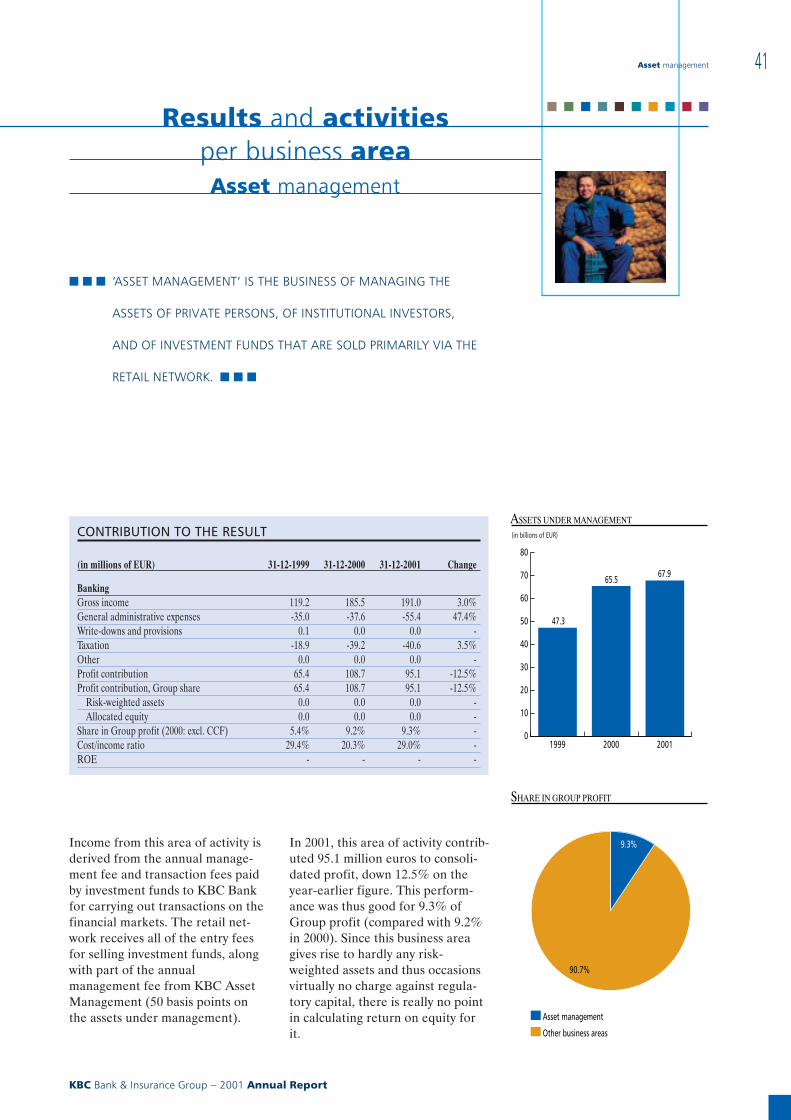
Results and activitiesper business areaAsset management
■ ■ ■ ‘ASSET MANAGEMENT’ IS THE BUSINESS OF MANAGING THE
ASSETS OF PRIVATE PERSONS, OF INSTITUTIONAL INVESTORS,
AND OF INVESTMENT FUNDS THAT ARE SOLD PRIMARILY VIA THE
RETAIL NETWORK. ■ ■ ■
Income from this area of activity isderived from the annual manage-ment fee and transaction fees paidby investment funds to KBC Bankfor carrying out transactions on thefinancial markets. The retail net-work receives all of the entry feesfor selling investment funds, alongwith part of the annualmanagement fee from KBC AssetManagement (50 basis points onthe assets under management).
In 2001, this area of activity contrib-uted 95.1 million euros to consoli-dated profit, down 12.5% on theyear-earlier figure. This perform-ance was thus good for 9.3% ofGroup profit (compared with 9.2%in 2000). Since this business areagives rise to hardly any risk-weighted assets and thus occasionsvirtually no charge against regula-tory capital, there is really no pointin calculating return on equity forit.
CONTRIBUTION TO THE RESULT
(in millions of EUR) 31-12-1999 31-12-2000 31-12-2001 Change
BankingGross income 119.2 185.5 191.0 3.0%General administrative expenses -35.0 -37.6 -55.4 47.4%Write-downs and provisions 0.1 0.0 0.0 -Taxation -18.9 -39.2 -40.6 3.5%Other 0.0 0.0 0.0 -Profit contribution 65.4 108.7 95.1 -12.5%Profit contribution, Group share 65.4 108.7 95.1 -12.5%
Risk-weighted assets 0.0 0.0 0.0 -Allocated equity 0.0 0.0 0.0 -
Share in Group profit (2000: excl. CCF) 5.4% 9.2% 9.3% -Cost/income ratio 29.4% 20.3% 29.0% -ROE - - - -
0
10
20
30
40
50
60
70
80
200120001999
ASSETS UNDER MANAGEMENT
(in billions of EUR)
47.3
65.5 67.9
SHARE IN GROUP PROFIT
Asset management
Other business areas
9.3%
90.7%
Asset management
KBC Bank & Insurance Group − 2001 Annual Report
41
■ ■ ■ ■ ■ ■ ■ ■ ■ ■
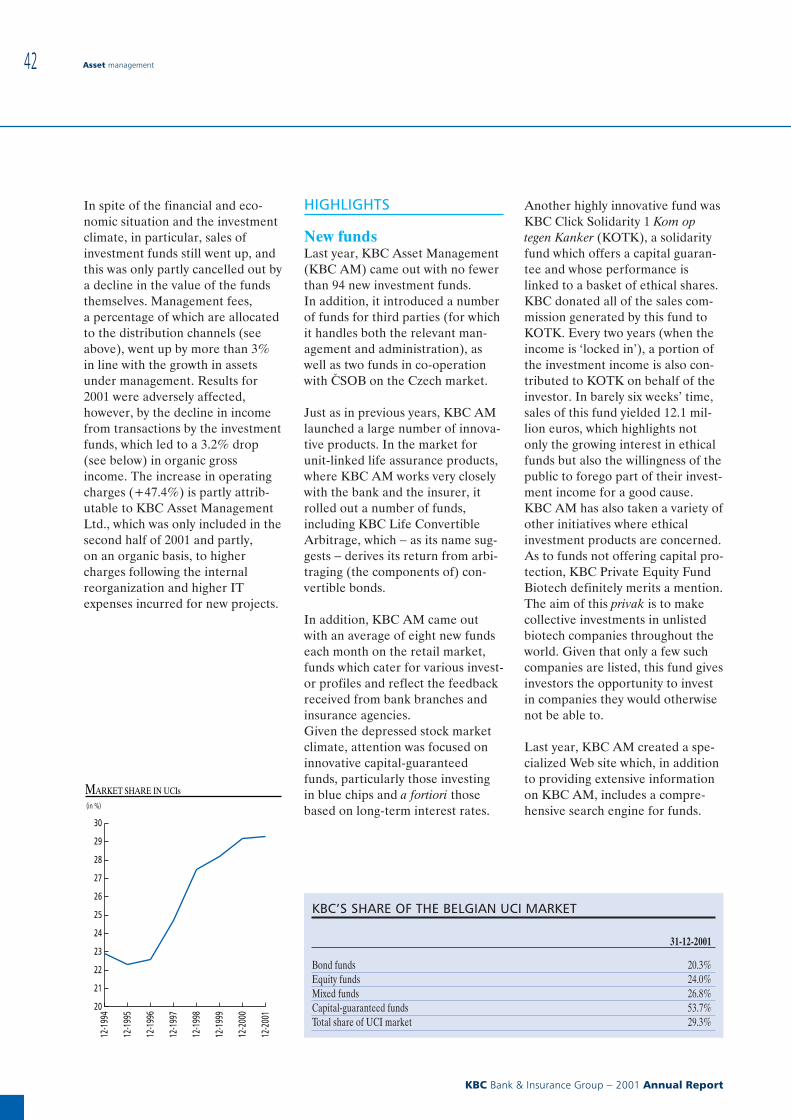
In spite of the financial and eco-nomic situation and the investmentclimate, in particular, sales ofinvestment funds still went up, andthis was only partly cancelled out bya decline in the value of the fundsthemselves. Management fees,a percentage of which are allocatedto the distribution channels (seeabove), went up by more than 3%in line with the growth in assetsunder management. Results for2001 were adversely affected,however, by the decline in incomefrom transactions by the investmentfunds, which led to a 3.2% drop(see below) in organic grossincome. The increase in operatingcharges (+47.4%) is partly attrib-utable to KBC Asset ManagementLtd., which was only included in thesecond half of 2001 and partly,on an organic basis, to highercharges following the internalreorganization and higher ITexpenses incurred for new projects.
HIGHLIGHTS
New fundsLast year, KBC Asset Management(KBC AM) came out with no fewerthan 94 new investment funds.In addition, it introduced a numberof funds for third parties (for whichit handles both the relevant man-agement and administration), aswell as two funds in co-operationwith C{SOB on the Czech market.
Just as in previous years, KBC AMlaunched a large number of innova-tive products. In the market forunit-linked life assurance products,where KBC AM works very closelywith the bank and the insurer, itrolled out a number of funds,including KBC Life ConvertibleArbitrage, which − as its name sug-gests − derives its return from arbi-traging (the components of) con-vertible bonds.
In addition, KBC AM came outwith an average of eight new fundseach month on the retail market,funds which cater for various invest-or profiles and reflect the feedbackreceived from bank branches andinsurance agencies.Given the depressed stock marketclimate, attention was focused oninnovative capital-guaranteedfunds, particularly those investingin blue chips and a fortiori thosebased on long-term interest rates.
Another highly innovative fund wasKBC Click Solidarity 1 Kom optegen Kanker (KOTK), a solidarityfund which offers a capital guaran-tee and whose performance islinked to a basket of ethical shares.KBC donated all of the sales com-mission generated by this fund toKOTK. Every two years (when theincome is ‘locked in’), a portion ofthe investment income is also con-tributed to KOTK on behalf of theinvestor. In barely six weeks’ time,sales of this fund yielded 12.1 mil-lion euros, which highlights notonly the growing interest in ethicalfunds but also the willingness of thepublic to forego part of their invest-ment income for a good cause.KBC AM has also taken a variety ofother initiatives where ethicalinvestment products are concerned.As to funds not offering capital pro-tection, KBC Private Equity FundBiotech definitely merits a mention.The aim of this privak is to makecollective investments in unlistedbiotech companies throughout theworld. Given that only a few suchcompanies are listed, this fund givesinvestors the opportunity to investin companies they would otherwisenot be able to.
Last year, KBC AM created a spe-cialized Web site which, in additionto providing extensive informationon KBC AM, includes a compre-hensive search engine for funds.
MARKET SHARE IN UCIs
(in %)
20
21
22
23
24
25
26
27
28
29
30
12-2
001
12-2
000
12-1
999
12-1
998
12-1
997
12-1
996
12-1
995
12-1
994
KBC’S SHARE OF THE BELGIAN UCI MARKET
31-12-2001
Bond funds 20.3%Equity funds 24.0%Mixed funds 26.8%Capital-guaranteed funds 53.7%Total share of UCI market 29.3%
Asset management
KBC Bank & Insurance Group − 2001 Annual Report
42
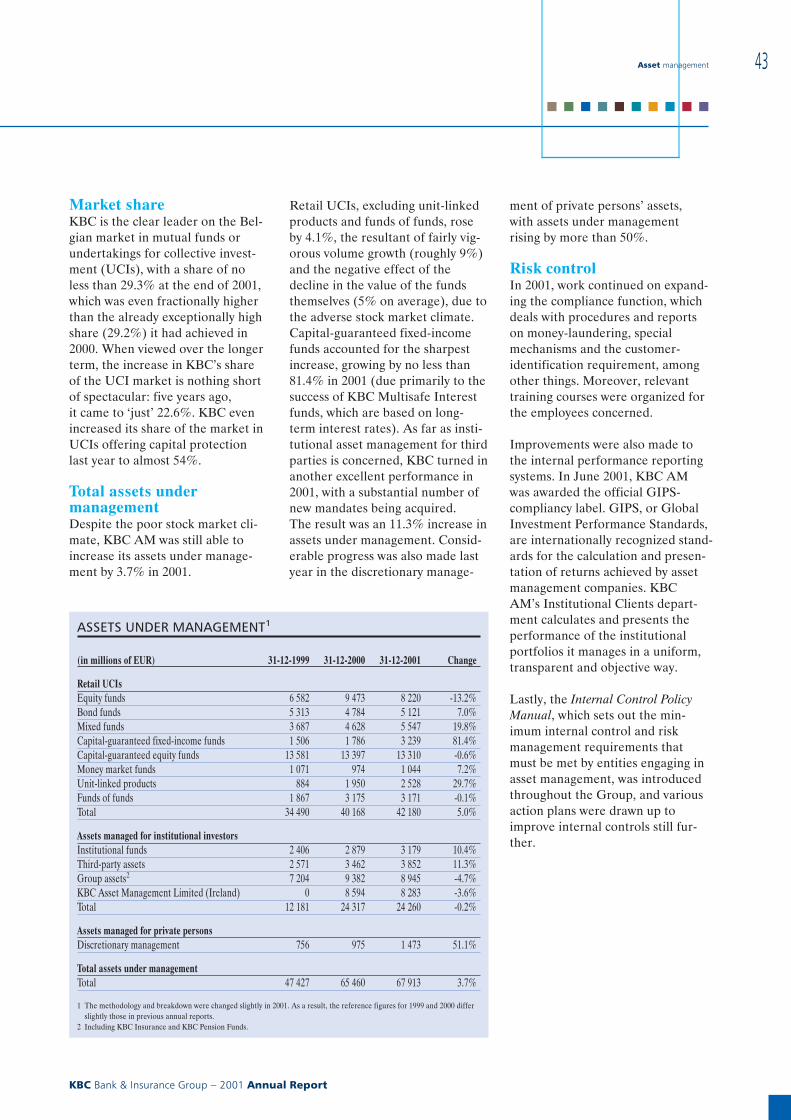
Market shareKBC is the clear leader on the Bel-gian market in mutual funds orundertakings for collective invest-ment (UCIs), with a share of noless than 29.3% at the end of 2001,which was even fractionally higherthan the already exceptionally highshare (29.2%) it had achieved in2000. When viewed over the longerterm, the increase in KBC’s shareof the UCI market is nothing shortof spectacular: five years ago,it came to ‘just’ 22.6%. KBC evenincreased its share of the market inUCIs offering capital protectionlast year to almost 54%.
Total assets undermanagementDespite the poor stock market cli-mate, KBC AM was still able toincrease its assets under manage-ment by 3.7% in 2001.
Retail UCIs, excluding unit-linkedproducts and funds of funds, roseby 4.1%, the resultant of fairly vig-orous volume growth (roughly 9%)and the negative effect of thedecline in the value of the fundsthemselves (5% on average), due tothe adverse stock market climate.Capital-guaranteed fixed-incomefunds accounted for the sharpestincrease, growing by no less than81.4% in 2001 (due primarily to thesuccess of KBC Multisafe Interestfunds, which are based on long-term interest rates). As far as insti-tutional asset management for thirdparties is concerned, KBC turned inanother excellent performance in2001, with a substantial number ofnew mandates being acquired.The result was an 11.3% increase inassets under management. Consid-erable progress was also made lastyear in the discretionary manage-
ment of private persons’ assets,with assets under managementrising by more than 50%.
Risk controlIn 2001, work continued on expand-ing the compliance function, whichdeals with procedures and reportson money-laundering, specialmechanisms and the customer-identification requirement, amongother things. Moreover, relevanttraining courses were organized forthe employees concerned.
Improvements were also made tothe internal performance reportingsystems. In June 2001, KBC AMwas awarded the official GIPS-compliancy label. GIPS, or GlobalInvestment Performance Standards,are internationally recognized stand-ards for the calculation and presen-tation of returns achieved by assetmanagement companies. KBCAM’s Institutional Clients depart-ment calculates and presents theperformance of the institutionalportfolios it manages in a uniform,transparent and objective way.
Lastly, the Internal Control PolicyManual, which sets out the min-imum internal control and riskmanagement requirements thatmust be met by entities engaging inasset management, was introducedthroughout the Group, and variousaction plans were drawn up toimprove internal controls still fur-ther.
ASSETS UNDER MANAGEMENT1
(in millions of EUR) 31-12-1999 31-12-2000 31-12-2001 Change
Retail UCIsEquity funds 6 582 9 473 8 220 -13.2%Bond funds 5 313 4 784 5 121 7.0%Mixed funds 3 687 4 628 5 547 19.8%Capital-guaranteed fixed-income funds 1 506 1 786 3 239 81.4%Capital-guaranteed equity funds 13 581 13 397 13 310 -0.6%Money market funds 1 071 974 1 044 7.2%Unit-linked products 884 1 950 2 528 29.7%Funds of funds 1 867 3 175 3 171 -0.1%Total 34 490 40 168 42 180 5.0%
Assets managed for institutional investorsInstitutional funds 2 406 2 879 3 179 10.4%Third-party assets 2 571 3 462 3 852 11.3%Group assets2 7 204 9 382 8 945 -4.7%KBC Asset Management Limited (Ireland) 0 8 594 8 283 -3.6%Total 12 181 24 317 24 260 -0.2%
Assets managed for private personsDiscretionary management 756 975 1 473 51.1%
Total assets under managementTotal 47 427 65 460 67 913 3.7%
1 The methodology and breakdown were changed slightly in 2001. As a result, the reference figures for 1999 and 2000 differslightly those in previous annual reports.
2 Including KBC Insurance and KBC Pension Funds.
Asset management
KBC Bank & Insurance Group − 2001 Annual Report
43
■ ■ ■ ■ ■ ■ ■ ■ ■ ■
KEY FIGURES FOR THE MAINSUBSIDIARIES
KBC AM − since its spin-off in2000 a subsidiary of the KBC Bankand Insurance Holding Company(which owns 55% of the shares andKBC Bank the remainder) − owns
KBC Asset Management Ltd. inIreland. This company, formerlyknown as Ulster Bank InvestmentManagers, was acquired by KBCduring the first half of 2000, addingaround 8.5 billion euros to theGroup’s total assets under manage-ment. Despite lower than budgeted
charges, market conditions in 2001resulted in a decline in assets undermanagement at KBC AssetManagement Ltd., causing it topost a significantly lower profit fig-ure than for 2000.
SUBSIDIARIES
KBC shareholding Net profit(in millions of EUR)
Assets under management(in millions of EUR)
1999 2000 2001 1999 2000* 2001 1999 2000 2001
KBC Asset Management Limited - 100.0% 100.0% - 4.7 1.0 - 8 594 8 283
* Extended financial year: 31 November 1999 to 31 December 2000.
Asset management
KBC Bank & Insurance Group − 2001 Annual Report
44
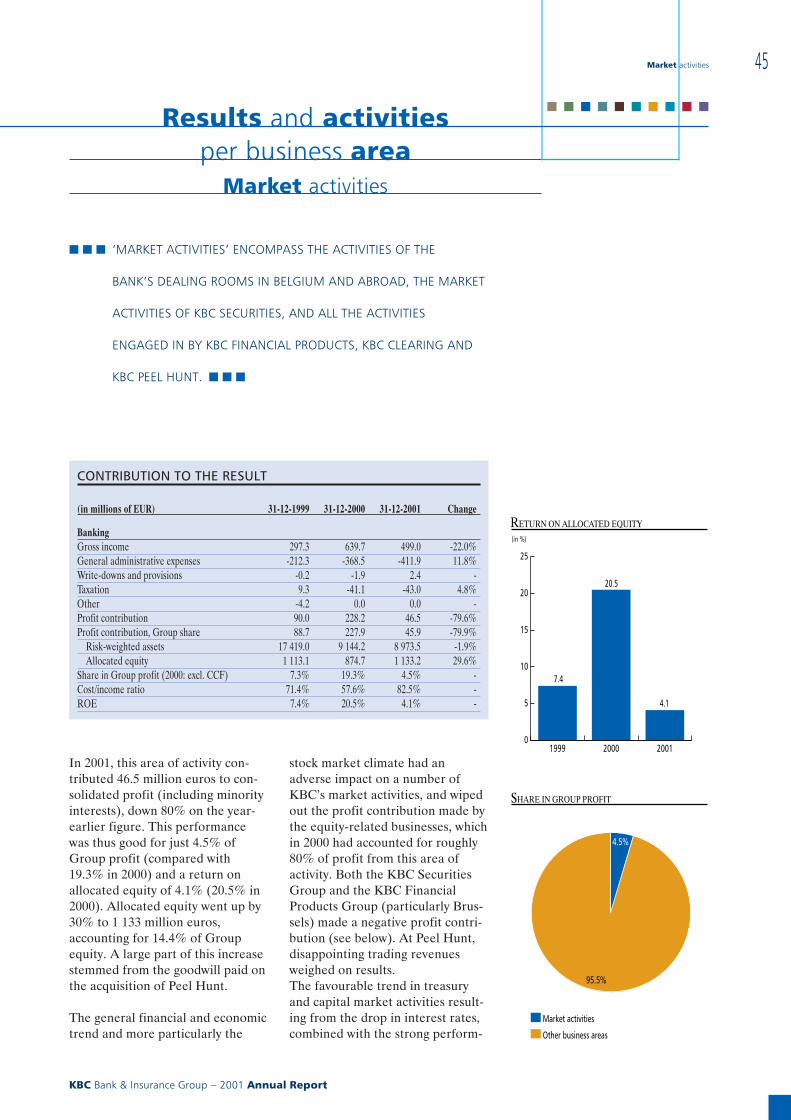
Results and activitiesper business area
Market activities
■ ■ ■ ‘MARKET ACTIVITIES’ ENCOMPASS THE ACTIVITIES OF THE
BANK’S DEALING ROOMS IN BELGIUM AND ABROAD, THE MARKET
ACTIVITIES OF KBC SECURITIES, AND ALL THE ACTIVITIES
ENGAGED IN BY KBC FINANCIAL PRODUCTS, KBC CLEARING AND
KBC PEEL HUNT. ■ ■ ■
In 2001, this area of activity con-tributed 46.5 million euros to con-solidated profit (including minorityinterests), down 80% on the year-earlier figure. This performancewas thus good for just 4.5% ofGroup profit (compared with19.3% in 2000) and a return onallocated equity of 4.1% (20.5% in2000). Allocated equity went up by30% to 1 133 million euros,accounting for 14.4% of Groupequity. A large part of this increasestemmed from the goodwill paid onthe acquisition of Peel Hunt.
The general financial and economictrend and more particularly the
stock market climate had anadverse impact on a number ofKBC’s market activities, and wipedout the profit contribution made bythe equity-related businesses, whichin 2000 had accounted for roughly80% of profit from this area ofactivity. Both the KBC SecuritiesGroup and the KBC FinancialProducts Group (particularly Brus-sels) made a negative profit contri-bution (see below). At Peel Hunt,disappointing trading revenuesweighed on results.The favourable trend in treasuryand capital market activities result-ing from the drop in interest rates,combined with the strong perform-
0
5
10
15
20
25
200120001999
RETURN ON ALLOCATED EQUITY
(in %)
7.4
20.5
4.1
SHARE IN GROUP PROFIT
Market activities
Other business areas
4.5%
95.5%
CONTRIBUTION TO THE RESULT
(in millions of EUR) 31-12-1999 31-12-2000 31-12-2001 Change
BankingGross income 297.3 639.7 499.0 -22.0%General administrative expenses -212.3 -368.5 -411.9 11.8%Write-downs and provisions -0.2 -1.9 2.4 -Taxation 9.3 -41.1 -43.0 4.8%Other -4.2 0.0 0.0 -Profit contribution 90.0 228.2 46.5 -79.6%Profit contribution, Group share 88.7 227.9 45.9 -79.9%
Risk-weighted assets 17 419.0 9 144.2 8 973.5 -1.9%Allocated equity 1 113.1 874.7 1 133.2 29.6%
Share in Group profit (2000: excl. CCF) 7.3% 19.3% 4.5% -Cost/income ratio 71.4% 57.6% 82.5% -ROE 7.4% 20.5% 4.1% -
Market activities
KBC Bank & Insurance Group − 2001 Annual Report
45
■ ■ ■ ■ ■ ■ ■ ■ ■ ■
ance turned in by the dealing roomsabroad following the reorganizationinitiated in 2000, went only someway towards offsetting the aboveadverse developments.
The table gives a breakdown of andchanges in the contribution toprofit made by the subsidiaries’ andthe dealing rooms’ market activ-ities.
j TargetThe targeted return on equity forthis area of activity is 21.0%.
HIGHLIGHTS
KBC Bank’s dealing roomsIn 2001, proprietary trading withprofessional counterparties con-tinued to be centralized as muchas possible in Brussels. Nearly allproduct classes contributed in dueproportion to profit. The shift froma trading to a sales focus proved tobe a success and led to fine resultsbeing posted. At the same time,concerted efforts were made toreduce the cost/income ratio,which will have a number ofconsequences, including a gradualdecline in staffing levels.The shift in strategy by the dealingrooms abroad to focus on local orregional treasury and liquidity man-agement, to expand sales and pro-vide sales support, and to developindividual niche activities wherepossible, also met with success, asalready indicated. As a result, a fineperformance was turned in for theentire financial year.
Debt capital marketsIn 2001, KBC was an active playeron the primary Eurobond market,participating in 380 internationallysyndicated loans. In over 70% ofthese issues, the bank acted as leador co-lead manager. During thepast financial year, it managed pub-lic loans for Erste Bank, NIB Cap-ital Bank, Swedish Export Credit,Bekaert, Almanij, Kredietbank SALuxembourgeoise, Koninkrijk Bel-gië and Phoenix Funding Plc.
KBC was also active on markets incommercial paper (in Belgium,it has a share of some 25% of thismarket) and in medium-term notes(MTN), as well as in structured andnon-structured private placements.Via KBC IFIMA, KBC Bank placedfloating- and fixed-rate debt instru-ments on the public market for itsown account worth 2.26 billioneuros.
Securitization operationsIn the first half of 2001, a 650-mil-lion-euro portfolio of the IIB BankGroup’s home loans was securi-tized, with KBC Bank acting asjoint co-lead manager for the oper-ation. In the second half of theyear, ‘Cygnus Finance 2001-1’ waslaunched for the synthetic securi-tization of European and Americancorporate bonds and loans worth 2billion euros. An overview of allon-going securitization operations
appears in the ‘Risk management’section.
Specialized subsidiariesIn view of the important positionKBC Securities has on EuronextBrussels and the liquidity it offersinstitutional investors in numerousBelgian shares, the weakening ofequity activities in 2001 clearly leftits mark on this subsidiary’s equity-related business. The recovery onthe markets that set in towards theend of the year could not offset theloss suffered. Naturally, the stockmarket malaise also had an adverseimpact on KBC Securities’ corpor-ate finance activities.Nevertheless, KBC Securities suc-ceeded in capturing the top spot onEuronext Brussels for the fifth timein a row as far as market share isconcerned, and still figures amongthe leading foreign brokerages inFrance. Moreover, in keeping withits aim to become a pan-Europeanbroking company, KBC Securitiesopened a sales office in Madrid lastyear, supplementing its presence inBelgium, France, the Netherlands,the US and (via Patria Finance) theCzech Republic. This strategy willcontinue to be pursued in the yearsahead, while special attention willbe paid to integrating acquisitions.Accordingly, the KBC SecuritiesGroup is focusing on setting upbusiness lines with cross-border andintragroup responsibilities.
MARKET ACTIVITIES PROFIT CONTRIBUTION
(in millions of EUR) 2000 2001
Equity subsidiaries 181.0 -48.1Dealing room activities 47.2 94.5
Brussels 41.9 49.4foreign branches -10.5 30.3subsidiaries* 15.9 14.8
Total 228.2 46.5
* Excluding Central Europe.
Market activities
KBC Bank & Insurance Group − 2001 Annual Report
46
The difficulties experienced on theequity and equity-linked markets in2001 were clearly reflected in theresults of the KBC Financial Prod-ucts (KBC FP) Group, as well.Although its convertible bond busi-ness succeeded in significantlyincreasing trading revenues in boththe US and Europe, trading rev-enues from Japan were down andthose from Asia remained virtuallyunchanged. Moreover, the tradingrevenues from the equity deriva-tives business fell sharply, due tothe bad performance of insti-tutional transactions in Japan andAsia, and to retail transactions as awhole. KBC FP Brussels’ result wasseriously undermined by the marketmovements that followed the eventsof 11 September, a much higherlevel of volatility, the downwardrevision of the dividend outlookand other changed factors.Given the subdued market condi-tions, KBC FP started rationalizingits business activities, which
included discontinuing its ISE busi-ness (the electronic optionsexchange in the US). It diversifiedby establishing two new activities,a credit derivatives business and themanagement of a fund for arbi-traging convertible bonds (KBCConvertible Arbitrage Fund1, with anet asset value of some 500 millionUS dollars), while stepping up itsinternational presence by opening arepresentative office in Milan.
Acquisition of Peel HuntAt the end of February 2001, KBCsuccessfully wrapped up its bid forPeel Hunt and is now its soleowner. Peel Hunt is a British secu-rities house for institutional inves-tors that specializes in small andmid-caps. Its activities include cor-porate finance, research, agencysales, market making and privateequity capital services. It also ownsRhine Securities, a London-basedsecurities house specialized in Ger-man stocks.
At the start of 2002, the companyname was changed to KBC PeelHunt.
KEY FIGURES FOR THE MAINSUBSIDIARIES
Besides KBC Bank NV, a numberof the KBC Group’s subsidiarycompanies operate exclusively ormainly in ‘Market activities’, includ-ing the above-mentioned KBCSecurities (with its own subsidiariesin France and the Netherlands),KBC Financial Products (includingKBC Financial Products Brussels,the former KBC Derivatives) andthe securities house Peel Hunt.KBC Clearing, a clearing house formarket-makers which is located inthe Netherlands, is active in thisarea, as well.
1 See under ‘New funds’ in the Asset man-agement section.
SUBSIDIARIES
KBC shareholding Net profit (in millions of EUR) ROE1999 2000 2001 1999 2000 2001 1999 2000 2001
KBC Clearing - 75.0% 75.0% - 1.2 2.9 - 10.6% 21.4%KBC Financial Products (Group) 100.0%1 100.0% 100.0% 90.9 96.1 -40.7 - 22.4% -5.6%KBC Securities (Group) 100.0% 100.0% 100.0% 55.3 51.8 -17.3 65.3% 42.9% -12.9%KBC Peel Hunt2 - 20.1% 100.0% - 11.3 4.8 - 18.0% 8.7%
1 The percentage stake in KBC Derivatives (now KBC Financial Products Brussels) was raised at the beginning of 2000 from 60% to 100%.2 2001: abbreviated financial year (1 April − 31 December). Return on equity has been annualized.
Market activities
KBC Bank & Insurance Group − 2001 Annual Report
47
■ ■ ■ ■ ■ ■ ■ ■ ■ ■
Risk management
■ ■ ■ THERE ARE A NUMBER OF TYPICAL RISKS ASSOCIATED WITH
THE BUSINESS OF BANKING AND INSURANCE. COUNTERPARTY
RISK, COUNTRY RISK, VARIOUS MARKET RISKS AND LIQUIDITY
RISK AFFECT THE BANKING BUSINESS, WHILE THE
INSURANCE BUSINESS IS EXPOSED PRIMARILY TO INVESTMENT
RISK AND SUNDRY TECHNICAL RISKS. ON TOP OF THIS,
BOTH THE BANKING AND THE INSURANCE ACTIVITIES ARE
EXPOSED TO OPERATIONAL RISKS. CURTAILING ALL THESE RISKS
AND KEEPING THEM MANAGEABLE IS ONE OF THE MOST CRUCIAL
TASKS OF KBC GROUP MANAGEMENT. ■ ■ ■
RISK MANAGEMENTWITHIN THE GROUP
2001 saw few changes being madeto the way in which risk manage-ment activities are organized withinthe Group. The various entitieshandling risk management are:j The Risk Management Division
at KBC Bank, which is respon-sible for overseeing market andliquidity risks and developingcredit risk models; the subsidiar-ies’ local risk management unitsassist it in carrying out this task.
j The specialist Actuarial and RiskManagement Department atKBC Insurance, which monitorsrisks and sets the relevant policyguidelines.
j Two directorates at KBC Bank,charged with monitoring risksassociated with domestic andinternational lending activities.
j Audit divisions at KBC Bank andKBC Insurance, which, besidesthe traditional, audit-relatedtasks, also organize operationalrisk management.
At the end of 2001, KBC decided toadopt a more integrated approachto risk management, centralizingthe management of all types of riskfor the entire bancassurance groupin one risk management division athead office. Consequently, all mar-ket, liquidity, counterparty, country,operational and underwriting riskswill come to be monitored in 2002
from a centralized risk managementfunction working in close consult-ation with local risk managementunits. For the purposes of this re-organization, a number of changeswere also made in the area of riskgovernance. Additional risk man-agement committees were set up,for instance, including a GroupRisk Committee to handle co-ordin-ation at Group level.
The new structure will take shapegradually over the coming year. Itsmission will be to create an appro-priate management framework, inline with forward-looking industrystandards and independent of linemanagement, for identifying, meas-uring, reporting and advising on alltypes of risk with a view to opti-mizing risk/return ratios and capitalallocation.
RISK MANAGEMENTAT KBC BANK
Counterparty riskGenerally speaking, counterpartyrisk, or credit risk, is the risk that adebt will not be repaid due to thecounterparty’s insolvency or lack ofwillingness to pay.
Monitoring counterparty riskCounterparty risk (and country risk,see below) is monitored through aset of rules and proceduresapproved by the Executive Commit-tee (EC) regarding the acceptanceprocess for new loan and limitapplications, the process of moni-toring and supervising credit risksand portfolio management.
j Acceptance processCredit proposals must always besubmitted in writing. Applicationsfor larger and/or riskier loans are
Risk management
KBC Bank & Insurance Group − 2001 Annual Report
48
screened beforehand by a creditadviser who, in formulating hisadvice, takes account of generallending policy, as well as all rele-vant risk-related aspects.
In principle, decisions are taken ona collegial basis by two or moreindividuals, whether meeting as acredit committee or otherwise.At least one of these individualsmust be a loan officer with decisionpower.1 The EC itself will decide onthe biggest and/or riskiest loans.The other decision levels arelocated on different rungs of thebank’s hierarchy, ranging from thebranch itself to the ‘ExtendedCredit Committee’, whose powersare second only to those of the ECitself and whose chairman is amember of that body.
Using decision matrices that takeaccount of such parameters as theGroup risk total2, the class of risk3
and the type of counterparty (pri-vate persons, companies, govern-ments, financial institutions),the relevant decision level is deter-mined.
j Supervision andmonitoring processes
In principle, a member of a creditcommittee will supervise decisionstaken at the decision level immedi-ately below his. This entails check-ing whether the decision is consist-ent with general policy guidelinesand lending policy.
Each loan is subsequently subject toa periodic review. How often a loanis reviewed depends on a number offactors, including the class of risk towhich it belongs. Weaker, riskiercredit is reviewed at least once ayear.
Besides adequate monitoring oflimit-overruns and arrears of pay-ment, continuous monitoring is
conducted to detect heightenedrisks. For instance, the domesticloan portfolio is regularly screenedfor negative signals that might indi-cate a higher credit risk. Where theinternational loan portfolio is con-cerned, any events that substantiallyincrease risk are reported immedi-ately to the competent authority athead office. Since 2000, part of theloan portfolio has also beenscreened for heightened risks usingthe ‘KMV Credit Monitor’, a toolthat calculates a company’s chancesof going bankrupt on the basis of anumber of variables such as itsshare price and degree of indebted-ness.A close watch is also kept on prob-lem loans. In Belgium, a distinctionis made between counterpartiesfacing a short-lived liquidity crunchand those confronted with adversedevelopments that are structural innature. In the first case, the net-work itself remains responsible forcredit monitoring, while in the sec-ond, the relationship with the bor-rower is directed and/or managedby the Special Credit ManagementDivision, with a view to controllingand reducing the risk and safe-guarding the bank’s position to thegreatest extent possible. Abroad,the branch network is responsiblefor alert credit monitoring,although any changes made toproblem loans must always be sub-mitted to a credit committee athead office. Both in Belgium andabroad, decisions regarding prob-lem loans are taken according to astricter delegation matrix. An over-view of actual problem loans is sub-mitted to the Executive Committeeeach quarter.
If a problem loan might entail aloss for the bank, write-downs willbe booked. For instance, for bor-rowers with payment problems, therequisite amounts are written downin good time, account taken of the
estimated loss and hence also of thecollateral provided (among otherthings), based on the specific riskestimate made for each loan dossier(for smaller dossiers in Belgium,provisions are calculated on a port-folio basis). As a precautionarymeasure, write-downs may also becharged for borrowers experiencingcertain difficulties though stillmanaging to meet their obligations.For special events that might have anegative impact in the (near) futureon credit quality, additional (gen-eral) provisions are booked, too, ifnecessary. On top of this, for for-eign credit risks, a general loan-lossprovision is set aside (based on riskclass), along with a provision forcountry risk (see below).
j Portfolio managementSupervision on a portfolio basis iscarried out by means of, inter alia, ahalf-yearly report being submittedto the Executive Committee on thesize and composition of the consoli-dated loan portfolio. The largestrisk concentrations are monitoredvia various periodic and ad hocreports that are submitted to theExtended Credit Committee.An overview is also prepared eachyear for the Board of Directors,showing all non-financial counter-
1 For smaller, domestic loans, a scoringsystem can be used instead of havingrecourse to a loan officer.
2 Basically, the ‘Group risk total’ is the sumof all credit and limits that all companiesin the Group to which the counterpartybelongs already have or have applied forfrom all KBC Group companies.No amounts are deducted for security orguarantees received. Moreover, security isalso included in the Group risk total of thecounterparty providing it.
3 The ‘risk class’ reflects the assessment ofthe risk relating to the credit. This can bedetermined in two ways: The ‘old’ way,in which a credit is categorized on the basisof experience (from ‘low risk’ to ‘loss’).The new way, which is being phased ingradually, is supported by an internallydeveloped rating tool, which is used to putcredit into a specific category, rangingfrom 1 (lowest risk) to 12 (highest risk).
Risk management
KBC Bank & Insurance Group − 2001 Annual Report
49
■ ■ ■ ■ ■ ■ ■ ■ ■ ■
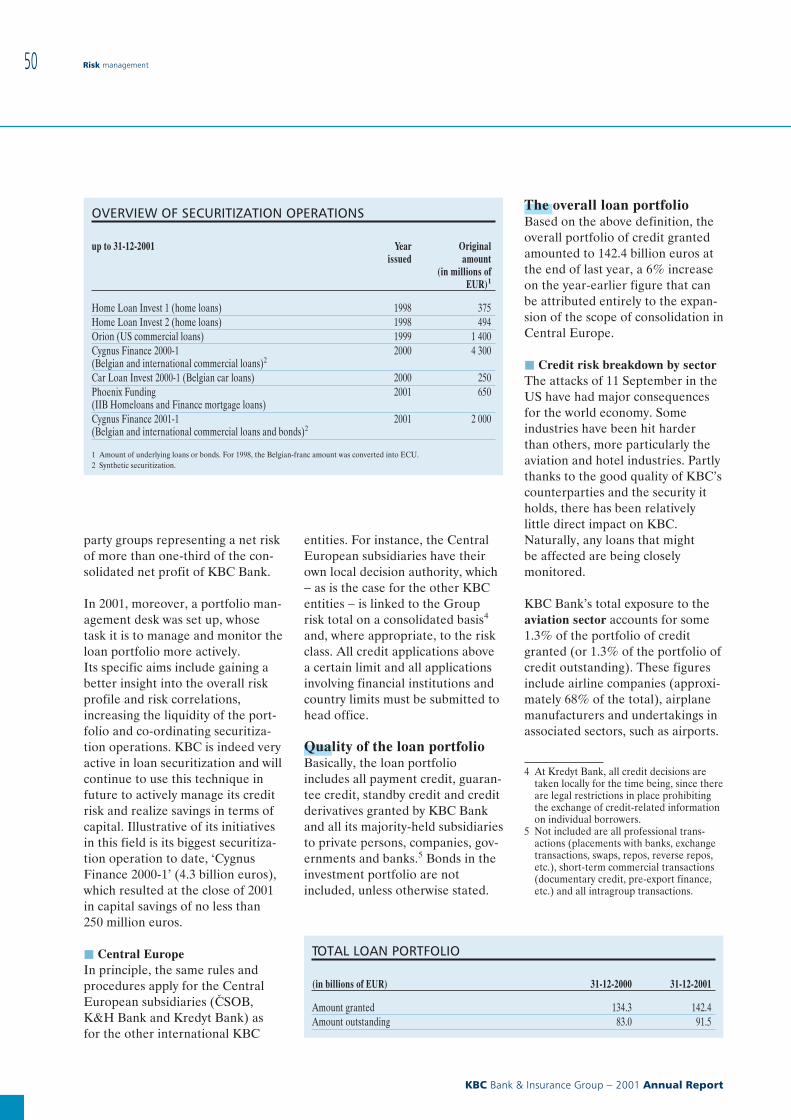
party groups representing a net riskof more than one-third of the con-solidated net profit of KBC Bank.
In 2001, moreover, a portfolio man-agement desk was set up, whosetask it is to manage and monitor theloan portfolio more actively.Its specific aims include gaining abetter insight into the overall riskprofile and risk correlations,increasing the liquidity of the port-folio and co-ordinating securitiza-tion operations. KBC is indeed veryactive in loan securitization and willcontinue to use this technique infuture to actively manage its creditrisk and realize savings in terms ofcapital. Illustrative of its initiativesin this field is its biggest securitiza-tion operation to date, ‘CygnusFinance 2000-1’ (4.3 billion euros),which resulted at the close of 2001in capital savings of no less than250 million euros.
j Central EuropeIn principle, the same rules andprocedures apply for the CentralEuropean subsidiaries (C{SOB,K&H Bank and Kredyt Bank) asfor the other international KBC
entities. For instance, the CentralEuropean subsidiaries have theirown local decision authority, which− as is the case for the other KBCentities − is linked to the Grouprisk total on a consolidated basis4
and, where appropriate, to the riskclass. All credit applications abovea certain limit and all applicationsinvolving financial institutions andcountry limits must be submitted tohead office.
Quality of the loan portfolioBasically, the loan portfolioincludes all payment credit, guaran-tee credit, standby credit and creditderivatives granted by KBC Bankand all its majority-held subsidiariesto private persons, companies, gov-ernments and banks.5 Bonds in theinvestment portfolio are notincluded, unless otherwise stated.
The overall loan portfolioBased on the above definition, theoverall portfolio of credit grantedamounted to 142.4 billion euros atthe end of last year, a 6% increaseon the year-earlier figure that canbe attributed entirely to the expan-sion of the scope of consolidation inCentral Europe.
j Credit risk breakdown by sectorThe attacks of 11 September in theUS have had major consequencesfor the world economy. Someindustries have been hit harderthan others, more particularly theaviation and hotel industries. Partlythanks to the good quality of KBC’scounterparties and the security itholds, there has been relativelylittle direct impact on KBC.Naturally, any loans that mightbe affected are being closelymonitored.
KBC Bank’s total exposure to theaviation sector accounts for some1.3% of the portfolio of creditgranted (or 1.3% of the portfolio ofcredit outstanding). These figuresinclude airline companies (approxi-mately 68% of the total), airplanemanufacturers and undertakings inassociated sectors, such as airports.
4 At Kredyt Bank, all credit decisions aretaken locally for the time being, since thereare legal restrictions in place prohibitingthe exchange of credit-related informationon individual borrowers.
5 Not included are all professional trans-actions (placements with banks, exchangetransactions, swaps, repos, reverse repos,etc.), short-term commercial transactions(documentary credit, pre-export finance,etc.) and all intragroup transactions.
OVERVIEW OF SECURITIZATION OPERATIONS
up to 31-12-2001 Yearissued
Originalamount
(in millions ofEUR)1
Home Loan Invest 1 (home loans) 1998 375Home Loan Invest 2 (home loans) 1998 494Orion (US commercial loans) 1999 1 400Cygnus Finance 2000-1(Belgian and international commercial loans)2
2000 4 300
Car Loan Invest 2000-1 (Belgian car loans) 2000 250Phoenix Funding(IIB Homeloans and Finance mortgage loans)
2001 650
Cygnus Finance 2001-1(Belgian and international commercial loans and bonds)2
2001 2 000
1 Amount of underlying loans or bonds. For 1998, the Belgian-franc amount was converted into ECU.2 Synthetic securitization.
TOTAL LOAN PORTFOLIO
(in billions of EUR) 31-12-2000 31-12-2001
Amount granted 134.3 142.4Amount outstanding 83.0 91.5
Risk management
KBC Bank & Insurance Group − 2001 Annual Report
50
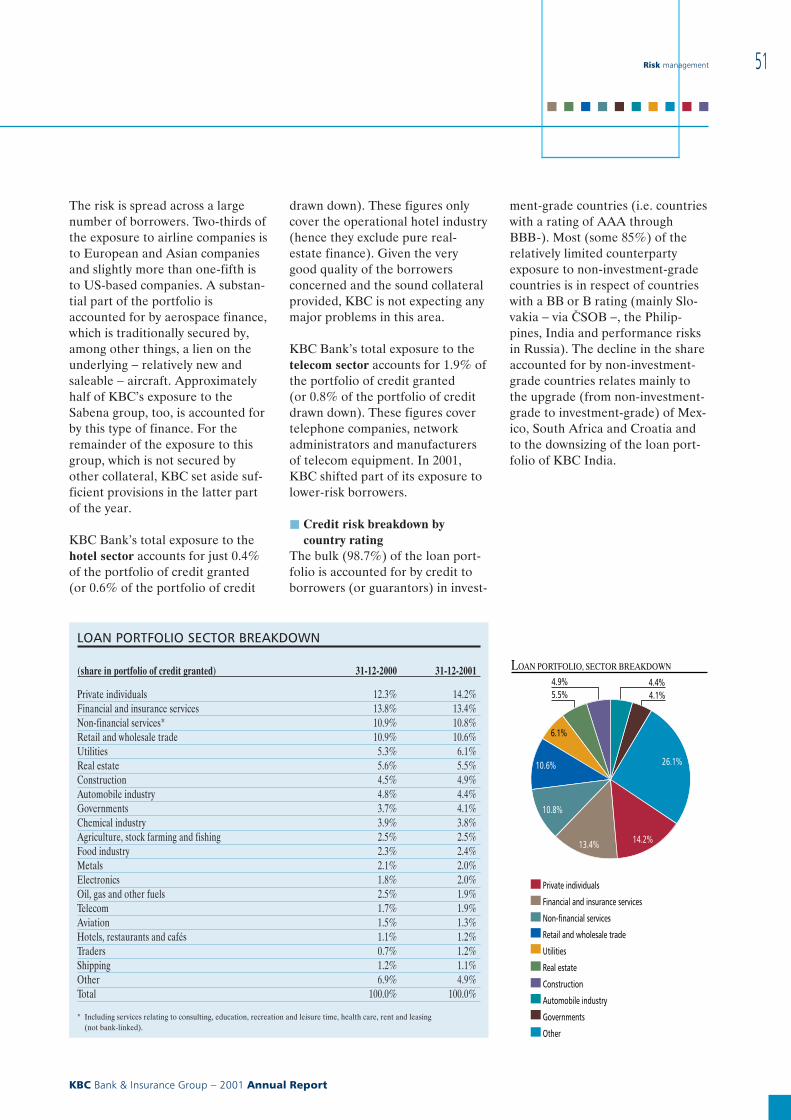
The risk is spread across a largenumber of borrowers. Two-thirds ofthe exposure to airline companies isto European and Asian companiesand slightly more than one-fifth isto US-based companies. A substan-tial part of the portfolio isaccounted for by aerospace finance,which is traditionally secured by,among other things, a lien on theunderlying − relatively new andsaleable − aircraft. Approximatelyhalf of KBC’s exposure to theSabena group, too, is accounted forby this type of finance. For theremainder of the exposure to thisgroup, which is not secured byother collateral, KBC set aside suf-ficient provisions in the latter partof the year.
KBC Bank’s total exposure to thehotel sector accounts for just 0.4%of the portfolio of credit granted(or 0.6% of the portfolio of credit
drawn down). These figures onlycover the operational hotel industry(hence they exclude pure real-estate finance). Given the verygood quality of the borrowersconcerned and the sound collateralprovided, KBC is not expecting anymajor problems in this area.
KBC Bank’s total exposure to thetelecom sector accounts for 1.9% ofthe portfolio of credit granted(or 0.8% of the portfolio of creditdrawn down). These figures covertelephone companies, networkadministrators and manufacturersof telecom equipment. In 2001,KBC shifted part of its exposure tolower-risk borrowers.
j Credit risk breakdown bycountry rating
The bulk (98.7%) of the loan port-folio is accounted for by credit toborrowers (or guarantors) in invest-
ment-grade countries (i.e. countrieswith a rating of AAA throughBBB-). Most (some 85%) of therelatively limited counterpartyexposure to non-investment-gradecountries is in respect of countrieswith a BB or B rating (mainly Slo-vakia − via C{SOB −, the Philip-pines, India and performance risksin Russia). The decline in the shareaccounted for by non-investment-grade countries relates mainly tothe upgrade (from non-investment-grade to investment-grade) of Mex-ico, South Africa and Croatia andto the downsizing of the loan port-folio of KBC India.
LOAN PORTFOLIO SECTOR BREAKDOWN
(share in portfolio of credit granted) 31-12-2000 31-12-2001
Private individuals 12.3% 14.2%Financial and insurance services 13.8% 13.4%Non-financial services* 10.9% 10.8%Retail and wholesale trade 10.9% 10.6%Utilities 5.3% 6.1%Real estate 5.6% 5.5%Construction 4.5% 4.9%Automobile industry 4.8% 4.4%Governments 3.7% 4.1%Chemical industry 3.9% 3.8%Agriculture, stock farming and fishing 2.5% 2.5%Food industry 2.3% 2.4%Metals 2.1% 2.0%Electronics 1.8% 2.0%Oil, gas and other fuels 2.5% 1.9%Telecom 1.7% 1.9%Aviation 1.5% 1.3%Hotels, restaurants and cafés 1.1% 1.2%Traders 0.7% 1.2%Shipping 1.2% 1.1%Other 6.9% 4.9%Total 100.0% 100.0%
* Including services relating to consulting, education, recreation and leisure time, health care, rent and leasing(not bank-linked).
LOAN PORTFOLIO, SECTOR BREAKDOWN
Private individuals
Financial and insurance services
Non-financial services
Retail and wholesale trade
Utilities
Real estate
Construction
Automobile industry
Governments
Other
26.1%
5.5% 4.1%4.4%4.9%
14.2%13.4%
10.8%
10.6%
6.1%
Risk management
KBC Bank & Insurance Group − 2001 Annual Report
51
■ ■ ■ ■ ■ ■ ■ ■ ■ ■
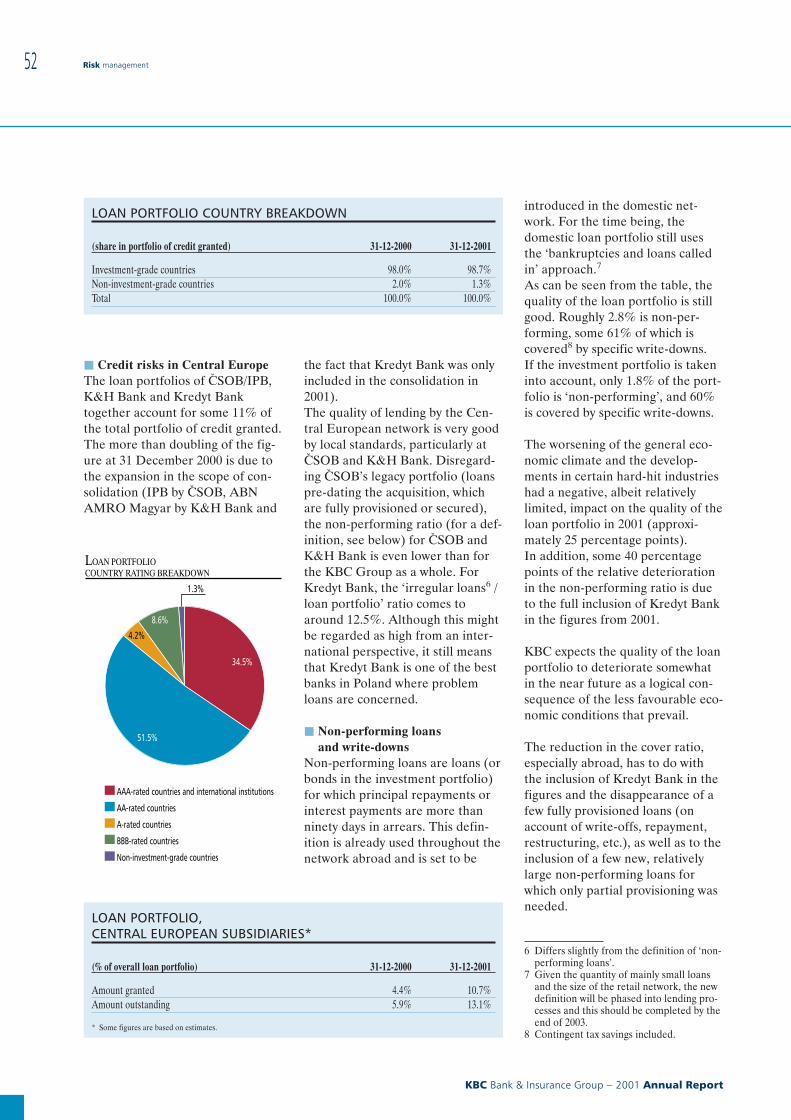
j Credit risks in Central EuropeThe loan portfolios of C{SOB/IPB,K&H Bank and Kredyt Banktogether account for some 11% ofthe total portfolio of credit granted.The more than doubling of the fig-ure at 31 December 2000 is due tothe expansion in the scope of con-solidation (IPB by C{SOB, ABNAMRO Magyar by K&H Bank and
the fact that Kredyt Bank was onlyincluded in the consolidation in2001).The quality of lending by the Cen-tral European network is very goodby local standards, particularly atC{SOB and K&H Bank. Disregard-ing C{SOB’s legacy portfolio (loanspre-dating the acquisition, whichare fully provisioned or secured),the non-performing ratio (for a def-inition, see below) for C{SOB andK&H Bank is even lower than forthe KBC Group as a whole. ForKredyt Bank, the ‘irregular loans6 /loan portfolio’ ratio comes toaround 12.5%. Although this mightbe regarded as high from an inter-national perspective, it still meansthat Kredyt Bank is one of the bestbanks in Poland where problemloans are concerned.
j Non-performing loansand write-downs
Non-performing loans are loans (orbonds in the investment portfolio)for which principal repayments orinterest payments are more thanninety days in arrears. This defin-ition is already used throughout thenetwork abroad and is set to be
introduced in the domestic net-work. For the time being, thedomestic loan portfolio still usesthe ‘bankruptcies and loans calledin’ approach.7
As can be seen from the table, thequality of the loan portfolio is stillgood. Roughly 2.8% is non-per-forming, some 61% of which iscovered8 by specific write-downs.If the investment portfolio is takeninto account, only 1.8% of the port-folio is ‘non-performing’, and 60%is covered by specific write-downs.
The worsening of the general eco-nomic climate and the develop-ments in certain hard-hit industrieshad a negative, albeit relativelylimited, impact on the quality of theloan portfolio in 2001 (approxi-mately 25 percentage points).In addition, some 40 percentagepoints of the relative deteriorationin the non-performing ratio is dueto the full inclusion of Kredyt Bankin the figures from 2001.
KBC expects the quality of the loanportfolio to deteriorate somewhatin the near future as a logical con-sequence of the less favourable eco-nomic conditions that prevail.
The reduction in the cover ratio,especially abroad, has to do withthe inclusion of Kredyt Bank in thefigures and the disappearance of afew fully provisioned loans (onaccount of write-offs, repayment,restructuring, etc.), as well as to theinclusion of a few new, relativelylarge non-performing loans forwhich only partial provisioning wasneeded.
6 Differs slightly from the definition of ‘non-performing loans’.
7 Given the quantity of mainly small loansand the size of the retail network, the newdefinition will be phased into lending pro-cesses and this should be completed by theend of 2003.
8 Contingent tax savings included.
LOAN PORTFOLIO COUNTRY BREAKDOWN
(share in portfolio of credit granted) 31-12-2000 31-12-2001
Investment-grade countries 98.0% 98.7%Non-investment-grade countries 2.0% 1.3%Total 100.0% 100.0%
LOAN PORTFOLIO,CENTRAL EUROPEAN SUBSIDIARIES*
(% of overall loan portfolio) 31-12-2000 31-12-2001
Amount granted 4.4% 10.7%Amount outstanding 5.9% 13.1%
* Some figures are based on estimates.
LOAN PORTFOLIOCOUNTRY RATING BREAKDOWN
AAA-rated countries and international institutions
AA-rated countries
A-rated countries
BBB-rated countries
Non-investment-grade countries
34.5%
51.5%
4.2%
8.6%
1.3%
Risk management
KBC Bank & Insurance Group − 2001 Annual Report
52
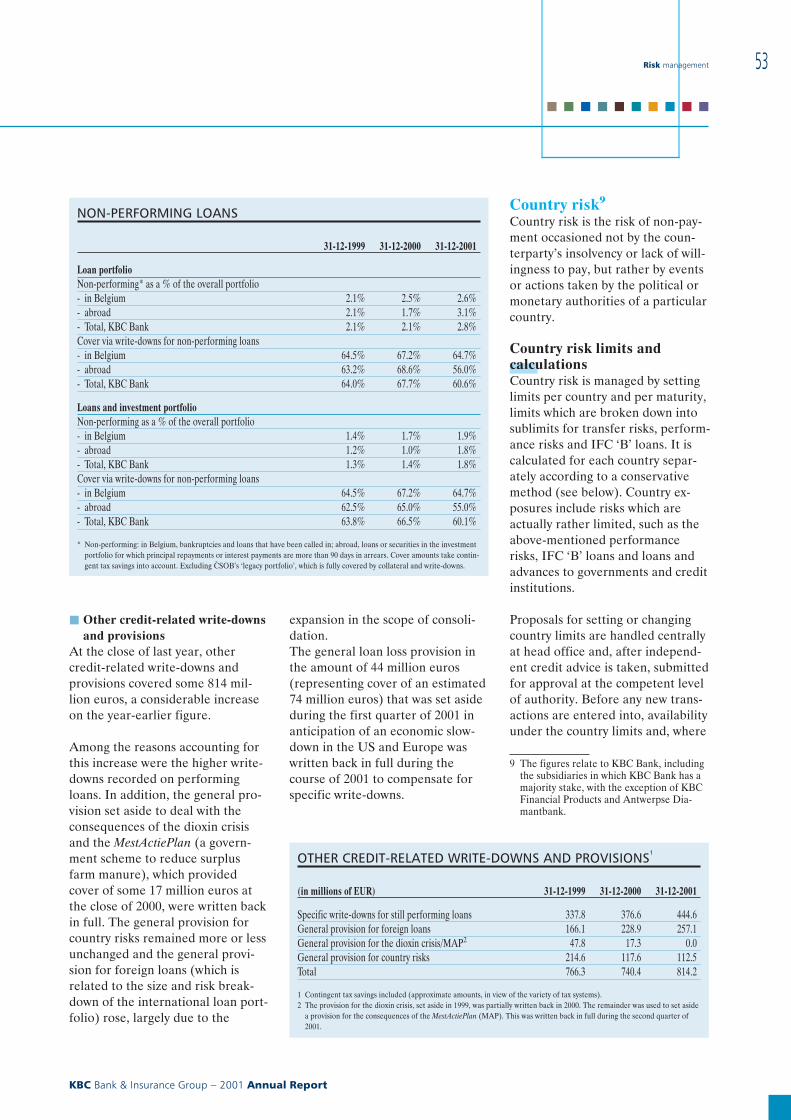
j Other credit-related write-downsand provisions
At the close of last year, othercredit-related write-downs andprovisions covered some 814 mil-lion euros, a considerable increaseon the year-earlier figure.
Among the reasons accounting forthis increase were the higher write-downs recorded on performingloans. In addition, the general pro-vision set aside to deal with theconsequences of the dioxin crisisand the MestActiePlan (a govern-ment scheme to reduce surplusfarm manure), which providedcover of some 17 million euros atthe close of 2000, were written backin full. The general provision forcountry risks remained more or lessunchanged and the general provi-sion for foreign loans (which isrelated to the size and risk break-down of the international loan port-folio) rose, largely due to the
expansion in the scope of consoli-dation.The general loan loss provision inthe amount of 44 million euros(representing cover of an estimated74 million euros) that was set asideduring the first quarter of 2001 inanticipation of an economic slow-down in the US and Europe waswritten back in full during thecourse of 2001 to compensate forspecific write-downs.
Country risk9
Country risk is the risk of non-pay-ment occasioned not by the coun-terparty’s insolvency or lack of will-ingness to pay, but rather by eventsor actions taken by the political ormonetary authorities of a particularcountry.
Country risk limits andcalculationsCountry risk is managed by settinglimits per country and per maturity,limits which are broken down intosublimits for transfer risks, perform-ance risks and IFC ‘B’ loans. It iscalculated for each country separ-ately according to a conservativemethod (see below). Country ex-posures include risks which areactually rather limited, such as theabove-mentioned performancerisks, IFC ‘B’ loans and loans andadvances to governments and creditinstitutions.
Proposals for setting or changingcountry limits are handled centrallyat head office and, after independ-ent credit advice is taken, submittedfor approval at the competent levelof authority. Before any new trans-actions are entered into, availabilityunder the country limits and, where
9 The figures relate to KBC Bank, includingthe subsidiaries in which KBC Bank has amajority stake, with the exception of KBCFinancial Products and Antwerpse Dia-mantbank.
NON-PERFORMING LOANS
31-12-1999 31-12-2000 31-12-2001
Loan portfolioNon-performing* as a % of the overall portfolio- in Belgium 2.1% 2.5% 2.6%- abroad 2.1% 1.7% 3.1%- Total, KBC Bank 2.1% 2.1% 2.8%Cover via write-downs for non-performing loans- in Belgium 64.5% 67.2% 64.7%- abroad 63.2% 68.6% 56.0%- Total, KBC Bank 64.0% 67.7% 60.6%
Loans and investment portfolioNon-performing as a % of the overall portfolio- in Belgium 1.4% 1.7% 1.9%- abroad 1.2% 1.0% 1.8%- Total, KBC Bank 1.3% 1.4% 1.8%Cover via write-downs for non-performing loans- in Belgium 64.5% 67.2% 64.7%- abroad 62.5% 65.0% 55.0%- Total, KBC Bank 63.8% 66.5% 60.1%
* Non-performing: in Belgium, bankruptcies and loans that have been called in; abroad, loans or securities in the investmentportfolio for which principal repayments or interest payments are more than 90 days in arrears. Cover amounts take contin-gent tax savings into account. Excluding C{SOB’s ‘legacy portfolio’, which is fully covered by collateral and write-downs.
OTHER CREDIT-RELATED WRITE-DOWNS AND PROVISIONS1
(in millions of EUR) 31-12-1999 31-12-2000 31-12-2001
Specific write-downs for still performing loans 337.8 376.6 444.6General provision for foreign loans 166.1 228.9 257.1General provision for the dioxin crisis/MAP2 47.8 17.3 0.0General provision for country risks 214.6 117.6 112.5Total 766.3 740.4 814.2
1 Contingent tax savings included (approximate amounts, in view of the variety of tax systems).2 The provision for the dioxin crisis, set aside in 1999, was partially written back in 2000. The remainder was used to set aside
a provision for the consequences of the MestActiePlan (MAP). This was written back in full during the second quarter of2001.
Risk management
KBC Bank & Insurance Group − 2001 Annual Report
53
■ ■ ■ ■ ■ ■ ■ ■ ■ ■
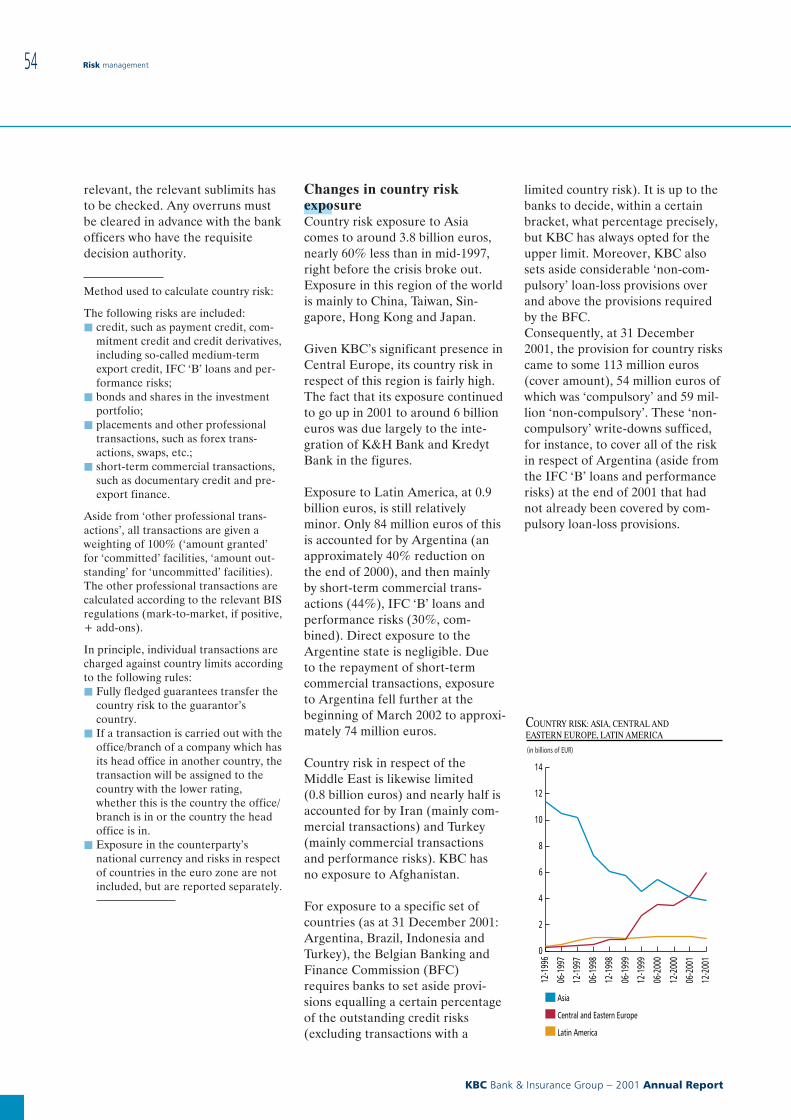
relevant, the relevant sublimits hasto be checked. Any overruns mustbe cleared in advance with the bankofficers who have the requisitedecision authority.
Method used to calculate country risk:
The following risks are included:j credit, such as payment credit, com-
mitment credit and credit derivatives,including so-called medium-termexport credit, IFC ‘B’ loans and per-formance risks;
j bonds and shares in the investmentportfolio;
j placements and other professionaltransactions, such as forex trans-actions, swaps, etc.;
j short-term commercial transactions,such as documentary credit and pre-export finance.
Aside from ‘other professional trans-actions’, all transactions are given aweighting of 100% (‘amount granted’for ‘committed’ facilities, ‘amount out-standing’ for ‘uncommitted’ facilities).The other professional transactions arecalculated according to the relevant BISregulations (mark-to-market, if positive,+ add-ons).
In principle, individual transactions arecharged against country limits accordingto the following rules:j Fully fledged guarantees transfer the
country risk to the guarantor’scountry.
j If a transaction is carried out with theoffice/branch of a company which hasits head office in another country, thetransaction will be assigned to thecountry with the lower rating,whether this is the country the office/branch is in or the country the headoffice is in.
j Exposure in the counterparty’snational currency and risks in respectof countries in the euro zone are notincluded, but are reported separately.
Changes in country riskexposureCountry risk exposure to Asiacomes to around 3.8 billion euros,nearly 60% less than in mid-1997,right before the crisis broke out.Exposure in this region of the worldis mainly to China, Taiwan, Sin-gapore, Hong Kong and Japan.
Given KBC’s significant presence inCentral Europe, its country risk inrespect of this region is fairly high.The fact that its exposure continuedto go up in 2001 to around 6 billioneuros was due largely to the inte-gration of K&H Bank and KredytBank in the figures.
Exposure to Latin America, at 0.9billion euros, is still relativelyminor. Only 84 million euros of thisis accounted for by Argentina (anapproximately 40% reduction onthe end of 2000), and then mainlyby short-term commercial trans-actions (44%), IFC ‘B’ loans andperformance risks (30%, com-bined). Direct exposure to theArgentine state is negligible. Dueto the repayment of short-termcommercial transactions, exposureto Argentina fell further at thebeginning of March 2002 to approxi-mately 74 million euros.
Country risk in respect of theMiddle East is likewise limited(0.8 billion euros) and nearly half isaccounted for by Iran (mainly com-mercial transactions) and Turkey(mainly commercial transactionsand performance risks). KBC hasno exposure to Afghanistan.
For exposure to a specific set ofcountries (as at 31 December 2001:Argentina, Brazil, Indonesia andTurkey), the Belgian Banking andFinance Commission (BFC)requires banks to set aside provi-sions equalling a certain percentageof the outstanding credit risks(excluding transactions with a
limited country risk). It is up to thebanks to decide, within a certainbracket, what percentage precisely,but KBC has always opted for theupper limit. Moreover, KBC alsosets aside considerable ‘non-com-pulsory’ loan-loss provisions overand above the provisions requiredby the BFC.Consequently, at 31 December2001, the provision for country riskscame to some 113 million euros(cover amount), 54 million euros ofwhich was ‘compulsory’ and 59 mil-lion ‘non-compulsory’. These ‘non-compulsory’ write-downs sufficed,for instance, to cover all of the riskin respect of Argentina (aside fromthe IFC ‘B’ loans and performancerisks) at the end of 2001 that hadnot already been covered by com-pulsory loan-loss provisions.
COUNTRY RISK: ASIA, CENTRAL AND EASTERN EUROPE, LATIN AMERICA
(in billions of EUR)
0
2
4
6
8
10
12
14
12-2
001
06-2
001
12-2
000
06-2
000
12-1
999
06-1
999
12-1
998
06-1
998
12-1
997
06-1
997
12-1
996
Asia
Central and Eastern Europe
Latin America
Risk management
KBC Bank & Insurance Group − 2001 Annual Report
54
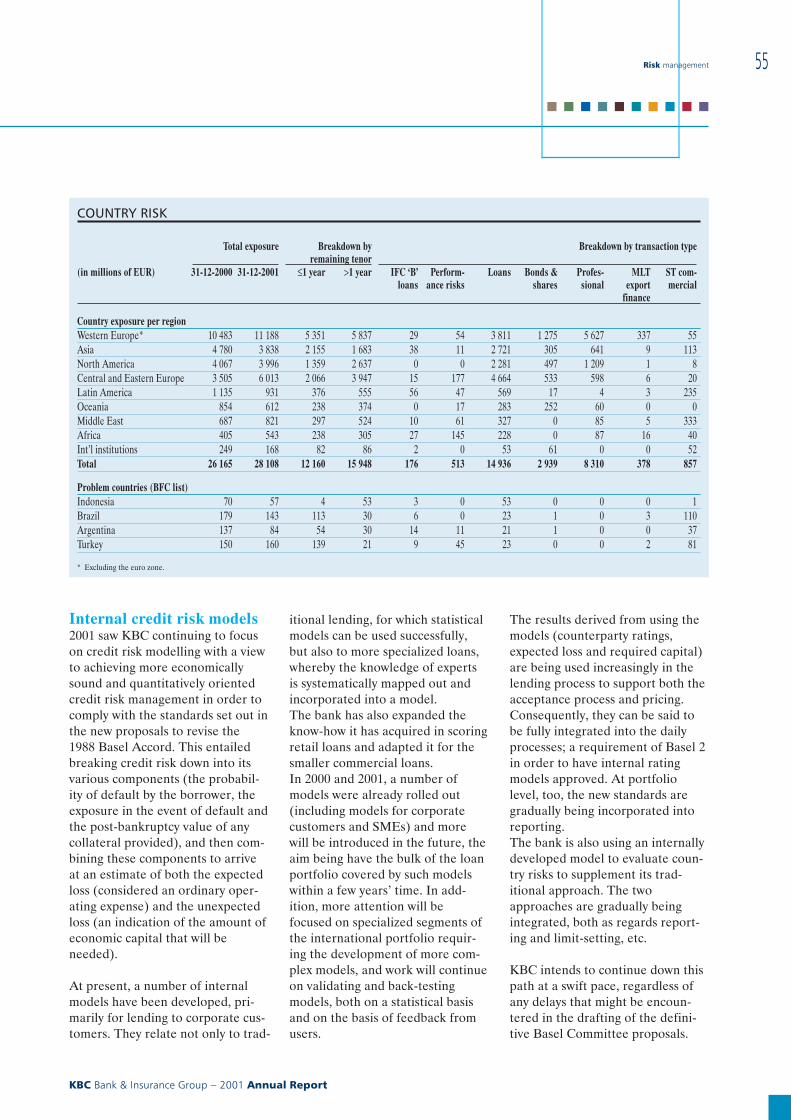
Internal credit risk models2001 saw KBC continuing to focuson credit risk modelling with a viewto achieving more economicallysound and quantitatively orientedcredit risk management in order tocomply with the standards set out inthe new proposals to revise the1988 Basel Accord. This entailedbreaking credit risk down into itsvarious components (the probabil-ity of default by the borrower, theexposure in the event of default andthe post-bankruptcy value of anycollateral provided), and then com-bining these components to arriveat an estimate of both the expectedloss (considered an ordinary oper-ating expense) and the unexpectedloss (an indication of the amount ofeconomic capital that will beneeded).
At present, a number of internalmodels have been developed, pri-marily for lending to corporate cus-tomers. They relate not only to trad-
itional lending, for which statisticalmodels can be used successfully,but also to more specialized loans,whereby the knowledge of expertsis systematically mapped out andincorporated into a model.The bank has also expanded theknow-how it has acquired in scoringretail loans and adapted it for thesmaller commercial loans.In 2000 and 2001, a number ofmodels were already rolled out(including models for corporatecustomers and SMEs) and morewill be introduced in the future, theaim being have the bulk of the loanportfolio covered by such modelswithin a few years’ time. In add-ition, more attention will befocused on specialized segments ofthe international portfolio requir-ing the development of more com-plex models, and work will continueon validating and back-testingmodels, both on a statistical basisand on the basis of feedback fromusers.
The results derived from using themodels (counterparty ratings,expected loss and required capital)are being used increasingly in thelending process to support both theacceptance process and pricing.Consequently, they can be said tobe fully integrated into the dailyprocesses; a requirement of Basel 2in order to have internal ratingmodels approved. At portfoliolevel, too, the new standards aregradually being incorporated intoreporting.The bank is also using an internallydeveloped model to evaluate coun-try risks to supplement its trad-itional approach. The twoapproaches are gradually beingintegrated, both as regards report-ing and limit-setting, etc.
KBC intends to continue down thispath at a swift pace, regardless ofany delays that might be encoun-tered in the drafting of the defini-tive Basel Committee proposals.
COUNTRY RISK
Total exposure Breakdown byremaining tenor
Breakdown by transaction type
(in millions of EUR) 31-12-2000 31-12-2001 ≤1 year >1 year IFC ‘B’loans
Perform-ance risks
Loans Bonds &shares
Profes-sional
MLTexport
finance
ST com-mercial
Country exposure per regionWestern Europe* 10 483 11 188 5 351 5 837 29 54 3 811 1 275 5 627 337 55Asia 4 780 3 838 2 155 1 683 38 11 2 721 305 641 9 113North America 4 067 3 996 1 359 2 637 0 0 2 281 497 1 209 1 8Central and Eastern Europe 3 505 6 013 2 066 3 947 15 177 4 664 533 598 6 20Latin America 1 135 931 376 555 56 47 569 17 4 3 235Oceania 854 612 238 374 0 17 283 252 60 0 0Middle East 687 821 297 524 10 61 327 0 85 5 333Africa 405 543 238 305 27 145 228 0 87 16 40Int’l institutions 249 168 82 86 2 0 53 61 0 0 52Total 26 165 28 108 12 160 15 948 176 513 14 936 2 939 8 310 378 857
Problem countries (BFC list)Indonesia 70 57 4 53 3 0 53 0 0 0 1Brazil 179 143 113 30 6 0 23 1 0 3 110Argentina 137 84 54 30 14 11 21 1 0 0 37Turkey 150 160 139 21 9 45 23 0 0 2 81
* Excluding the euro zone.
Risk management
KBC Bank & Insurance Group − 2001 Annual Report
55
■ ■ ■ ■ ■ ■ ■ ■ ■ ■
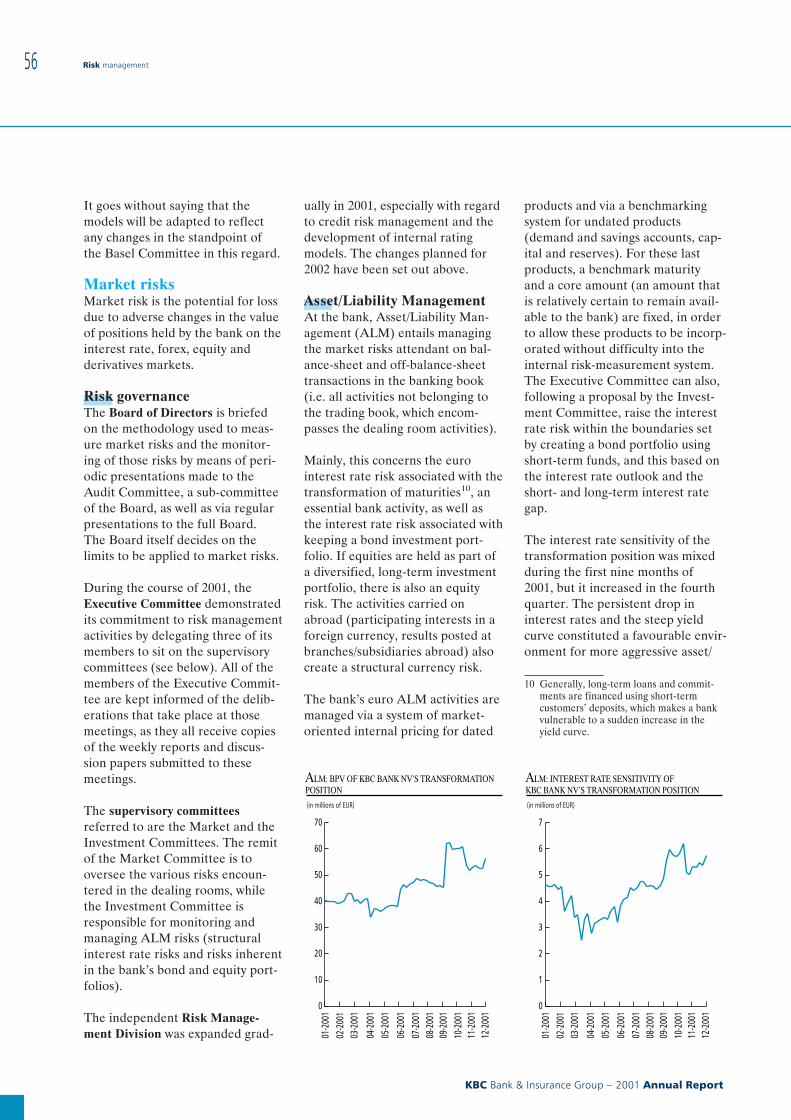
It goes without saying that themodels will be adapted to reflectany changes in the standpoint ofthe Basel Committee in this regard.
Market risksMarket risk is the potential for lossdue to adverse changes in the valueof positions held by the bank on theinterest rate, forex, equity andderivatives markets.
Risk governanceThe Board of Directors is briefedon the methodology used to meas-ure market risks and the monitor-ing of those risks by means of peri-odic presentations made to theAudit Committee, a sub-committeeof the Board, as well as via regularpresentations to the full Board.The Board itself decides on thelimits to be applied to market risks.
During the course of 2001, theExecutive Committee demonstratedits commitment to risk managementactivities by delegating three of itsmembers to sit on the supervisorycommittees (see below). All of themembers of the Executive Commit-tee are kept informed of the delib-erations that take place at thosemeetings, as they all receive copiesof the weekly reports and discus-sion papers submitted to thesemeetings.
The supervisory committeesreferred to are the Market and theInvestment Committees. The remitof the Market Committee is tooversee the various risks encoun-tered in the dealing rooms, whilethe Investment Committee isresponsible for monitoring andmanaging ALM risks (structuralinterest rate risks and risks inherentin the bank’s bond and equity port-folios).
The independent Risk Manage-ment Division was expanded grad-
ually in 2001, especially with regardto credit risk management and thedevelopment of internal ratingmodels. The changes planned for2002 have been set out above.
Asset/Liability ManagementAt the bank, Asset/Liability Man-agement (ALM) entails managingthe market risks attendant on bal-ance-sheet and off-balance-sheettransactions in the banking book(i.e. all activities not belonging tothe trading book, which encom-passes the dealing room activities).
Mainly, this concerns the eurointerest rate risk associated with thetransformation of maturities10, anessential bank activity, as well asthe interest rate risk associated withkeeping a bond investment port-folio. If equities are held as part ofa diversified, long-term investmentportfolio, there is also an equityrisk. The activities carried onabroad (participating interests in aforeign currency, results posted atbranches/subsidiaries abroad) alsocreate a structural currency risk.
The bank’s euro ALM activities aremanaged via a system of market-oriented internal pricing for dated
products and via a benchmarkingsystem for undated products(demand and savings accounts, cap-ital and reserves). For these lastproducts, a benchmark maturityand a core amount (an amount thatis relatively certain to remain avail-able to the bank) are fixed, in orderto allow these products to be incorp-orated without difficulty into theinternal risk-measurement system.The Executive Committee can also,following a proposal by the Invest-ment Committee, raise the interestrate risk within the boundaries setby creating a bond portfolio usingshort-term funds, and this based onthe interest rate outlook and theshort- and long-term interest rategap.
The interest rate sensitivity of thetransformation position was mixedduring the first nine months of2001, but it increased in the fourthquarter. The persistent drop ininterest rates and the steep yieldcurve constituted a favourable envir-onment for more aggressive asset/
10 Generally, long-term loans and commit-ments are financed using short-termcustomers’ deposits, which makes a bankvulnerable to a sudden increase in theyield curve.
ALM: BPV OF KBC BANK NV’S TRANSFORMATION POSITION
(in millions of EUR)
0
10
20
30
40
50
60
70
12-2
001
11-2
001
10-2
001
09-2
001
08-2
001
07-2
001
06-2
001
05-2
001
04-2
001
03-2
001
02-2
001
01-2
001
ALM: INTEREST RATE SENSITIVITY OF KBC BANK NV’S TRANSFORMATION POSITION
(in millions of EUR)
0
1
2
3
4
5
6
7
12-2
001
11-2
001
10-2
001
09-2
001
08-2
001
07-2
001
06-2
001
05-2
001
04-2
001
03-2
001
02-2
001
01-2
001
Risk management
KBC Bank & Insurance Group − 2001 Annual Report
56
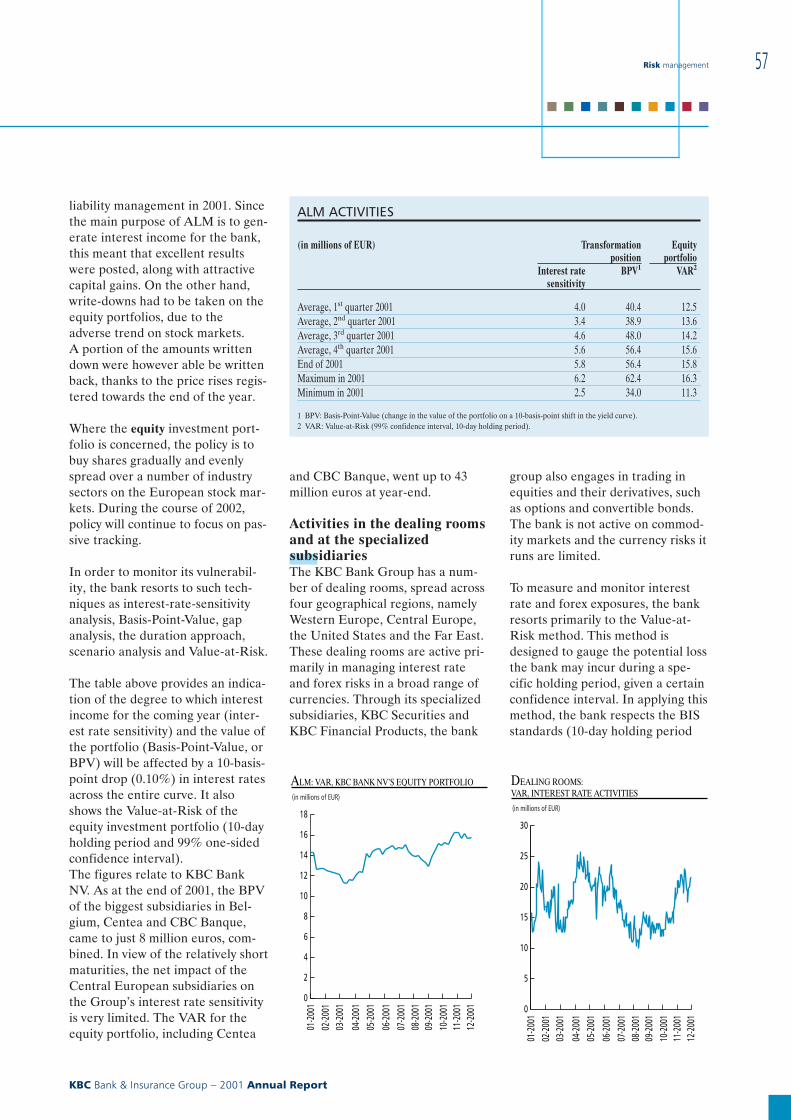
liability management in 2001. Sincethe main purpose of ALM is to gen-erate interest income for the bank,this meant that excellent resultswere posted, along with attractivecapital gains. On the other hand,write-downs had to be taken on theequity portfolios, due to theadverse trend on stock markets.A portion of the amounts writtendown were however able be writtenback, thanks to the price rises regis-tered towards the end of the year.
Where the equity investment port-folio is concerned, the policy is tobuy shares gradually and evenlyspread over a number of industrysectors on the European stock mar-kets. During the course of 2002,policy will continue to focus on pas-sive tracking.
In order to monitor its vulnerabil-ity, the bank resorts to such tech-niques as interest-rate-sensitivityanalysis, Basis-Point-Value, gapanalysis, the duration approach,scenario analysis and Value-at-Risk.
The table above provides an indica-tion of the degree to which interestincome for the coming year (inter-est rate sensitivity) and the value ofthe portfolio (Basis-Point-Value, orBPV) will be affected by a 10-basis-point drop (0.10%) in interest ratesacross the entire curve. It alsoshows the Value-at-Risk of theequity investment portfolio (10-dayholding period and 99% one-sidedconfidence interval).The figures relate to KBC BankNV. As at the end of 2001, the BPVof the biggest subsidiaries in Bel-gium, Centea and CBC Banque,came to just 8 million euros, com-bined. In view of the relatively shortmaturities, the net impact of theCentral European subsidiaries onthe Group’s interest rate sensitivityis very limited. The VAR for theequity portfolio, including Centea
and CBC Banque, went up to 43million euros at year-end.
Activities in the dealing roomsand at the specializedsubsidiariesThe KBC Bank Group has a num-ber of dealing rooms, spread acrossfour geographical regions, namelyWestern Europe, Central Europe,the United States and the Far East.These dealing rooms are active pri-marily in managing interest rateand forex risks in a broad range ofcurrencies. Through its specializedsubsidiaries, KBC Securities andKBC Financial Products, the bank
group also engages in trading inequities and their derivatives, suchas options and convertible bonds.The bank is not active on commod-ity markets and the currency risks itruns are limited.
To measure and monitor interestrate and forex exposures, the bankresorts primarily to the Value-at-Risk method. This method isdesigned to gauge the potential lossthe bank may incur during a spe-cific holding period, given a certainconfidence interval. In applying thismethod, the bank respects the BISstandards (10-day holding period
ALM ACTIVITIES
(in millions of EUR) Transformationposition
Equityportfolio
Interest ratesensitivity
BPV1 VAR2
Average, 1st quarter 2001 4.0 40.4 12.5Average, 2nd quarter 2001 3.4 38.9 13.6Average, 3rd quarter 2001 4.6 48.0 14.2Average, 4th quarter 2001 5.6 56.4 15.6End of 2001 5.8 56.4 15.8Maximum in 2001 6.2 62.4 16.3Minimum in 2001 2.5 34.0 11.3
1 BPV: Basis-Point-Value (change in the value of the portfolio on a 10-basis-point shift in the yield curve).2 VAR: Value-at-Risk (99% confidence interval, 10-day holding period).
ALM: VAR, KBC BANK NV’S EQUITY PORTFOLIO
(in millions of EUR)
0
2
4
6
8
10
12
14
16
18
12-2
001
11-2
001
10-2
001
09-2
001
08-2
001
07-2
001
06-2
001
05-2
001
04-2
001
03-2
001
02-2
001
01-2
001
DEALING ROOMS: VAR, INTEREST RATE ACTIVITIES
(in millions of EUR)
0
5
10
15
20
25
30
12-2
001
11-2
001
10-2
001
09-2
001
08-2
001
07-2
001
06-2
001
05-2
001
04-2
001
03-2
001
02-2
001
01-2
001
Risk management
KBC Bank & Insurance Group − 2001 Annual Report
57
■ ■ ■ ■ ■ ■ ■ ■ ■ ■

and 99% one-sided confidenceinterval, historical data going backat least 250 days). To supplementthe system, the bank uses variousother instruments such as gapanalysis, Basis-Point-Value, concen-tration limits, maturity restrictionsand stop-loss limits. The FX VARsystem is supplemented primarilyby concentration limits.
For option-linked products, thebank uses a method which entailsestimating the potential loss bymeans of a scenario analysis thatcovers a broad range of price andvolatility shocks, with a limit beingimposed for the most negative out-come. Positions are also tracked onthe basis of one-dimensional riskbenchmarks (the so-called Greeks)in order to measure risks inherentin such developments as pricechanges, changes in volatility andthe passing of time. The optionsactivities on forex and interest ratemarkets are very limited. In con-trast, KBC runs a more pronouncedrisk in its equities and equity-linkedbusinesses. In 2001, risk monitoring
for these activities was standard-ized, so that risks are nowexpressed in comparable units.
The VAR of market risks on themoney and capital markets gener-ally fluctuated in 2001 between 12and 22 million euros. It was hardlyaffected at all by the inclusion inthe figures of a number of CentralEuropean dealing rooms.
Since the dealing rooms abroadfocus mainly on local funding, pro-viding customer service and de-veloping local niche activities, theBrussels dealing room accounts forthe lion’s share of Value-at-Riskand profit/loss.
On the whole, a very solid contribu-tion to the results was achieved in2001, with a relatively limited riskprofile. Moreover, a number ofsoftware projects were completedthat should enable the bank toenhance its risk measurement cap-abilities, inter alia, by setting up adatabase of market data and grad-ually implementing a sophisticatedrisk-analysis model.
2001 was a difficult year as far asthe Group’s equity-linked busi-nesses were concerned, owing tothe adverse stock market climateand the specific impact of theevents of 11 September. The turbu-lence on the financial marketsbrought about by the terroristattack affected the dealing rooms’level of activity in terms of volumeand risk profile. The biggest nega-tive impact was caused by custom-ers’ reluctance to enter into newtransactions, so that in certain seg-ments (such as structured prod-ucts), volume traded dropped offsharply. Convertible bonds, how-ever, were much in demandamongst investors. The relative lackof liquidity and the high degree ofvolatility on equity markets was ofparticular concern to KBC Finan-cial Products, which was forced toconduct its normal hedging activ-ities under less favourable condi-tions.
The consequences of the unfavour-able climate that prevailed on thestock markets were to a large extentoffset by a sharp drop in interestrates in the US and Europe.
KBC FINANCIAL PRODUCTS AND KBC SECURITIES: SCENARIO ANALYSIS
(in millions of EUR, Sep-Dec 2001*)
0
5
10
15
20
25
30
35
40
45
12-2
001
11-2
001
10-2
001
09-2
001
KBC Financial Products
KBC Securities
* Cf. the availability of uniform data.
DEALING ROOM ACTIVITIES AND SPECIALIZED SUBSIDIARIES
(in millions of EUR) VAR1 interestrate activities
VAR1 forexactivities
Scenario analysis,KBC Financial Products2
Scenarioanalysis, KBC
Securities2Brussels Other
Average,1st quarter 2001
16.6 1.6 22.6 22.4 10.3
Average,2nd quarter 2001
20.9 1.5 8.2 18.9 6.8
Average,3rd quarter 2001
15.0 1.3 26.9 8.1
Average,4th quarter 2001
16.6 1.8 15.7 8.5
End of 2001 21.6 1.1 36.7 7.7Maximum in 2001 25.8 4.0 40.0 20.2Minimum in 2001 9.9 0.3 2.0 2.1
1 VAR: Value-at-Risk (99% confidence interval, 10-day holding period).2 In mid-2001, the method of calculation used for the specialized equity subsidiaries was changed, which led to a ‘mechanical’
virtual doubling of the figures. Figures for the period prior to mid-2001 were increased by the same factor. Moreover, sincemid-2001, the limits and hence also the risk calculated have been combined for KBC FP Brussels and the rest of KBC FP.
Risk management
KBC Bank & Insurance Group − 2001 Annual Report
58
The ALM activities, in particular,benefited a good deal from thissituation, proving that, where KBCis concerned, the bank’s overallportfolio is quite well diversifiedand hence capable of withstandingrather extreme shocks on the finan-cial markets. The situation on themarkets also revealed that KBC’smeasurement techniques are highlysatisfactory for mapping out risks,even under stress conditions.
The table opposite shows theValue-at-Risk for the bank’s dealingrooms on the money and capitalmarkets and the results of thescenario analysis for KBC FinancialProducts and KBC Securities.
DerivativesSee explanatory note 36:‘Off-balance-sheet headings’.
Liquidity riskLiquidity risk relates to the loss thebank might incur if it is no longerable to fund its ordinary activities atacceptable terms.First of all, KBC Bank is able tolimit its liquidity risk thanks to itsstable and broad customer base andwidespread international reputa-tion. KBC Bank funds its activitiesacross a broad range of maturities,currencies, target groups, countries,instruments and intermediary chan-nels. It is also cautious in calculat-ing core amounts used for bench-marking undated products: a largeproportion of the amounts available(15-20% of the assets on demandand savings accounts) are investedfor the very short term in order tocope with any sudden fund with-drawals by customers.
The increased concern on the partof regulators regarding liquidityrisk has prompted the bank tochange its tack where this risk isconcerned. It plans to start using anumber of liquidity ratios such as
those defined by the Financial Ser-vices Authority in the UK.This approach will subsequently berefined, based on in-house experi-ence.
RISK MANAGEMENT ATKBC INSURANCE
Risk governanceWith a view to achieving lastingvalue creation, KBC Insurance con-siders risk control to be an essentialcore activity.It has assembled a specialist teamfor this purpose − the Actuarial andRisk Management Department − tomonitor and set policy to controlrisks. It does so in consultationwith, inter alia, the Audit, Controland Compliance Department, offi-cers responsible for day-to-daymanagement, the auditors and theexternal supervisory authorities.
Investment risksThese include counterparty risk,liquidity risk and the market risksassociated with the investmentactivities inherent in the business ofinsurance.
OrganizationThe Actuarial and Risk Manage-ment Department is responsible forthe continuous monitoring of theinsurance group’s balance-sheetrisks and for advising the respectiveexecutive committees on the gen-eral investment strategy.
The insurance company’s liabilitiesare broken down into more or lesshomogeneous groups on the basisof a number of criteria (includingtype, maturity and interest raterisk). Valuation and ALM modelsare used to determine the optimalcomposition of the investment port-folio (the strategic mix) per group,based on risk/return considerations.These exercises are repeated annu-
ally and evaluated in the Asset/Liability Committee (ALCO),which advises the InvestmentsCommittee on changes to be madeto the strategic mix, and this com-mittee in turn contacts the execu-tive committees of the relevantcompanies.
The Investments Committee meetsevery three months and its mem-bers include representatives fromKBC Insurance and its subsidiaries,managing directors from KBCAsset Management and a numberof risk management and macroeco-nomics experts from KBC Bank andKBC Insurance. This committeealso handles tactical asset alloca-tion (within the confines of the stra-tegic framework set by the execu-tive committees) and the moni-toring of the operational invest-ment activities of KBC Asset Man-agement.
Investment guidelinesIn addition to the strategic guide-lines set per sub-portfolio, KBCInsurance also has a number ofgeneral investment guidelinesdesigned to ensure that the qualityof the investment portfolio remainssound. For instance, a number ofrestrictions are in effect, limitingand in some cases even prohibiting:j investment in bonds and shares
not listed on the more widelyrecognized exchanges;
j speculative forex transactions,speculative positions and lever-aging via derivatives;
j concentrations in the variousportfolios on a specific geograph-ical region or industry sector;
j investment in non-OECD gov-ernment bonds and bonds with alower than ‘AA’ rating;
j investment in subordinatedloans;
j investment in bonds and sharesthat cannot be sold within oneday at a minimum of loss.
Risk management
KBC Bank & Insurance Group − 2001 Annual Report
59
■ ■ ■ ■ ■ ■ ■ ■ ■ ■
Provision for financial risksIn order to cope with the risksattendant on holding positions inforeign currency, in securities or inother financial instruments, KBCInsurance has consistently set asidea fund for financial risks since 1999.This fund is topped up each yearuntil a certain required amount hasbeen reached. This varies, ofcourse, depending on the com-pany’s financial risk position.
Underwriting risksThe technical or underwriting risksinclude tariffication and acceptancerisk, the risk that the reserves willprove inadequate and the risk ofinsurance fraud.
Tarifficationand acceptance riskThe acceptance and tarifficationpolicy is based on the company’sown technical analyses and marketdata. This policy determines whatrisk and market combinations it isprepared to do business in and atwhat price it is prepared to acceptthe relevant risks. In order to cur-tail exposures even further, it alsodraws up an adequate reinsurancepolicy.
When accepting an insurance risk,KBC Insurance not only takesaccount of its own internal rulesgoverning acceptance, but also ofexternal regulations, such as anti-money-laundering legislation.
KBC Insurance calls on two super-visory bodies to check its accept-ance and tariffication policy.A certifying actuary uses technicalanalyses and models to determinewhether the company is able tomaintain underwriting equilibrium.In addition, the Audit, Control andCompliance Department ensuresthat acceptance and pricing meetall the relevant guidelines.
j Non-life businessOne of the prerequisites for assess-ing a specific risk correctly and set-ting an appropriate price, is to haveaccess to all the relevent informa-tion, and this is where the agentand the bank branch have animportant role to play, since theyare closest to the prospective pol-icyholder. To support the accept-ance and pricing process of itsintermediaries, KBC Insurance alsomakes available to them a wholearray of instruments such as prod-uct guides, describing the kind ofinformation that is needed andwhat selection criteria the proposedrisks have to meet.
For a number of standard risks,sales staff use an online acceptancesystem that checks whether the pro-posed risk meets the specifiedacceptance criteria and then calcu-lates the premium. If the outcomeof the evaluation is positive,the policy can be signed straight-away. If the outcome is negative,the policy will not be producedautomatically. Instead, the data willbe sent to the policy departments ofKBC Insurance for appropriateacceptance and pricing. Non-stand-ard risks must also be processed viathe policy departments of KBCInsurance for acceptance.This process is carried out viadecentralized provincial offices forprivate persons and small busi-nesses and via specialized depart-ments at Head Office where largecompanies and specific risks areconcerned. In addition, KBC Insur-ance has a mobile team of special-ists that provide support to thecommercial network.
Absolutely essential, over andabove sound acceptance practices,is the constant monitoring of theactuarial return on the insuranceportfolio. For this purpose, KBCInsurance uses a business-economic
model to evaluate the profitabilityof insurance activities on an annualbasis and, by means of portfoliomonitoring, the quality and homo-geneity of the portfolio isenhanced. Moreover, an analysiscarried out per point of sale enablesKBC Insurance to pinpoint distri-bution outlets whose technicalresults might be improved upon.Using the information stored in anumber of data warehouses, everyproduct officer also tracks the prof-itability of the products for whichhe or she is responsible and willsuggest possible improvements.
j Medical acceptancein the life business
Where death, sickness and disabil-ity risks are concerned, the priormedical screening of the insured isnecessary to preclude ‘anti-selec-tion’ and to price higher risks prop-erly. Anti-selection has to do withthe phenomenon of higher-riskindividuals being more inclined totake out insurance, while prices arebased on the ‘average’ population.Consequently, medical acceptanceis a process designed to keep theportfolio from becoming unbal-anced.In certain, exceptional cases, theprocess of acceptance will result ina person being refused insurance.Generally, however, higher risksare ‘normalized’ by charging ahigher premium or taking measuresto curtail risk.
Risks are assessed on the basis ofstatistical information obtained pri-marily from international studiesconducted by reinsurers. Obtainingmedical information on prospectivepolicyholders is of course a verydelicate matter, and is conductedentirely in line with the rules ofprofessional secrecy observed in themedical profession and with privacylegislation. The data is assessed
Risk management
KBC Bank & Insurance Group − 2001 Annual Report
60
exclusively by special, medicallytrained personnel.
Adequacy of technicalprovisionsNon-life business: To determinehow extensive the technical provi-sions should be, systematic andindividualized loss assessment iscarried out. Specialist claims man-agers for each class of non-lifeinsurance, assisted by technical,legal and medical advisers, ensurethat these assessments are con-stantly updated. An automatedmonitoring and reporting systemensures that claims managers − forall their claims files − are advisedautomatically at certain intervals ofthe need to update provisions.Life business: For years now, a pol-icy has been pursued that takesaccount of the potentially adverseconsequences of a decline in inter-est rates. Sizeable supplementaryreserves have already been built up,primarily for those products thatare most susceptible to interest raterisk. For instance, technical provi-sions for products with a guaran-teed rate of interest of 4.75% arecalculated at a rate of 4%. In add-ition, supplementary provisionshave been accumulated progres-sively under the ‘flashing lights’ sys-tem since 2000. This systemrequires insurance companies to setaside extra provisions if the guaran-teed interest rate on a contractexceeds the ‘flashing light’ thresh-old by more than 0.1% (this thresh-old is equal to 80% of the averageinterest rate over the past five yearson 10-year linear bonds).Senescence reserves: Senescencereserves are set aside for healthproducts contracted without a riskpremium. To determine how exten-sive these reserves should be,account is taken of the increase inthe risk attendant on the increase inage of the insured.
Reinsurance provisions: Provisionsfor outstanding accepted reinsur-ance contracts are estimated on acase-by-case basis. The provisionsfor claims for the current year areestimated on the basis of theexpected technical results. The pro-visions for claims of earlier yearsare based on the estimates of thecompanies having the riskreinsured. For all these estimates,KBC Insurance takes a conservativeapproach and explicitly takesaccount of extraordinary loss devel-opments and changes in interestrates. If KBC Insurance expects acontract to result in a claim due tothe nature of the risk, such as liabil-ity insurance, additional reservesare set aside for claims incurred,but not yet reported.
Serious accidents andcatastrophesReinsurance programme: Theinsurance portfolios are protectedagainst the impact of serious claimsby means of reinsurance. Reinsur-ance is taken out in close collabor-ation with Secura, the reinsurancesubsidiary of KBC Insurance, whichacts primarily as a consultant in thisregard.
The reinsurance programmes aredivided up into three main groups:property insurance, accident insur-ance and life assurance, which areall re-evaluated and renegotiatedevery year. In 2001, negotiationsfocused on catastrophes in theproperty damage programme.
Most of the reinsurance contractsare concluded on a non-propor-tional basis, which provides coveragainst the impact of major claimsor loss events. Where necessary, thegeneral or ‘treaty’ reinsurance pro-gramme is supplemented by facul-tative contracts, i.e. reinsurancecontracts for individual risks.
In 1993, KBC Insurance set up acaptive reinsurance company inLuxemburg called Lucare.Equalization provision: The insur-ance companies in the KBC Insur-ance Group set aside equalizationprovisions according to the guide-lines laid down by their respectivesupervisory bodies.
Claims controland anti-fraud measuresClaims are handled quickly andefficiently via the ‘KBC Call Center24+’ or insurance agents using thedirect claims settlement procedure.Other claims not qualifying forsettlement via this procedure arehandled by claims managers in theregional offices of KBC Insurance,who will appoint loss adjusters ifnecessary. Serious accidents or acci-dents for which specific know-howis required are handled at the Cen-tral Claim Settlement Department.
The activities of the internal lossadjusters and external advisers aremonitored via a system the com-pany developed in-house, which notonly checks turnaround times andcosts, but the quality of the workperformed, as well. The work doneby approved garages is also super-vised closely. Lastly, a good deal ofattention is paid to assisting newloss adjusters, who are assigned anin-house claims co-ordinator astheir personal coach.
All the internal claims departmentsand loss adjusters are provided witha list of ‘flashing lights’ for detect-ing possible cases of fraud. Anyindications of possible fraud turnedup by this means are looked into byspecialists who may call on theAnti-Fraud Unit for assistance.This unit also conducts an activeanti-fraud policy. Additionally, thecompany has introduced the requis-ite procedures for disbursements in
Risk management
KBC Bank & Insurance Group − 2001 Annual Report
61
■ ■ ■ ■ ■ ■ ■ ■ ■ ■
the life business, in compliance withanti-money-laundering legislation.
Lastly, mention should be made ofthe system KBC Insurance uses forthe continuous, random checking ofclaims files. This serves as a tool toadjust and monitor the claims hand-ling process. Depending on what itturns up, changes may be made tothe claims-handling process orother corrective measures taken,such as the introduction of appro-priate training programmes for in-house staff. The Audit, Control andCompliance Division superviseswhether the random checking iscarried out properly and whetherclaims are handled correctly.
Value managementIn late 1999, the Actuarial and RiskManagement Department starteddeveloping an environment that willmake it possible to measure KBCInsurance’s growth in terms ofvalue creation.
Priority was given to life assuranceproducts and by mid-2001, approxi-mately 91% (in terms of premiumincome) of KBC Insurance NV’slife portfolio had been integratedinto a valuation model. At thatpoint, the ‘embedded value’ of KBCInsurance was analyzed for the firsttime, and an estimate made of howmuch value had been created in2000 and what underlying factorsand activities had created ordestroyed value.
In 2002, the KBC valuation modelwill be introduced in the maininsurance subsidiaries, so that by
the end of the year, a consolidatedoverview of how KBC Insurance’svalue has developed can be madepublic.
OPERATIONAL RISKS
Operational risk is the chance ofincurring a loss as a result of inad-equacies or shortcomings in proce-dures or systems, human error oroutside events.
In view of the importance that theGroup attaches to controlling oper-ational risks, there are various en-tities and persons in the Group whoassist management in developing aneffective and efficient system ofinternal controls. These include thebank and the insurer’s internalaudit departments, but also specificindividuals such as the securityofficer, who is responsible forimplementing guidelines on infor-mation security. In addition, vari-ous projects have recently beenlaunched to give further shape tooperational risk management andto develop our capabilities in thisregard (see below).
Internal Control PolicyManualIn 2001, KBC finished its InternalControl Policy Manual, which setsout the best practices for managingprocess-related risks for virtually allthe Group’s banking and supportactivities (such as accounting, ICTand human resources manage-ment). A start was made on anInternal Control Policy Manual for
the insurance business as well, andit should be completed in 2002.
The control policies were drawn upprimarily by line management,which bears primary responsibilityfor sound operational risk manage-ment.
Per business area, one member ofsenior management staff is assignedresponsibility for the contents andupdates of the control policies(based on discussions with col-leagues, events that occur in thegroup or sector or changes in thebest practices themselves). Linemanagement selects the practicesrelevant to their area of activity andchecks, on the basis of self-evalu-ations, whether these practices arebeing observed. If need be, anaction plan will be drawn up. TheAudit Division assesses the qualityof these self-evaluations, conductsrandom checks and helps supervisethe timely implementation of actionplans.
Risk identification andmeasurement pilot projectA method was developed via a pilotproject conducted by a bank subsid-iary together with an outside con-sultant for identifying and assessingrisks in a structured way.
This led to, inter alia:j a system being devised for cat-
egorizing risks according to theircause and the nature of any inci-dents;
j a numerical measurement systembeing developed for assessingoperational risks (account taken
Risk management
KBC Bank & Insurance Group − 2001 Annual Report
62
of their frequency and financialimpact), which can be used to settolerance limits based on thefinancial strength of the entityconcerned;
j a process-based approach beingtaken to ordinary operationalrisks (with a high frequency andlow impact), whereby processdefinitions and classificationsallow risks and other data to bepinpointed in a transparent wayand facilitate comparisonsbetween entities;
j an approach being drawn up forbusiness risk (e.g., changes inmarket conditions) and a numberof major specific risks (such asfraud);
j a number of specialist teamsbeing set up (for processes, legis-lation, matters related to tax-ation and auditing). These teamsare under the direction of theRisk Management Division andare responsible for defining riskscenarios, identifying risks, com-ing up with risk-assessment pro-cedures, defining appropriatecontrol structures (via oper-ational controls or insuringagainst risks) that are in line withthe above-mentioned InternalControl Policy Manual anddeveloping risk and control indi-cators for the most critical risks.Fully in line with control policy,reports prepared by these teamsare presented for approval to the
competent member of seniormanagement. Line managementsubsequently conducts a risk- andcontrol-oriented self-evaluationon the basis of these reports.
Further developmentsin 2002Investments will continue to bemade in operational risk manage-ment in 2002, both in expanding itsscope and in deepening its reach.
Operational risk management willbe incorporated into integrated riskmanagement and into the new riskgovernance structures referred to atthe start of this section. ‘Operation-al risk equity’ will be embedded inprofitability calculations and vari-ous incentives will be devised toelicit the pro-active involvement ofline management in this matter.
In 2001, KBC Bank started system-atically recording data on oper-ational losses in a central database.This database will continue to beenhanced in the course of 2002 interms of content, functionality andgeographic scope. At the sametime, a refined risk classificationand process specification systemwill be integrated and the link withaccounting assured.By this means, the bank aims toconform to the Basel-2 guidelines,more particularly by implementingthe ‘Advanced Measurement
Approach’ to calculate the chargeagainst capital.
COMPLIANCE
Specialist and independent depart-ments are responsible for carryingout the compliance function at thebank, the insurance company andthe subsidiaries and branches inBelgium and abroad, overseeingcompliance with specific legislation(e.g., on money-laundering), exam-ining cases of fraud and insidertrading, and drafting, communicat-ing and monitoring compliance withinternal instructions and rules ofethics, etc. The compliance depart-ments at KBC Bank and KBCInsurance co-ordinate the compli-ance functions in the foreign anddomestic branches and subsidiaries.
Both departments co-operateactively on matters of import to thetwo companies which require thedrafting of uniform policies andguidelines, and an overarching‘Compliance Committee’ ensuresthat the Group takes a uniformapproach to these matters.In November 2001, for example,a ‘Code of conduct for the KBCGroup governing the use of meansof communication’ was publishedand distributed to all members ofpersonnel.
Risk management
KBC Bank & Insurance Group − 2001 Annual Report
63
■ ■ ■ ■ ■ ■ ■ ■ ■ ■
Personnel
■ ■ ■ KBC’S AIM IS TO IMPLEMENT STAFF-FRIENDLY POLICIES THAT
ENCOURAGE CUSTOMER-MINDEDNESS, EFFICIENCY, AN
ENTERPRISING SPIRIT AND A CAPACITY FOR INNOVATION. ■ ■ ■
PERSONNEL POLICY
Employee satisfactionUndoubtedly, KBC’s most impor-tant resource is and remains itsemployees, whose commitment,motivation and determination arethe driving forces behind much ofthe Group’s success. Consequently,employee satisfaction will continueto be a main concern. The findingsof the employee satisfaction surveycarried out in 2000 led to a varietyof initiatives being taken in 2001.These included:j providing training courses on
leadership skills and changemanagement;
j devoting more attention tocareer guidance;
j offering more flexible workingarrangements at head office;
j improving in-house communica-tion to allow the uninterruptedflow of all available informationto members of staff via in-housechannels.
KBC has also ensured that itsemployees benefit from the resultsof their efforts by, inter alia:j giving them the opportunity to
subscribe to a capital increasereserved for staff;
j launching a stock option plan in2001 (following the general stockoption plan in 2000) for the best-performing 10% of its workforce.Around 94% of these optionswere accepted;
j awarding an annual profit-shar-ing bonus to KBC Bank employ-ees.
Negotiations with the socialpartnersFollowing the multi-sector agree-ment at the end of 2000, the bank-ing sector concluded another agree-ment in 2001 for the continuedimplementation and clarification ofa number of provisions. KBC Bankalso:j reached agreement with the
employees’ representatives on anumber of issues, including thepostponement of the 4/4.5-dayworking week in the mergerbranches until after the extrawork caused by the merger andthe integration of the IT plat-forms has been completed;
j carried out a survey intoemployee stress, in implementa-tion of the banking sector’s Col-lective Labour Agreement(CLA) of 9 December 1999; the
results of this survey will be pub-lished in the Spring of 2002;
j signed an agreement with theunions to start a pilot project athead office for alternate workweeks of four and five days forcertain employees;
j negotiated a new Social Planwith the unions, which contains anumber of fundamental changes(e.g., the possibilities to takeearly retirement are limited,given the low participation rateof those above 50 on the labourmarket). However, additionalfacilities were created to enablepeople in this age category towork part-time and receive anallowance until they reach pen-sionable age.
In implementation of the insurancesector’s CLA, negotiations werebrought to a successful conclusionin November 2001 on the organiza-tion and new forms of work at KBCInsurance. This led to agreementson relaxing the flexi-time system,extending the ‘time saving’ scheme,and on conditions governing newforms of work.
In order to integrate a number ofthe KBC Group’s support services,some bank and insurance companydepartments will be incorporatedinto the holding company’s cost-sharing structure from 1 January2002. To ensure the smooth transferof some 2 000 employees, an agree-ment governing their employmentconditions was concluded with theunions.
TrainingA variety of new training initiativeswere taken in 2001. For instance,KBC Insurance acted on the recom-mendations that came out of amanagement study conducted by an
Personnel
KBC Bank & Insurance Group − 2001 Annual Report
64
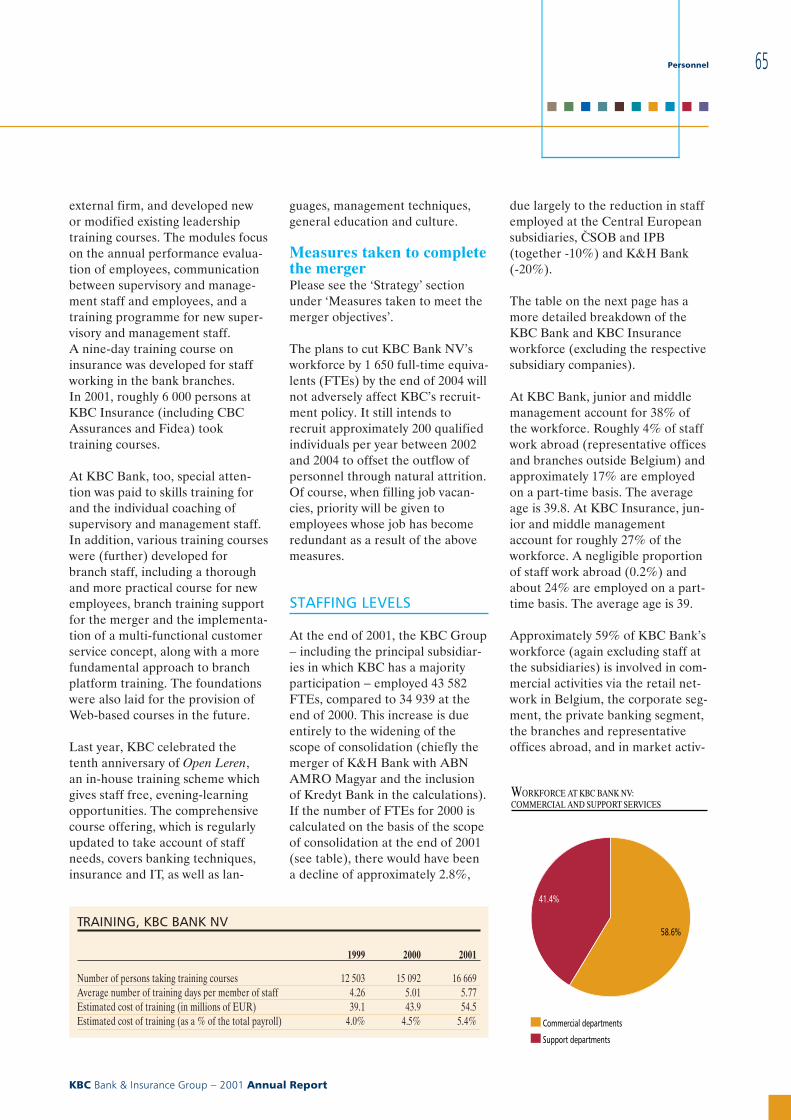
external firm, and developed newor modified existing leadershiptraining courses. The modules focuson the annual performance evalua-tion of employees, communicationbetween supervisory and manage-ment staff and employees, and atraining programme for new super-visory and management staff.A nine-day training course oninsurance was developed for staffworking in the bank branches.In 2001, roughly 6 000 persons atKBC Insurance (including CBCAssurances and Fidea) tooktraining courses.
At KBC Bank, too, special atten-tion was paid to skills training forand the individual coaching ofsupervisory and management staff.In addition, various training courseswere (further) developed forbranch staff, including a thoroughand more practical course for newemployees, branch training supportfor the merger and the implementa-tion of a multi-functional customerservice concept, along with a morefundamental approach to branchplatform training. The foundationswere also laid for the provision ofWeb-based courses in the future.
Last year, KBC celebrated thetenth anniversary of Open Leren,an in-house training scheme whichgives staff free, evening-learningopportunities. The comprehensivecourse offering, which is regularlyupdated to take account of staffneeds, covers banking techniques,insurance and IT, as well as lan-
guages, management techniques,general education and culture.
Measures taken to completethe mergerPlease see the ‘Strategy’ sectionunder ‘Measures taken to meet themerger objectives’.
The plans to cut KBC Bank NV’sworkforce by 1 650 full-time equiva-lents (FTEs) by the end of 2004 willnot adversely affect KBC’s recruit-ment policy. It still intends torecruit approximately 200 qualifiedindividuals per year between 2002and 2004 to offset the outflow ofpersonnel through natural attrition.Of course, when filling job vacan-cies, priority will be given toemployees whose job has becomeredundant as a result of the abovemeasures.
STAFFING LEVELS
At the end of 2001, the KBC Group− including the principal subsidiar-ies in which KBC has a majorityparticipation − employed 43 582FTEs, compared to 34 939 at theend of 2000. This increase is dueentirely to the widening of thescope of consolidation (chiefly themerger of K&H Bank with ABNAMRO Magyar and the inclusionof Kredyt Bank in the calculations).If the number of FTEs for 2000 iscalculated on the basis of the scopeof consolidation at the end of 2001(see table), there would have beena decline of approximately 2.8%,
due largely to the reduction in staffemployed at the Central Europeansubsidiaries, C{SOB and IPB(together -10%) and K&H Bank(-20%).
The table on the next page has amore detailed breakdown of theKBC Bank and KBC Insuranceworkforce (excluding the respectivesubsidiary companies).
At KBC Bank, junior and middlemanagement account for 38% ofthe workforce. Roughly 4% of staffwork abroad (representative officesand branches outside Belgium) andapproximately 17% are employedon a part-time basis. The averageage is 39.8. At KBC Insurance, jun-ior and middle managementaccount for roughly 27% of theworkforce. A negligible proportionof staff work abroad (0.2%) andabout 24% are employed on a part-time basis. The average age is 39.
Approximately 59% of KBC Bank’sworkforce (again excluding staff atthe subsidiaries) is involved in com-mercial activities via the retail net-work in Belgium, the corporate seg-ment, the private banking segment,the branches and representativeoffices abroad, and in market activ-
TRAINING, KBC BANK NV
1999 2000 2001
Number of persons taking training courses 12 503 15 092 16 669Average number of training days per member of staff 4.26 5.01 5.77Estimated cost of training (in millions of EUR) 39.1 43.9 54.5Estimated cost of training (as a % of the total payroll) 4.0% 4.5% 5.4%
WORKFORCE AT KBC BANK NV:COMMERCIAL AND SUPPORT SERVICES
Commercial departments
Support departments
58.6%
41.4%
Personnel
KBC Bank & Insurance Group − 2001 Annual Report
65
■ ■ ■ ■ ■ ■ ■ ■ ■ ■
ities. The rest of the workforce isresponsible for product and servicedevelopment and administration(mainly for credits and paymenttransactions), for the developmentand operation of the IT systems,and for general support services(risk management, accounting, staffservices, personnel department,facility management).
NUMBER OF STAFF
in FTEs1 FTEs,31-12-2000(based on
scope of con-solidation,
2000)
FTEs,31-12-2000(based on
scope of con-solidation,
2001)
FTEs,31-12-2001
Change(based on
scope of con-solidation,
2001)
Total 34 939 44 854 43 582 -2.8%
Breakdown by activityBanking 31 613 41 528 40 168 -3.3%Insurance 3 033 3 033 3 105 2.4%Holding-company activities2 292 292 310 5.8%Total 34 939 44 854 43 582 -2.8%
Breakdown by country/regionBelgium 20 365 20 367 20 723 1.7%Central Europe 12 311 22 125 20 442 -7.6%Rest of the world 2 264 2 363 2 418 2.3%Total 34 939 44 854 43 582 -2.8%
1 KBC Bank, KBC Insurance and the KBC holding company, including the principal subsidiaries in which they have a majo-rity participation on 31 December 2001. The distribution network has not been included where the insurance companies areconcerned. The figures for C{SOB and IPB are on a company basis.
2 These activities also include KBC Asset Management.
WORKFORCE DETAILS, KBC BANK AND KBC INSURANCE
Number of staff, 31-12-2001 KBC Bank NV KBC Insurance NVNumber % of total Number % of total
Senior management 151 0.9% 42 1.9%Junior and middle management 6 295 38.4% 604 27.2%White- and blue-collar staff 9 953 60.7% 1 575 70.9%
Permanent 15 988 97.5% 2 103 94.7%Temporary 411 2.5% 118 5.3%
Active 15 570 94.9% 2 012 90.6%Non-active 829 5.1% 209 9.4%
Belgium 15 741 96.0% 2 216 99.8%Abroad 658 4.0% 5 0.2%
Men 9 067 55.3% 984 44.3%Women 7 332 44.7% 1 237 55.7%
100% 13 662 83.3% 1 676 75.5%80%-100% 1 463 8.9% 292 13.1%< 80% 1 274 7.8% 253 11.4%
Total 16 399 100.0% 2 221 100.0%Total, in FTEs 15 597 - 2 040 -
Personnel
KBC Bank & Insurance Group − 2001 Annual Report
66
Group structure andcorporate governance
GROUP STRUCTURE
As a financial holding company, theKBC Bank and Insurance HoldingCompany NV co-ordinates theactivities of KBC Bank NV, KBCInsurance NV and KBC Asset Man-agement NV. Within this groupstructure, the various tasks andresponsibilities have been dividedup as set out below.
j KBC Bank and InsuranceHolding Company
The KBC Bank and InsuranceHolding Company is an activeshareholder. This means that it isresponsible for the general strategyof the Group, the allocation of cap-ital, the profitability requirements,the Group’s major strategic invest-ments, the extent and managementof risks in the broad sense, and gen-eral ALM policy. Furthermore, itsupervises the coherence of thebudgets and profit planning of thebanking and insurance subsidiaries,besides being responsible for theaudit function at the co-ordinatinglevel.
The holding company also acts asthe driving force in the integrationof the banking and insurance sub-sidiaries. Apart from encouragingthe establishment of a number ofcommittees for consultationbetween the two subsidiaries, itintervenes specifically in respect of:j the appointments policy:
whereby it formulates a unani-mous opinion regarding theappointment of the directors and
general managers of the two sub-sidiaries;
j the remuneration policy:whereby it takes an active part inharmonizing the two subsidiaries’remuneration systems for theirdirectors and general managers.
As a bancassurance group, it isKBC’s aim to integrate certainbanking and insurance services asmuch as possible. Consequently, on1 January 2002, a number of sharedsupport services − primarily mar-keting, communication, logisticsand IT − were transferred to theKBC Bank and Insurance HoldingCompany. The staff working inthese services are employed by theKBC Bank and Insurance HoldingCompany on behalf of the entireKBC Group. By means of a cost-sharing structure, the expense ofthese shared services will be allo-cated according to objective criteriaamongst KBC Bank, KBC Insur-ance and other group companies.
j KBC BankKBC Bank has competence in allmatters specific to the bankingbusiness, namely:j all bank-related matters, such as
the lending function, the securi-ties business, corporate andinvestment banking activities,and dealing room activities;
j the internal organization andsupervision of these bank-relatedmatters, including risk manage-ment, the audit and compliancefunction, information technol-ogy, control and accounting,
human resources policy (withoutprejudice to the above-men-tioned role of the holding com-pany as regards appointmentsand remuneration) and logisticsupport;
j the drafting and implementationof commercial policy within thestrategic framework defined bythe holding company.
j KBC InsuranceKBC Insurance has competence inall matters specific to the insurancebusiness, namely:j all insurance-related matters,
particularly all those inherent inthe underwriting policy, such asthe pricing and acceptance ofinsurance, the claims-handlingpolicy, the investment policy andthe appropriation of the resultwith a view to enabling the insur-ance company to build up thecapital required in business-eco-nomic terms;
j the internal organization andsupervision of these insurance-related matters, including profit-ability management (e.g., theprofitability of the insurancebusiness and of insurance prod-ucts), financial management(whereby account is taken of,among other things, the statutoryinvestment requirements), pro-tection of the rights of theinsured and beneficiaries, theaudit and compliance function,information technology, controland accounting, human resourcespolicy (with the exception of theabove-mentioned role of the
Group structure and corporate governance
KBC Bank & Insurance Group − 2001 Annual Report
67
■ ■ ■ ■ ■ ■ ■ ■ ■ ■
holding company as regardsappointments and remuneration)and logistic support;
j the drafting and implementationof commercial policy within thestrategic framework defined bythe holding company.
j KBC Bank and KBC InsuranceKBC Bank and KBC Insurance areempowered to delegate specificresponsibilities to mixed commit-tees (management committees) onwhich representatives of the insur-ance company and banking subsid-iary sit. However, the insurancecompany and the bank remainresponsible for any such delegation.
These management committeeswere set up during the 2000 finan-cial year for the business areas ofretail and private bancassurance,corporate services, market activi-ties, asset management and CentralEurope.
j KBC Asset ManagementOn 1 June 2000, KBC Bank’s col-lective and individual asset manage-ment activities were spun off and −following a capital increase whichwas subscribed to by the KBC Bankand Insurance Holding Company −transferred to a subsidiary of theholding company.With this move, KBC stressed theindependent nature of asset man-agement and demonstrated theconsiderable importance it attachesto this area of activity, which is partof both the banking and insurancebusiness.
CORPORATE GOVERNANCE
1 Management structureThe management structure of theKBC Bank and Insurance HoldingCompany is based on a distinctionbetween:j the determination of general
strategy, the supervision of man-agement, and the exercise of thespecific powers laid down incompany law and the Articles ofAssociation, tasks that fall withinthe competence of the Board ofDirectors;
j the management of the holdingcompany, a task conductedautonomously by the ExecutiveCommittee, which is made up ofmanaging directors and actswithin the framework of the gen-eral strategy defined by theBoard of Directors.
This dual management structure isset out in the Articles of Associa-tion, in the agreement on theautonomy of the banking businessconcluded among the KBC Bankand Insurance Holding Company,KBC Bank and the Belgian Bankingand Finance Commission, and inthe matching agreement on theautonomy of the insurance businessconcluded by the KBC Bank andInsurance Holding Company, KBCInsurance and the Belgian Insur-ance Supervisory Authority.
2 Board of DirectorsThe Board of DirectorsThe Board of Directors of the KBCBank and Insurance Holding Com-pany consists of twenty-six1 mem-bers appointed by the general meet-ing of shareholders. In addition tothe managing directors whotogether constitute the ExecutiveCommittee, representatives of theprincipal shareholders and inde-pendent directors have a seat onthis Board.
The Articles of Association stipu-late that the term of office of direc-tors may not exceed six years andwill expire after the annual generalmeeting. Directors leaving officeare eligible for re-election by thegeneral meeting. An age limit of 70years is in force for non-executivedirectors and one of 65 years formanaging directors.
Proposals to appoint non-executivedirectors have to be submitted tothe Board of Directors by theAgenda Committee that acts in thismatter as an appointments commit-tee. When appointing directors andrenewing their terms of office, con-sideration is given to creating a bal-ance between a knowledge of bank-ing and insurance, the interests ofthe shareholders and external man-agement expertise.
No legal persons hold the office ofdirector.
The Board of Directors has agreater number of members thanrecommended by Euronext Brusselsand the Belgian Banking andFinance Commission as regardscorporate governance, because theeleven members of the ExecutiveCommittee also have a seat on theBoard and because, both in theabove-mentioned agreements onthe autonomy of the banking andinsurance businesses and in the cor-porate governance recommenda-tions, it is stipulated that the Boardmust have a majority of non-execu-tive directors serving on it.
1 Three members will step down at theGeneral Meeting of Shareholders in April2002.
Group structure and corporate governance
KBC Bank & Insurance Group − 2001 Annual Report
68
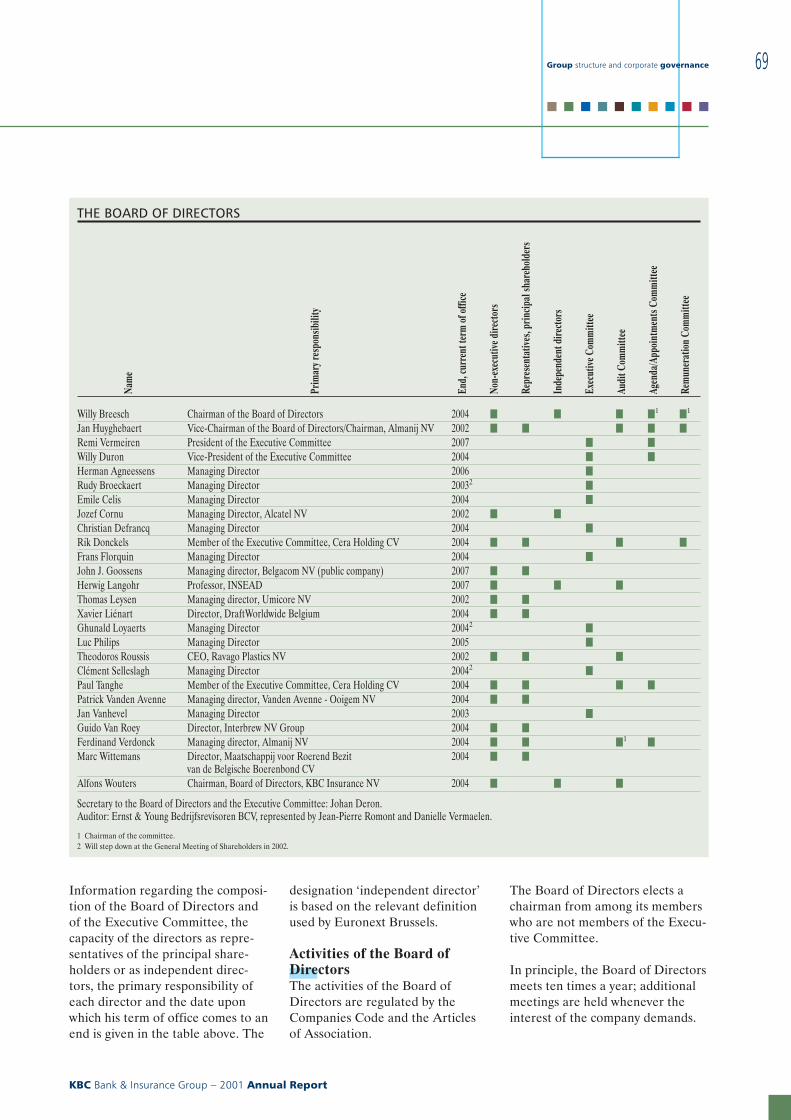
Information regarding the composi-tion of the Board of Directors andof the Executive Committee, thecapacity of the directors as repre-sentatives of the principal share-holders or as independent direc-tors, the primary responsibility ofeach director and the date uponwhich his term of office comes to anend is given in the table above. The
designation ‘independent director’is based on the relevant definitionused by Euronext Brussels.
Activities of the Board ofDirectorsThe activities of the Board ofDirectors are regulated by theCompanies Code and the Articlesof Association.
The Board of Directors elects achairman from among its memberswho are not members of the Execu-tive Committee.
In principle, the Board of Directorsmeets ten times a year; additionalmeetings are held whenever theinterest of the company demands.
THE BOARD OF DIRECTORS
Nam
e
Prim
aryr
espo
nsib
ility
End,
curr
entt
erm
ofof
fice
Non-
exec
utive
dire
ctor
s
Repr
esen
tativ
es,p
rincip
alsh
areh
olde
rs
Inde
pend
entd
irect
ors
Exec
utive
Com
mitt
ee
Audi
tCom
mitt
ee
Agen
da/A
ppoi
ntm
ents
Com
mitt
ee
Rem
uner
atio
nCo
mm
ittee
Willy Breesch Chairman of the Board of Directors 2004 m m m m1
m1
Jan Huyghebaert Vice-Chairman of the Board of Directors/Chairman, Almanij NV 2002 m m m m m
Remi Vermeiren President of the Executive Committee 2007 m m
Willy Duron Vice-President of the Executive Committee 2004 m m
Herman Agneessens Managing Director 2006 m
Rudy Broeckaert Managing Director 20032m
Emile Celis Managing Director 2004 m
Jozef Cornu Managing Director, Alcatel NV 2002 m m
Christian Defrancq Managing Director 2004 m
Rik Donckels Member of the Executive Committee, Cera Holding CV 2004 m m m m
Frans Florquin Managing Director 2004 m
John J. Goossens Managing director, Belgacom NV (public company) 2007 m m
Herwig Langohr Professor, INSEAD 2007 m m m
Thomas Leysen Managing director, Umicore NV 2002 m m
Xavier Liénart Director, DraftWorldwide Belgium 2004 m m
Ghunald Loyaerts Managing Director 20042m
Luc Philips Managing Director 2005 m
Theodoros Roussis CEO, Ravago Plastics NV 2002 m m m
Clément Selleslagh Managing Director 20042m
Paul Tanghe Member of the Executive Committee, Cera Holding CV 2004 m m m m
Patrick Vanden Avenne Managing director, Vanden Avenne - Ooigem NV 2004 m m
Jan Vanhevel Managing Director 2003 m
Guido Van Roey Director, Interbrew NV Group 2004 m m
Ferdinand Verdonck Managing director, Almanij NV 2004 m m m1
m
Marc Wittemans Director, Maatschappij voor Roerend Bezitvan de Belgische Boerenbond CV
2004 m m
Alfons Wouters Chairman, Board of Directors, KBC Insurance NV 2004 m m m
Secretary to the Board of Directors and the Executive Committee: Johan Deron.Auditor: Ernst & Young Bedrijfsrevisoren BCV, represented by Jean-Pierre Romont and Danielle Vermaelen.
1 Chairman of the committee.2 Will step down at the General Meeting of Shareholders in 2002.
Group structure and corporate governance
KBC Bank & Insurance Group − 2001 Annual Report
69
■ ■ ■ ■ ■ ■ ■ ■ ■ ■
Resolutions of the Board arepassed by a simple majority ofvotes; in the case of a tie-vote,the chairman of the meeting caststhe deciding vote. In practice,the Board acts collectively andresolutions are always passed byconsensus.Where the law allows, the resolu-tions of the Board may be passed byunanimous written agreement ofthe directors.
The Board of Directors has estab-lished a procedure, whereby allmemoranda explaining agendaitems have to be circulated toBoard members at least three daysprior to the meeting (unless this isimpracticable), so that, if they sodesire, they can gather additionalinformation from the Chairman ofthe Board or from members of theExecutive Committee prior to theBoard meeting.Directors will be briefed betweenmeetings if any important eventsoccur which affect the KBC Group.
Directors may, at the company’sexpense, seek the advice of an inde-pendent expert, if this initiative isapproved by a majority of non-executive directors on the basis of areasoned request.
Meetings of the Board in 2001The Board of Directors met twelvetimes in 2001. These meetings werealways attended by virtually allBoard members.
Besides carrying out the activitiesrequired under the CompaniesCode (such as preparing the consol-idated and non-consolidated annualfinancial statements and the annualreport for the 2000 financial year,setting the agenda for the annualgeneral meeting of shareholdersand proposing how profit should beappropriated), monitoring themonthly performance of KBC
Bank, KBC Insurance, KBC AssetManagement and their respectivesubsidiaries, preparing the quar-terly results and taking cognizanceof the activities of the Audit andRemuneration Committees, theBoard also dealt with the followingmatters:j the nomination of Ernst &
Young Bedrijfsrevisoren BCV asauditor for the company and theKBC Group;
j the main policy guidelines andimplications of the Basel CapitalAccord and of the accountingstandards drawn up by the Inter-national Accounting StandardsCommittee;
j the further expansion in CentralEurope (merger of C{SOB-IPB inthe Czech Republic, the mergerof K&H Bank and ABN AMROMagyar in Hungary, the capitalincrease and public bid forKredyt Bank shares in Poland);
j the consequences of the eventsof 11 September 2001 in NewYork for the banking and insur-ance activities of the KBCGroup;
j the structural measures taken byKBC Bank and KBC Insuranceregarding their organizationalstructure and staffing levels witha view to containing costs andachieving the merger objectives.
In addition, the Board of Directorslaid down the principles for capitalallocation within the KBC Group,approved the strategy proposed bythe Executive Committee regardingthe various areas of activity (retailand private bancassurance, marketactivities, asset management, cor-porate services and CentralEurope) and authorized the profitplans for financial year 2002.
Lastly, the Board of Directorsreviewed and approved the resolu-tions passed by the Board of Direc-tors of KBC Bank regarding those
persons (including the President ofthe Executive Committee) placedunder suspicion in the judicialinquiry into the Kredietbank SALuxembourgeoise and participationexemption (the so-called FBB-dos-sier) cases. KBC Bank will meet therelevant legal defence expenses andwill indemnify the persons con-cerned against financial liabilityensuing on any possible conviction.This indemnification is consistentwith the resolutions taken by theBoards of Directors of KBC Bankand the KBC Bank and InsuranceHolding Company in October 2000,whereby it was confirmed that theemployees who had been placedunder suspicion had the full sup-port and confidence of KBC. Thisposition was publicized in a pressrelease dated 10 October 2000.
Management supervisionIn order to permit the Board ofDirectors to fulfil its supervisorytask, the Executive Committeereports to it each month on thetrend of results at KBC Insuranceand KBC Bank. The Board moni-tors these results and checks themagainst the profit plan it hasapproved.
In addition, the Board keepsabreast of the general course ofbusiness at KBC Insurance, KBCBank and KBC Asset Management,as well as of all major events orprojects that have taken place sincethe previous Board meeting. TheBoard may also at any time requestfrom the Executive Committee orthe auditor special reports on allmatters that could have a materialimpact on the company. The Boardand its Chairman may require thatall useful information or documentsbe submitted to it and may have anyexaminations carried out.
Group structure and corporate governance
KBC Bank & Insurance Group − 2001 Annual Report
70
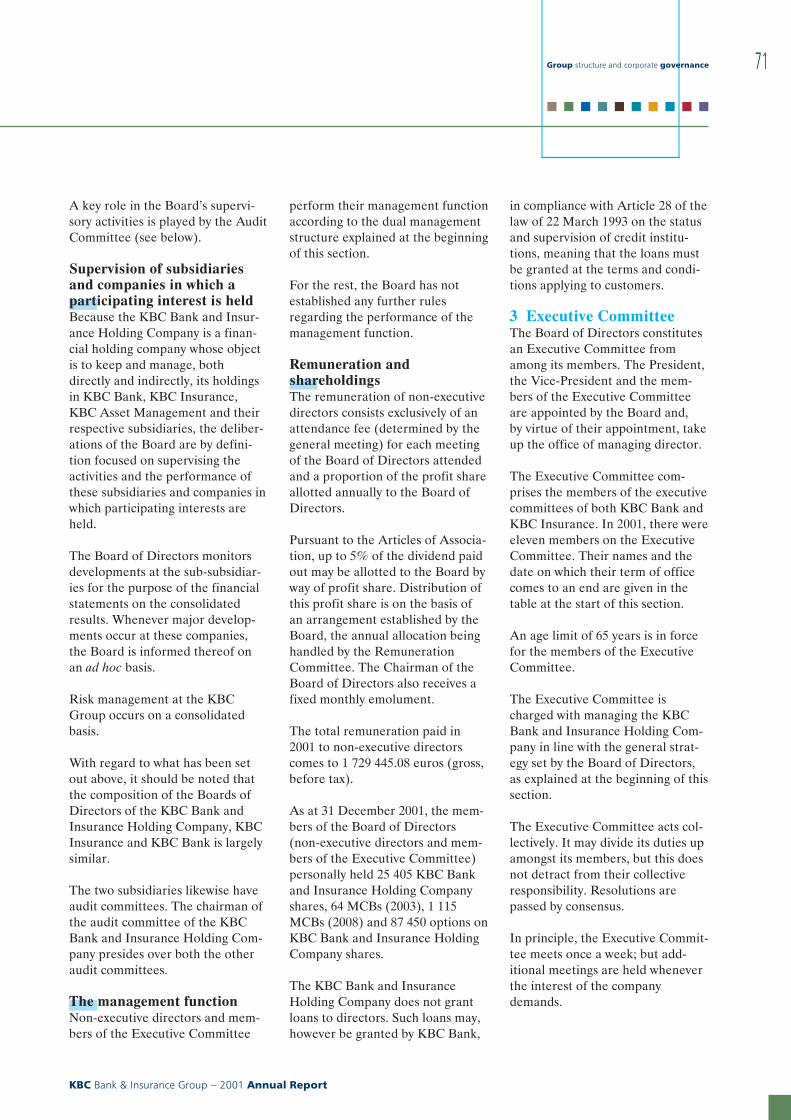
A key role in the Board’s supervi-sory activities is played by the AuditCommittee (see below).
Supervision of subsidiariesand companies in which aparticipating interest is heldBecause the KBC Bank and Insur-ance Holding Company is a finan-cial holding company whose objectis to keep and manage, bothdirectly and indirectly, its holdingsin KBC Bank, KBC Insurance,KBC Asset Management and theirrespective subsidiaries, the deliber-ations of the Board are by defini-tion focused on supervising theactivities and the performance ofthese subsidiaries and companies inwhich participating interests areheld.
The Board of Directors monitorsdevelopments at the sub-subsidiar-ies for the purpose of the financialstatements on the consolidatedresults. Whenever major develop-ments occur at these companies,the Board is informed thereof onan ad hoc basis.
Risk management at the KBCGroup occurs on a consolidatedbasis.
With regard to what has been setout above, it should be noted thatthe composition of the Boards ofDirectors of the KBC Bank andInsurance Holding Company, KBCInsurance and KBC Bank is largelysimilar.
The two subsidiaries likewise haveaudit committees. The chairman ofthe audit committee of the KBCBank and Insurance Holding Com-pany presides over both the otheraudit committees.
The management functionNon-executive directors and mem-bers of the Executive Committee
perform their management functionaccording to the dual managementstructure explained at the beginningof this section.
For the rest, the Board has notestablished any further rulesregarding the performance of themanagement function.
Remuneration andshareholdingsThe remuneration of non-executivedirectors consists exclusively of anattendance fee (determined by thegeneral meeting) for each meetingof the Board of Directors attendedand a proportion of the profit shareallotted annually to the Board ofDirectors.
Pursuant to the Articles of Associa-tion, up to 5% of the dividend paidout may be allotted to the Board byway of profit share. Distribution ofthis profit share is on the basis ofan arrangement established by theBoard, the annual allocation beinghandled by the RemunerationCommittee. The Chairman of theBoard of Directors also receives afixed monthly emolument.
The total remuneration paid in2001 to non-executive directorscomes to 1 729 445.08 euros (gross,before tax).
As at 31 December 2001, the mem-bers of the Board of Directors(non-executive directors and mem-bers of the Executive Committee)personally held 25 405 KBC Bankand Insurance Holding Companyshares, 64 MCBs (2003), 1 115MCBs (2008) and 87 450 options onKBC Bank and Insurance HoldingCompany shares.
The KBC Bank and InsuranceHolding Company does not grantloans to directors. Such loans may,however be granted by KBC Bank,
in compliance with Article 28 of thelaw of 22 March 1993 on the statusand supervision of credit institu-tions, meaning that the loans mustbe granted at the terms and condi-tions applying to customers.
3 Executive CommitteeThe Board of Directors constitutesan Executive Committee fromamong its members. The President,the Vice-President and the mem-bers of the Executive Committeeare appointed by the Board and,by virtue of their appointment, takeup the office of managing director.
The Executive Committee com-prises the members of the executivecommittees of both KBC Bank andKBC Insurance. In 2001, there wereeleven members on the ExecutiveCommittee. Their names and thedate on which their term of officecomes to an end are given in thetable at the start of this section.
An age limit of 65 years is in forcefor the members of the ExecutiveCommittee.
The Executive Committee ischarged with managing the KBCBank and Insurance Holding Com-pany in line with the general strat-egy set by the Board of Directors,as explained at the beginning of thissection.
The Executive Committee acts col-lectively. It may divide its duties upamongst its members, but this doesnot detract from their collectiveresponsibility. Resolutions arepassed by consensus.
In principle, the Executive Commit-tee meets once a week; but add-itional meetings are held wheneverthe interest of the companydemands.
Group structure and corporate governance
KBC Bank & Insurance Group − 2001 Annual Report
71
■ ■ ■ ■ ■ ■ ■ ■ ■ ■
The financial remuneration of themembers of the Executive Commit-tee, as well as the system of retire-ment and survivor’s pensions, isdetermined by the Board of Direc-tors, on the proposal of the Remu-neration Committee.
Members of the Executive Commit-tee are remunerated partly via afixed monthly emolument andpartly via a variable annual emolu-ment determined on the basis ofthe profit of the company. Theemoluments they receive in respectof the offices they hold in othercompanies are set off against theabove-mentioned remuneration.The total remuneration paid in2001 to members of the ExecutiveCommittee comes to 5 612 583.85euros (gross, before tax),1 521 266.20 euros of which waspaid as a variable emolument.Remuneration of the members ofthe Executive Committee ischarged to KBC Bank or KBCInsurance, depending on whichExecutive Committee the memberbelongs to.
4 Committees set up by theBoard of DirectorsTo carry out the preparatory workfor the activities of the Board ofDirectors and to support it in carry-ing out its duties, three ad hoc com-mittees have been establishedwithin it, the composition of whichis set out in the table at the begin-ning of this section.
j Agenda CommitteeThe Agenda Committee, headed bythe Chairman of the Board andconsisting of the President andVice-President of the ExecutiveCommittee and three non-executivedirectors, is responsible for prepar-ing the agenda and the matters fordeliberation by the Board. Thecommittee also acts as an appoint-ments committee, formulating pro-
posals regarding the appointmentof directors.
j Audit CommitteeThe Audit Committee consists ofeight2 non-executive directors,three of whom are independent.The fact that these last do not con-stitute a majority, as recommendedby Euronext Brussels is due to thedesire to have the composition ofthis committee reflect that of theBoard of Directors and largely cor-respond to that of the audit com-mittees of KBC Insurance and KBCBank.
The Audit Committee assists theBoard in the performance of itssupervisory task. Its remit consistsin ensuring compliance with legaland regulatory requirements, andwith the policy guidelines and pro-cedures approved by the Board ofDirectors, as well as in supervisingrisk control and internal controls.To this end, the Audit Committeeapproves the annual audit plan ofthe internal auditor, takes cogni-zance of the external auditor’s auditplan and discusses their reports.Reports from the Risk Manage-ment Division are also a fixed itemon its agenda, with briefings focus-ing on recent developments in mar-ket risk monitoring.The Audit Committee also reviewsthe drafts of the annual accountsand of the press releases on thequarterly results, prior to their sub-mission to the Board of Directorsfor approval. It may also subject toscrutiny any matter that falls withinits competence and to that end mayrequisition all relevant information.In 2001, the Audit Committeereviewed special reports on the fol-lowing topics, among others: thesecurities administration reconcilia-tion problem, loss reports, theEURO 2002 Project, inquiries bythe supervisory authorities and the
introduction of InternationalAccounting Standards.At the start of the year, the mem-bers of the Audit Committeeapproved the proposal made bythe Executive Committee and theBoard of Directors to appoint Ernst& Young Bedrijfsrevisoren BCV asstatutory auditor. The proposal wasinitially submitted by an AuditCommittee task force charged withanalyzing the bids of five auditingfirms.
Furthermore, it may consult exter-nal experts if a reasoned request tothat end is submitted by its chair-man and approved by the Board ofDirectors.
The Audit Committee meets fivetimes a year in the presence of thePresident of the Executive Commit-tee, the internal auditor, the offi-cers of the control and accountingdivisions of KBC Bank and KBCInsurance, and reports on the meet-ings to the Board. A number of itsmeetings, including those convenedto discuss the publication of theresults and the financial situation,are also attended by the statutoryauditor.
j Remuneration CommitteeThe Remuneration Committee con-sists of the Chairman of the Boardof Directors and two representa-tives of the principal shareholders.Within the bounds of the authoritydelegated by the Board, it deter-mines the remuneration of themembers of the Executive Commit-tee and prepares the decisions con-cerning the profit share awardedunder the Articles of Association tothe members of the Board.
The frequency of meetings is deter-mined on an ad hoc basis. The com-
2 Nine from 2002.
Group structure and corporate governance
KBC Bank & Insurance Group − 2001 Annual Report
72
mittee submits a report on its workannually to the Board.
5 Profit allocation policyIt is the intention of the Board ofDirectors to propose to the generalmeeting of shareholders thatapproximately 40% of the consoli-dated profit for the year be paid outin the form of dividends. Barringexceptional circumstances, this pol-icy will continue to be adhered to inthe future. Should the profit for theyear experience a decline, which theBoard of Directors deems to betemporary in nature, then the pay-out ratio may be increased toensure that the dividend remainsrelatively stable.
6 Relations with theprincipal shareholdersOn 31 December 2001, Almanij NV(with registered office at Schoen-markt 33, Antwerp) held a control-ling participation in the KBC Bankand Insurance Holding Company of67.91%.
As stated in the 1999 annual reportof Almanij NV, a shareholderagreement was concluded inDecember 1999 between CeraHolding and the other permanentshareholders of Almanij. The pur-pose of this agreement is to supportand co-ordinate Almanij’s generalpolicy and to supervise its imple-mentation. By the terms of theagreement, the voting rights linkedto the shares allocated to eachparty under the shareholder agree-ment are to be exercised collec-tively and reciprocal pre-emptiverights have been granted withrespect to these shares.
As stated in the same annualreport, the co-operative Maatschap-pij voor Roerend Bezit van de Bel-gische Boerenbond, or MRBB, alsoacts as stable shareholder for theAlmanij Group.
The Group Policy Committee isresponsible for deliberating on andco-ordinating the policy of theAlmanij Group, for encouragingco-operation amongst the subsidiar-ies, and it also acts as a think-tankfor new ideas and initiatives.In principle, the committee meetstwice a year.
KBC is not aware of the existenceof any shareholder or managementcommittees other than the above.
Commercial transactions betweenKBC and Almanij do not take placeat the level of the KBC Bank andInsurance Holding Company, but atthe level of the operating compa-nies, principally KBC Bank, andtake place on an ‘at arm’s length’basis. These transactions are super-vised by the management bodies ofthe operating companies con-cerned.
7 AppointmentsWith effect from 25 April 2002,Messrs. G. Loyaerts, C. Selleslaghand R. Broeckaert will step down asmanaging directors and members ofthe Executive Committee of KBCBank and the KBC Bank and Insur-ance Holding Company. The depart-ure of these three directors is partof the general programme ofrestructuring and downsizingadopted in October 2001 in orderto contain costs and ensure themerger objectives are met.The Board of Directors would liketo express its gratitude and appreci-ation for the valued contributionmade by the managing directorsconcerned to the success of themerger at KBC Bank and to theoperations of the KBC Bank andInsurance Holding Company.Effective 25 April 2002, Mr. GuidoVan Roey will also step down asdirector of the KBC Bank andInsurance Holding Company. TheBoard would like to thank Mr. Van
Roey, too, for his active involve-ment following the 1998 merger. Itwill be proposed that the generalmeeting appoint Mr. Paul Peetersto take his place until the 2004annual general meeting, when histerm of office is due to expire.
At the annual general meeting ofshareholders in 2002, the terms ofoffice of Messrs. J. Huyghebaert,J. Cornu, T. Roussis and T. Leysenwill also come to an end. It is pro-posed that the general meeting re-appoint them for a further periodof six years, pursuant to the Articlesof Association.
8 Prospects for the KBCBank and InsuranceHolding CompanyPlease see the ‘Group results’ sec-tion, more particularly the passageentitled ‘Profit outlook’.
9 Board of Directors ofKBC Bank and of KBCInsuranceKBC BankChairman of the Board of Direc-tors: Willy Breesch2
Vice-Chairman of the Board ofDirectors: Jan Huyghebaert2
President of the Executive Commit-tee: Remi Vermeiren1
Members of the Board of Directors:Herman Agneessens1, RudyBroeckaert1, Rik Donckels, FransFlorquin1, Ghunald Loyaerts1,Eric Mertens, Luc Philips1, HubertPlouvier2, Clément Selleslagh1,Paul Tanghe2, Jan Vanhevel1,Valère Vanschoenbeek, HermanVan Thillo, Ferdinand Verdonck2
1 Member of the Executive Committee(Messrs. Rudy Broeckaert, GhunaldLoyaerts and Clément Selleslagh will stepdown at the General Meeting of Sharehol-ders in April 2002).
2 Member of the Audit Committee.
Group structure and corporate governance
KBC Bank & Insurance Group − 2001 Annual Report
73
■ ■ ■ ■ ■ ■ ■ ■ ■ ■
Secretary to the Board of Directorsand the Executive Committee:Johan DeronAuditor:Ernst & Young BedrijfsrevisorenBCV, represented by Jean-PierreRomont and Danielle Vermaelen
KBC InsuranceChairman of the Board of Direc-tors: Alfons Wouters2
President of the Executive Commit-tee: Willy Duron1
Members of the Board of Directors:Emile Celis1, Ann Collin,Christian Defrancq1, Noël Devisch,Rik Donckels, Carla Durlet,Jan Huyghebaert, Paul Tanghe2,Harold Vanden Avenne2,Ferdinand Verdonck2
Secretary to the Board of Directorsand the Executive Committee:Dirk VerdoncktAuditor:Ernst & Young BedrijfsrevisorenBCV, represented by Jean-PierreRomont and Jan De Landsheer
OPEN COMMUNICATIONWITH SHAREHOLDERS
KBC attaches a great deal ofimportance to providing transpar-ent financial information to allinterested parties and particularlyto its shareholders.
The mission of KBC’s InvestorRelations Office is to continuouslyupgrade the provision of financialinformation to analysts and share-holders.
Traditionally, the KBC Group hascommunicated financial informa-tion via yearly and half-yearly earn-ings releases, annual (and half-yearly) reports, road shows, andpress releases. In 2001, a number ofother initiatives were taken with aview to enhancing the provision ofinformation to shareholders.This was achieved via:j the publication of quarterly
results and reports starting in thefirst quarter of 2001;
j the launch of a special Web site(www.kbc.com) containing spe-cific investor relations informa-tion;
j an increase in the number ofroad shows and presentations;
j the organization of a specialInvestor Day, where KBC’s topmanagement explained a numberof KBC activities in detail.
Group structure and corporate governance
KBC Bank & Insurance Group − 2001 Annual Report
74

KBC Bank & Insurance Group − 2001 Annual Report
75
■ ■ ■ ■ ■ ■ ■ ■ ■ ■
KBC Bank & Insurance Group − 2001 Annual Report
76
‘ W o r d ’ playFor its home market campaign,
KBC developed its single word,multi-media slogan ... ‘ w o r d ’ which,
in Flemish, means ‘ b e c o m e ’ .Through its colorful images and emotive text,
the campaign evokes every phase of our lives.It encourages action.
Joint action.K B C i s t h e r e f o r y o u .
To help you realize your plans,your dreams.
Offering products and services tailoredto people’s banking and insurance needs,
t o d a y .And available via tomorrow’s commercial channels
telebanking, e-banking or over the counter,f a c e - t o - f a c e .
Easy payment techniques.Versatile investment opportunities.
Practical security measures.Comprehensive insurance initiatives.
Young or old ... employer,employee or self-employed ... industrialist,housewife, farmer or office worker.
P u t t i n g p e o p l e f i r s t .KBC - as good as its w o r d !!
■ ■ ■ ■ ■
PICTURE USED IN THE 2001 KBC IMAGE CAMPAIGN
KBC Bank & Insurance Group − 2001 Annual Report
77
■ ■ ■ ■ ■
B e c o m e
Strong
Happy
Successful
B e c o m e what youwant to b e c o m e
But to b e c o m e . . .you have to o v e r c o m e
To g e t h e r we can.
KBC − we’re therewhen y o u n e e d u s
To g e t h e r ,we can create a f u t u r e
For you to b e c o m ewhat you want to b e c o m e
Your future isa s s u r e d − b a n k
on it with KBC
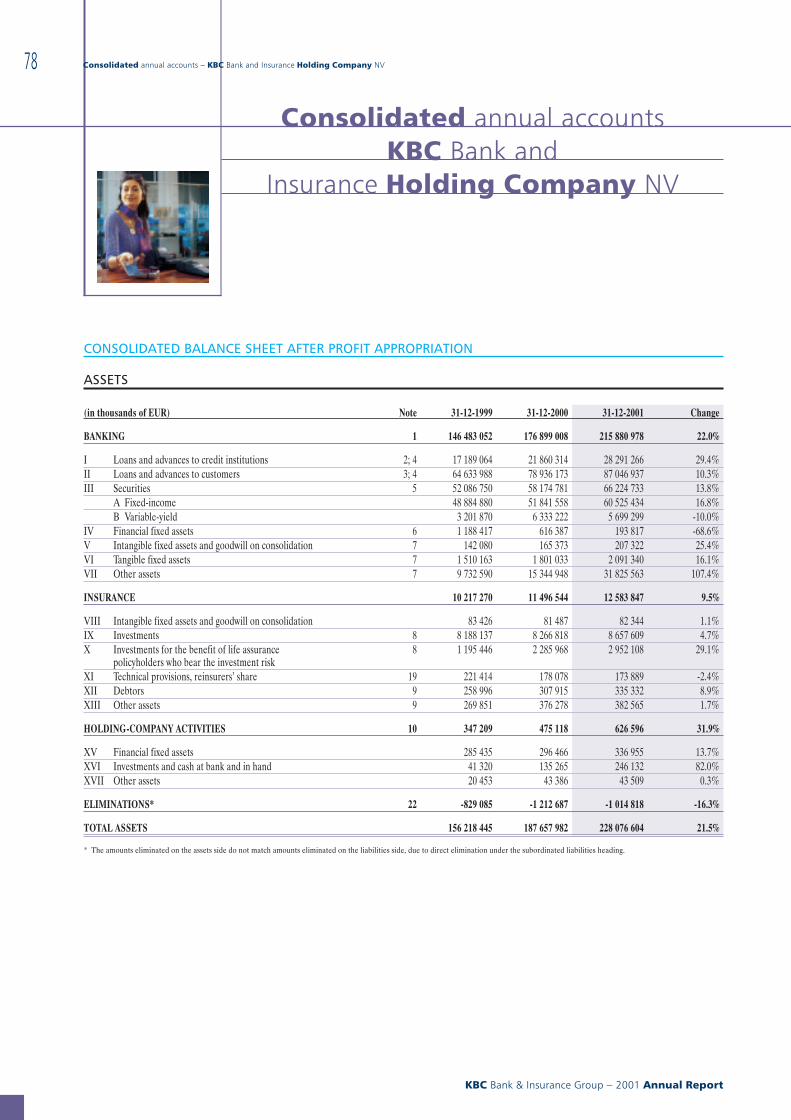
Consolidated annual accountsKBC Bank and
Insurance Holding Company NV
CONSOLIDATED BALANCE SHEET AFTER PROFIT APPROPRIATION
ASSETS
(in thousands of EUR) Note 31-12-1999 31-12-2000 31-12-2001 Change
BANKING 1 146 483 052 176 899 008 215 880 978 22.0%
I Loans and advances to credit institutions 2; 4 17 189 064 21 860 314 28 291 266 29.4%II Loans and advances to customers 3; 4 64 633 988 78 936 173 87 046 937 10.3%III Securities 5 52 086 750 58 174 781 66 224 733 13.8%
A Fixed-income 48 884 880 51 841 558 60 525 434 16.8%B Variable-yield 3 201 870 6 333 222 5 699 299 -10.0%
IV Financial fixed assets 6 1 188 417 616 387 193 817 -68.6%V Intangible fixed assets and goodwill on consolidation 7 142 080 165 373 207 322 25.4%VI Tangible fixed assets 7 1 510 163 1 801 033 2 091 340 16.1%VII Other assets 7 9 732 590 15 344 948 31 825 563 107.4%
INSURANCE 10 217 270 11 496 544 12 583 847 9.5%
VIII Intangible fixed assets and goodwill on consolidation 83 426 81 487 82 344 1.1%IX Investments 8 8 188 137 8 266 818 8 657 609 4.7%X Investments for the benefit of life assurance
policyholders who bear the investment risk8 1 195 446 2 285 968 2 952 108 29.1%
XI Technical provisions, reinsurers’ share 19 221 414 178 078 173 889 -2.4%XII Debtors 9 258 996 307 915 335 332 8.9%XIII Other assets 9 269 851 376 278 382 565 1.7%
HOLDING-COMPANY ACTIVITIES 10 347 209 475 118 626 596 31.9%
XV Financial fixed assets 285 435 296 466 336 955 13.7%XVI Investments and cash at bank and in hand 41 320 135 265 246 132 82.0%XVII Other assets 20 453 43 386 43 509 0.3%
ELIMINATIONS* 22 -829 085 -1 212 687 -1 014 818 -16.3%
TOTAL ASSETS 156 218 445 187 657 982 228 076 604 21.5%
* The amounts eliminated on the assets side do not match amounts eliminated on the liabilities side, due to direct elimination under the subordinated liabilities heading.
Consolidated annual accounts − KBC Bank and Insurance Holding Company NV
KBC Bank & Insurance Group − 2001 Annual Report
78
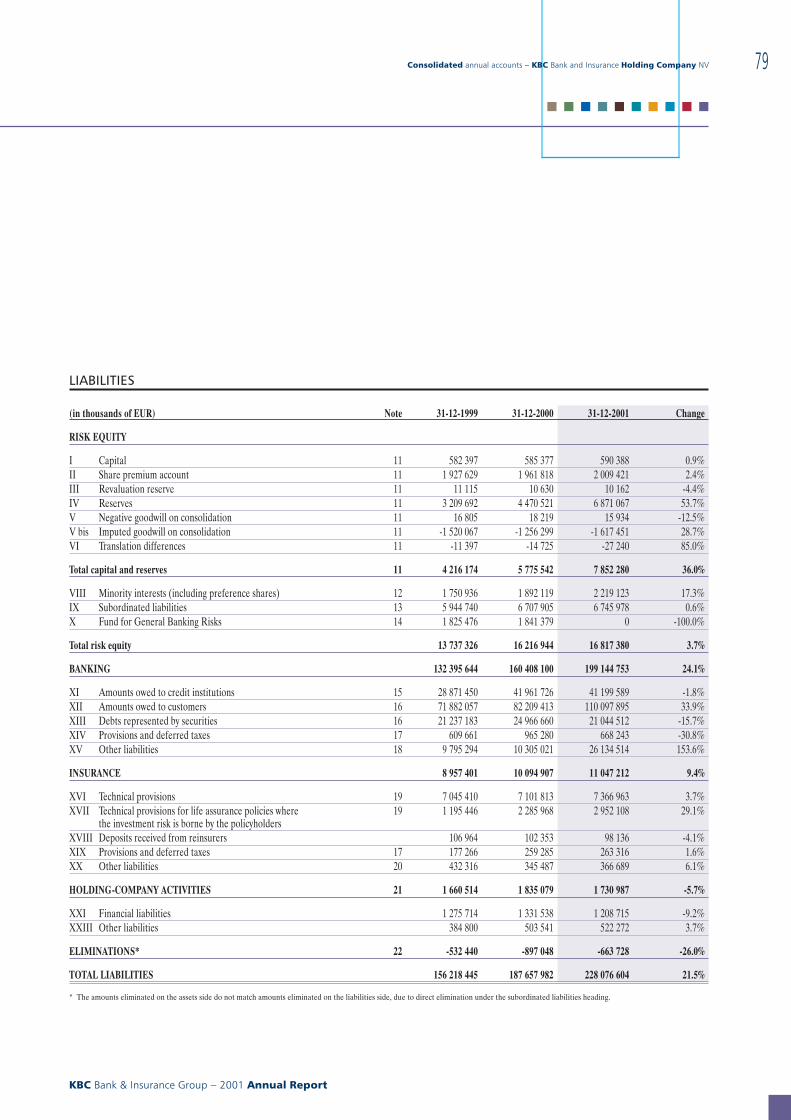
LIABILITIES
(in thousands of EUR) Note 31-12-1999 31-12-2000 31-12-2001 Change
RISK EQUITY
I Capital 11 582 397 585 377 590 388 0.9%II Share premium account 11 1 927 629 1 961 818 2 009 421 2.4%III Revaluation reserve 11 11 115 10 630 10 162 -4.4%IV Reserves 11 3 209 692 4 470 521 6 871 067 53.7%V Negative goodwill on consolidation 11 16 805 18 219 15 934 -12.5%V bis Imputed goodwill on consolidation 11 -1 520 067 -1 256 299 -1 617 451 28.7%VI Translation differences 11 -11 397 -14 725 -27 240 85.0%
Total capital and reserves 11 4 216 174 5 775 542 7 852 280 36.0%
VIII Minority interests (including preference shares) 12 1 750 936 1 892 119 2 219 123 17.3%IX Subordinated liabilities 13 5 944 740 6 707 905 6 745 978 0.6%X Fund for General Banking Risks 14 1 825 476 1 841 379 0 -100.0%
Total risk equity 13 737 326 16 216 944 16 817 380 3.7%
BANKING 132 395 644 160 408 100 199 144 753 24.1%
XI Amounts owed to credit institutions 15 28 871 450 41 961 726 41 199 589 -1.8%XII Amounts owed to customers 16 71 882 057 82 209 413 110 097 895 33.9%XIII Debts represented by securities 16 21 237 183 24 966 660 21 044 512 -15.7%XIV Provisions and deferred taxes 17 609 661 965 280 668 243 -30.8%XV Other liabilities 18 9 795 294 10 305 021 26 134 514 153.6%
INSURANCE 8 957 401 10 094 907 11 047 212 9.4%
XVI Technical provisions 19 7 045 410 7 101 813 7 366 963 3.7%XVII Technical provisions for life assurance policies where
the investment risk is borne by the policyholders19 1 195 446 2 285 968 2 952 108 29.1%
XVIII Deposits received from reinsurers 106 964 102 353 98 136 -4.1%XIX Provisions and deferred taxes 17 177 266 259 285 263 316 1.6%XX Other liabilities 20 432 316 345 487 366 689 6.1%
HOLDING-COMPANY ACTIVITIES 21 1 660 514 1 835 079 1 730 987 -5.7%
XXI Financial liabilities 1 275 714 1 331 538 1 208 715 -9.2%XXIII Other liabilities 384 800 503 541 522 272 3.7%
ELIMINATIONS* 22 -532 440 -897 048 -663 728 -26.0%
TOTAL LIABILITIES 156 218 445 187 657 982 228 076 604 21.5%
* The amounts eliminated on the assets side do not match amounts eliminated on the liabilities side, due to direct elimination under the subordinated liabilities heading.
Consolidated annual accounts − KBC Bank and Insurance Holding Company NV
KBC Bank & Insurance Group − 2001 Annual Report
79
■ ■ ■ ■ ■ ■ ■ ■ ■ ■
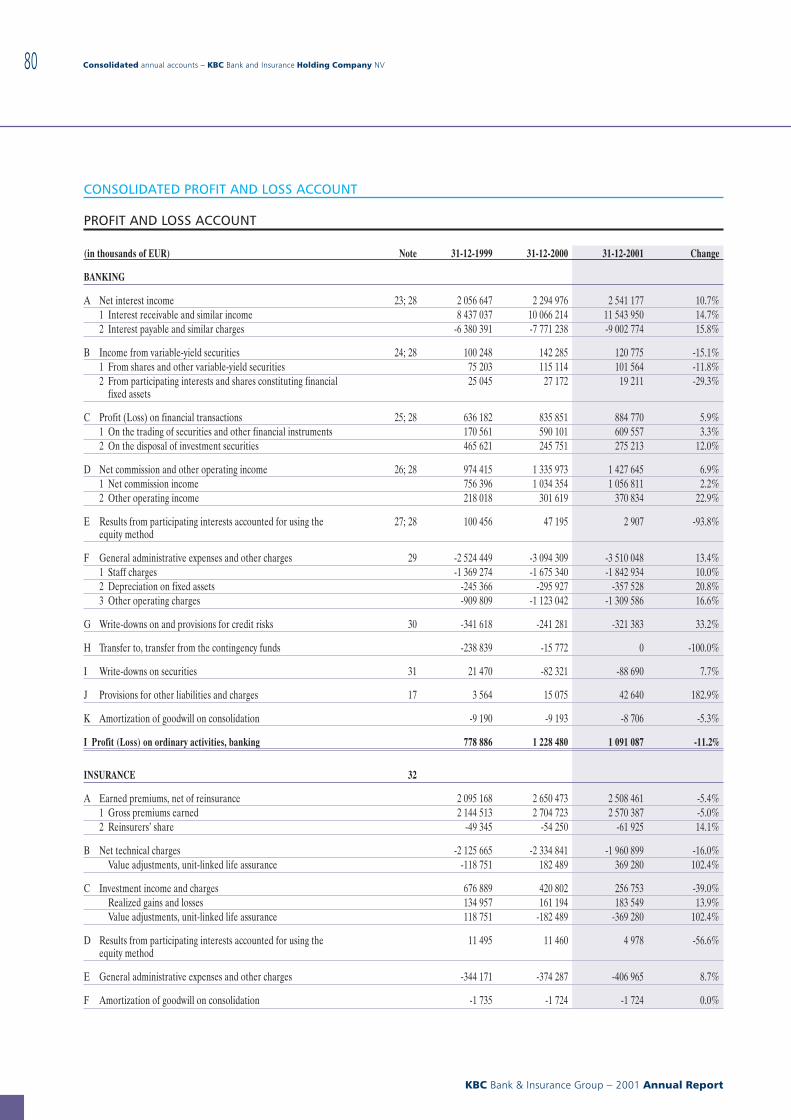
CONSOLIDATED PROFIT AND LOSS ACCOUNT
PROFIT AND LOSS ACCOUNT
(in thousands of EUR) Note 31-12-1999 31-12-2000 31-12-2001 Change
BANKING
A Net interest income 23; 28 2 056 647 2 294 976 2 541 177 10.7%1 Interest receivable and similar income 8 437 037 10 066 214 11 543 950 14.7%2 Interest payable and similar charges -6 380 391 -7 771 238 -9 002 774 15.8%
B Income from variable-yield securities 24; 28 100 248 142 285 120 775 -15.1%1 From shares and other variable-yield securities 75 203 115 114 101 564 -11.8%2 From participating interests and shares constituting financial
fixed assets25 045 27 172 19 211 -29.3%
C Profit (Loss) on financial transactions 25; 28 636 182 835 851 884 770 5.9%1 On the trading of securities and other financial instruments 170 561 590 101 609 557 3.3%2 On the disposal of investment securities 465 621 245 751 275 213 12.0%
D Net commission and other operating income 26; 28 974 415 1 335 973 1 427 645 6.9%1 Net commission income 756 396 1 034 354 1 056 811 2.2%2 Other operating income 218 018 301 619 370 834 22.9%
E Results from participating interests accounted for using theequity method
27; 28 100 456 47 195 2 907 -93.8%
F General administrative expenses and other charges 29 -2 524 449 -3 094 309 -3 510 048 13.4%1 Staff charges -1 369 274 -1 675 340 -1 842 934 10.0%2 Depreciation on fixed assets -245 366 -295 927 -357 528 20.8%3 Other operating charges -909 809 -1 123 042 -1 309 586 16.6%
G Write-downs on and provisions for credit risks 30 -341 618 -241 281 -321 383 33.2%
H Transfer to, transfer from the contingency funds -238 839 -15 772 0 -100.0%
I Write-downs on securities 31 21 470 -82 321 -88 690 7.7%
J Provisions for other liabilities and charges 17 3 564 15 075 42 640 182.9%
K Amortization of goodwill on consolidation -9 190 -9 193 -8 706 -5.3%
I Profit (Loss) on ordinary activities, banking 778 886 1 228 480 1 091 087 -11.2%
INSURANCE 32
A Earned premiums, net of reinsurance 2 095 168 2 650 473 2 508 461 -5.4%1 Gross premiums earned 2 144 513 2 704 723 2 570 387 -5.0%2 Reinsurers’ share -49 345 -54 250 -61 925 14.1%
B Net technical charges -2 125 665 -2 334 841 -1 960 899 -16.0%Value adjustments, unit-linked life assurance -118 751 182 489 369 280 102.4%
C Investment income and charges 676 889 420 802 256 753 -39.0%Realized gains and losses 134 957 161 194 183 549 13.9%Value adjustments, unit-linked life assurance 118 751 -182 489 -369 280 102.4%
D Results from participating interests accounted for using theequity method
11 495 11 460 4 978 -56.6%
E General administrative expenses and other charges -344 171 -374 287 -406 965 8.7%
F Amortization of goodwill on consolidation -1 735 -1 724 -1 724 0.0%
Consolidated annual accounts − KBC Bank and Insurance Holding Company NV
KBC Bank & Insurance Group − 2001 Annual Report
80
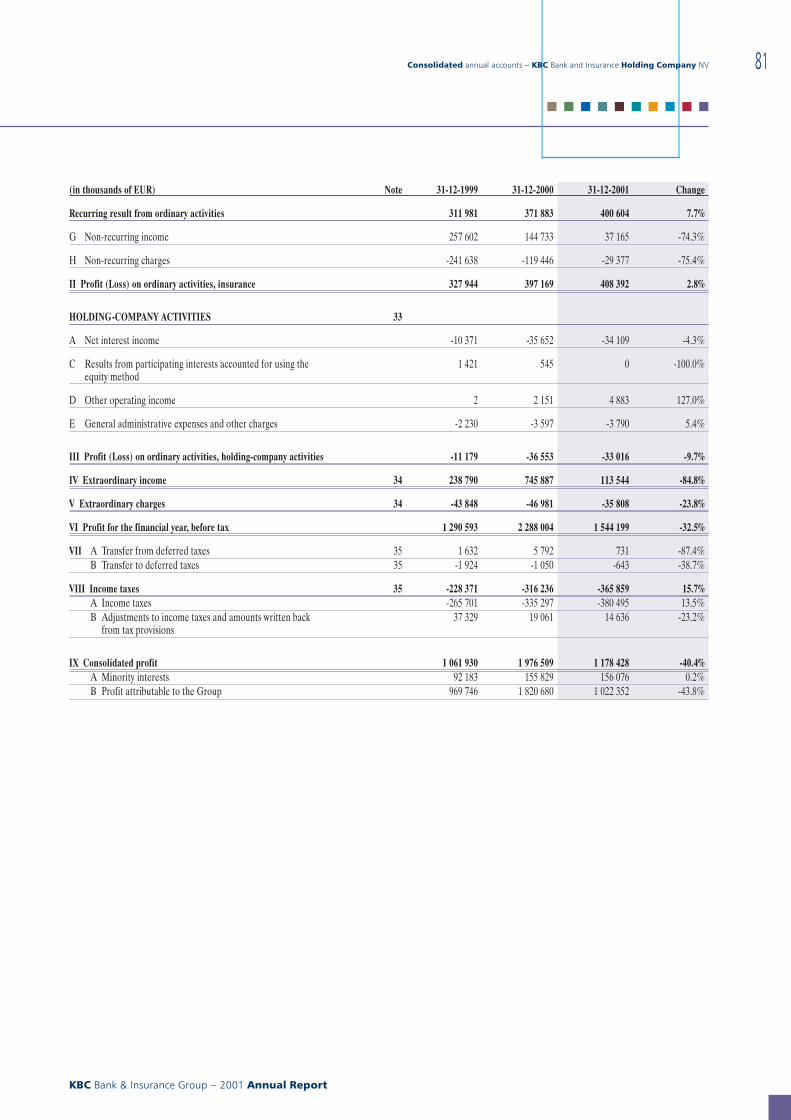
(in thousands of EUR) Note 31-12-1999 31-12-2000 31-12-2001 Change
Recurring result from ordinary activities 311 981 371 883 400 604 7.7%
G Non-recurring income 257 602 144 733 37 165 -74.3%
H Non-recurring charges -241 638 -119 446 -29 377 -75.4%
II Profit (Loss) on ordinary activities, insurance 327 944 397 169 408 392 2.8%
HOLDING-COMPANY ACTIVITIES 33
A Net interest income -10 371 -35 652 -34 109 -4.3%
C Results from participating interests accounted for using theequity method
1 421 545 0 -100.0%
D Other operating income 2 2 151 4 883 127.0%
E General administrative expenses and other charges -2 230 -3 597 -3 790 5.4%
III Profit (Loss) on ordinary activities, holding-company activities -11 179 -36 553 -33 016 -9.7%
IV Extraordinary income 34 238 790 745 887 113 544 -84.8%
V Extraordinary charges 34 -43 848 -46 981 -35 808 -23.8%
VI Profit for the financial year, before tax 1 290 593 2 288 004 1 544 199 -32.5%
VII A Transfer from deferred taxes 35 1 632 5 792 731 -87.4%B Transfer to deferred taxes 35 -1 924 -1 050 -643 -38.7%
VIII Income taxes 35 -228 371 -316 236 -365 859 15.7%A Income taxes -265 701 -335 297 -380 495 13.5%B Adjustments to income taxes and amounts written back
from tax provisions37 329 19 061 14 636 -23.2%
IX Consolidated profit 1 061 930 1 976 509 1 178 428 -40.4%A Minority interests 92 183 155 829 156 076 0.2%B Profit attributable to the Group 969 746 1 820 680 1 022 352 -43.8%
Consolidated annual accounts − KBC Bank and Insurance Holding Company NV
KBC Bank & Insurance Group − 2001 Annual Report
81
■ ■ ■ ■ ■ ■ ■ ■ ■ ■
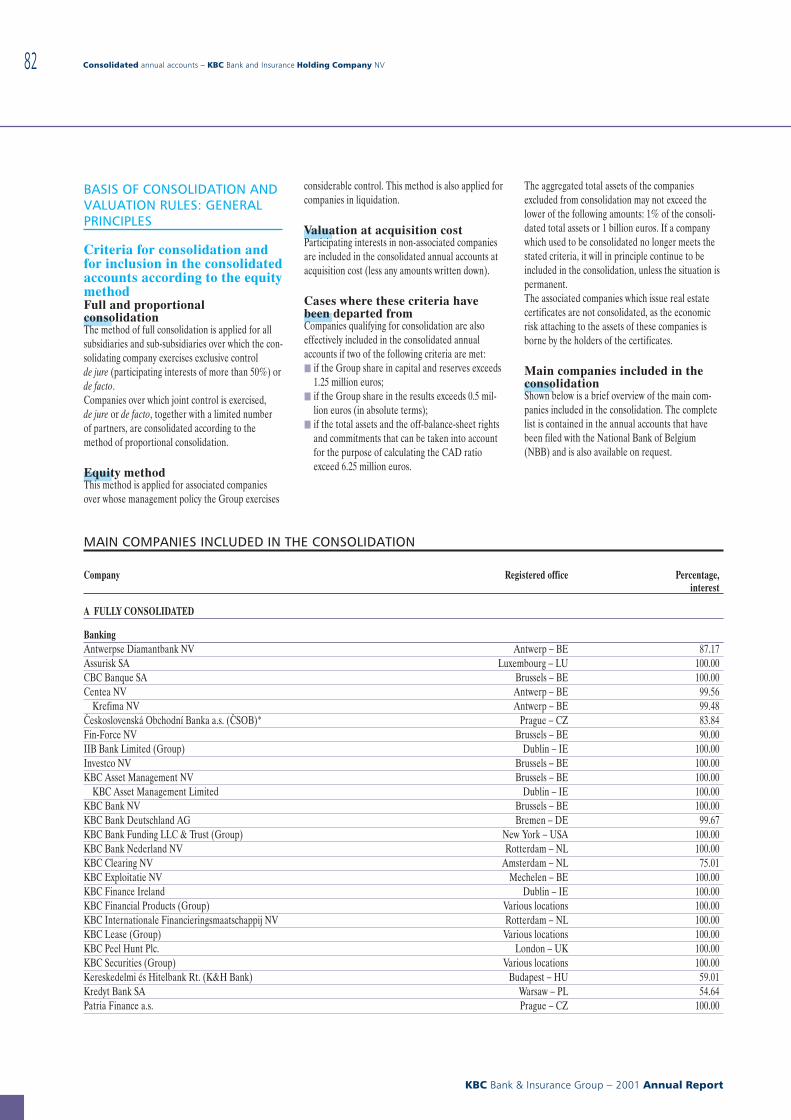
BASIS OF CONSOLIDATION ANDVALUATION RULES: GENERALPRINCIPLES
Criteria for consolidation andfor inclusion in the consolidatedaccounts according to the equitymethodFull and proportionalconsolidationThe method of full consolidation is applied for allsubsidiaries and sub-subsidiaries over which the con-solidating company exercises exclusive controlde jure (participating interests of more than 50%) orde facto.Companies over which joint control is exercised,de jure or de facto, together with a limited numberof partners, are consolidated according to themethod of proportional consolidation.
Equity methodThis method is applied for associated companiesover whose management policy the Group exercises
considerable control. This method is also applied forcompanies in liquidation.
Valuation at acquisition costParticipating interests in non-associated companiesare included in the consolidated annual accounts atacquisition cost (less any amounts written down).
Cases where these criteria havebeen departed fromCompanies qualifying for consolidation are alsoeffectively included in the consolidated annualaccounts if two of the following criteria are met:j if the Group share in capital and reserves exceeds
1.25 million euros;j if the Group share in the results exceeds 0.5 mil-
lion euros (in absolute terms);j if the total assets and the off-balance-sheet rights
and commitments that can be taken into accountfor the purpose of calculating the CAD ratioexceed 6.25 million euros.
The aggregated total assets of the companiesexcluded from consolidation may not exceed thelower of the following amounts: 1% of the consoli-dated total assets or 1 billion euros. If a companywhich used to be consolidated no longer meets thestated criteria, it will in principle continue to beincluded in the consolidation, unless the situation ispermanent.The associated companies which issue real estatecertificates are not consolidated, as the economicrisk attaching to the assets of these companies isborne by the holders of the certificates.
Main companies included in theconsolidationShown below is a brief overview of the main com-panies included in the consolidation. The completelist is contained in the annual accounts that havebeen filed with the National Bank of Belgium(NBB) and is also available on request.
MAIN COMPANIES INCLUDED IN THE CONSOLIDATION
Company Registered office Percentage,interest
A FULLY CONSOLIDATED
BankingAntwerpse Diamantbank NV Antwerp − BE 87.17Assurisk SA Luxembourg − LU 100.00CBC Banque SA Brussels − BE 100.00Centea NV Antwerp − BE 99.56
Krefima NV Antwerp − BE 99.48C{eskoslovenská Obchodní Banka a.s. (C{SOB)* Prague − CZ 83.84Fin-Force NV Brussels − BE 90.00IIB Bank Limited (Group) Dublin − IE 100.00Investco NV Brussels − BE 100.00KBC Asset Management NV Brussels − BE 100.00
KBC Asset Management Limited Dublin − IE 100.00KBC Bank NV Brussels − BE 100.00KBC Bank Deutschland AG Bremen − DE 99.67KBC Bank Funding LLC & Trust (Group) New York − USA 100.00KBC Bank Nederland NV Rotterdam − NL 100.00KBC Clearing NV Amsterdam − NL 75.01KBC Exploitatie NV Mechelen − BE 100.00KBC Finance Ireland Dublin − IE 100.00KBC Financial Products (Group) Various locations 100.00KBC Internationale Financieringsmaatschappij NV Rotterdam − NL 100.00KBC Lease (Group) Various locations 100.00KBC Peel Hunt Plc. London − UK 100.00KBC Securities (Group) Various locations 100.00Kereskedelmi és Hitelbank Rt. (K&H Bank) Budapest − HU 59.01Kredyt Bank SA Warsaw − PL 54.64Patria Finance a.s. Prague − CZ 100.00
Consolidated annual accounts − KBC Bank and Insurance Holding Company NV
KBC Bank & Insurance Group − 2001 Annual Report
82
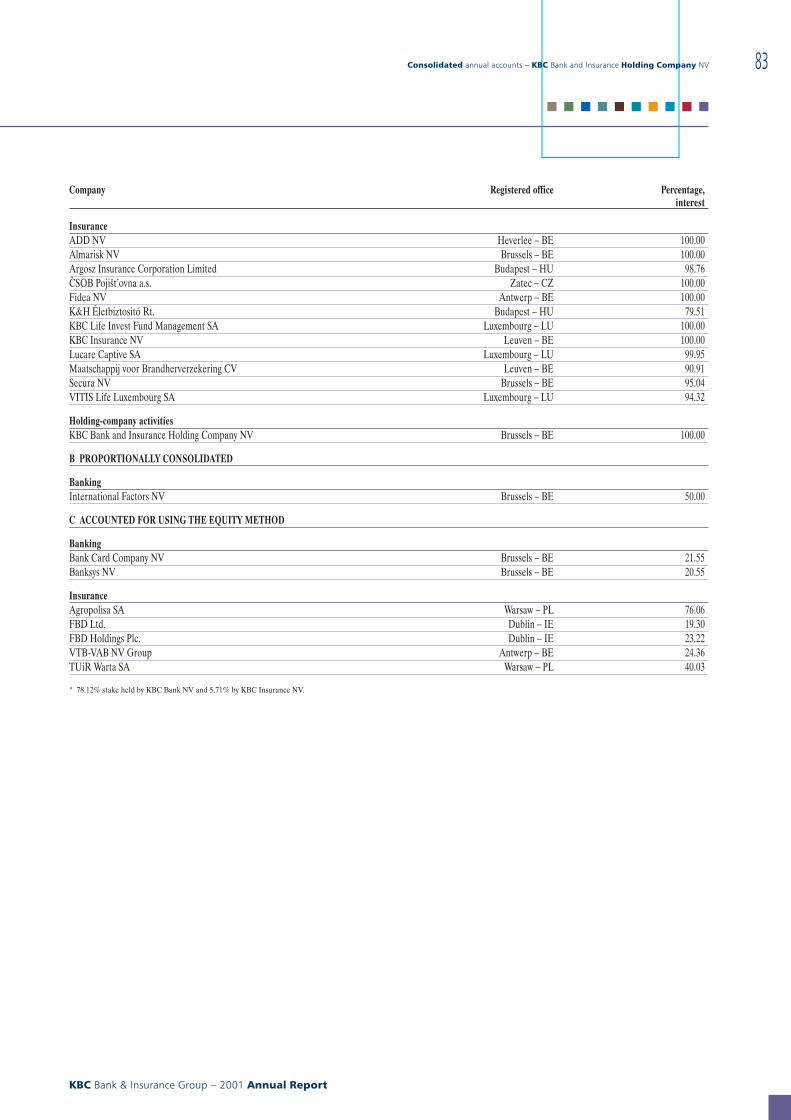
Company Registered office Percentage,interest
InsuranceADD NV Heverlee − BE 100.00Almarisk NV Brussels − BE 100.00Argosz Insurance Corporation Limited Budapest − HU 98.76C{SOB Pojist’ovna a.s. Zatec − CZ 100.00Fidea NV Antwerp − BE 100.00K&H Életbiztositó Rt. Budapest − HU 79.51KBC Life Invest Fund Management SA Luxembourg − LU 100.00KBC Insurance NV Leuven − BE 100.00Lucare Captive SA Luxembourg − LU 99.95Maatschappij voor Brandherverzekering CV Leuven − BE 90.91Secura NV Brussels − BE 95.04VITIS Life Luxembourg SA Luxembourg − LU 94.32
Holding-company activitiesKBC Bank and Insurance Holding Company NV Brussels − BE 100.00
B PROPORTIONALLY CONSOLIDATED
BankingInternational Factors NV Brussels − BE 50.00
C ACCOUNTED FOR USING THE EQUITY METHOD
BankingBank Card Company NV Brussels − BE 21.55Banksys NV Brussels − BE 20.55
InsuranceAgropolisa SA Warsaw − PL 76.06FBD Ltd. Dublin − IE 19.30FBD Holdings Plc. Dublin − IE 23.22VTB-VAB NV Group Antwerp − BE 24.36TUiR Warta SA Warsaw − PL 40.03
* 78.12% stake held by KBC Bank NV and 5.71% by KBC Insurance NV.
Consolidated annual accounts − KBC Bank and Insurance Holding Company NV
KBC Bank & Insurance Group − 2001 Annual Report
83
■ ■ ■ ■ ■ ■ ■ ■ ■ ■
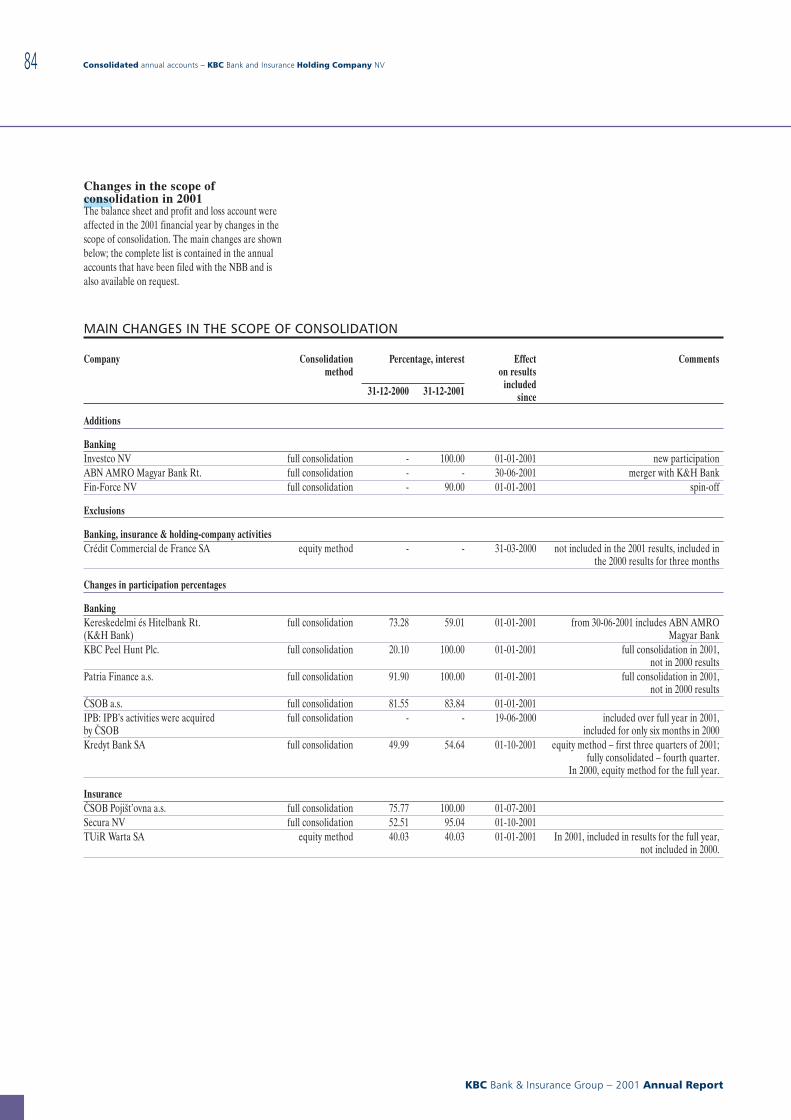
Changes in the scope ofconsolidation in 2001The balance sheet and profit and loss account wereaffected in the 2001 financial year by changes in thescope of consolidation. The main changes are shownbelow; the complete list is contained in the annualaccounts that have been filed with the NBB and isalso available on request.
MAIN CHANGES IN THE SCOPE OF CONSOLIDATION
Company Consolidationmethod
Percentage, interest Effecton results
includedsince
Comments
31-12-2000 31-12-2001
Additions
BankingInvestco NV full consolidation - 100.00 01-01-2001 new participationABN AMRO Magyar Bank Rt. full consolidation - - 30-06-2001 merger with K&H BankFin-Force NV full consolidation - 90.00 01-01-2001 spin-off
Exclusions
Banking, insurance & holding-company activitiesCrédit Commercial de France SA equity method - - 31-03-2000 not included in the 2001 results, included in
the 2000 results for three months
Changes in participation percentages
BankingKereskedelmi és Hitelbank Rt.(K&H Bank)
full consolidation 73.28 59.01 01-01-2001 from 30-06-2001 includes ABN AMROMagyar Bank
KBC Peel Hunt Plc. full consolidation 20.10 100.00 01-01-2001 full consolidation in 2001,not in 2000 results
Patria Finance a.s. full consolidation 91.90 100.00 01-01-2001 full consolidation in 2001,not in 2000 results
C{SOB a.s. full consolidation 81.55 83.84 01-01-2001IPB: IPB’s activities were acquiredby C{SOB
full consolidation - - 19-06-2000 included over full year in 2001,included for only six months in 2000
Kredyt Bank SA full consolidation 49.99 54.64 01-10-2001 equity method − first three quarters of 2001;fully consolidated − fourth quarter.
In 2000, equity method for the full year.
InsuranceC{SOB Pojist’ovna a.s. full consolidation 75.77 100.00 01-07-2001Secura NV full consolidation 52.51 95.04 01-10-2001TUiR Warta SA equity method 40.03 40.03 01-01-2001 In 2001, included in results for the full year,
not included in 2000.
Consolidated annual accounts − KBC Bank and Insurance Holding Company NV
KBC Bank & Insurance Group − 2001 Annual Report
84
Accounting principles andvaluation rules: generalprinciplesGeneralThe accounting principles and valuation rules con-form to Belgian accounting legislation and the pro-visions of the Royal Decree of 23 September 1992on the consolidated annual accounts of credit insti-tutions, the Royal Decree of 13 February 1996 onthe consolidated annual accounts of insurance andreinsurance companies, and the Royal Decree of1 September 1986 on holding companies, asamended by the Royal Decree of 25 November 1991(for the holding-company activities), save howeverfor the divergent presentation.
The KBC Bank and Insurance Holding CompanyNV is a financial conglomerate by nature andgroups the activities of KBC Bank NV, KBC Insu-rance NV and KBC Asset Management NV.The presentation for holding companies is notsuited to giving a true and fair view of the assets andliabilities, the financial position and the results ofthe KBC Bank and Insurance Holding CompanyNV.In drawing up the lay-out that would be used,a functional approach was opted for, based ona breakdown per area of activity (banking, includingasset management, insurance and holding-companyactivities). This presentation respects the specificityof the different activities and allows for flexibilitywith regard to the differences in regulations andvaluation.As supervisory authority for listed holding com-panies, the Belgian Banking and Finance Commis-sion (BFC) gave the KBC Bank and InsuranceHolding Company NV the requisite authorization todraw up its consolidated annual accounts using afunctional lay-out that takes into account the mixedactivities engaged in by a financial services group.
The consolidated annual accounts are made up as at31 December, the year-end for the parent companyand the vast majority of the consolidated companies.For those companies with a different year-end, in-terim accounts are drawn up at 31 December for thepurpose of consolidation. The consolidated annualaccounts are made up after profit appropriation bythe KBC Bank and Insurance Holding CompanyNV. The annual accounts of the other consolidatedcompanies are included before profit appropriation.In accordance with Article 152 §2 of the RoyalDecree of 30 January 2001, the valuation rules ofcompanies accounted for using the equity methodare not adjusted to bring them into line with thoseof the consolidating company.However, two exceptions have been made for associ-ated companies of KBC Insurance, namely for:1) FBD Holdings, where unrealized gains and losseshave been eliminated from the results and 2) TUiRWarta, where the equalization and catastrophe pro-
vision has been calculated according to the valuationrules in effect for the Group.
The assets and liabilities belonging to one and thesame activity are, in principle, valued according touniform rules. Differences persist between the activ-ities, owing to the specific rules that apply in thesector. These differences have not, however, beenharmonized, in view of the specificity of the areas ofactivity, and they relate primarily to the securitiesportfolio.
In the profit and loss account, income and expend-iture between the various areas of activity (banking,insurance and holding-company activities) andwhich arise in the course of ordinary activities arenot eliminated. The corresponding positions on thebalance sheet are, however, adjusted via the ‘Elimin-ations’ heading. This accounting treatment providesbetter insight, in business-economic terms, into theresults of each business area. Within the separateareas of activity, the intercompany balances on thebalance sheet and the profit and loss account areeliminated, starting from an amount of 2.5 millioneuros. In Note 22, moreover, an indication is givenof the intercompany transactions between the bank-ing, the insurance and the holding-company activ-ities.Intragroup gains and losses are eliminated commen-surate with the percentage share (direct and indir-ect) held by the consolidating company in each ofthe subsidiaries concerned. Internal gains and lossesof under 0.5 million euros are not eliminated.
Valuation rulesa Currency translationAll monetary items denominated in foreign currencyare translated into their equivalent in euros at thespot rate at balance sheet date.
j BankingNegative and positive valuation differences, exceptfor those relating to the financing of shares and par-ticipating interests in foreign currency, are recordedin the profit and loss account.
Non-monetary items are valued on the basis of thehistorical rate at acquisition or, where appropriate,on the basis of the exchange rate at which the cur-rency used to pay the price was purchased.For transactions that entailed funding (lending), therate of the day is used if there is no exchange rate.Income and charges denominated in foreign cur-rency are stated in the profit and loss account at therate prevailing when they are recognized. Foreign-currency income and expenditure which is hedged inadvance is recorded in euros on the basis of thefixed rate.
j InsuranceThe balance of the positive and negative differencesarising from the translation of the technical provi-
sions denominated in foreign currency are includedunder the corresponding ‘Adjustments to the tech-nical provisions’ headings in the profit and lossaccount. The balances arising from the translationof the technical non-life reinsurance provisionsdenominated in foreign currency are included underthe corresponding ‘Other technical charges’ headingin the profit and loss account for the non-life busi-ness.
The negative balance of the differences arising fromthe translation of monetary items, other than thetechnical provisions, denominated in foreign cur-rency, is charged to the profit and loss account.
The positive balance is recorded under the accrualsand deferrals heading as income to be carried for-ward, with the exception of the positive differenceson EMU currencies, which are included in the resultfor the (financial) year in which those currencies areincorporated into the euro, as they become defini-tive at that time.
For non-monetary items whose acquisition cost isexpressed in foreign currency, the equivalent ineuros at which these items are posted to the annualaccounts is calculated on the basis of the exchangerate prevailing at the end of the month precedingthe acquisition of the non-monetary items.
Charges and income expressed in foreign currencyare translated quarterly and included in the profitand loss account at the spot rate prevailing at theend of the quarter.
j Holding-company activitiesThe negative translation differences are taken intoaccount via the ‘Unrealized exchange differences’heading in the profit and loss account. The positivetranslation differences are included in the balancesheet under the ‘Accrued charges and deferredincome’ heading, with the exception of the positivedifferences on EMU currencies, which are includedin the result for the (financial) year in which thosecurrencies are incorporated into the euro, as theybecome definitive at that time.
b Translation of the financialstatements of foreign subsidiariesThe balance sheets of foreign subsidiaries are trans-lated into euros at the spot rate at balance sheetdate (with the exception of the capital and reserves,which are translated at the historical rate). The pro-fit and loss account is translated at the average ratefor the financial year. Differences arising becausethe exchange rate used for assets and liabilitiesitems differs from that used for items constitutingcapital and reserves are included (together with theexchange rate differences on loans concluded tofinance participating interests in foreign currency),in the amount of the Group’s share, under the liabil-ities heading, ‘Translation differences’.
Consolidated annual accounts − KBC Bank and Insurance Holding Company NV
KBC Bank & Insurance Group − 2001 Annual Report
85
■ ■ ■ ■ ■ ■ ■ ■ ■ ■
The cumulative translation differences stemmingfrom the translation of financial statements ex-pressed in an EMU currency for the period up tothe currency’s incorporation into the euro willremain under this heading.
Translation differences are taken to the profit andloss account upon the transfer in whole or in part ofthe participating interest.
c Amounts receivablej BankingInterest collected in advance and similar income(including such additional compensation as fees forforeign loans) for the entire loan period cannot betaken to the profit and loss account immediately,and is therefore posted to an accruals and deferralsheading. At month-end, the amount earned is writ-ten to the profit and loss account.Origination and processing fees charged are takento the results immediately on the inception of theloans and advances concerned, credit insurance pre-miums are written to the profit and loss accountannually when paid.Commissions due (payable in advance) for bankguarantees given are included in the profit and lossaccount immediately. The commissions awarded byKBC Bank for credit broking are charged to theprofit and loss account when the credit is disbursed.
Amounts receivable arising from advances or cashdeposits are recorded in the balance sheet in theamount made available. The difference between theamount made available and the nominal value (dis-count) is spread according to the straight-linemethod as interest receivable via the accruals anddeferrals accounts.Long-term credit, consumer credit and receivablesarising from leasing contracts are recorded in thebalance sheet in the outstanding principal amount,plus the interest past due and sundry costs to bepaid by customers. Interest received but not yet due(interest collected in advance) is recorded in theprofit and loss account on an accruals basis via theaccruals and deferrals headings. The other amountsreceivable are stated in the balance sheet at nominalvalue.
Loans and advances that are transferred throughsecuritization operations where the transfer quali-fies as a sale under Belgian Banking and FinanceCommission guidelines no longer constitute bankassets and consequently may not appear in thebalance sheet of KBC Bank, although the amount isrequired to be recorded in the contingent accounts.During the term of the securitization operation,the entry in the contingent accounts is required tobe adjusted at the end of each month in accordancewith customers’ loan repayments.Any gains realized on the sale of securitized assetsare taken to the profit and loss account immediatelyat the time of the sale.
If the sales price is made up entirely or in part of avariable element dependent on the buyer’s oper-ating profit, this element will only be taken to theprofit and loss account when the operating profit isknown and this element is therefore fixed.
For loans with an uncertain outcome, general pro-visions are set aside, specific write-downs arecharged and provisions are created for loans thatare linked economically. All interest and variousother receivables which have remained unpaid forthree months after having become payable will notbe recognized in the profit and loss account.Non-specific write-downs are calculated for domes-tic loans with an uncertain outcome on the basis ofthe principal amount whose repayment is uncertain,the percentage susceptible to reclassification (thatportion of the ‘uncertain outcome’ portfolio thatmight become ‘doubtful’) and the loss percentage.The percentages are arrived at on the basis of theirmoving average over the latest twelve months.For foreign loans, additional non-specific provisionsare posted, calculated on the basis of simple percent-ages.
For loans classified as irrecoverable and doubtful,specific write-downs are posted on a case-by-casebasis and charged to the assets heading in theannual accounts in which the risks appear, in orderto cover the losses which are considered certain orlikely to ensue on the outstanding loans. Interestdue and charges are written to reserves. Loans areclassified as irrecoverable and doubtful if the loanbalance is payable and if debt-recovery procedureshave been initiated in or out of court.
The amount of any security is equal to the principalamount registered. Personal security is recorded inthe accounts in the amount that can be obtained ifexecution is levied. Whenever the borrower makes apayment, the current amount of security has to beadjusted. If insufficient security is provided for aloan, a risk premium in the form of a higher rate ofinterest will be charged. The income this generateswill be posted to ‘Net interest income’ on anaccruals basis.
For country risks, provisions are established thatmeet the relevant provisioning requirements im-posed by the Belgian Banking and Finance Commis-sion. In addition, the bank sets aside additionalfunds which it considers necessary for the manage-ment of country risks. These are risks in respect ofcountries or groups of countries whose economic,financial, legal or political situation warrants thesetting aside of provisions on prudential grounds.From the 2000 financial year, amounts provisionedfor country risks will be broken down by type ofcounterparty (credit institution or non-credit insti-tution) and recorded as an adjusting entry under the‘Loans and advances to credit institutions’ or ‘Loansand advances to customers’ heading, as appropriate.
The overall provision for country risks used to berecorded as an adjusting entry under the ‘Loans andadvances to credit institutions’ heading.
j InsuranceAmounts receivable (debtors) are recorded in thebalance sheet at nominal value. Interest earned butnot yet due, the difference between acquisition costand nominal value, and the discount on amountsreceivable which bear an exceptionally low rate ofinterest or no interest at all are recorded under the‘Deferred charges and accrued income’ heading andreleased to the profit and loss account pro ratatemporis on the basis of the compound interest.If, at the close of the financial year, the realizationvalue of a receivable is lower than its carrying value,and if this diminution in value can be consideredreal and lasting in nature, a write-down is applied inthe amount of the recognized diminution in value.
j Holding-company activitiesAmounts receivable are recorded at nominal value.If, at the close of the financial year, the realizationvalue of a receivable is lower than its carrying value,and if this diminution in value can be consideredreal and lasting in nature, a write-down is applied inthe amount of the recognized diminution in value.
d SecuritiesSecurities are recorded under assets headings III,IX and X.
Securities are recorded at acquisition cost at thetime of purchase, excluding costs and less subscrip-tion fees. The ancillary costs attendant on acquisi-tion are charged directly to the result.
d1 Investment portfolioFixed-income investment securities are recorded atacquisition cost, less or plus the matured portion ofthe premium or discount. The difference betweenthe acquisition cost and the redemption value isreflected as interest receivable in the profit and lossaccount on an accruals basis over the remainingterm to maturity of the securities. It is included inthe profit and loss account on a discounted basis,based on the internal rate of return at the time ofpurchase.Perpetual debt is valued at the lower of acquisitioncost and market value.If redemption of a security is uncertain or doubtful,a write-down is recorded according to the principlesthat apply for the valuation of amounts receivable.If securities are sold, their carrying value is estab-lished on a case-by-case basis. Gains or losses areposted directly to the profit and loss account, exceptif they are derived from the sale of fixed-incomeinvestment securities in certain arbitrage trans-actions.
Consolidated annual accounts − KBC Bank and Insurance Holding Company NV
KBC Bank & Insurance Group − 2001 Annual Report
86
j BankingIn accordance with Article 35ter, §5, of the RoyalDecree on the annual accounts of credit institutions,gains and losses on the sale of fixed-income invest-ment securities in arbitrage transactions that arecarried out within the bounds set annually by theExecutive Committee are reflected in the profit andloss account, spread over the same time period asthe future income derived from the arbitrage.
Listed shares and other variable-yield securities arevalued each month at the lower of acquisition costand market value at balance sheet date. Othersecurities are valued at least once a year based onthe annual accounts for the previous year andmaterial negative developments during the course ofthe year.No write-downs are posted for shares hedgedagainst a decline in price by means of an option.
j InsuranceWrite-downs are posted on fixed-income investmentsecurities serving to support liquidity if their marketvalue is lower than the value arrived at by applyingthe other stipulations contained in these valuationrules and if uncertainty prevails regarding paymentof all or part of the amount receivable on thematurity date.Gains and losses on the sale of fixed-income invest-ment securities for the purpose of arbitrage trans-actions are included in the profit and loss account,spread over the same time period as the futureincome derived from the arbitrage.Shares and other variable-yield securities are valuedat acquisition cost, with a write-down being chargedin the event of a lasting diminution in value.
j Holding-company activitiesThe treasury shares the KBC Bank and InsuranceHolding Company has in portfolio (for the purposesof the employee stock option plan) are valued atacquisition cost.
d2 Trading portfolioSecurities belonging to the trading portfolio andinvestments for the benefit of life assurance policy-holders who bear the investment risk are marked tomarket. The valuation differences this generates arerecorded in the profit and loss account under,respectively, the ‘Profit (Loss) on financial trans-actions’ heading (for the banking operations) andunder ‘Investment income and charges’ (for theinsurance operations).
e Financial fixed assetsFinancial fixed assets are recorded under assetsheadings IV, IX and XV and, depending on the areaof activity concerned, include participating interests,(subordinated) loans and securities held in port-folio.
Included in holdings or participating interests arethe rights (shares) held in other companies with aview to creating specific, lasting ties with them.If there are no lasting ties and the shares are ac-quired for the purpose of reselling them, then thisinvestment will not be considered a financial fixedasset, but rather as part of the investment portfolio(by the bank), as another financial investment (bythe insurer) or as an item that comes under ‘Invest-ments and cash at bank and in hand’ (by the holdingcompany), regardless of the size of the shareholdingand the influence that could be exerted on themanagement of the company in question throughthis shareholding.
Participating interests accounted for using theequity method are valued according to the shareheld in the relevant companies’ equity. Participatinginterests that are not included in the consolidationand shares constituting financial fixed assets arerecorded at acquisition cost. Additional costsincurred on acquisition are charged forthwith tothe results for the financial year.Write-downs are applied only in the event of a last-ing impairment in or loss of value, established onthe basis of the financial position, the profitabilityand the prospects of the company concerned.Participating interests, shares and share certificatesclassified as financial fixed assets may be revalued if,in light of their usefulness to the company, theyexhibit an incontestable and lasting increase invalue.Regardless of whether they are represented bysecurities, subordinated loans and advances toassociated companies and companies linked byparticipating interests are valued according to thesame principles as non-subordinated loans andadvances.
j Holding-company activitiesFinancial fixed assets also include amounts receiv-able, which are recorded at nominal value. However,amounts receivable represented by fixed-incomesecurities are valued at acquisition cost, minus orplus the accrued portion of the premium or discountthat is released to the profit and loss account on apro rata basis over the remaining term to maturity.If repayment of a security has become uncertain ordoubtful, a write-down is posted according to thesame principles that apply for valuing receivableswhich are not represented by securities.
f Formation expenses and intangiblefixed assetsFormation expenses and intangible fixed assets arerecorded under assets headings V, VIII and XIV.
All formation expenses are charged directly to theprofit and loss account for the financial year asadministrative expenses.Software developed in-house is charged immediatelyto the profit and loss account. Systems software is
written off at the same rate as hardware. Standardsoftware and software customized or developed bythird parties is capitalized and written off accordingto the straight-line method over its useful economiclife. Capitalized goodwill is written off according tothe straight-line method over a period of five years,unless the Board of Directors decides otherwise.
g Goodwill on consolidationGoodwill on consolidation is recorded under assetsheadings V, VIII and XIV and under liabilities head-ings V and Vbis.
j General principleGoodwill on consolidation is the difference at thetime of acquisition between the acquisition cost andthe corresponding share in the equity of the acqui-sition.If such differences are caused by the over- or under-valuation of certain assets or liabilities, they areallocated to those items, which leads to a restate-ment of the annual accounts of the company inwhich a participating interest is held and which isincluded in the consolidation. The remaining differ-ence − resulting from expectations as to the futureprofitability of the Group − is the goodwill on con-solidation.If the acquisition cost exceeds the share in thecompany’s (possibly restated) equity, the consoli-dation difference is positive (goodwill). If the acqui-sition cost is lower than the share in the company’s(possibly restated) equity, the consolidation diffe-rence is negative (negative goodwill, or ‘badwill’).
j Treatment of goodwill on consolidation foracquisitions prior to 1 January 1999
Goodwill or negative goodwill on consolidation ofup to 0.5 million euros is taken directly to the profitand loss account. Goodwill on consolidation inexcess of 0.5 million euros is included in the consoli-dated accounts under the ‘Goodwill on consoli-dation’ heading on the assets or liabilities side ofthe balance sheet.Capitalized goodwill is, in principle, written off overa period of ten years for banks and other financialinstitutions and over a period of five years for othercompanies, unless the Board of Directors decidesotherwise. Supplementary or extraordinary amor-tization charges are taken for goodwill if it is nolonger economically justified to keep it in the con-solidated balance sheet at that value because ofchanges in economic circumstances.Differences recorded on the liabilities side remainunchanged, unless the investment is subsequentlysold or compensation is recorded for a positive dif-ference subsequently established with respect to thesame investment.
j Exceptional derogation for the 1998 financialyear
For 1998 (on the creation of the KBC Bank andInsurance Holding Company), the following prin-
Consolidated annual accounts − KBC Bank and Insurance Holding Company NV
KBC Bank & Insurance Group − 2001 Annual Report
87
■ ■ ■ ■ ■ ■ ■ ■ ■ ■
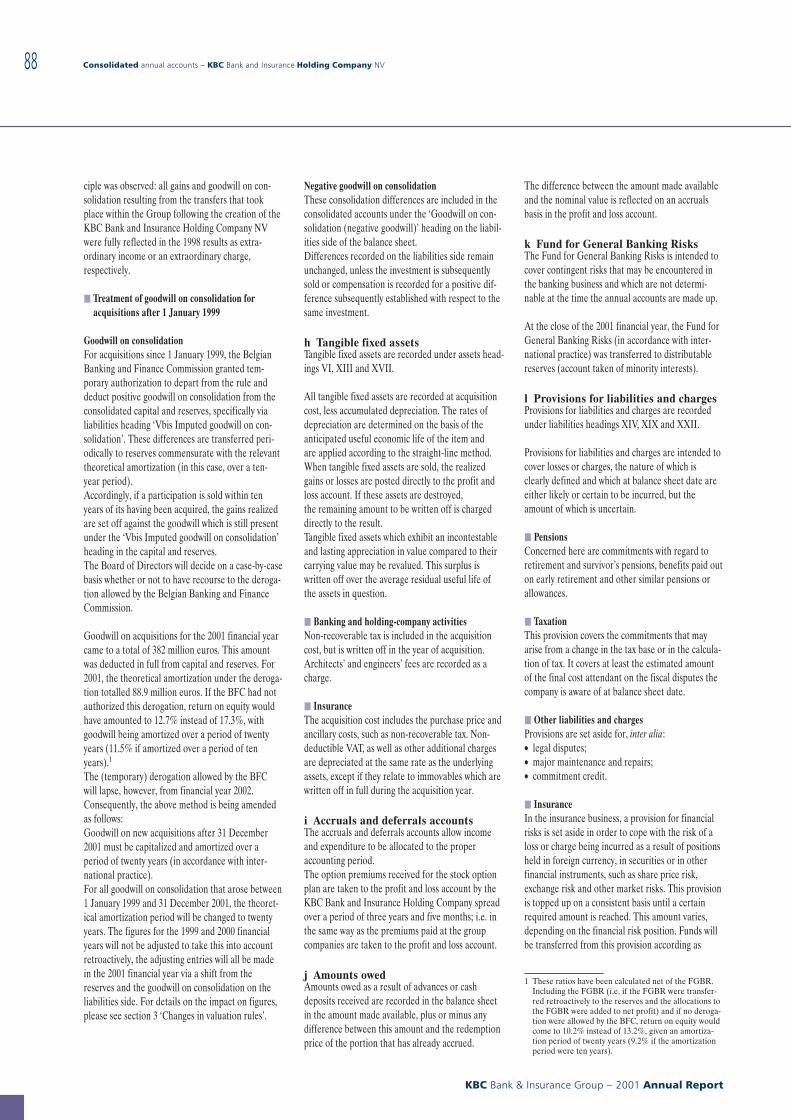
ciple was observed: all gains and goodwill on con-solidation resulting from the transfers that tookplace within the Group following the creation of theKBC Bank and Insurance Holding Company NVwere fully reflected in the 1998 results as extra-ordinary income or an extraordinary charge,respectively.
j Treatment of goodwill on consolidation foracquisitions after 1 January 1999
Goodwill on consolidationFor acquisitions since 1 January 1999, the BelgianBanking and Finance Commission granted tem-porary authorization to depart from the rule anddeduct positive goodwill on consolidation from theconsolidated capital and reserves, specifically vialiabilities heading ‘Vbis Imputed goodwill on con-solidation’. These differences are transferred peri-odically to reserves commensurate with the relevanttheoretical amortization (in this case, over a ten-year period).Accordingly, if a participation is sold within tenyears of its having been acquired, the gains realizedare set off against the goodwill which is still presentunder the ‘Vbis Imputed goodwill on consolidation’heading in the capital and reserves.The Board of Directors will decide on a case-by-casebasis whether or not to have recourse to the deroga-tion allowed by the Belgian Banking and FinanceCommission.
Goodwill on acquisitions for the 2001 financial yearcame to a total of 382 million euros. This amountwas deducted in full from capital and reserves. For2001, the theoretical amortization under the deroga-tion totalled 88.9 million euros. If the BFC had notauthorized this derogation, return on equity wouldhave amounted to 12.7% instead of 17.3%, withgoodwill being amortized over a period of twentyyears (11.5% if amortized over a period of tenyears).1
The (temporary) derogation allowed by the BFCwill lapse, however, from financial year 2002.Consequently, the above method is being amendedas follows:Goodwill on new acquisitions after 31 December2001 must be capitalized and amortized over aperiod of twenty years (in accordance with inter-national practice).For all goodwill on consolidation that arose between1 January 1999 and 31 December 2001, the theoret-ical amortization period will be changed to twentyyears. The figures for the 1999 and 2000 financialyears will not be adjusted to take this into accountretroactively, the adjusting entries will all be madein the 2001 financial year via a shift from thereserves and the goodwill on consolidation on theliabilities side. For details on the impact on figures,please see section 3 ‘Changes in valuation rules’.
Negative goodwill on consolidationThese consolidation differences are included in theconsolidated accounts under the ‘Goodwill on con-solidation (negative goodwill)’ heading on the liabil-ities side of the balance sheet.Differences recorded on the liabilities side remainunchanged, unless the investment is subsequentlysold or compensation is recorded for a positive dif-ference subsequently established with respect to thesame investment.
h Tangible fixed assetsTangible fixed assets are recorded under assets head-ings VI, XIII and XVII.
All tangible fixed assets are recorded at acquisitioncost, less accumulated depreciation. The rates ofdepreciation are determined on the basis of theanticipated useful economic life of the item andare applied according to the straight-line method.When tangible fixed assets are sold, the realizedgains or losses are posted directly to the profit andloss account. If these assets are destroyed,the remaining amount to be written off is chargeddirectly to the result.Tangible fixed assets which exhibit an incontestableand lasting appreciation in value compared to theircarrying value may be revalued. This surplus iswritten off over the average residual useful life ofthe assets in question.
j Banking and holding-company activitiesNon-recoverable tax is included in the acquisitioncost, but is written off in the year of acquisition.Architects’ and engineers’ fees are recorded as acharge.
j InsuranceThe acquisition cost includes the purchase price andancillary costs, such as non-recoverable tax. Non-deductible VAT, as well as other additional chargesare depreciated at the same rate as the underlyingassets, except if they relate to immovables which arewritten off in full during the acquisition year.
i Accruals and deferrals accountsThe accruals and deferrals accounts allow incomeand expenditure to be allocated to the properaccounting period.The option premiums received for the stock optionplan are taken to the profit and loss account by theKBC Bank and Insurance Holding Company spreadover a period of three years and five months; i.e. inthe same way as the premiums paid at the groupcompanies are taken to the profit and loss account.
j Amounts owedAmounts owed as a result of advances or cashdeposits received are recorded in the balance sheetin the amount made available, plus or minus anydifference between this amount and the redemptionprice of the portion that has already accrued.
The difference between the amount made availableand the nominal value is reflected on an accrualsbasis in the profit and loss account.
k Fund for General Banking RisksThe Fund for General Banking Risks is intended tocover contingent risks that may be encountered inthe banking business and which are not determi-nable at the time the annual accounts are made up.
At the close of the 2001 financial year, the Fund forGeneral Banking Risks (in accordance with inter-national practice) was transferred to distributablereserves (account taken of minority interests).
l Provisions for liabilities and chargesProvisions for liabilities and charges are recordedunder liabilities headings XIV, XIX and XXII.
Provisions for liabilities and charges are intended tocover losses or charges, the nature of which isclearly defined and which at balance sheet date areeither likely or certain to be incurred, but theamount of which is uncertain.
j PensionsConcerned here are commitments with regard toretirement and survivor’s pensions, benefits paid outon early retirement and other similar pensions orallowances.
j TaxationThis provision covers the commitments that mayarise from a change in the tax base or in the calcula-tion of tax. It covers at least the estimated amountof the final cost attendant on the fiscal disputes thecompany is aware of at balance sheet date.
j Other liabilities and chargesProvisions are set aside for, inter alia:• legal disputes;• major maintenance and repairs;• commitment credit.
j InsuranceIn the insurance business, a provision for financialrisks is set aside in order to cope with the risk of aloss or charge being incurred as a result of positionsheld in foreign currency, in securities or in otherfinancial instruments, such as share price risk,exchange risk and other market risks. This provisionis topped up on a consistent basis until a certainrequired amount is reached. This amount varies,depending on the financial risk position. Funds willbe transferred from this provision according as
1 These ratios have been calculated net of the FGBR.Including the FGBR (i.e. if the FGBR were transfer-red retroactively to the reserves and the allocations tothe FGBR were added to net profit) and if no deroga-tion were allowed by the BFC, return on equity wouldcome to 10.2% instead of 13.2%, given an amortiza-tion period of twenty years (9.2% if the amortizationperiod were ten years).
Consolidated annual accounts − KBC Bank and Insurance Holding Company NV
KBC Bank & Insurance Group − 2001 Annual Report
88
losses or charges are incurred due to the relevantrisks. For instance, if the recurring income expectedfrom the (listed) share portfolio does not material-ize due to a change in conditions prevailing on themarket, this will mean that a financial risk has beenincurred. The recurring income expected from the(listed) share portfolio is calculated on the basis of anormalized historical return and the normalized his-torical market value of the (listed) share portfolio.
m Contingent tax liabilitiesContingent tax liabilities are recorded under liabil-ities headings XV, XX and XXIII.In the consolidated balance sheet and profit and lossaccount, account is taken of the difference on con-solidation between the taxes to be allocated to thefinancial year and previous financial years and thetaxes paid or still to be paid with respect to thesefinancial years, if there are grounds for assumingthat one of the consolidated companies will indeedincur charges as a result in the foreseeable future.This rule is applied in the adjustment of the valu-ation rules of subsidiaries to bring them into linewith those of the parent company for the purpose ofconsolidation. Where, on balance and per subsid-iary, contingent tax liabilities of a temporary natureresult, these are recorded in the accounts.
n Technical provisionsThe technical provisions are recorded under liabil-ities headings XVI and XVII.For direct business, the provision for unearned pre-miums is, wherever possible, calculated according tothe three-hundred-and-sixty-fifths method.For reinsurance ceded, the provision for unearnedpremiums is calculated according to the contractualstipulations.
For reinsurance business received and retrocession,a rate of 50% of the eligible premiums for the cur-rent financial year is used for the computation.
The life assurance provision is computed accordingto the prevailing actuarial principles. At the consoli-dated level, the following rules apply:• The technical provisions for (i) traditional,
class-21 life assurance and (ii) universal, class-21life assurance offering a guaranteed rate of inter-est on future payments are calculated using pros-pective actuarial formulas applied to basic under-writing assumptions made with regard to the con-tracts.For policies concluded prior to 1 January 1999and for loan balance insurance taken out before1 October 1999, the same rule applies, except asfar as the interest rate is concerned, which in thiscase is 4%.
• The technical provisions for universal, class-21 lifeassurance offering no interest-rate guarantee onfuture payments are calculated using retrospectiveformulas applied to the basic underwritingassumptions underlying the contracts.
For policies concluded prior to 1 January 1999,the same rule applies, except as far as the interestrate is concerned, which in this case is 4%.
• The technical provisions for class-23 (unit-linked)life assurance are computed by multiplying thenumber of units per fund by the price per unit ofthe fund in question.
• The provision for claims outstanding is calculatedper claim or per contract, and is based on knownelements in the file.
• All amounts in the equalization and catastropheprovision are for offsetting the non-recurringunderwriting losses in the years ahead, for equal-izing fluctuations in the loss ratio, as for coveringspecial risks. At the consolidated level, therequired amount this provision should reach hasbeen set aside since the 1998 financial year. Thisamount is calculated using the flat-rate methodsdescribed in the communication entitled ‘Voorzie-ning voor egalisatie en catastrofes’ (Equalizationand Catastrophe Provision) from the BelgianInsurance Supervisory Authority (CDV) D. 151.From financial year 2001, deferred tax assets willbe posted in respect of the equalization andcatastrophe provision.
o Consolidated reservesThe Group reserves include the reserves and theprofit brought forward of the consolidating com-pany, along with the Group’s share in the retainedprofits of the other fully or proportionally consoli-dated companies and of the companies accountedfor using the equity method from the start.
p Minority interestsThese include minority interests in the capital andreserves and in the profit (loss) of the fully consoli-dated companies. Minority interests also include thepreference shares issued via KBC Bank. Theseshares may qualify as tier-1 capital for the purposeof calculating the solvency ratio.
q Financial instrumentsj Valuation rules for trading and non-trading
activitiesWhere trading activities are concerned, the unrea-lized profit or loss on revaluation is recognized atleast at the end of every month. This revaluationtakes into account any results realized from futurecash flows that have already been recognized on anaccruals basis. In the event of a sale, liquidation orexpiration, the profit/loss on the position is recog-nized immediately. Where illiquid currencies orsecurities are concerned, no profit on revaluation isrecognized.The existing strategic positions the dealing roomtakes for its own account via derivatives with a viewto generating a profit on the long term by way ofcapital gains or interest spreads are valued accord-ing to the same principles used for illiquid interestrate positions.
For non-trading activities, where interest rate instru-ments are concerned, the gains or losses realized areonly recognized on an accruals basis over the cor-responding term. The valuation of non-interest-rateinstruments (e.g., share option premiums) matchesthe valuation of the hedged position. In addition,non-trading activities carried out for the purpose ofgeneral, long-term management of interest rate prod-ucts denominated in a foreign currency (macro-hedging) are also valued according to the ‘lower ofcost and market’ principle, along with the associatedon-balance-sheet products. Profit or loss on similartransactions carried out for general EUR ALM inter-est rate management purposes is recognized solelyon an accruals basis.Option premiums that are paid in advance are onlytaken to the profit and loss account on the due dateor on liquidation, with the exception of option pre-miums for caps, floors and collars that have beenconcluded for hedging purposes (accruals-basisrecognition). In the meantime, they are postedunder the ‘Other assets’ or ‘Other liabilities’ items.Option premiums relating to trading activities arerevalued at least at the end of every month.
j Valuation of derivativesAll derivatives are always recorded under specificoff-balance-sheet headings on the transaction date.Amounts are released from the off-balance-sheetheadings once the outcome of the transaction isdefinitive, even if the underlying term only starts atthat time for certain interest rate products (FRAs).
j Valuation of OTC productsProducts that may be traded either OTC or on anexchange are valued in exactly the same way in bothcases.
j Hedging criteria for forward interest rate trans-actions
The general criteria are set out in Article 36bis ofthe Royal Decree on the annual accounts of creditinstitutions of 23 September 1992:• the hedged item or the combination of compar-
able hedged items must expose the credit insti-tution to a risk of interest rate fluctuation;
• the transaction must be recorded in the books as ahedge from its inception;
• there must be a close correlation between fluctu-ations in the value of the hedged item and fluctu-ations in the value of the hedge; in the case ofhedging options, there must be a correlation be-tween fluctuations in the value of the hedged itemand fluctuations in the value of the underlyingfinancial instrument.
In addition, specific company criteria apply.All these criteria are cumulative: if one criterion isno longer satisfied, the hedge will be considered atrading transaction and be subject to the appro-priate accounting treatment.Hedging combinations that involve derivatives andare terminated before maturity will be considered
Consolidated annual accounts − KBC Bank and Insurance Holding Company NV
KBC Bank & Insurance Group − 2001 Annual Report
89
■ ■ ■ ■ ■ ■ ■ ■ ■ ■
trading transactions once the underlying position tobe hedged no longer exists. Future interest ratepositions can be hedged if it is reasonably certainthat the position will actually come about. More-over, the amount, term and interest rate conditionsmust be sufficiently certain.
j Calculation of unrealized profit/loss onrevaluation
Derivatives are always valued on a contract basis;positive and negative valuation differences are notnetted in the accounting records. Only for calcu-lating capital adequacy requirements relative tomarket risks is the market risk calculated on a netbasis per counterparty.For forward interest rate and similar products(namely forward foreign exchange products), valu-ation occurs on the basis of the ‘net present value’ offuture, determinable cash flows using a single yieldcurve per currency, which is used throughout thebank. Any adjustments for operational and liquidityrisks are deducted from the initial revaluation.Options are valued according to the usual valuationmodels. For off-balance-sheet forward interest rateproducts, calculations are always based on theassumption of a liquid market, provided the under-lying currencies are liquid.If a credit granted to a counterparty is classified as‘doubtful’ or ‘irrecoverable’, the receivables andcommitments stemming from off-balance-sheetproducts involving the same counterparty will begiven the same classification. For loans and ad-vances, write-downs may be taken; for commit-ments, provisions will be set aside.
3 Changes in valuation rules
j For all goodwill on consolidation created between1 January 1999 and 31 December 2001, the theor-etical amortization period will be lengthened totwenty years, with all the relevant adjustingentries being made in financial year 2001 (figuresfor the 1999 and 2000 financial years will there-fore not be adjusted retroactively. Consequently,an amount of 76.7 million euros was transferredbetween the reserves and goodwill on consoli-dation on the liabilities side of the balance sheet.
j From financial year 2001, deferred tax assets willbe posted in respect of the equalization andcatastrophe provision. For the current financialyear, these deferred tax assets will amount to 39.5million euros.
j At the close of the 2001 financial year, the Fundfor General Banking Risks (in accordance withinternational practice) was transferred to distrib-utable reserves (account taken of minority inter-ests).
VALUATION OF FINANCIAL INSTRUMENTS
Products Recognition on an accruals basis of fixed(and possible future) charges or income
Release to results of actualincome or expenditure
Additional ‘mark-to-market’ or‘lower of cost and market’ valuation
(general LT interest rate management)
IRS and CIRS hedging + trading + general ST +LT management
- trading + general LT management inforeign currency
FX swaps and FX outrights hedging + trading + general ST management - tradingInterest futures, FRAs, interestoptions and caps and floors
hedging + general ST + LT management trading trading + general LT management inforeign currency
Currency options not applicable hedging + trading hedging + tradingShare options not applicable hedging + trading tradingEquity swaps hedging + trading - trading
Consolidated annual accounts − KBC Bank and Insurance Holding Company NV
KBC Bank & Insurance Group − 2001 Annual Report
90
EXPLANATORY NOTES AND COMMENTS
1 Balance sheet
Note 1: Geographic and monetary breakdown of total assets, banking
GEOGRAPHIC AND MONETARY BREAKDOWN OF TOTAL ASSETS, BANKING
(in thousands of EUR) 31-12-1999 31-12-2000 31-12-2001 Change
Total assets, banking 146 483 052 176 899 008 215 880 978 22.0%
Geographic breakdownBelgium 79 244 666 80 224 120 90 808 106 13.2%Abroad 67 238 386 96 674 888 125 072 872 29.4%
Euro zone 31 010 215 39 792 567 47 799 404 20.1%
Monetary breakdownIn euros 106 033 783 123 282 544 141 255 806 14.6%In foreign currency 40 449 269 53 616 464 74 625 173 39.2%
Note 2: Loans and advances to credit institutions, banking
LOANS AND ADVANCES TO CREDIT INSTITUTIONS, BANKING
(in thousands of EUR) 31-12-1999 31-12-2000 31-12-2001 Change
Total 17 189 064 21 860 314 28 291 266 29.4%Trade bills eligible for refinancing at the central bank of the country in which theinstitution is established
50 716 56 198 47 655 -15.2%
Geographic breakdownBelgium 3 622 683 4 709 937 6 607 831 40.3%Abroad 13 566 381 17 150 377 21 683 435 26.4%
Euro zone 5 563 124 7 292 697 7 037 317 -3.5%
Monetary breakdownIn euros 8 293 535 13 502 566 17 219 087 27.5%In foreign currency 8 895 529 8 357 748 11 072 179 32.5%
Breakdown according to remaining term to maturityRepayable on demand 2 098 366 3 086 184 4 259 807 38.0%With agreed maturity dates or periods of notice 15 090 698 18 774 130 24 031 459 28.0%j not more than three months 9 453 590 10 953 276 15 347 675 40.1%j more than three months but not more than one year 2 801 027 4 563 027 7 059 715 54.7%j more than one year but not more than five years 1 301 508 1 138 914 1 183 441 3.9%j more than five years 186 585 330 418 144 645 -56.2%j undated 1 347 988 1 788 494 295 983 -83.5%
Write-downs and provisions 31-12-2000 31-12-2001(for changes: see Note 4) Belgium Abroad Belgium Abroad
Gross amount outstanding 4 709 937 17 170 509 6 607 831 21 691 732Write-downs and provisions 0 -20 132 0 -8 297Net amount outstanding 4 709 937 17 150 377 6 607 831 21 683 435Details, write-downs and provisionsSpecific write-downs for loans and advances with an uncertain outcome 0 -5 644 0 -4 662General provision for country risks 0 -14 488 0 -3 635
Consolidated annual accounts − KBC Bank and Insurance Holding Company NV
KBC Bank & Insurance Group − 2001 Annual Report
91
■ ■ ■ ■ ■ ■ ■ ■ ■ ■
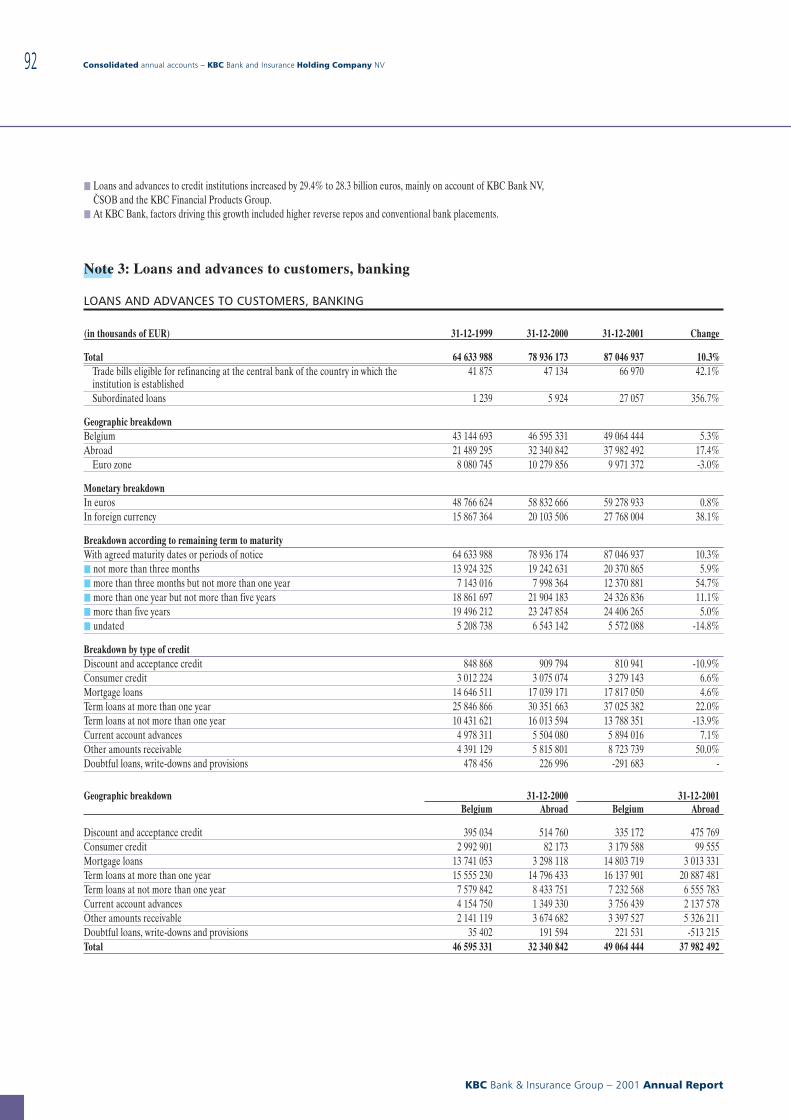
j Loans and advances to credit institutions increased by 29.4% to 28.3 billion euros, mainly on account of KBC Bank NV,C{SOB and the KBC Financial Products Group.
j At KBC Bank, factors driving this growth included higher reverse repos and conventional bank placements.
Note 3: Loans and advances to customers, banking
LOANS AND ADVANCES TO CUSTOMERS, BANKING
(in thousands of EUR) 31-12-1999 31-12-2000 31-12-2001 Change
Total 64 633 988 78 936 173 87 046 937 10.3%Trade bills eligible for refinancing at the central bank of the country in which theinstitution is established
41 875 47 134 66 970 42.1%
Subordinated loans 1 239 5 924 27 057 356.7%
Geographic breakdownBelgium 43 144 693 46 595 331 49 064 444 5.3%Abroad 21 489 295 32 340 842 37 982 492 17.4%
Euro zone 8 080 745 10 279 856 9 971 372 -3.0%
Monetary breakdownIn euros 48 766 624 58 832 666 59 278 933 0.8%In foreign currency 15 867 364 20 103 506 27 768 004 38.1%
Breakdown according to remaining term to maturityWith agreed maturity dates or periods of notice 64 633 988 78 936 174 87 046 937 10.3%j not more than three months 13 924 325 19 242 631 20 370 865 5.9%j more than three months but not more than one year 7 143 016 7 998 364 12 370 881 54.7%j more than one year but not more than five years 18 861 697 21 904 183 24 326 836 11.1%j more than five years 19 496 212 23 247 854 24 406 265 5.0%j undated 5 208 738 6 543 142 5 572 088 -14.8%
Breakdown by type of creditDiscount and acceptance credit 848 868 909 794 810 941 -10.9%Consumer credit 3 012 224 3 075 074 3 279 143 6.6%Mortgage loans 14 646 511 17 039 171 17 817 050 4.6%Term loans at more than one year 25 846 866 30 351 663 37 025 382 22.0%Term loans at not more than one year 10 431 621 16 013 594 13 788 351 -13.9%Current account advances 4 978 311 5 504 080 5 894 016 7.1%Other amounts receivable 4 391 129 5 815 801 8 723 739 50.0%Doubtful loans, write-downs and provisions 478 456 226 996 -291 683 -
Geographic breakdown 31-12-2000 31-12-2001Belgium Abroad Belgium Abroad
Discount and acceptance credit 395 034 514 760 335 172 475 769Consumer credit 2 992 901 82 173 3 179 588 99 555Mortgage loans 13 741 053 3 298 118 14 803 719 3 013 331Term loans at more than one year 15 555 230 14 796 433 16 137 901 20 887 481Term loans at not more than one year 7 579 842 8 433 751 7 232 568 6 555 783Current account advances 4 154 750 1 349 330 3 756 439 2 137 578Other amounts receivable 2 141 119 3 674 682 3 397 527 5 326 211Doubtful loans, write-downs and provisions 35 402 191 594 221 531 -513 215Total 46 595 331 32 340 842 49 064 444 37 982 492
Consolidated annual accounts − KBC Bank and Insurance Holding Company NV
KBC Bank & Insurance Group − 2001 Annual Report
92
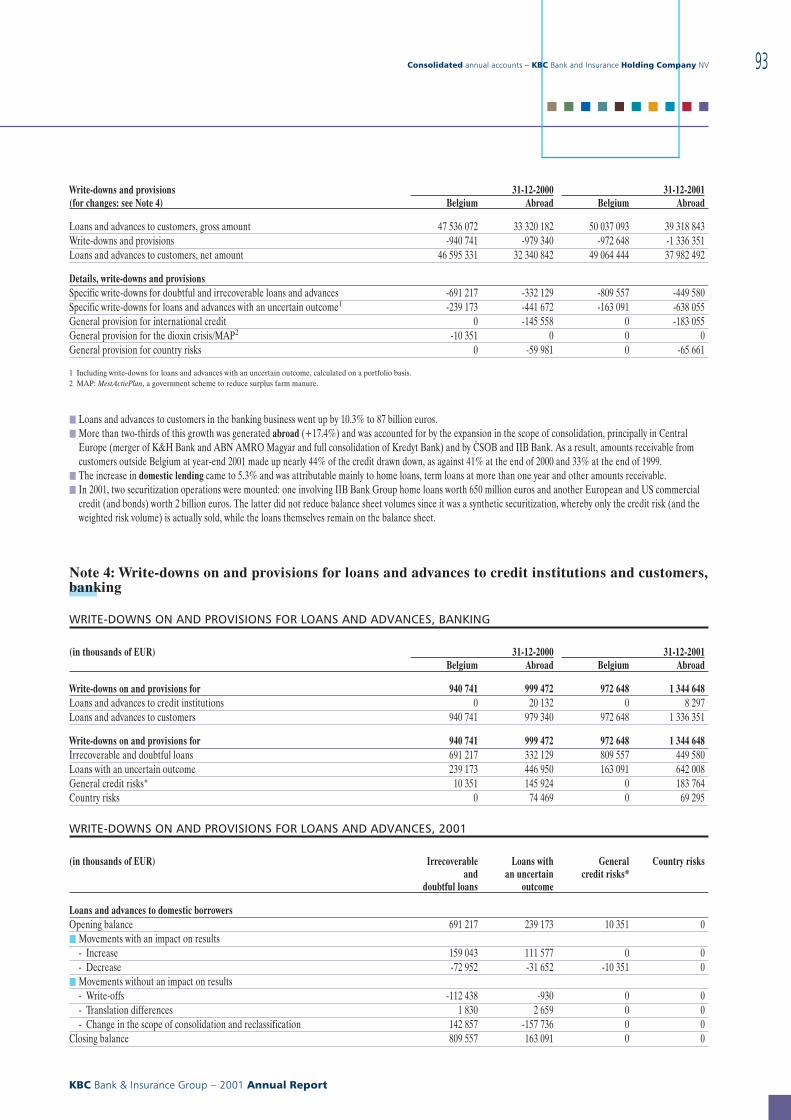
Write-downs and provisions 31-12-2000 31-12-2001(for changes: see Note 4) Belgium Abroad Belgium Abroad
Loans and advances to customers, gross amount 47 536 072 33 320 182 50 037 093 39 318 843Write-downs and provisions -940 741 -979 340 -972 648 -1 336 351Loans and advances to customers, net amount 46 595 331 32 340 842 49 064 444 37 982 492
Details, write-downs and provisionsSpecific write-downs for doubtful and irrecoverable loans and advances -691 217 -332 129 -809 557 -449 580Specific write-downs for loans and advances with an uncertain outcome1 -239 173 -441 672 -163 091 -638 055General provision for international credit 0 -145 558 0 -183 055General provision for the dioxin crisis/MAP2 -10 351 0 0 0General provision for country risks 0 -59 981 0 -65 661
1 Including write-downs for loans and advances with an uncertain outcome, calculated on a portfolio basis.2 MAP: MestActiePlan, a government scheme to reduce surplus farm manure.
j Loans and advances to customers in the banking business went up by 10.3% to 87 billion euros.j More than two-thirds of this growth was generated abroad (+17.4%) and was accounted for by the expansion in the scope of consolidation, principally in Central
Europe (merger of K&H Bank and ABN AMRO Magyar and full consolidation of Kredyt Bank) and by C{SOB and IIB Bank. As a result, amounts receivable fromcustomers outside Belgium at year-end 2001 made up nearly 44% of the credit drawn down, as against 41% at the end of 2000 and 33% at the end of 1999.
j The increase in domestic lending came to 5.3% and was attributable mainly to home loans, term loans at more than one year and other amounts receivable.j In 2001, two securitization operations were mounted: one involving IIB Bank Group home loans worth 650 million euros and another European and US commercial
credit (and bonds) worth 2 billion euros. The latter did not reduce balance sheet volumes since it was a synthetic securitization, whereby only the credit risk (and theweighted risk volume) is actually sold, while the loans themselves remain on the balance sheet.
Note 4: Write-downs on and provisions for loans and advances to credit institutions and customers,banking
WRITE-DOWNS ON AND PROVISIONS FOR LOANS AND ADVANCES, BANKING
(in thousands of EUR) 31-12-2000 31-12-2001Belgium Abroad Belgium Abroad
Write-downs on and provisions for 940 741 999 472 972 648 1 344 648Loans and advances to credit institutions 0 20 132 0 8 297Loans and advances to customers 940 741 979 340 972 648 1 336 351
Write-downs on and provisions for 940 741 999 472 972 648 1 344 648Irrecoverable and doubtful loans 691 217 332 129 809 557 449 580Loans with an uncertain outcome 239 173 446 950 163 091 642 008General credit risks* 10 351 145 924 0 183 764Country risks 0 74 469 0 69 295
WRITE-DOWNS ON AND PROVISIONS FOR LOANS AND ADVANCES, 2001
(in thousands of EUR) Irrecoverableand
doubtful loans
Loans withan uncertain
outcome
Generalcredit risks*
Country risks
Loans and advances to domestic borrowersOpening balance 691 217 239 173 10 351 0j Movements with an impact on results
- Increase 159 043 111 577 0 0- Decrease -72 952 -31 652 -10 351 0
j Movements without an impact on results- Write-offs -112 438 -930 0 0- Translation differences 1 830 2 659 0 0- Change in the scope of consolidation and reclassification 142 857 -157 736 0 0
Closing balance 809 557 163 091 0 0
Consolidated annual accounts − KBC Bank and Insurance Holding Company NV
KBC Bank & Insurance Group − 2001 Annual Report
93
■ ■ ■ ■ ■ ■ ■ ■ ■ ■
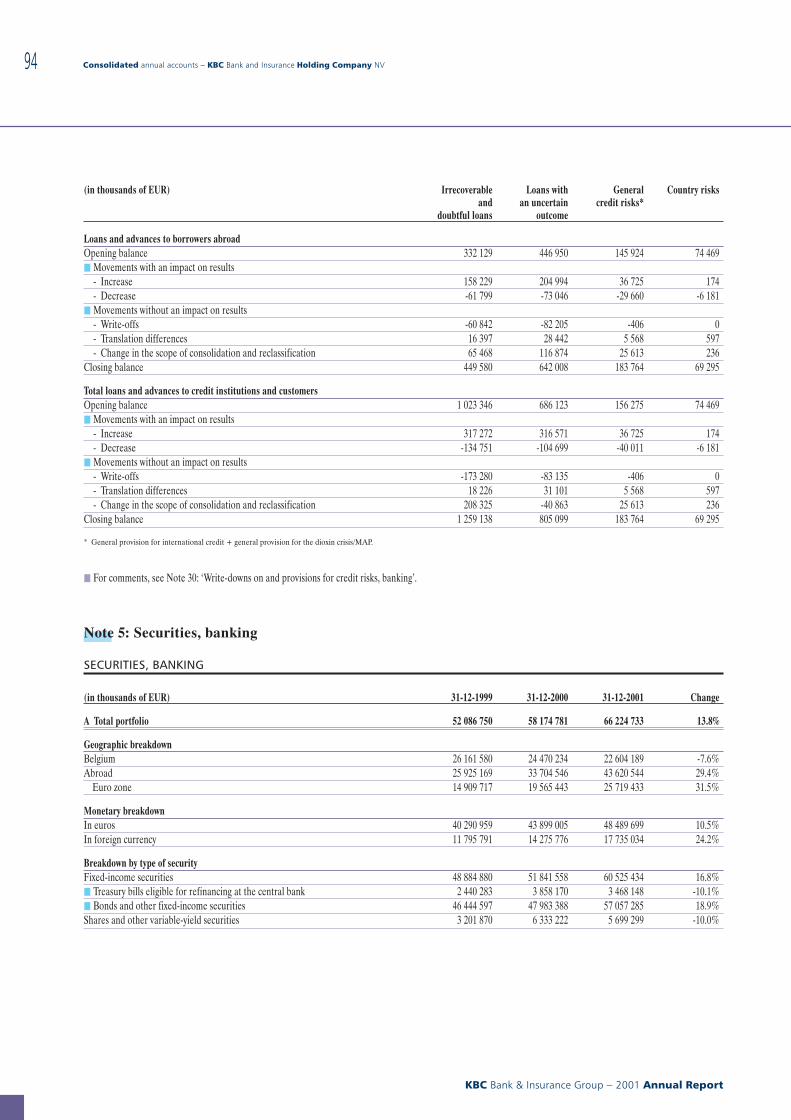
(in thousands of EUR) Irrecoverableand
doubtful loans
Loans withan uncertain
outcome
Generalcredit risks*
Country risks
Loans and advances to borrowers abroadOpening balance 332 129 446 950 145 924 74 469j Movements with an impact on results
- Increase 158 229 204 994 36 725 174- Decrease -61 799 -73 046 -29 660 -6 181
j Movements without an impact on results- Write-offs -60 842 -82 205 -406 0- Translation differences 16 397 28 442 5 568 597- Change in the scope of consolidation and reclassification 65 468 116 874 25 613 236
Closing balance 449 580 642 008 183 764 69 295
Total loans and advances to credit institutions and customersOpening balance 1 023 346 686 123 156 275 74 469j Movements with an impact on results
- Increase 317 272 316 571 36 725 174- Decrease -134 751 -104 699 -40 011 -6 181
j Movements without an impact on results- Write-offs -173 280 -83 135 -406 0- Translation differences 18 226 31 101 5 568 597- Change in the scope of consolidation and reclassification 208 325 -40 863 25 613 236
Closing balance 1 259 138 805 099 183 764 69 295
* General provision for international credit + general provision for the dioxin crisis/MAP.
j For comments, see Note 30: ‘Write-downs on and provisions for credit risks, banking’.
Note 5: Securities, banking
SECURITIES, BANKING
(in thousands of EUR) 31-12-1999 31-12-2000 31-12-2001 Change
A Total portfolio 52 086 750 58 174 781 66 224 733 13.8%
Geographic breakdownBelgium 26 161 580 24 470 234 22 604 189 -7.6%Abroad 25 925 169 33 704 546 43 620 544 29.4%
Euro zone 14 909 717 19 565 443 25 719 433 31.5%
Monetary breakdownIn euros 40 290 959 43 899 005 48 489 699 10.5%In foreign currency 11 795 791 14 275 776 17 735 034 24.2%
Breakdown by type of securityFixed-income securities 48 884 880 51 841 558 60 525 434 16.8%j Treasury bills eligible for refinancing at the central bank 2 440 283 3 858 170 3 468 148 -10.1%j Bonds and other fixed-income securities 46 444 597 47 983 388 57 057 285 18.9%Shares and other variable-yield securities 3 201 870 6 333 222 5 699 299 -10.0%
Consolidated annual accounts − KBC Bank and Insurance Holding Company NV
KBC Bank & Insurance Group − 2001 Annual Report
94
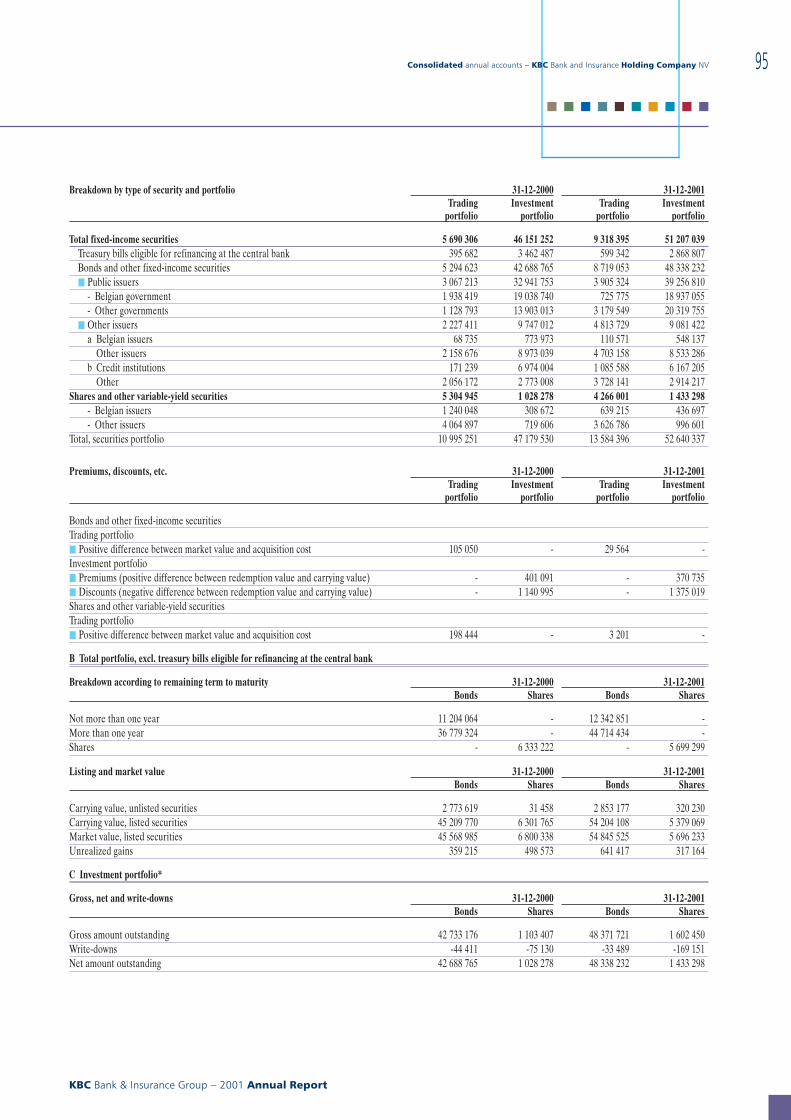
Breakdown by type of security and portfolio 31-12-2000 31-12-2001Trading
portfolioInvestment
portfolioTrading
portfolioInvestment
portfolio
Total fixed-income securities 5 690 306 46 151 252 9 318 395 51 207 039Treasury bills eligible for refinancing at the central bank 395 682 3 462 487 599 342 2 868 807Bonds and other fixed-income securities 5 294 623 42 688 765 8 719 053 48 338 232j Public issuers 3 067 213 32 941 753 3 905 324 39 256 810
- Belgian government 1 938 419 19 038 740 725 775 18 937 055- Other governments 1 128 793 13 903 013 3 179 549 20 319 755
j Other issuers 2 227 411 9 747 012 4 813 729 9 081 422a Belgian issuers 68 735 773 973 110 571 548 137
Other issuers 2 158 676 8 973 039 4 703 158 8 533 286b Credit institutions 171 239 6 974 004 1 085 588 6 167 205
Other 2 056 172 2 773 008 3 728 141 2 914 217Shares and other variable-yield securities 5 304 945 1 028 278 4 266 001 1 433 298
- Belgian issuers 1 240 048 308 672 639 215 436 697- Other issuers 4 064 897 719 606 3 626 786 996 601
Total, securities portfolio 10 995 251 47 179 530 13 584 396 52 640 337
Premiums, discounts, etc. 31-12-2000 31-12-2001Trading
portfolioInvestment
portfolioTrading
portfolioInvestment
portfolio
Bonds and other fixed-income securitiesTrading portfolioj Positive difference between market value and acquisition cost 105 050 - 29 564 -Investment portfolioj Premiums (positive difference between redemption value and carrying value) - 401 091 - 370 735j Discounts (negative difference between redemption value and carrying value) - 1 140 995 - 1 375 019Shares and other variable-yield securitiesTrading portfolioj Positive difference between market value and acquisition cost 198 444 - 3 201 -
B Total portfolio, excl. treasury bills eligible for refinancing at the central bank
Breakdown according to remaining term to maturity 31-12-2000 31-12-2001Bonds Shares Bonds Shares
Not more than one year 11 204 064 - 12 342 851 -More than one year 36 779 324 - 44 714 434 -Shares - 6 333 222 - 5 699 299
Listing and market value 31-12-2000 31-12-2001Bonds Shares Bonds Shares
Carrying value, unlisted securities 2 773 619 31 458 2 853 177 320 230Carrying value, listed securities 45 209 770 6 301 765 54 204 108 5 379 069Market value, listed securities 45 568 985 6 800 338 54 845 525 5 696 233Unrealized gains 359 215 498 573 641 417 317 164
C Investment portfolio*
Gross, net and write-downs 31-12-2000 31-12-2001Bonds Shares Bonds Shares
Gross amount outstanding 42 733 176 1 103 407 48 371 721 1 602 450Write-downs -44 411 -75 130 -33 489 -169 151Net amount outstanding 42 688 765 1 028 278 48 338 232 1 433 298
Consolidated annual accounts − KBC Bank and Insurance Holding Company NV
KBC Bank & Insurance Group − 2001 Annual Report
95
■ ■ ■ ■ ■ ■ ■ ■ ■ ■
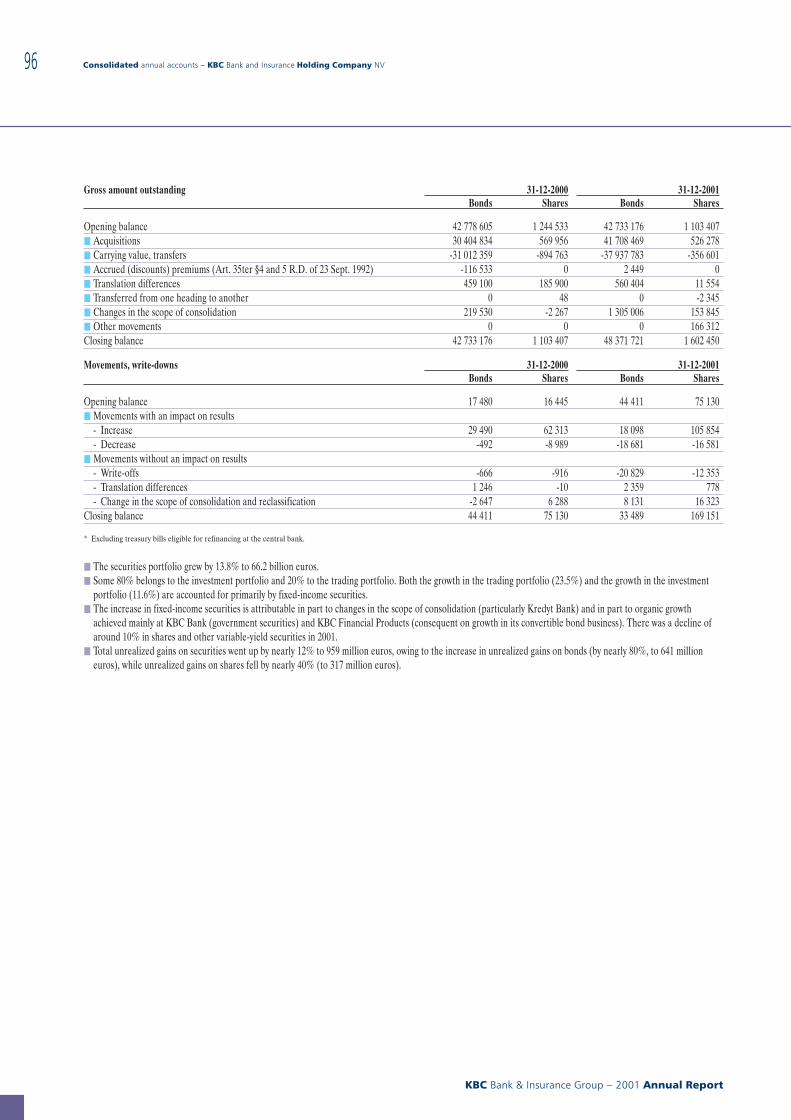
Gross amount outstanding 31-12-2000 31-12-2001Bonds Shares Bonds Shares
Opening balance 42 778 605 1 244 533 42 733 176 1 103 407j Acquisitions 30 404 834 569 956 41 708 469 526 278j Carrying value, transfers -31 012 359 -894 763 -37 937 783 -356 601j Accrued (discounts) premiums (Art. 35ter §4 and 5 R.D. of 23 Sept. 1992) -116 533 0 2 449 0j Translation differences 459 100 185 900 560 404 11 554j Transferred from one heading to another 0 48 0 -2 345j Changes in the scope of consolidation 219 530 -2 267 1 305 006 153 845j Other movements 0 0 0 166 312Closing balance 42 733 176 1 103 407 48 371 721 1 602 450
Movements, write-downs 31-12-2000 31-12-2001Bonds Shares Bonds Shares
Opening balance 17 480 16 445 44 411 75 130j Movements with an impact on results
- Increase 29 490 62 313 18 098 105 854- Decrease -492 -8 989 -18 681 -16 581
j Movements without an impact on results- Write-offs -666 -916 -20 829 -12 353- Translation differences 1 246 -10 2 359 778- Change in the scope of consolidation and reclassification -2 647 6 288 8 131 16 323
Closing balance 44 411 75 130 33 489 169 151
* Excluding treasury bills eligible for refinancing at the central bank.
j The securities portfolio grew by 13.8% to 66.2 billion euros.j Some 80% belongs to the investment portfolio and 20% to the trading portfolio. Both the growth in the trading portfolio (23.5%) and the growth in the investment
portfolio (11.6%) are accounted for primarily by fixed-income securities.j The increase in fixed-income securities is attributable in part to changes in the scope of consolidation (particularly Kredyt Bank) and in part to organic growth
achieved mainly at KBC Bank (government securities) and KBC Financial Products (consequent on growth in its convertible bond business). There was a decline ofaround 10% in shares and other variable-yield securities in 2001.
j Total unrealized gains on securities went up by nearly 12% to 959 million euros, owing to the increase in unrealized gains on bonds (by nearly 80%, to 641 millioneuros), while unrealized gains on shares fell by nearly 40% (to 317 million euros).
Consolidated annual accounts − KBC Bank and Insurance Holding Company NV
KBC Bank & Insurance Group − 2001 Annual Report
96
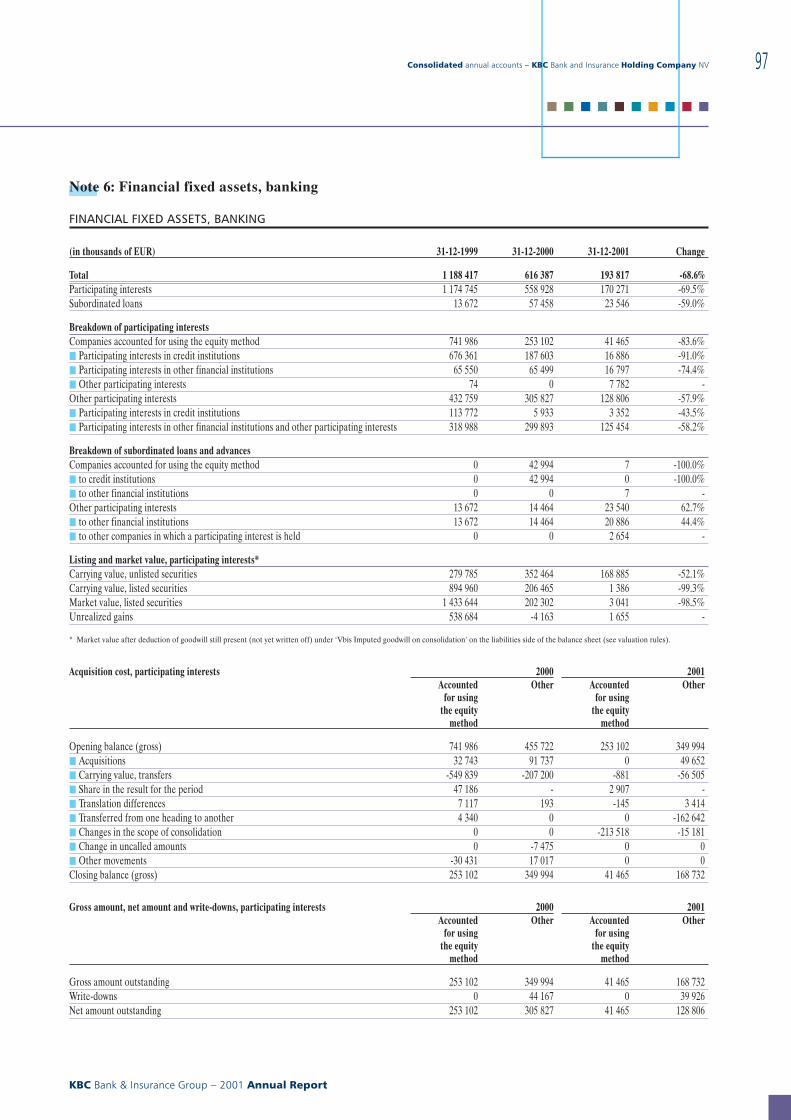
Note 6: Financial fixed assets, banking
FINANCIAL FIXED ASSETS, BANKING
(in thousands of EUR) 31-12-1999 31-12-2000 31-12-2001 Change
Total 1 188 417 616 387 193 817 -68.6%Participating interests 1 174 745 558 928 170 271 -69.5%Subordinated loans 13 672 57 458 23 546 -59.0%
Breakdown of participating interestsCompanies accounted for using the equity method 741 986 253 102 41 465 -83.6%j Participating interests in credit institutions 676 361 187 603 16 886 -91.0%j Participating interests in other financial institutions 65 550 65 499 16 797 -74.4%j Other participating interests 74 0 7 782 -Other participating interests 432 759 305 827 128 806 -57.9%j Participating interests in credit institutions 113 772 5 933 3 352 -43.5%j Participating interests in other financial institutions and other participating interests 318 988 299 893 125 454 -58.2%
Breakdown of subordinated loans and advancesCompanies accounted for using the equity method 0 42 994 7 -100.0%j to credit institutions 0 42 994 0 -100.0%j to other financial institutions 0 0 7 -Other participating interests 13 672 14 464 23 540 62.7%j to other financial institutions 13 672 14 464 20 886 44.4%j to other companies in which a participating interest is held 0 0 2 654 -
Listing and market value, participating interests*Carrying value, unlisted securities 279 785 352 464 168 885 -52.1%Carrying value, listed securities 894 960 206 465 1 386 -99.3%Market value, listed securities 1 433 644 202 302 3 041 -98.5%Unrealized gains 538 684 -4 163 1 655 -
* Market value after deduction of goodwill still present (not yet written off) under ‘Vbis Imputed goodwill on consolidation’ on the liabilities side of the balance sheet (see valuation rules).
Acquisition cost, participating interests 2000 2001Accounted
for usingthe equity
method
Other Accountedfor using
the equitymethod
Other
Opening balance (gross) 741 986 455 722 253 102 349 994j Acquisitions 32 743 91 737 0 49 652j Carrying value, transfers -549 839 -207 200 -881 -56 505j Share in the result for the period 47 186 - 2 907 -j Translation differences 7 117 193 -145 3 414j Transferred from one heading to another 4 340 0 0 -162 642j Changes in the scope of consolidation 0 0 -213 518 -15 181j Change in uncalled amounts 0 -7 475 0 0j Other movements -30 431 17 017 0 0Closing balance (gross) 253 102 349 994 41 465 168 732
Gross amount, net amount and write-downs, participating interests 2000 2001Accounted
for usingthe equity
method
Other Accountedfor using
the equitymethod
Other
Gross amount outstanding 253 102 349 994 41 465 168 732Write-downs 0 44 167 0 39 926Net amount outstanding 253 102 305 827 41 465 128 806
Consolidated annual accounts − KBC Bank and Insurance Holding Company NV
KBC Bank & Insurance Group − 2001 Annual Report
97
■ ■ ■ ■ ■ ■ ■ ■ ■ ■
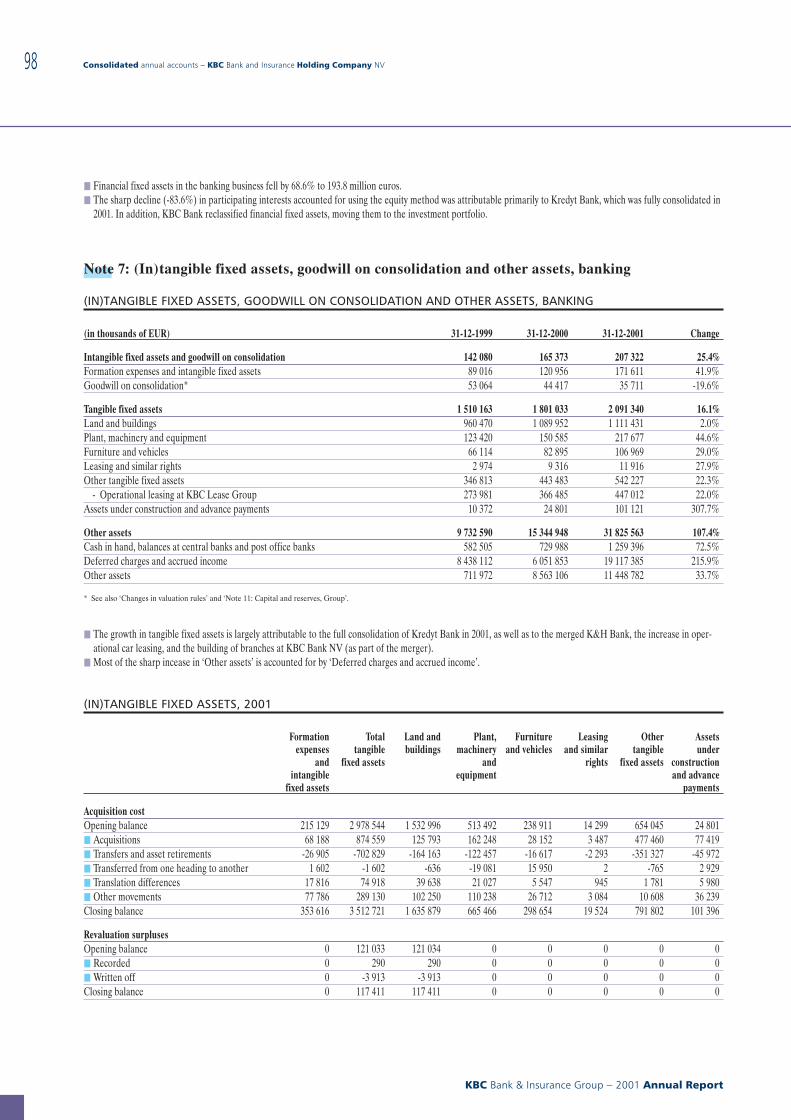
j Financial fixed assets in the banking business fell by 68.6% to 193.8 million euros.j The sharp decline (-83.6%) in participating interests accounted for using the equity method was attributable primarily to Kredyt Bank, which was fully consolidated in
2001. In addition, KBC Bank reclassified financial fixed assets, moving them to the investment portfolio.
Note 7: (In)tangible fixed assets, goodwill on consolidation and other assets, banking
(IN)TANGIBLE FIXED ASSETS, GOODWILL ON CONSOLIDATION AND OTHER ASSETS, BANKING
(in thousands of EUR) 31-12-1999 31-12-2000 31-12-2001 Change
Intangible fixed assets and goodwill on consolidation 142 080 165 373 207 322 25.4%Formation expenses and intangible fixed assets 89 016 120 956 171 611 41.9%Goodwill on consolidation* 53 064 44 417 35 711 -19.6%
Tangible fixed assets 1 510 163 1 801 033 2 091 340 16.1%Land and buildings 960 470 1 089 952 1 111 431 2.0%Plant, machinery and equipment 123 420 150 585 217 677 44.6%Furniture and vehicles 66 114 82 895 106 969 29.0%Leasing and similar rights 2 974 9 316 11 916 27.9%Other tangible fixed assets 346 813 443 483 542 227 22.3%
- Operational leasing at KBC Lease Group 273 981 366 485 447 012 22.0%Assets under construction and advance payments 10 372 24 801 101 121 307.7%
Other assets 9 732 590 15 344 948 31 825 563 107.4%Cash in hand, balances at central banks and post office banks 582 505 729 988 1 259 396 72.5%Deferred charges and accrued income 8 438 112 6 051 853 19 117 385 215.9%Other assets 711 972 8 563 106 11 448 782 33.7%
* See also ‘Changes in valuation rules’ and ‘Note 11: Capital and reserves, Group’.
j The growth in tangible fixed assets is largely attributable to the full consolidation of Kredyt Bank in 2001, as well as to the merged K&H Bank, the increase in oper-ational car leasing, and the building of branches at KBC Bank NV (as part of the merger).
j Most of the sharp incease in ‘Other assets’ is accounted for by ‘Deferred charges and accrued income’.
(IN)TANGIBLE FIXED ASSETS, 2001
Formationexpenses
andintangible
fixed assets
Totaltangible
fixed assets
Land andbuildings
Plant,machinery
andequipment
Furnitureand vehicles
Leasingand similar
rights
Othertangible
fixed assets
Assetsunder
constructionand advance
payments
Acquisition costOpening balance 215 129 2 978 544 1 532 996 513 492 238 911 14 299 654 045 24 801j Acquisitions 68 188 874 559 125 793 162 248 28 152 3 487 477 460 77 419j Transfers and asset retirements -26 905 -702 829 -164 163 -122 457 -16 617 -2 293 -351 327 -45 972j Transferred from one heading to another 1 602 -1 602 -636 -19 081 15 950 2 -765 2 929j Translation differences 17 816 74 918 39 638 21 027 5 547 945 1 781 5 980j Other movements 77 786 289 130 102 250 110 238 26 712 3 084 10 608 36 239Closing balance 353 616 3 512 721 1 635 879 665 466 298 654 19 524 791 802 101 396
Revaluation surplusesOpening balance 0 121 033 121 034 0 0 0 0 0j Recorded 0 290 290 0 0 0 0 0j Written off 0 -3 913 -3 913 0 0 0 0 0Closing balance 0 117 411 117 411 0 0 0 0 0
Consolidated annual accounts − KBC Bank and Insurance Holding Company NV
KBC Bank & Insurance Group − 2001 Annual Report
98
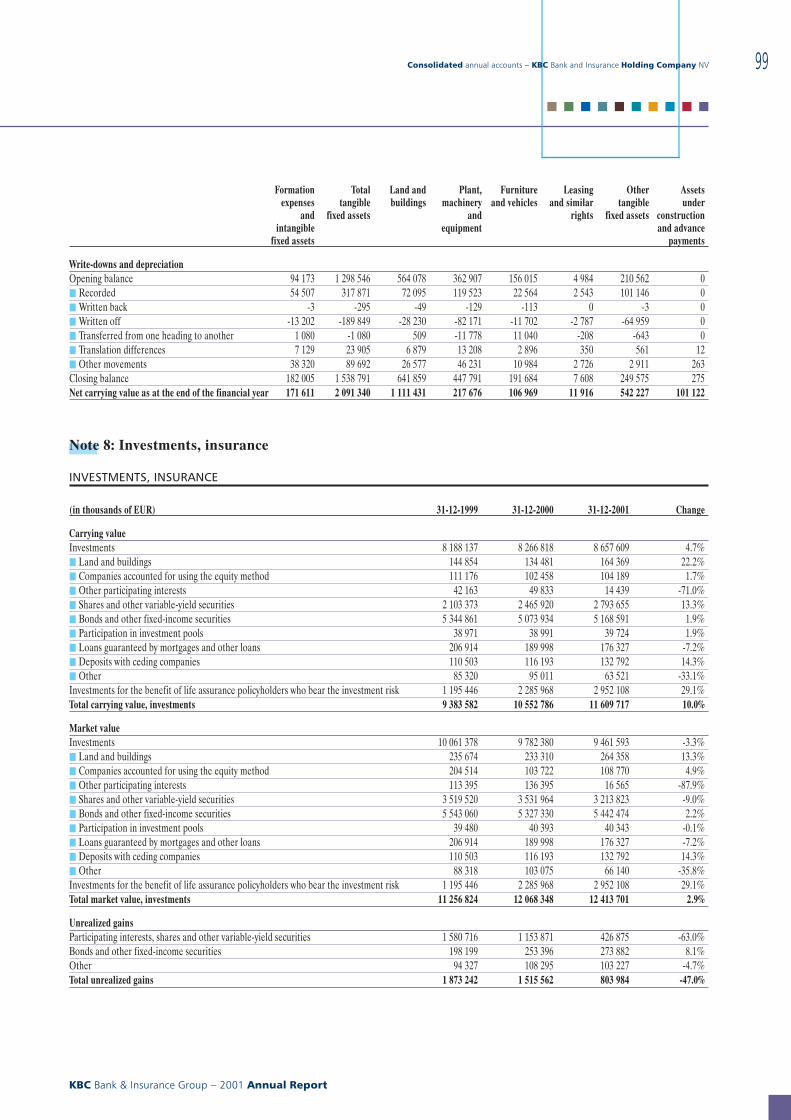
Formationexpenses
andintangible
fixed assets
Totaltangible
fixed assets
Land andbuildings
Plant,machinery
andequipment
Furnitureand vehicles
Leasingand similar
rights
Othertangible
fixed assets
Assetsunder
constructionand advance
payments
Write-downs and depreciationOpening balance 94 173 1 298 546 564 078 362 907 156 015 4 984 210 562 0j Recorded 54 507 317 871 72 095 119 523 22 564 2 543 101 146 0j Written back -3 -295 -49 -129 -113 0 -3 0j Written off -13 202 -189 849 -28 230 -82 171 -11 702 -2 787 -64 959 0j Transferred from one heading to another 1 080 -1 080 509 -11 778 11 040 -208 -643 0j Translation differences 7 129 23 905 6 879 13 208 2 896 350 561 12j Other movements 38 320 89 692 26 577 46 231 10 984 2 726 2 911 263Closing balance 182 005 1 538 791 641 859 447 791 191 684 7 608 249 575 275Net carrying value as at the end of the financial year 171 611 2 091 340 1 111 431 217 676 106 969 11 916 542 227 101 122
Note 8: Investments, insurance
INVESTMENTS, INSURANCE
(in thousands of EUR) 31-12-1999 31-12-2000 31-12-2001 Change
Carrying valueInvestments 8 188 137 8 266 818 8 657 609 4.7%j Land and buildings 144 854 134 481 164 369 22.2%j Companies accounted for using the equity method 111 176 102 458 104 189 1.7%j Other participating interests 42 163 49 833 14 439 -71.0%j Shares and other variable-yield securities 2 103 373 2 465 920 2 793 655 13.3%j Bonds and other fixed-income securities 5 344 861 5 073 934 5 168 591 1.9%j Participation in investment pools 38 971 38 991 39 724 1.9%j Loans guaranteed by mortgages and other loans 206 914 189 998 176 327 -7.2%j Deposits with ceding companies 110 503 116 193 132 792 14.3%j Other 85 320 95 011 63 521 -33.1%Investments for the benefit of life assurance policyholders who bear the investment risk 1 195 446 2 285 968 2 952 108 29.1%Total carrying value, investments 9 383 582 10 552 786 11 609 717 10.0%
Market valueInvestments 10 061 378 9 782 380 9 461 593 -3.3%j Land and buildings 235 674 233 310 264 358 13.3%j Companies accounted for using the equity method 204 514 103 722 108 770 4.9%j Other participating interests 113 395 136 395 16 565 -87.9%j Shares and other variable-yield securities 3 519 520 3 531 964 3 213 823 -9.0%j Bonds and other fixed-income securities 5 543 060 5 327 330 5 442 474 2.2%j Participation in investment pools 39 480 40 393 40 343 -0.1%j Loans guaranteed by mortgages and other loans 206 914 189 998 176 327 -7.2%j Deposits with ceding companies 110 503 116 193 132 792 14.3%j Other 88 318 103 075 66 140 -35.8%Investments for the benefit of life assurance policyholders who bear the investment risk 1 195 446 2 285 968 2 952 108 29.1%Total market value, investments 11 256 824 12 068 348 12 413 701 2.9%
Unrealized gainsParticipating interests, shares and other variable-yield securities 1 580 716 1 153 871 426 875 -63.0%Bonds and other fixed-income securities 198 199 253 396 273 882 8.1%Other 94 327 108 295 103 227 -4.7%Total unrealized gains 1 873 242 1 515 562 803 984 -47.0%
Consolidated annual accounts − KBC Bank and Insurance Holding Company NV
KBC Bank & Insurance Group − 2001 Annual Report
99
■ ■ ■ ■ ■ ■ ■ ■ ■ ■
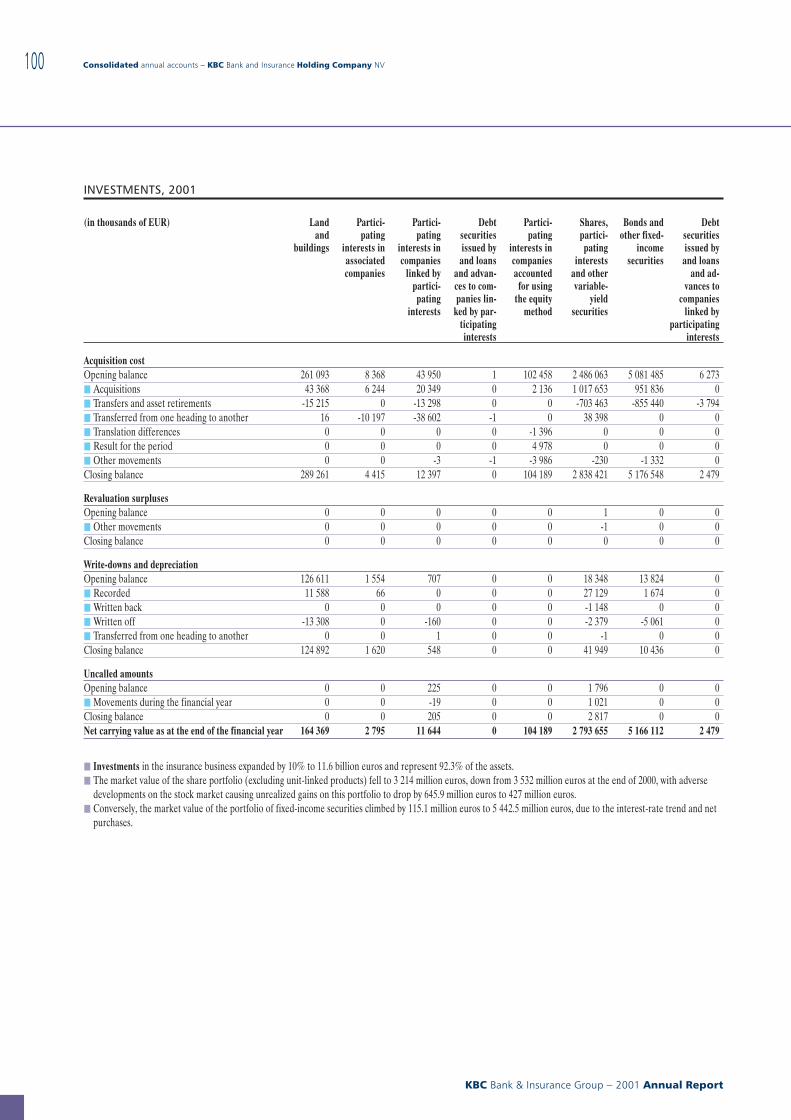
INVESTMENTS, 2001
(in thousands of EUR) Landand
buildings
Partici-pating
interests inassociatedcompanies
Partici-pating
interests incompanies
linked bypartici-pating
interests
Debtsecuritiesissued byand loans
and advan-ces to com-panies lin-
ked by par-ticipatinginterests
Partici-pating
interests incompaniesaccounted
for usingthe equity
method
Shares,partici-pating
interestsand othervariable-
yieldsecurities
Bonds andother fixed-
incomesecurities
Debtsecuritiesissued byand loans
and ad-vances to
companieslinked by
participatinginterests
Acquisition costOpening balance 261 093 8 368 43 950 1 102 458 2 486 063 5 081 485 6 273j Acquisitions 43 368 6 244 20 349 0 2 136 1 017 653 951 836 0j Transfers and asset retirements -15 215 0 -13 298 0 0 -703 463 -855 440 -3 794j Transferred from one heading to another 16 -10 197 -38 602 -1 0 38 398 0 0j Translation differences 0 0 0 0 -1 396 0 0 0j Result for the period 0 0 0 0 4 978 0 0 0j Other movements 0 0 -3 -1 -3 986 -230 -1 332 0Closing balance 289 261 4 415 12 397 0 104 189 2 838 421 5 176 548 2 479
Revaluation surplusesOpening balance 0 0 0 0 0 1 0 0j Other movements 0 0 0 0 0 -1 0 0Closing balance 0 0 0 0 0 0 0 0
Write-downs and depreciationOpening balance 126 611 1 554 707 0 0 18 348 13 824 0j Recorded 11 588 66 0 0 0 27 129 1 674 0j Written back 0 0 0 0 0 -1 148 0 0j Written off -13 308 0 -160 0 0 -2 379 -5 061 0j Transferred from one heading to another 0 0 1 0 0 -1 0 0Closing balance 124 892 1 620 548 0 0 41 949 10 436 0
Uncalled amountsOpening balance 0 0 225 0 0 1 796 0 0j Movements during the financial year 0 0 -19 0 0 1 021 0 0Closing balance 0 0 205 0 0 2 817 0 0Net carrying value as at the end of the financial year 164 369 2 795 11 644 0 104 189 2 793 655 5 166 112 2 479
j Investments in the insurance business expanded by 10% to 11.6 billion euros and represent 92.3% of the assets.j The market value of the share portfolio (excluding unit-linked products) fell to 3 214 million euros, down from 3 532 million euros at the end of 2000, with adverse
developments on the stock market causing unrealized gains on this portfolio to drop by 645.9 million euros to 427 million euros.j Conversely, the market value of the portfolio of fixed-income securities climbed by 115.1 million euros to 5 442.5 million euros, due to the interest-rate trend and net
purchases.
Consolidated annual accounts − KBC Bank and Insurance Holding Company NV
KBC Bank & Insurance Group − 2001 Annual Report
100
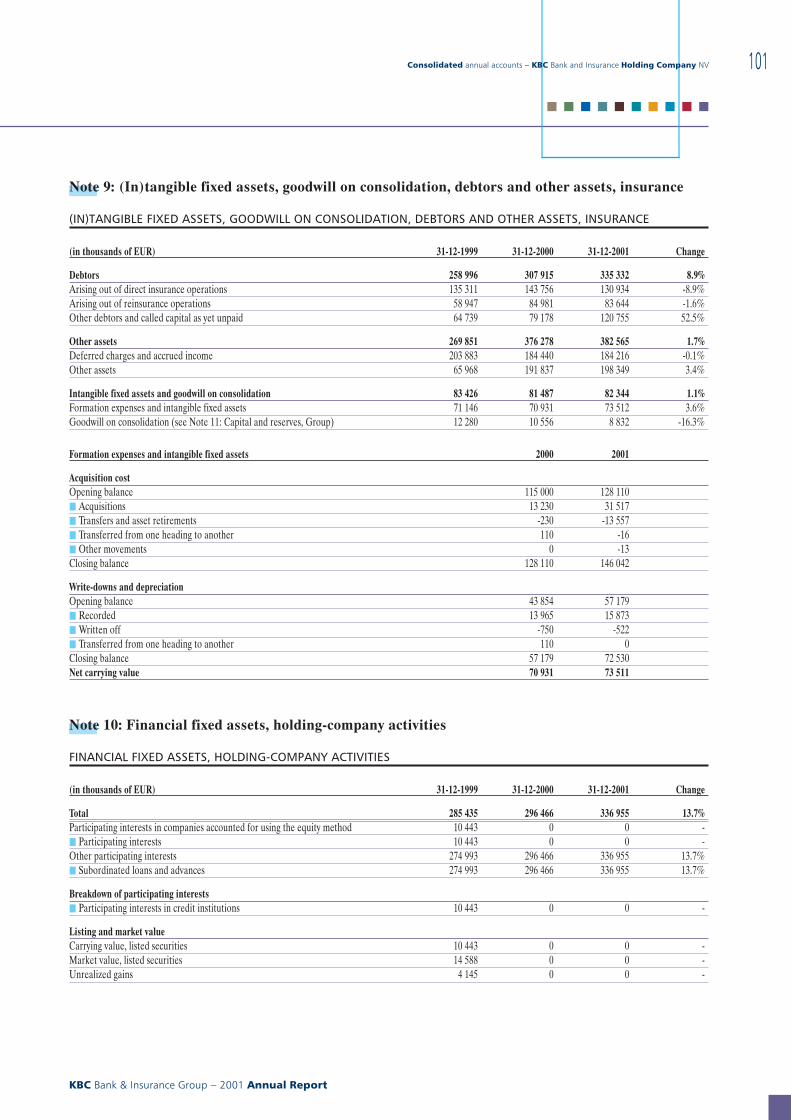
Note 9: (In)tangible fixed assets, goodwill on consolidation, debtors and other assets, insurance
(IN)TANGIBLE FIXED ASSETS, GOODWILL ON CONSOLIDATION, DEBTORS AND OTHER ASSETS, INSURANCE
(in thousands of EUR) 31-12-1999 31-12-2000 31-12-2001 Change
Debtors 258 996 307 915 335 332 8.9%Arising out of direct insurance operations 135 311 143 756 130 934 -8.9%Arising out of reinsurance operations 58 947 84 981 83 644 -1.6%Other debtors and called capital as yet unpaid 64 739 79 178 120 755 52.5%
Other assets 269 851 376 278 382 565 1.7%Deferred charges and accrued income 203 883 184 440 184 216 -0.1%Other assets 65 968 191 837 198 349 3.4%
Intangible fixed assets and goodwill on consolidation 83 426 81 487 82 344 1.1%Formation expenses and intangible fixed assets 71 146 70 931 73 512 3.6%Goodwill on consolidation (see Note 11: Capital and reserves, Group) 12 280 10 556 8 832 -16.3%
Formation expenses and intangible fixed assets 2000 2001
Acquisition costOpening balance 115 000 128 110j Acquisitions 13 230 31 517j Transfers and asset retirements -230 -13 557j Transferred from one heading to another 110 -16j Other movements 0 -13Closing balance 128 110 146 042
Write-downs and depreciationOpening balance 43 854 57 179j Recorded 13 965 15 873j Written off -750 -522j Transferred from one heading to another 110 0Closing balance 57 179 72 530Net carrying value 70 931 73 511
Note 10: Financial fixed assets, holding-company activities
FINANCIAL FIXED ASSETS, HOLDING-COMPANY ACTIVITIES
(in thousands of EUR) 31-12-1999 31-12-2000 31-12-2001 Change
Total 285 435 296 466 336 955 13.7%Participating interests in companies accounted for using the equity method 10 443 0 0 -j Participating interests 10 443 0 0 -Other participating interests 274 993 296 466 336 955 13.7%j Subordinated loans and advances 274 993 296 466 336 955 13.7%
Breakdown of participating interestsj Participating interests in credit institutions 10 443 0 0 -
Listing and market valueCarrying value, listed securities 10 443 0 0 -Market value, listed securities 14 588 0 0 -Unrealized gains 4 145 0 0 -
Consolidated annual accounts − KBC Bank and Insurance Holding Company NV
KBC Bank & Insurance Group − 2001 Annual Report
101
■ ■ ■ ■ ■ ■ ■ ■ ■ ■
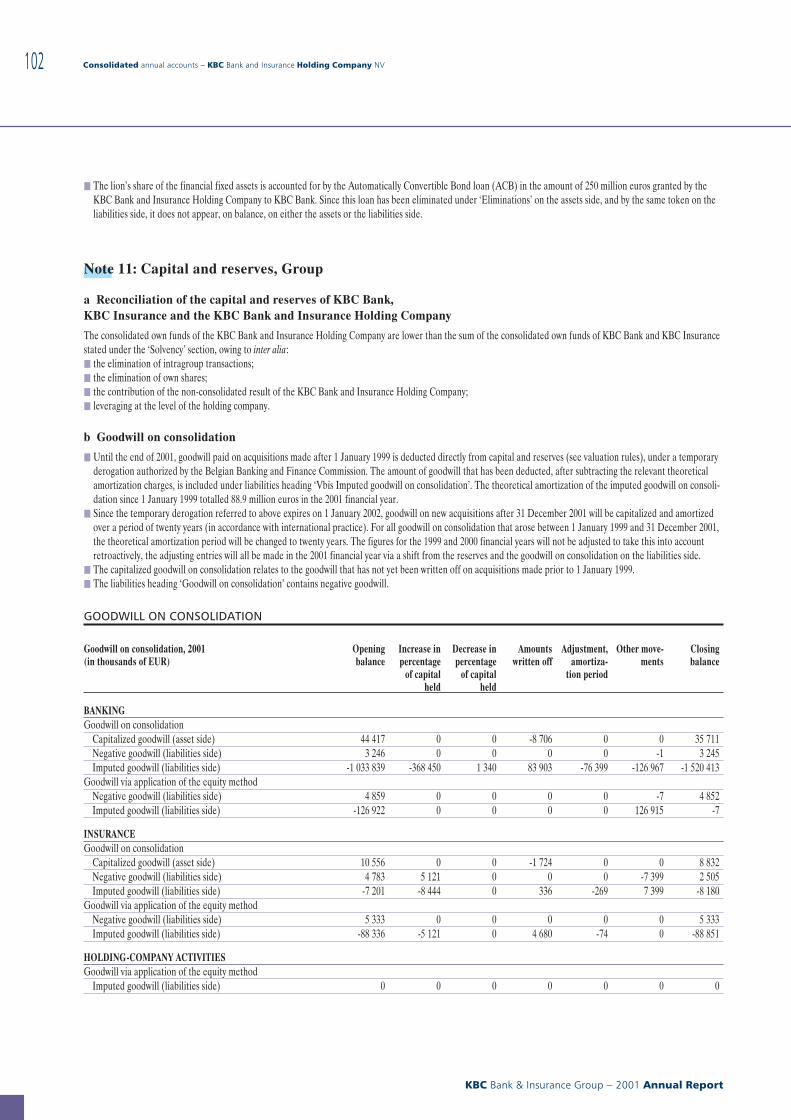
j The lion’s share of the financial fixed assets is accounted for by the Automatically Convertible Bond loan (ACB) in the amount of 250 million euros granted by theKBC Bank and Insurance Holding Company to KBC Bank. Since this loan has been eliminated under ‘Eliminations’ on the assets side, and by the same token on theliabilities side, it does not appear, on balance, on either the assets or the liabilities side.
Note 11: Capital and reserves, Group
a Reconciliation of the capital and reserves of KBC Bank,KBC Insurance and the KBC Bank and Insurance Holding Company
The consolidated own funds of the KBC Bank and Insurance Holding Company are lower than the sum of the consolidated own funds of KBC Bank and KBC Insurancestated under the ‘Solvency’ section, owing to inter alia:j the elimination of intragroup transactions;j the elimination of own shares;j the contribution of the non-consolidated result of the KBC Bank and Insurance Holding Company;j leveraging at the level of the holding company.
b Goodwill on consolidation
j Until the end of 2001, goodwill paid on acquisitions made after 1 January 1999 is deducted directly from capital and reserves (see valuation rules), under a temporaryderogation authorized by the Belgian Banking and Finance Commission. The amount of goodwill that has been deducted, after subtracting the relevant theoreticalamortization charges, is included under liabilities heading ‘Vbis Imputed goodwill on consolidation’. The theoretical amortization of the imputed goodwill on consoli-dation since 1 January 1999 totalled 88.9 million euros in the 2001 financial year.
j Since the temporary derogation referred to above expires on 1 January 2002, goodwill on new acquisitions after 31 December 2001 will be capitalized and amortizedover a period of twenty years (in accordance with international practice). For all goodwill on consolidation that arose between 1 January 1999 and 31 December 2001,the theoretical amortization period will be changed to twenty years. The figures for the 1999 and 2000 financial years will not be adjusted to take this into accountretroactively, the adjusting entries will all be made in the 2001 financial year via a shift from the reserves and the goodwill on consolidation on the liabilities side.
j The capitalized goodwill on consolidation relates to the goodwill that has not yet been written off on acquisitions made prior to 1 January 1999.j The liabilities heading ‘Goodwill on consolidation’ contains negative goodwill.
GOODWILL ON CONSOLIDATION
Goodwill on consolidation, 2001(in thousands of EUR)
Openingbalance
Increase inpercentage
of capitalheld
Decrease inpercentage
of capitalheld
Amountswritten off
Adjustment,amortiza-
tion period
Other move-ments
Closingbalance
BANKINGGoodwill on consolidation
Capitalized goodwill (asset side) 44 417 0 0 -8 706 0 0 35 711Negative goodwill (liabilities side) 3 246 0 0 0 0 -1 3 245Imputed goodwill (liabilities side) -1 033 839 -368 450 1 340 83 903 -76 399 -126 967 -1 520 413
Goodwill via application of the equity methodNegative goodwill (liabilities side) 4 859 0 0 0 0 -7 4 852Imputed goodwill (liabilities side) -126 922 0 0 0 0 126 915 -7
INSURANCEGoodwill on consolidation
Capitalized goodwill (asset side) 10 556 0 0 -1 724 0 0 8 832Negative goodwill (liabilities side) 4 783 5 121 0 0 0 -7 399 2 505Imputed goodwill (liabilities side) -7 201 -8 444 0 336 -269 7 399 -8 180
Goodwill via application of the equity methodNegative goodwill (liabilities side) 5 333 0 0 0 0 0 5 333Imputed goodwill (liabilities side) -88 336 -5 121 0 4 680 -74 0 -88 851
HOLDING-COMPANY ACTIVITIESGoodwill via application of the equity method
Imputed goodwill (liabilities side) 0 0 0 0 0 0 0
Consolidated annual accounts − KBC Bank and Insurance Holding Company NV
KBC Bank & Insurance Group − 2001 Annual Report
102
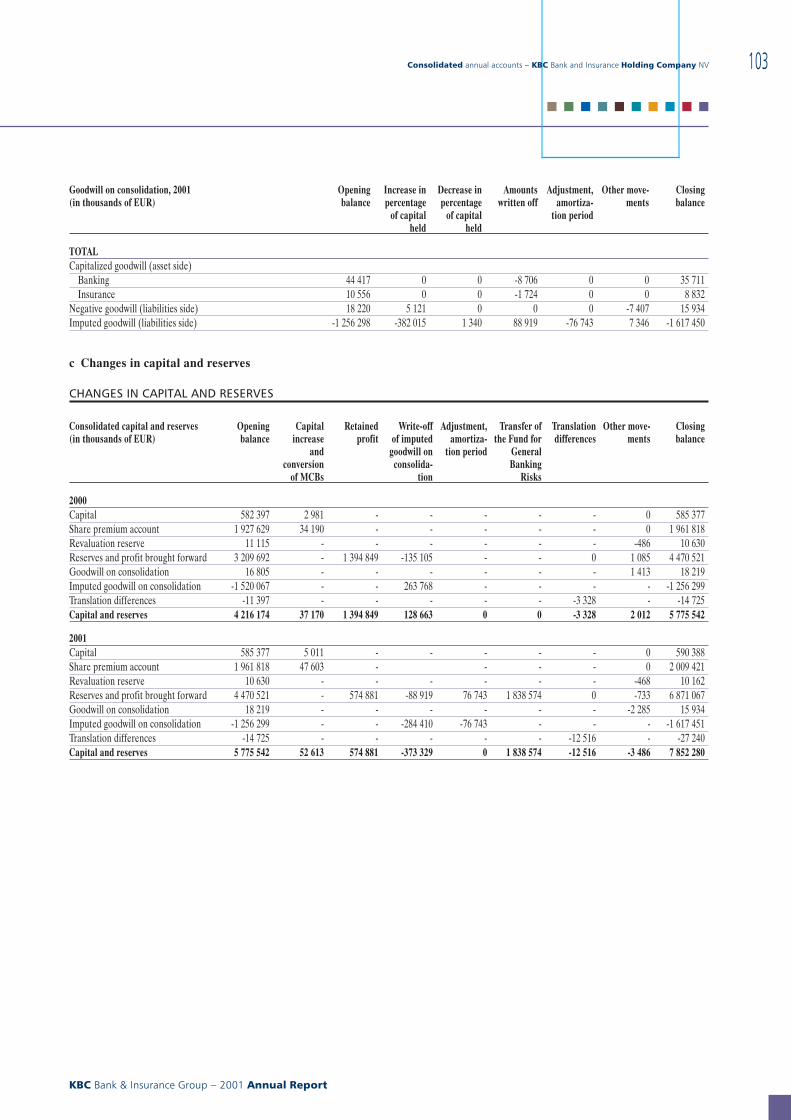
Goodwill on consolidation, 2001(in thousands of EUR)
Openingbalance
Increase inpercentage
of capitalheld
Decrease inpercentage
of capitalheld
Amountswritten off
Adjustment,amortiza-
tion period
Other move-ments
Closingbalance
TOTALCapitalized goodwill (asset side)
Banking 44 417 0 0 -8 706 0 0 35 711Insurance 10 556 0 0 -1 724 0 0 8 832
Negative goodwill (liabilities side) 18 220 5 121 0 0 0 -7 407 15 934Imputed goodwill (liabilities side) -1 256 298 -382 015 1 340 88 919 -76 743 7 346 -1 617 450
c Changes in capital and reserves
CHANGES IN CAPITAL AND RESERVES
Consolidated capital and reserves(in thousands of EUR)
Openingbalance
Capitalincrease
andconversion
of MCBs
Retainedprofit
Write-offof imputed
goodwill onconsolida-
tion
Adjustment,amortiza-
tion period
Transfer ofthe Fund for
GeneralBanking
Risks
Translationdifferences
Other move-ments
Closingbalance
2000Capital 582 397 2 981 - - - - - 0 585 377Share premium account 1 927 629 34 190 - - - - - 0 1 961 818Revaluation reserve 11 115 - - - - - - -486 10 630Reserves and profit brought forward 3 209 692 - 1 394 849 -135 105 - - 0 1 085 4 470 521Goodwill on consolidation 16 805 - - - - - - 1 413 18 219Imputed goodwill on consolidation -1 520 067 - - 263 768 - - - - -1 256 299Translation differences -11 397 - - - - - -3 328 - -14 725Capital and reserves 4 216 174 37 170 1 394 849 128 663 0 0 -3 328 2 012 5 775 542
2001Capital 585 377 5 011 - - - - - 0 590 388Share premium account 1 961 818 47 603 - - - - 0 2 009 421Revaluation reserve 10 630 - - - - - - -468 10 162Reserves and profit brought forward 4 470 521 - 574 881 -88 919 76 743 1 838 574 0 -733 6 871 067Goodwill on consolidation 18 219 - - - - - - -2 285 15 934Imputed goodwill on consolidation -1 256 299 - - -284 410 -76 743 - - - -1 617 451Translation differences -14 725 - - - - - -12 516 - -27 240Capital and reserves 5 775 542 52 613 574 881 -373 329 0 1 838 574 -12 516 -3 486 7 852 280
Consolidated annual accounts − KBC Bank and Insurance Holding Company NV
KBC Bank & Insurance Group − 2001 Annual Report
103
■ ■ ■ ■ ■ ■ ■ ■ ■ ■
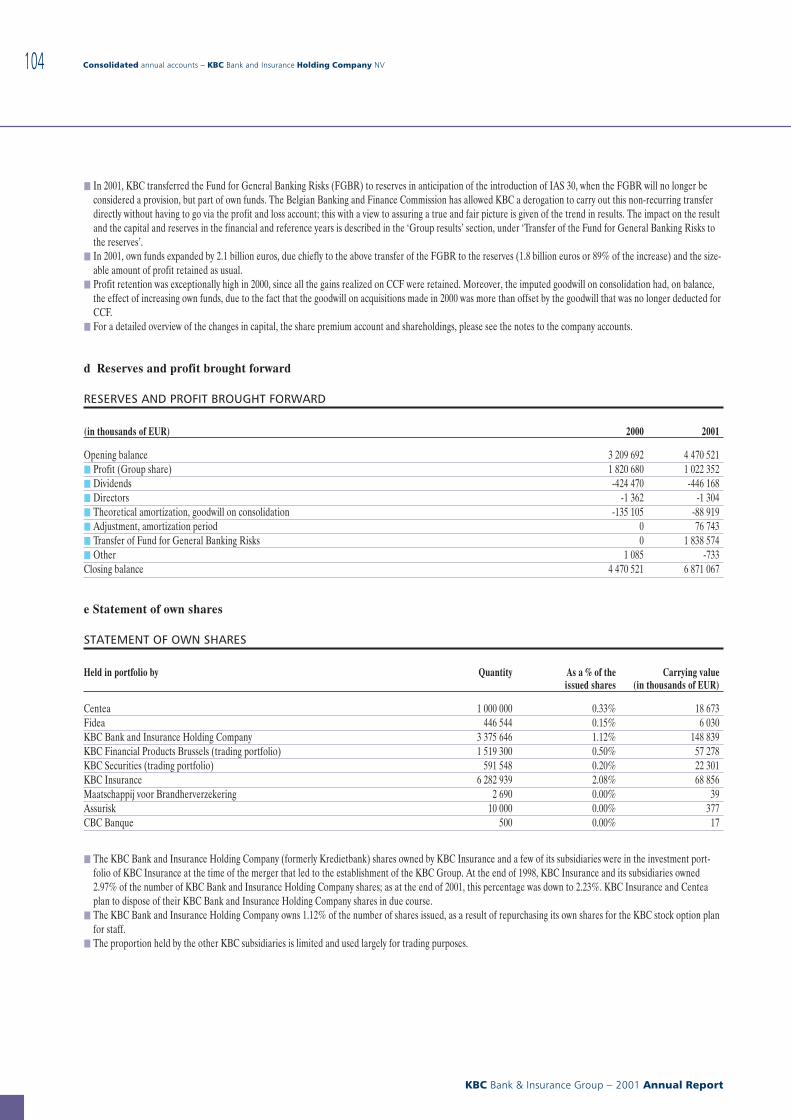
j In 2001, KBC transferred the Fund for General Banking Risks (FGBR) to reserves in anticipation of the introduction of IAS 30, when the FGBR will no longer beconsidered a provision, but part of own funds. The Belgian Banking and Finance Commission has allowed KBC a derogation to carry out this non-recurring transferdirectly without having to go via the profit and loss account; this with a view to assuring a true and fair picture is given of the trend in results. The impact on the resultand the capital and reserves in the financial and reference years is described in the ‘Group results’ section, under ‘Transfer of the Fund for General Banking Risks tothe reserves’.
j In 2001, own funds expanded by 2.1 billion euros, due chiefly to the above transfer of the FGBR to the reserves (1.8 billion euros or 89% of the increase) and the size-able amount of profit retained as usual.
j Profit retention was exceptionally high in 2000, since all the gains realized on CCF were retained. Moreover, the imputed goodwill on consolidation had, on balance,the effect of increasing own funds, due to the fact that the goodwill on acquisitions made in 2000 was more than offset by the goodwill that was no longer deducted forCCF.
j For a detailed overview of the changes in capital, the share premium account and shareholdings, please see the notes to the company accounts.
d Reserves and profit brought forward
RESERVES AND PROFIT BROUGHT FORWARD
(in thousands of EUR) 2000 2001
Opening balance 3 209 692 4 470 521j Profit (Group share) 1 820 680 1 022 352j Dividends -424 470 -446 168j Directors -1 362 -1 304j Theoretical amortization, goodwill on consolidation -135 105 -88 919j Adjustment, amortization period 0 76 743j Transfer of Fund for General Banking Risks 0 1 838 574j Other 1 085 -733Closing balance 4 470 521 6 871 067
e Statement of own shares
STATEMENT OF OWN SHARES
Held in portfolio by Quantity As a % of theissued shares
Carrying value(in thousands of EUR)
Centea 1 000 000 0.33% 18 673Fidea 446 544 0.15% 6 030KBC Bank and Insurance Holding Company 3 375 646 1.12% 148 839KBC Financial Products Brussels (trading portfolio) 1 519 300 0.50% 57 278KBC Securities (trading portfolio) 591 548 0.20% 22 301KBC Insurance 6 282 939 2.08% 68 856Maatschappij voor Brandherverzekering 2 690 0.00% 39Assurisk 10 000 0.00% 377CBC Banque 500 0.00% 17
j The KBC Bank and Insurance Holding Company (formerly Kredietbank) shares owned by KBC Insurance and a few of its subsidiaries were in the investment port-folio of KBC Insurance at the time of the merger that led to the establishment of the KBC Group. At the end of 1998, KBC Insurance and its subsidiaries owned2.97% of the number of KBC Bank and Insurance Holding Company shares; as at the end of 2001, this percentage was down to 2.23%. KBC Insurance and Centeaplan to dispose of their KBC Bank and Insurance Holding Company shares in due course.
j The KBC Bank and Insurance Holding Company owns 1.12% of the number of shares issued, as a result of repurchasing its own shares for the KBC stock option planfor staff.
j The proportion held by the other KBC subsidiaries is limited and used largely for trading purposes.
Consolidated annual accounts − KBC Bank and Insurance Holding Company NV
KBC Bank & Insurance Group − 2001 Annual Report
104
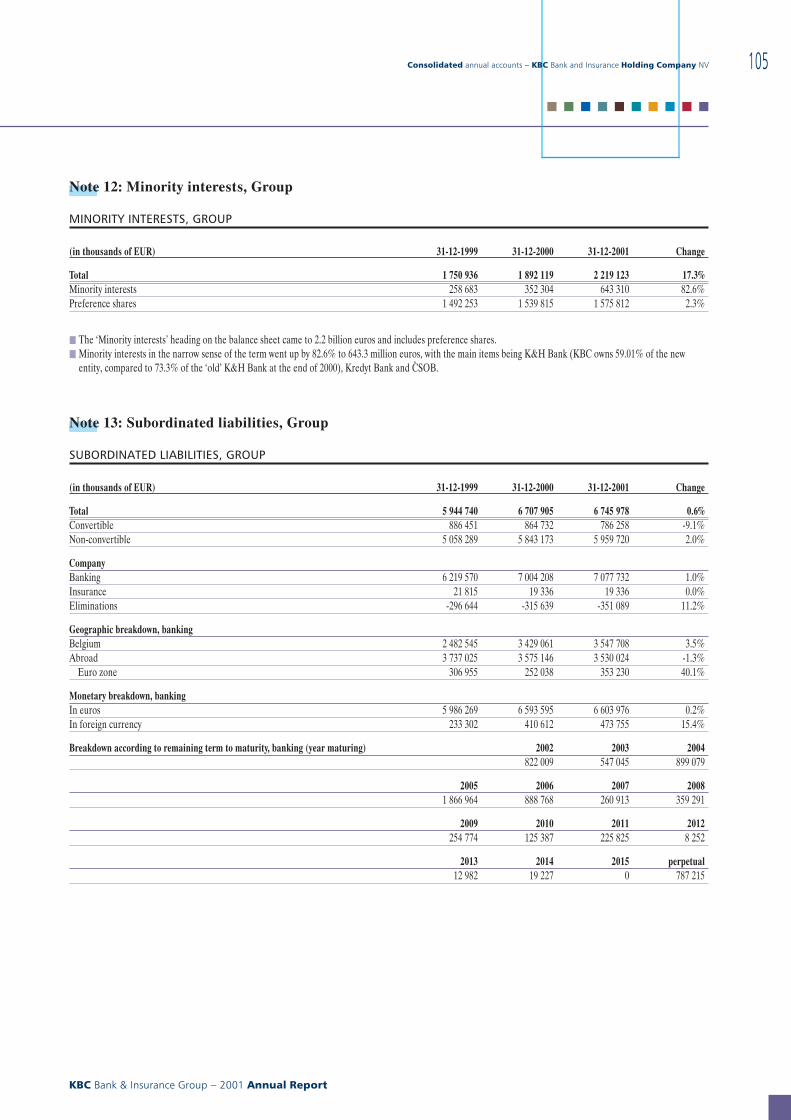
Note 12: Minority interests, Group
MINORITY INTERESTS, GROUP
(in thousands of EUR) 31-12-1999 31-12-2000 31-12-2001 Change
Total 1 750 936 1 892 119 2 219 123 17.3%Minority interests 258 683 352 304 643 310 82.6%Preference shares 1 492 253 1 539 815 1 575 812 2.3%
j The ‘Minority interests’ heading on the balance sheet came to 2.2 billion euros and includes preference shares.j Minority interests in the narrow sense of the term went up by 82.6% to 643.3 million euros, with the main items being K&H Bank (KBC owns 59.01% of the new
entity, compared to 73.3% of the ‘old’ K&H Bank at the end of 2000), Kredyt Bank and C{SOB.
Note 13: Subordinated liabilities, Group
SUBORDINATED LIABILITIES, GROUP
(in thousands of EUR) 31-12-1999 31-12-2000 31-12-2001 Change
Total 5 944 740 6 707 905 6 745 978 0.6%Convertible 886 451 864 732 786 258 -9.1%Non-convertible 5 058 289 5 843 173 5 959 720 2.0%
CompanyBanking 6 219 570 7 004 208 7 077 732 1.0%Insurance 21 815 19 336 19 336 0.0%Eliminations -296 644 -315 639 -351 089 11.2%
Geographic breakdown, bankingBelgium 2 482 545 3 429 061 3 547 708 3.5%Abroad 3 737 025 3 575 146 3 530 024 -1.3%
Euro zone 306 955 252 038 353 230 40.1%
Monetary breakdown, bankingIn euros 5 986 269 6 593 595 6 603 976 0.2%In foreign currency 233 302 410 612 473 755 15.4%
Breakdown according to remaining term to maturity, banking (year maturing) 2002 2003 2004822 009 547 045 899 079
2005 2006 2007 20081 866 964 888 768 260 913 359 291
2009 2010 2011 2012254 774 125 387 225 825 8 252
2013 2014 2015 perpetual12 982 19 227 0 787 215
Consolidated annual accounts − KBC Bank and Insurance Holding Company NV
KBC Bank & Insurance Group − 2001 Annual Report
105
■ ■ ■ ■ ■ ■ ■ ■ ■ ■
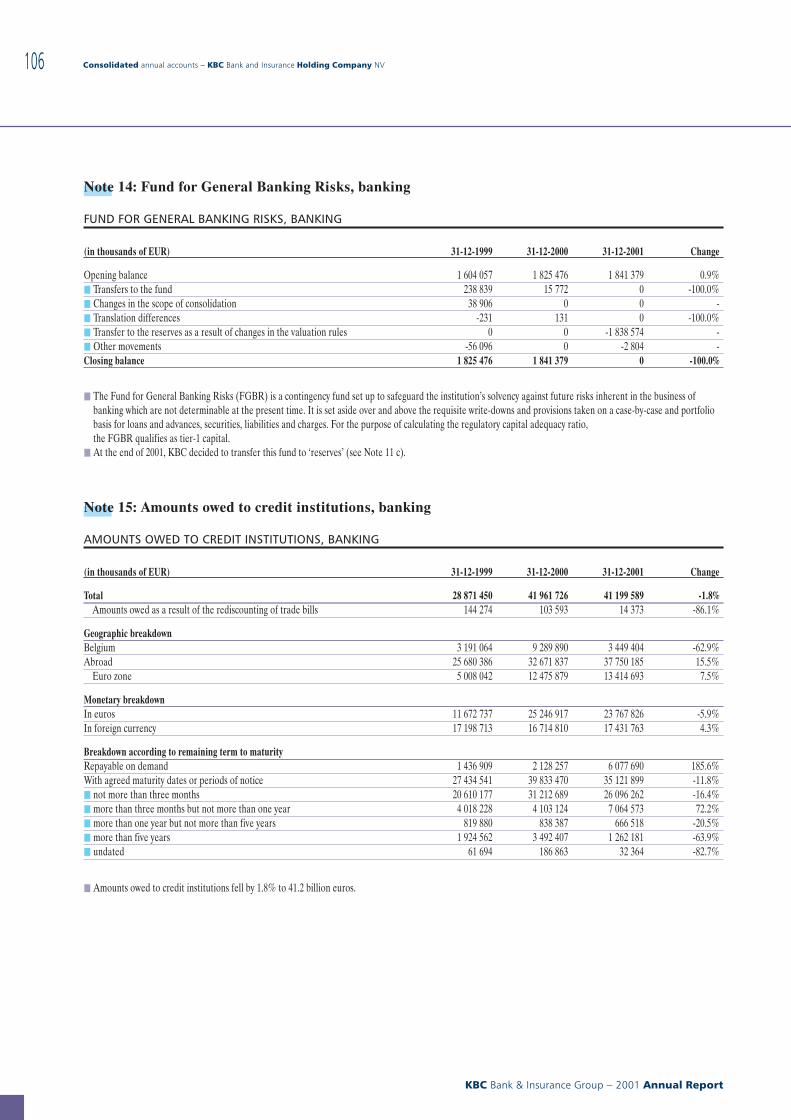
Note 14: Fund for General Banking Risks, banking
FUND FOR GENERAL BANKING RISKS, BANKING
(in thousands of EUR) 31-12-1999 31-12-2000 31-12-2001 Change
Opening balance 1 604 057 1 825 476 1 841 379 0.9%j Transfers to the fund 238 839 15 772 0 -100.0%j Changes in the scope of consolidation 38 906 0 0 -j Translation differences -231 131 0 -100.0%j Transfer to the reserves as a result of changes in the valuation rules 0 0 -1 838 574 -j Other movements -56 096 0 -2 804 -Closing balance 1 825 476 1 841 379 0 -100.0%
j The Fund for General Banking Risks (FGBR) is a contingency fund set up to safeguard the institution’s solvency against future risks inherent in the business ofbanking which are not determinable at the present time. It is set aside over and above the requisite write-downs and provisions taken on a case-by-case and portfoliobasis for loans and advances, securities, liabilities and charges. For the purpose of calculating the regulatory capital adequacy ratio,the FGBR qualifies as tier-1 capital.
j At the end of 2001, KBC decided to transfer this fund to ‘reserves’ (see Note 11 c).
Note 15: Amounts owed to credit institutions, banking
AMOUNTS OWED TO CREDIT INSTITUTIONS, BANKING
(in thousands of EUR) 31-12-1999 31-12-2000 31-12-2001 Change
Total 28 871 450 41 961 726 41 199 589 -1.8%Amounts owed as a result of the rediscounting of trade bills 144 274 103 593 14 373 -86.1%
Geographic breakdownBelgium 3 191 064 9 289 890 3 449 404 -62.9%Abroad 25 680 386 32 671 837 37 750 185 15.5%
Euro zone 5 008 042 12 475 879 13 414 693 7.5%
Monetary breakdownIn euros 11 672 737 25 246 917 23 767 826 -5.9%In foreign currency 17 198 713 16 714 810 17 431 763 4.3%
Breakdown according to remaining term to maturityRepayable on demand 1 436 909 2 128 257 6 077 690 185.6%With agreed maturity dates or periods of notice 27 434 541 39 833 470 35 121 899 -11.8%j not more than three months 20 610 177 31 212 689 26 096 262 -16.4%j more than three months but not more than one year 4 018 228 4 103 124 7 064 573 72.2%j more than one year but not more than five years 819 880 838 387 666 518 -20.5%j more than five years 1 924 562 3 492 407 1 262 181 -63.9%j undated 61 694 186 863 32 364 -82.7%
j Amounts owed to credit institutions fell by 1.8% to 41.2 billion euros.
Consolidated annual accounts − KBC Bank and Insurance Holding Company NV
KBC Bank & Insurance Group − 2001 Annual Report
106
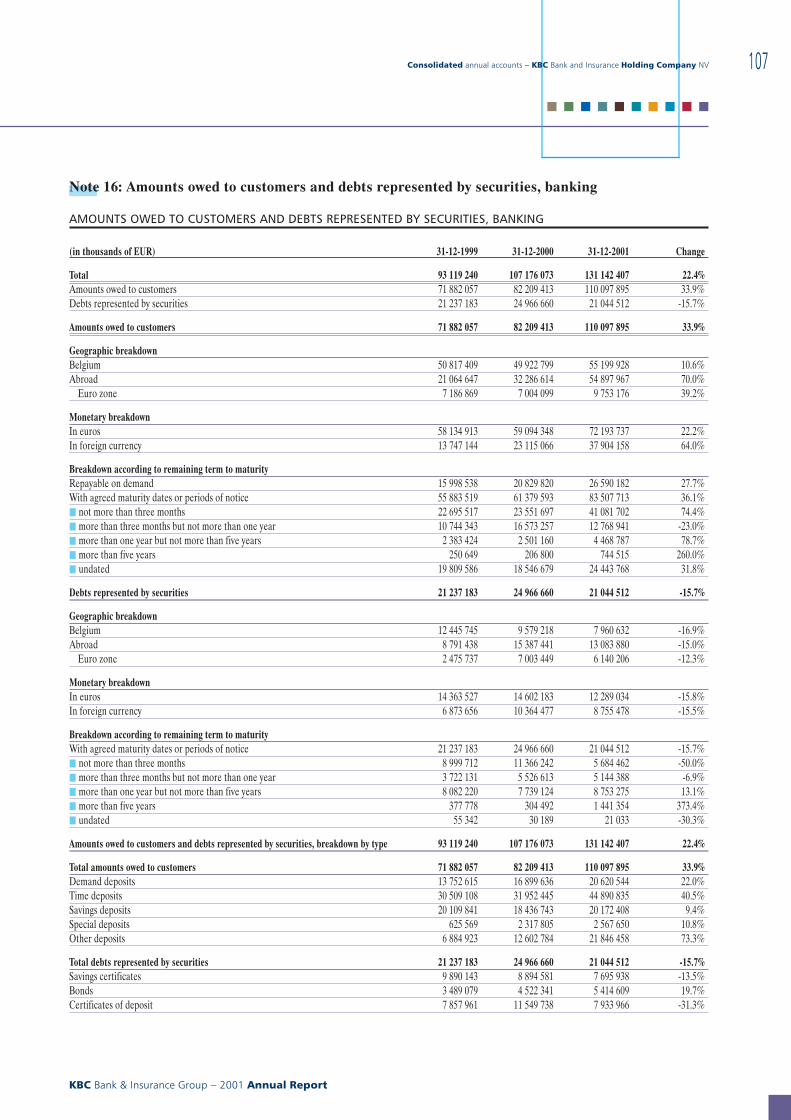
Note 16: Amounts owed to customers and debts represented by securities, banking
AMOUNTS OWED TO CUSTOMERS AND DEBTS REPRESENTED BY SECURITIES, BANKING
(in thousands of EUR) 31-12-1999 31-12-2000 31-12-2001 Change
Total 93 119 240 107 176 073 131 142 407 22.4%Amounts owed to customers 71 882 057 82 209 413 110 097 895 33.9%Debts represented by securities 21 237 183 24 966 660 21 044 512 -15.7%
Amounts owed to customers 71 882 057 82 209 413 110 097 895 33.9%
Geographic breakdownBelgium 50 817 409 49 922 799 55 199 928 10.6%Abroad 21 064 647 32 286 614 54 897 967 70.0%
Euro zone 7 186 869 7 004 099 9 753 176 39.2%
Monetary breakdownIn euros 58 134 913 59 094 348 72 193 737 22.2%In foreign currency 13 747 144 23 115 066 37 904 158 64.0%
Breakdown according to remaining term to maturityRepayable on demand 15 998 538 20 829 820 26 590 182 27.7%With agreed maturity dates or periods of notice 55 883 519 61 379 593 83 507 713 36.1%j not more than three months 22 695 517 23 551 697 41 081 702 74.4%j more than three months but not more than one year 10 744 343 16 573 257 12 768 941 -23.0%j more than one year but not more than five years 2 383 424 2 501 160 4 468 787 78.7%j more than five years 250 649 206 800 744 515 260.0%j undated 19 809 586 18 546 679 24 443 768 31.8%
Debts represented by securities 21 237 183 24 966 660 21 044 512 -15.7%
Geographic breakdownBelgium 12 445 745 9 579 218 7 960 632 -16.9%Abroad 8 791 438 15 387 441 13 083 880 -15.0%
Euro zone 2 475 737 7 003 449 6 140 206 -12.3%
Monetary breakdownIn euros 14 363 527 14 602 183 12 289 034 -15.8%In foreign currency 6 873 656 10 364 477 8 755 478 -15.5%
Breakdown according to remaining term to maturityWith agreed maturity dates or periods of notice 21 237 183 24 966 660 21 044 512 -15.7%j not more than three months 8 999 712 11 366 242 5 684 462 -50.0%j more than three months but not more than one year 3 722 131 5 526 613 5 144 388 -6.9%j more than one year but not more than five years 8 082 220 7 739 124 8 753 275 13.1%j more than five years 377 778 304 492 1 441 354 373.4%j undated 55 342 30 189 21 033 -30.3%
Amounts owed to customers and debts represented by securities, breakdown by type 93 119 240 107 176 073 131 142 407 22.4%
Total amounts owed to customers 71 882 057 82 209 413 110 097 895 33.9%Demand deposits 13 752 615 16 899 636 20 620 544 22.0%Time deposits 30 509 108 31 952 445 44 890 835 40.5%Savings deposits 20 109 841 18 436 743 20 172 408 9.4%Special deposits 625 569 2 317 805 2 567 650 10.8%Other deposits 6 884 923 12 602 784 21 846 458 73.3%
Total debts represented by securities 21 237 183 24 966 660 21 044 512 -15.7%Savings certificates 9 890 143 8 894 581 7 695 938 -13.5%Bonds 3 489 079 4 522 341 5 414 609 19.7%Certificates of deposit 7 857 961 11 549 738 7 933 966 -31.3%
Consolidated annual accounts − KBC Bank and Insurance Holding Company NV
KBC Bank & Insurance Group − 2001 Annual Report
107
■ ■ ■ ■ ■ ■ ■ ■ ■ ■
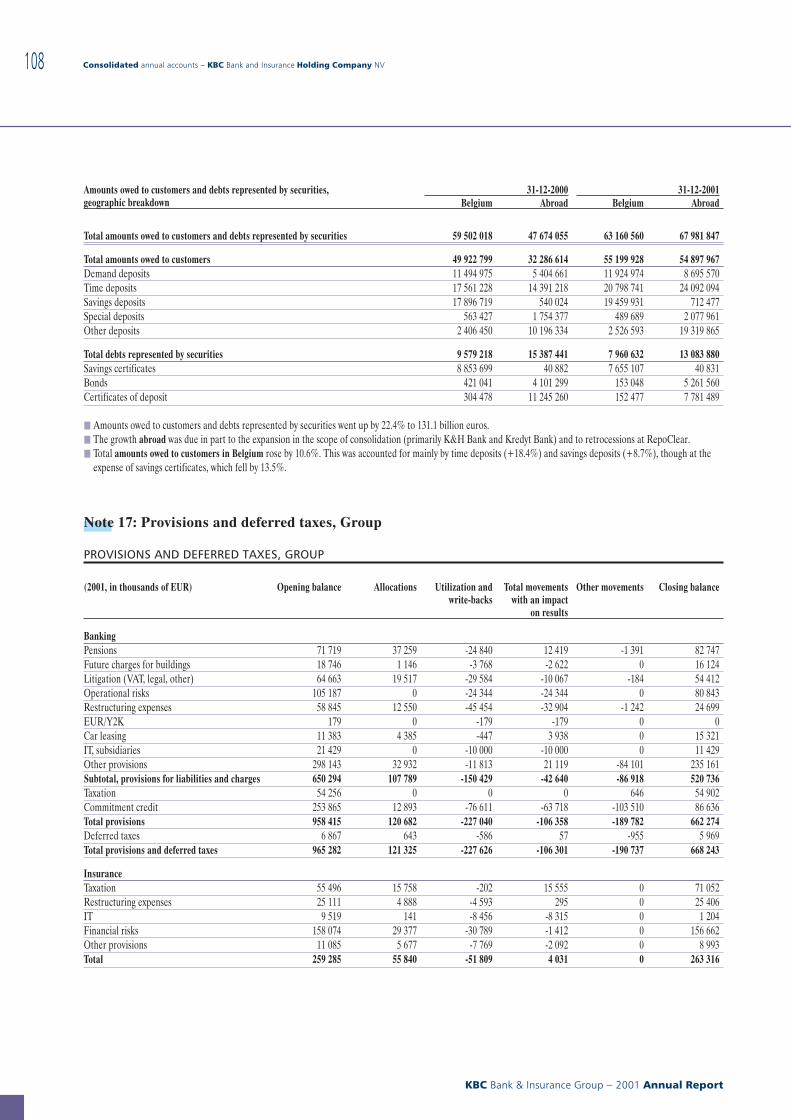
Amounts owed to customers and debts represented by securities,geographic breakdown
31-12-2000 31-12-2001Belgium Abroad Belgium Abroad
Total amounts owed to customers and debts represented by securities 59 502 018 47 674 055 63 160 560 67 981 847
Total amounts owed to customers 49 922 799 32 286 614 55 199 928 54 897 967Demand deposits 11 494 975 5 404 661 11 924 974 8 695 570Time deposits 17 561 228 14 391 218 20 798 741 24 092 094Savings deposits 17 896 719 540 024 19 459 931 712 477Special deposits 563 427 1 754 377 489 689 2 077 961Other deposits 2 406 450 10 196 334 2 526 593 19 319 865
Total debts represented by securities 9 579 218 15 387 441 7 960 632 13 083 880Savings certificates 8 853 699 40 882 7 655 107 40 831Bonds 421 041 4 101 299 153 048 5 261 560Certificates of deposit 304 478 11 245 260 152 477 7 781 489
j Amounts owed to customers and debts represented by securities went up by 22.4% to 131.1 billion euros.j The growth abroad was due in part to the expansion in the scope of consolidation (primarily K&H Bank and Kredyt Bank) and to retrocessions at RepoClear.j Total amounts owed to customers in Belgium rose by 10.6%. This was accounted for mainly by time deposits (+18.4%) and savings deposits (+8.7%), though at the
expense of savings certificates, which fell by 13.5%.
Note 17: Provisions and deferred taxes, Group
PROVISIONS AND DEFERRED TAXES, GROUP
(2001, in thousands of EUR) Opening balance Allocations Utilization andwrite-backs
Total movementswith an impact
on results
Other movements Closing balance
BankingPensions 71 719 37 259 -24 840 12 419 -1 391 82 747Future charges for buildings 18 746 1 146 -3 768 -2 622 0 16 124Litigation (VAT, legal, other) 64 663 19 517 -29 584 -10 067 -184 54 412Operational risks 105 187 0 -24 344 -24 344 0 80 843Restructuring expenses 58 845 12 550 -45 454 -32 904 -1 242 24 699EUR/Y2K 179 0 -179 -179 0 0Car leasing 11 383 4 385 -447 3 938 0 15 321IT, subsidiaries 21 429 0 -10 000 -10 000 0 11 429Other provisions 298 143 32 932 -11 813 21 119 -84 101 235 161Subtotal, provisions for liabilities and charges 650 294 107 789 -150 429 -42 640 -86 918 520 736Taxation 54 256 0 0 0 646 54 902Commitment credit 253 865 12 893 -76 611 -63 718 -103 510 86 636Total provisions 958 415 120 682 -227 040 -106 358 -189 782 662 274Deferred taxes 6 867 643 -586 57 -955 5 969Total provisions and deferred taxes 965 282 121 325 -227 626 -106 301 -190 737 668 243
InsuranceTaxation 55 496 15 758 -202 15 555 0 71 052Restructuring expenses 25 111 4 888 -4 593 295 0 25 406IT 9 519 141 -8 456 -8 315 0 1 204Financial risks 158 074 29 377 -30 789 -1 412 0 156 662Other provisions 11 085 5 677 -7 769 -2 092 0 8 993Total 259 285 55 840 -51 809 4 031 0 263 316
Consolidated annual accounts − KBC Bank and Insurance Holding Company NV
KBC Bank & Insurance Group − 2001 Annual Report
108
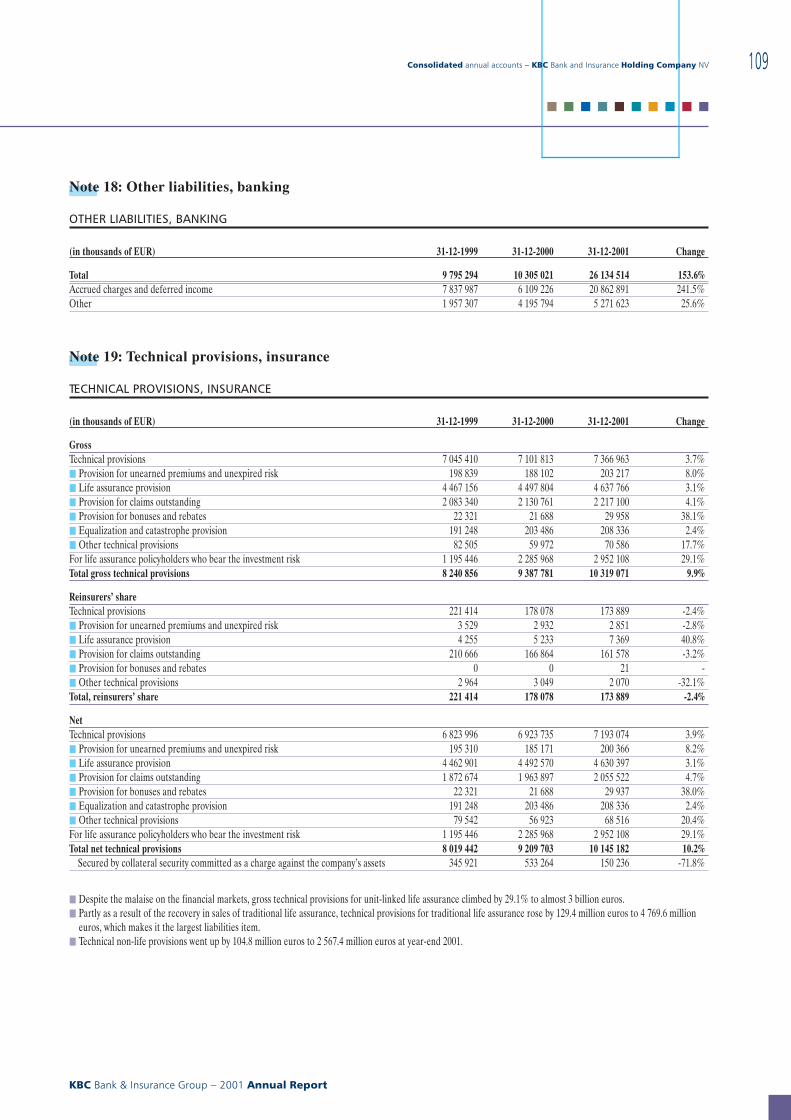
Note 18: Other liabilities, banking
OTHER LIABILITIES, BANKING
(in thousands of EUR) 31-12-1999 31-12-2000 31-12-2001 Change
Total 9 795 294 10 305 021 26 134 514 153.6%Accrued charges and deferred income 7 837 987 6 109 226 20 862 891 241.5%Other 1 957 307 4 195 794 5 271 623 25.6%
Note 19: Technical provisions, insurance
TECHNICAL PROVISIONS, INSURANCE
(in thousands of EUR) 31-12-1999 31-12-2000 31-12-2001 Change
GrossTechnical provisions 7 045 410 7 101 813 7 366 963 3.7%j Provision for unearned premiums and unexpired risk 198 839 188 102 203 217 8.0%j Life assurance provision 4 467 156 4 497 804 4 637 766 3.1%j Provision for claims outstanding 2 083 340 2 130 761 2 217 100 4.1%j Provision for bonuses and rebates 22 321 21 688 29 958 38.1%j Equalization and catastrophe provision 191 248 203 486 208 336 2.4%j Other technical provisions 82 505 59 972 70 586 17.7%For life assurance policyholders who bear the investment risk 1 195 446 2 285 968 2 952 108 29.1%Total gross technical provisions 8 240 856 9 387 781 10 319 071 9.9%
Reinsurers’ shareTechnical provisions 221 414 178 078 173 889 -2.4%j Provision for unearned premiums and unexpired risk 3 529 2 932 2 851 -2.8%j Life assurance provision 4 255 5 233 7 369 40.8%j Provision for claims outstanding 210 666 166 864 161 578 -3.2%j Provision for bonuses and rebates 0 0 21 -j Other technical provisions 2 964 3 049 2 070 -32.1%Total, reinsurers’ share 221 414 178 078 173 889 -2.4%
NetTechnical provisions 6 823 996 6 923 735 7 193 074 3.9%j Provision for unearned premiums and unexpired risk 195 310 185 171 200 366 8.2%j Life assurance provision 4 462 901 4 492 570 4 630 397 3.1%j Provision for claims outstanding 1 872 674 1 963 897 2 055 522 4.7%j Provision for bonuses and rebates 22 321 21 688 29 937 38.0%j Equalization and catastrophe provision 191 248 203 486 208 336 2.4%j Other technical provisions 79 542 56 923 68 516 20.4%For life assurance policyholders who bear the investment risk 1 195 446 2 285 968 2 952 108 29.1%Total net technical provisions 8 019 442 9 209 703 10 145 182 10.2%
Secured by collateral security committed as a charge against the company’s assets 345 921 533 264 150 236 -71.8%
j Despite the malaise on the financial markets, gross technical provisions for unit-linked life assurance climbed by 29.1% to almost 3 billion euros.j Partly as a result of the recovery in sales of traditional life assurance, technical provisions for traditional life assurance rose by 129.4 million euros to 4 769.6 million
euros, which makes it the largest liabilities item.j Technical non-life provisions went up by 104.8 million euros to 2 567.4 million euros at year-end 2001.
Consolidated annual accounts − KBC Bank and Insurance Holding Company NV
KBC Bank & Insurance Group − 2001 Annual Report
109
■ ■ ■ ■ ■ ■ ■ ■ ■ ■
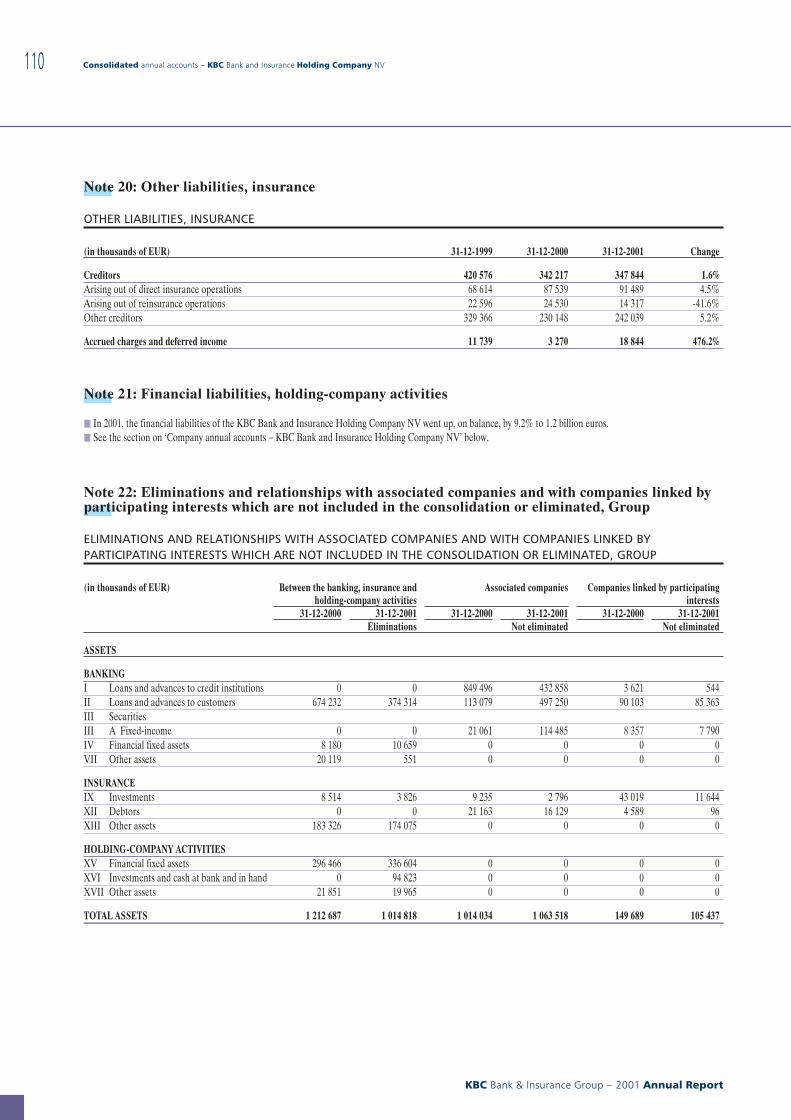
Note 20: Other liabilities, insurance
OTHER LIABILITIES, INSURANCE
(in thousands of EUR) 31-12-1999 31-12-2000 31-12-2001 Change
Creditors 420 576 342 217 347 844 1.6%Arising out of direct insurance operations 68 614 87 539 91 489 4.5%Arising out of reinsurance operations 22 596 24 530 14 317 -41.6%Other creditors 329 366 230 148 242 039 5.2%
Accrued charges and deferred income 11 739 3 270 18 844 476.2%
Note 21: Financial liabilities, holding-company activities
j In 2001, the financial liabilities of the KBC Bank and Insurance Holding Company NV went up, on balance, by 9.2% to 1.2 billion euros.j See the section on ‘Company annual accounts − KBC Bank and Insurance Holding Company NV’ below.
Note 22: Eliminations and relationships with associated companies and with companies linked byparticipating interests which are not included in the consolidation or eliminated, Group
ELIMINATIONS AND RELATIONSHIPS WITH ASSOCIATED COMPANIES AND WITH COMPANIES LINKED BYPARTICIPATING INTERESTS WHICH ARE NOT INCLUDED IN THE CONSOLIDATION OR ELIMINATED, GROUP
(in thousands of EUR) Between the banking, insurance andholding-company activities
Associated companies Companies linked by participatinginterests
31-12-2000 31-12-2001 31-12-2000 31-12-2001 31-12-2000 31-12-2001Eliminations Not eliminated Not eliminated
ASSETS
BANKINGI Loans and advances to credit institutions 0 0 849 496 432 858 3 621 544II Loans and advances to customers 674 232 374 314 113 079 497 250 90 103 85 363III SecuritiesIII A Fixed-income 0 0 21 061 114 485 8 357 7 790IV Financial fixed assets 8 180 10 659 0 0 0 0VII Other assets 20 119 551 0 0 0 0
INSURANCEIX Investments 8 514 3 826 9 235 2 796 43 019 11 644XII Debtors 0 0 21 163 16 129 4 589 96XIII Other assets 183 326 174 075 0 0 0 0
HOLDING-COMPANY ACTIVITIESXV Financial fixed assets 296 466 336 604 0 0 0 0XVI Investments and cash at bank and in hand 0 94 823 0 0 0 0XVII Other assets 21 851 19 965 0 0 0 0
TOTAL ASSETS 1 212 687 1 014 818 1 014 034 1 063 518 149 689 105 437
Consolidated annual accounts − KBC Bank and Insurance Holding Company NV
KBC Bank & Insurance Group − 2001 Annual Report
110
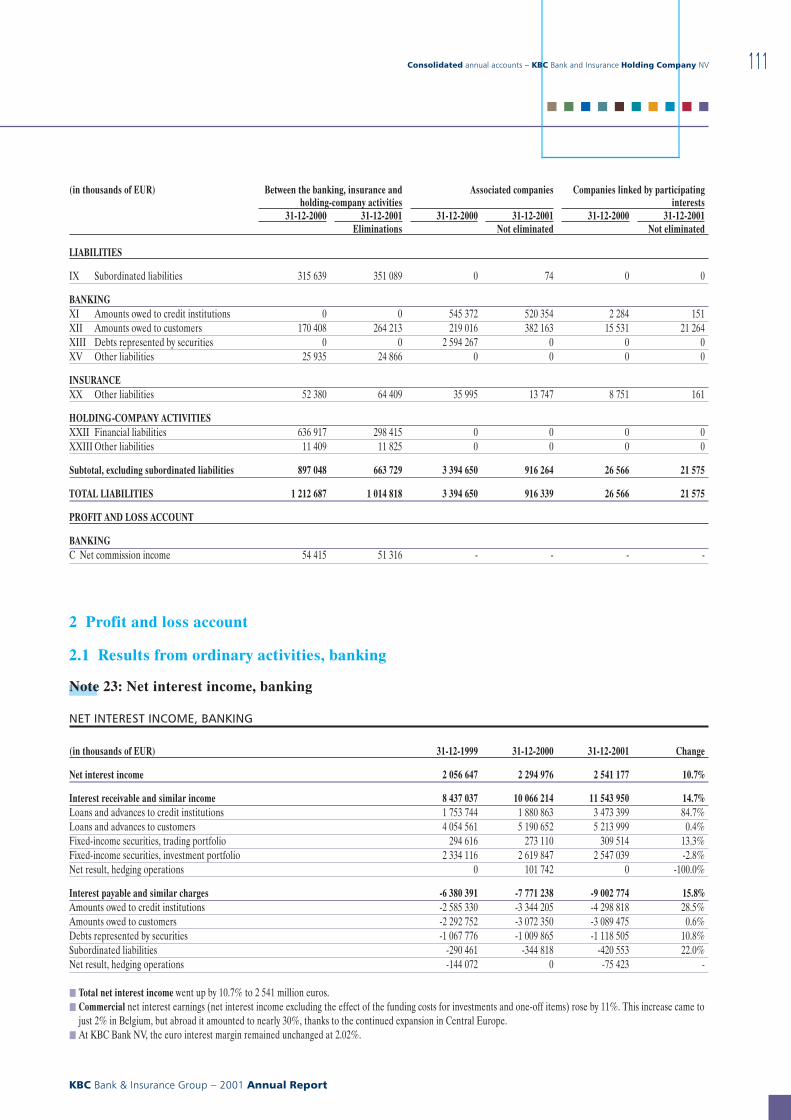
(in thousands of EUR) Between the banking, insurance andholding-company activities
Associated companies Companies linked by participatinginterests
31-12-2000 31-12-2001 31-12-2000 31-12-2001 31-12-2000 31-12-2001Eliminations Not eliminated Not eliminated
LIABILITIES
IX Subordinated liabilities 315 639 351 089 0 74 0 0
BANKINGXI Amounts owed to credit institutions 0 0 545 372 520 354 2 284 151XII Amounts owed to customers 170 408 264 213 219 016 382 163 15 531 21 264XIII Debts represented by securities 0 0 2 594 267 0 0 0XV Other liabilities 25 935 24 866 0 0 0 0
INSURANCEXX Other liabilities 52 380 64 409 35 995 13 747 8 751 161
HOLDING-COMPANY ACTIVITIESXXII Financial liabilities 636 917 298 415 0 0 0 0XXIII Other liabilities 11 409 11 825 0 0 0 0
Subtotal, excluding subordinated liabilities 897 048 663 729 3 394 650 916 264 26 566 21 575
TOTAL LIABILITIES 1 212 687 1 014 818 3 394 650 916 339 26 566 21 575
PROFIT AND LOSS ACCOUNT
BANKINGC Net commission income 54 415 51 316 - - - -
2 Profit and loss account
2.1 Results from ordinary activities, banking
Note 23: Net interest income, banking
NET INTEREST INCOME, BANKING
(in thousands of EUR) 31-12-1999 31-12-2000 31-12-2001 Change
Net interest income 2 056 647 2 294 976 2 541 177 10.7%
Interest receivable and similar income 8 437 037 10 066 214 11 543 950 14.7%Loans and advances to credit institutions 1 753 744 1 880 863 3 473 399 84.7%Loans and advances to customers 4 054 561 5 190 652 5 213 999 0.4%Fixed-income securities, trading portfolio 294 616 273 110 309 514 13.3%Fixed-income securities, investment portfolio 2 334 116 2 619 847 2 547 039 -2.8%Net result, hedging operations 0 101 742 0 -100.0%
Interest payable and similar charges -6 380 391 -7 771 238 -9 002 774 15.8%Amounts owed to credit institutions -2 585 330 -3 344 205 -4 298 818 28.5%Amounts owed to customers -2 292 752 -3 072 350 -3 089 475 0.6%Debts represented by securities -1 067 776 -1 009 865 -1 118 505 10.8%Subordinated liabilities -290 461 -344 818 -420 553 22.0%Net result, hedging operations -144 072 0 -75 423 -
j Total net interest income went up by 10.7% to 2 541 million euros.j Commercial net interest earnings (net interest income excluding the effect of the funding costs for investments and one-off items) rose by 11%. This increase came to
just 2% in Belgium, but abroad it amounted to nearly 30%, thanks to the continued expansion in Central Europe.j At KBC Bank NV, the euro interest margin remained unchanged at 2.02%.
Consolidated annual accounts − KBC Bank and Insurance Holding Company NV
KBC Bank & Insurance Group − 2001 Annual Report
111
■ ■ ■ ■ ■ ■ ■ ■ ■ ■
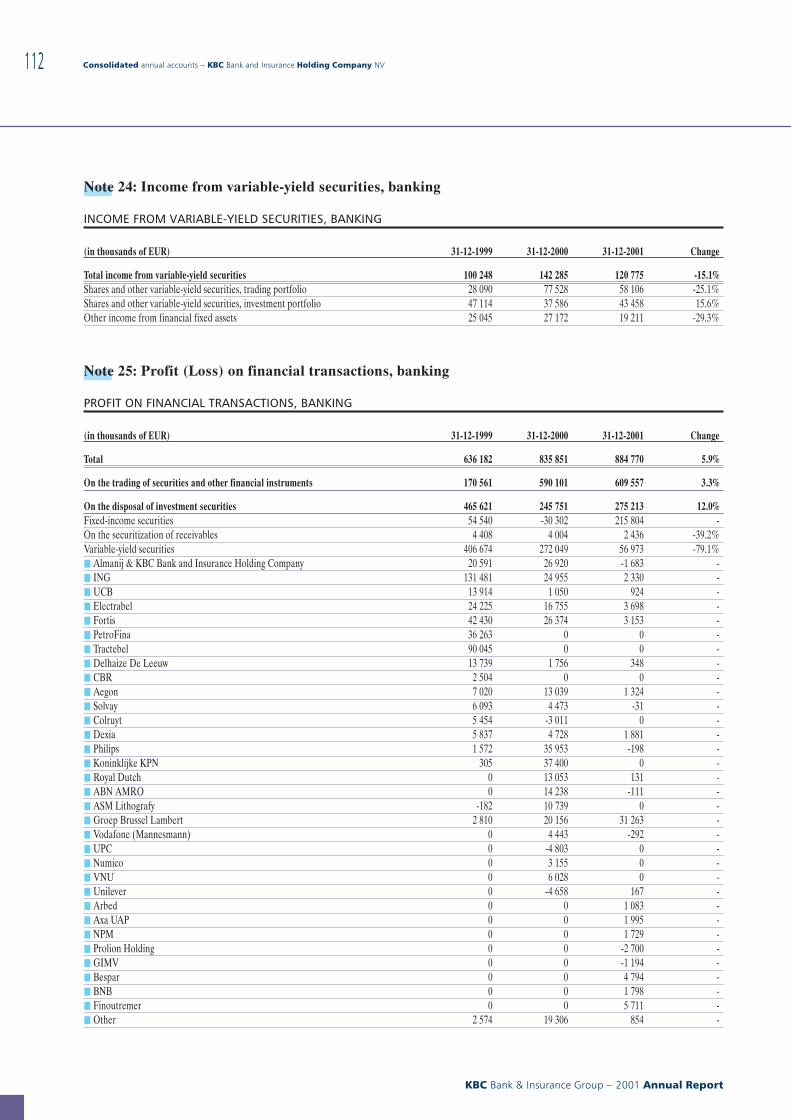
Note 24: Income from variable-yield securities, banking
INCOME FROM VARIABLE-YIELD SECURITIES, BANKING
(in thousands of EUR) 31-12-1999 31-12-2000 31-12-2001 Change
Total income from variable-yield securities 100 248 142 285 120 775 -15.1%Shares and other variable-yield securities, trading portfolio 28 090 77 528 58 106 -25.1%Shares and other variable-yield securities, investment portfolio 47 114 37 586 43 458 15.6%Other income from financial fixed assets 25 045 27 172 19 211 -29.3%
Note 25: Profit (Loss) on financial transactions, banking
PROFIT ON FINANCIAL TRANSACTIONS, BANKING
(in thousands of EUR) 31-12-1999 31-12-2000 31-12-2001 Change
Total 636 182 835 851 884 770 5.9%
On the trading of securities and other financial instruments 170 561 590 101 609 557 3.3%
On the disposal of investment securities 465 621 245 751 275 213 12.0%Fixed-income securities 54 540 -30 302 215 804 -On the securitization of receivables 4 408 4 004 2 436 -39.2%Variable-yield securities 406 674 272 049 56 973 -79.1%j Almanij & KBC Bank and Insurance Holding Company 20 591 26 920 -1 683 -j ING 131 481 24 955 2 330 -j UCB 13 914 1 050 924 -j Electrabel 24 225 16 755 3 698 -j Fortis 42 430 26 374 3 153 -j PetroFina 36 263 0 0 -j Tractebel 90 045 0 0 -j Delhaize De Leeuw 13 739 1 756 348 -j CBR 2 504 0 0 -j Aegon 7 020 13 039 1 324 -j Solvay 6 093 4 473 -31 -j Colruyt 5 454 -3 011 0 -j Dexia 5 837 4 728 1 881 -j Philips 1 572 35 953 -198 -j Koninklijke KPN 305 37 400 0 -j Royal Dutch 0 13 053 131 -j ABN AMRO 0 14 238 -111 -j ASM Lithografy -182 10 739 0 -j Groep Brussel Lambert 2 810 20 156 31 263 -j Vodafone (Mannesmann) 0 4 443 -292 -j UPC 0 -4 803 0 -j Numico 0 3 155 0 -j VNU 0 6 028 0 -j Unilever 0 -4 658 167 -j Arbed 0 0 1 083 -j Axa UAP 0 0 1 995 -j NPM 0 0 1 729 -j Prolion Holding 0 0 -2 700 -j GIMV 0 0 -1 194 -j Bespar 0 0 4 794 -j BNB 0 0 1 798 -j Finoutremer 0 0 5 711 -j Other 2 574 19 306 854 -
Consolidated annual accounts − KBC Bank and Insurance Holding Company NV
KBC Bank & Insurance Group − 2001 Annual Report
112
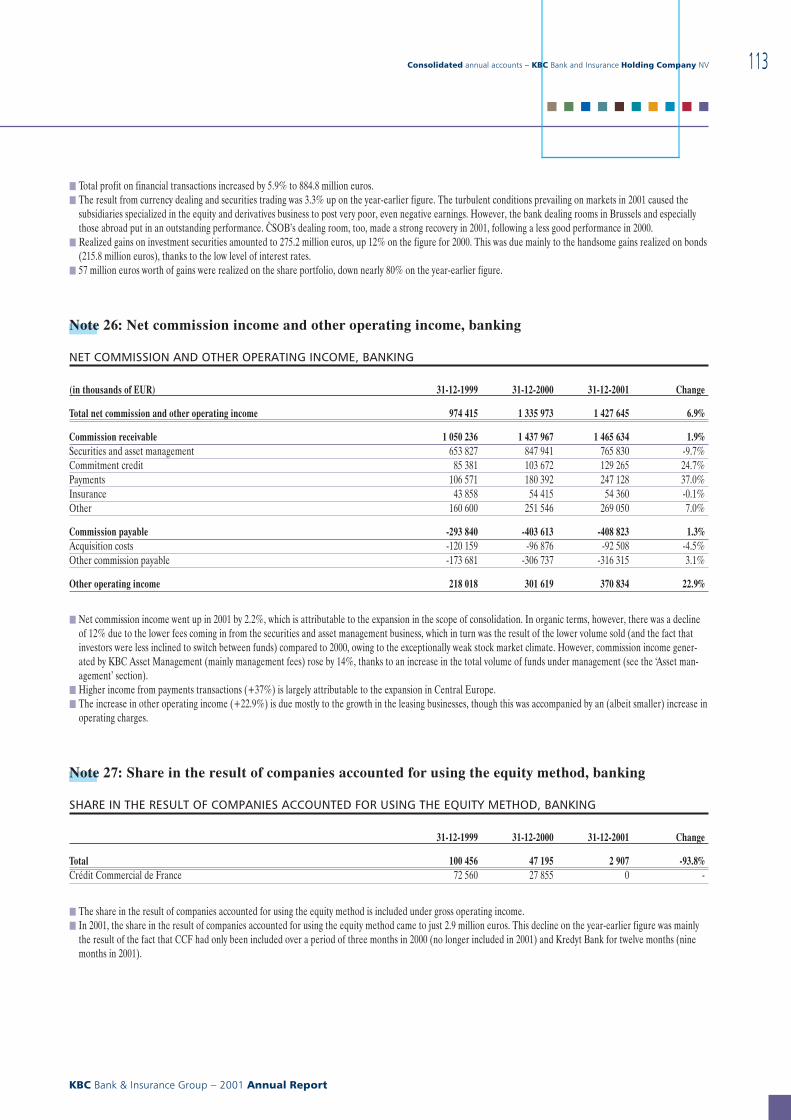
j Total profit on financial transactions increased by 5.9% to 884.8 million euros.j The result from currency dealing and securities trading was 3.3% up on the year-earlier figure. The turbulent conditions prevailing on markets in 2001 caused the
subsidiaries specialized in the equity and derivatives business to post very poor, even negative earnings. However, the bank dealing rooms in Brussels and especiallythose abroad put in an outstanding performance. C{SOB’s dealing room, too, made a strong recovery in 2001, following a less good performance in 2000.
j Realized gains on investment securities amounted to 275.2 million euros, up 12% on the figure for 2000. This was due mainly to the handsome gains realized on bonds(215.8 million euros), thanks to the low level of interest rates.
j 57 million euros worth of gains were realized on the share portfolio, down nearly 80% on the year-earlier figure.
Note 26: Net commission income and other operating income, banking
NET COMMISSION AND OTHER OPERATING INCOME, BANKING
(in thousands of EUR) 31-12-1999 31-12-2000 31-12-2001 Change
Total net commission and other operating income 974 415 1 335 973 1 427 645 6.9%
Commission receivable 1 050 236 1 437 967 1 465 634 1.9%Securities and asset management 653 827 847 941 765 830 -9.7%Commitment credit 85 381 103 672 129 265 24.7%Payments 106 571 180 392 247 128 37.0%Insurance 43 858 54 415 54 360 -0.1%Other 160 600 251 546 269 050 7.0%
Commission payable -293 840 -403 613 -408 823 1.3%Acquisition costs -120 159 -96 876 -92 508 -4.5%Other commission payable -173 681 -306 737 -316 315 3.1%
Other operating income 218 018 301 619 370 834 22.9%
j Net commission income went up in 2001 by 2.2%, which is attributable to the expansion in the scope of consolidation. In organic terms, however, there was a declineof 12% due to the lower fees coming in from the securities and asset management business, which in turn was the result of the lower volume sold (and the fact thatinvestors were less inclined to switch between funds) compared to 2000, owing to the exceptionally weak stock market climate. However, commission income gener-ated by KBC Asset Management (mainly management fees) rose by 14%, thanks to an increase in the total volume of funds under management (see the ‘Asset man-agement’ section).
j Higher income from payments transactions (+37%) is largely attributable to the expansion in Central Europe.j The increase in other operating income (+22.9%) is due mostly to the growth in the leasing businesses, though this was accompanied by an (albeit smaller) increase in
operating charges.
Note 27: Share in the result of companies accounted for using the equity method, banking
SHARE IN THE RESULT OF COMPANIES ACCOUNTED FOR USING THE EQUITY METHOD, BANKING
31-12-1999 31-12-2000 31-12-2001 Change
Total 100 456 47 195 2 907 -93.8%Crédit Commercial de France 72 560 27 855 0 -
j The share in the result of companies accounted for using the equity method is included under gross operating income.j In 2001, the share in the result of companies accounted for using the equity method came to just 2.9 million euros. This decline on the year-earlier figure was mainly
the result of the fact that CCF had only been included over a period of three months in 2000 (no longer included in 2001) and Kredyt Bank for twelve months (ninemonths in 2001).
Consolidated annual accounts − KBC Bank and Insurance Holding Company NV
KBC Bank & Insurance Group − 2001 Annual Report
113
■ ■ ■ ■ ■ ■ ■ ■ ■ ■
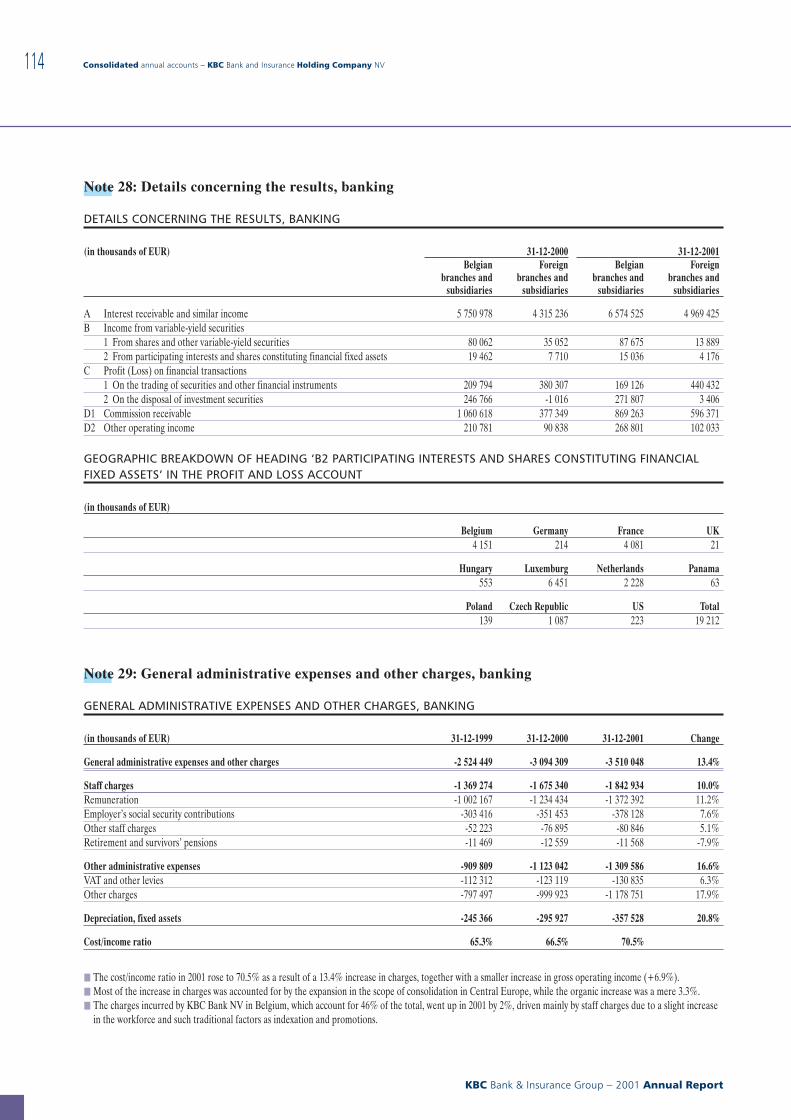
Note 28: Details concerning the results, banking
DETAILS CONCERNING THE RESULTS, BANKING
(in thousands of EUR) 31-12-2000 31-12-2001Belgian
branches andsubsidiaries
Foreignbranches and
subsidiaries
Belgianbranches and
subsidiaries
Foreignbranches and
subsidiaries
A Interest receivable and similar income 5 750 978 4 315 236 6 574 525 4 969 425B Income from variable-yield securities
1 From shares and other variable-yield securities 80 062 35 052 87 675 13 8892 From participating interests and shares constituting financial fixed assets 19 462 7 710 15 036 4 176
C Profit (Loss) on financial transactions1 On the trading of securities and other financial instruments 209 794 380 307 169 126 440 4322 On the disposal of investment securities 246 766 -1 016 271 807 3 406
D1 Commission receivable 1 060 618 377 349 869 263 596 371D2 Other operating income 210 781 90 838 268 801 102 033
GEOGRAPHIC BREAKDOWN OF HEADING ‘B2 PARTICIPATING INTERESTS AND SHARES CONSTITUTING FINANCIALFIXED ASSETS’ IN THE PROFIT AND LOSS ACCOUNT
(in thousands of EUR)
Belgium Germany France UK4 151 214 4 081 21
Hungary Luxemburg Netherlands Panama553 6 451 2 228 63
Poland Czech Republic US Total139 1 087 223 19 212
Note 29: General administrative expenses and other charges, banking
GENERAL ADMINISTRATIVE EXPENSES AND OTHER CHARGES, BANKING
(in thousands of EUR) 31-12-1999 31-12-2000 31-12-2001 Change
General administrative expenses and other charges -2 524 449 -3 094 309 -3 510 048 13.4%
Staff charges -1 369 274 -1 675 340 -1 842 934 10.0%Remuneration -1 002 167 -1 234 434 -1 372 392 11.2%Employer’s social security contributions -303 416 -351 453 -378 128 7.6%Other staff charges -52 223 -76 895 -80 846 5.1%Retirement and survivors’ pensions -11 469 -12 559 -11 568 -7.9%
Other administrative expenses -909 809 -1 123 042 -1 309 586 16.6%VAT and other levies -112 312 -123 119 -130 835 6.3%Other charges -797 497 -999 923 -1 178 751 17.9%
Depreciation, fixed assets -245 366 -295 927 -357 528 20.8%
Cost/income ratio 65.3% 66.5% 70.5%
j The cost/income ratio in 2001 rose to 70.5% as a result of a 13.4% increase in charges, together with a smaller increase in gross operating income (+6.9%).j Most of the increase in charges was accounted for by the expansion in the scope of consolidation in Central Europe, while the organic increase was a mere 3.3%.j The charges incurred by KBC Bank NV in Belgium, which account for 46% of the total, went up in 2001 by 2%, driven mainly by staff charges due to a slight increase
in the workforce and such traditional factors as indexation and promotions.
Consolidated annual accounts − KBC Bank and Insurance Holding Company NV
KBC Bank & Insurance Group − 2001 Annual Report
114
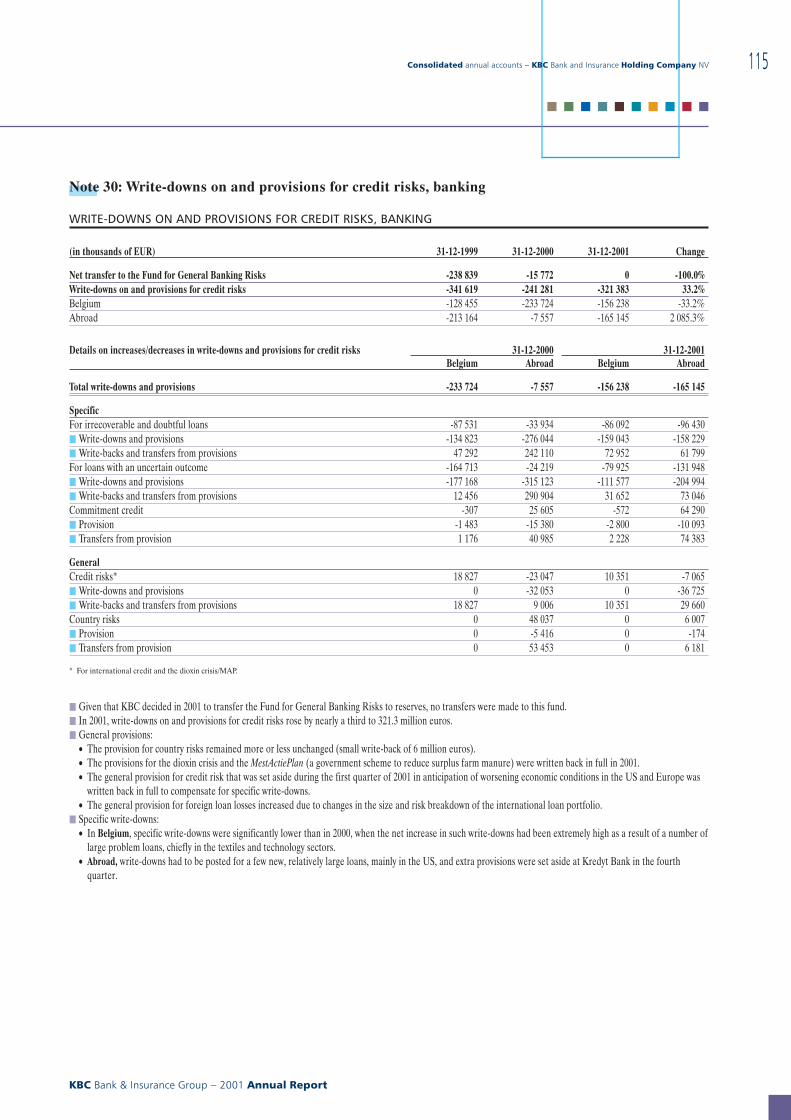
Note 30: Write-downs on and provisions for credit risks, banking
WRITE-DOWNS ON AND PROVISIONS FOR CREDIT RISKS, BANKING
(in thousands of EUR) 31-12-1999 31-12-2000 31-12-2001 Change
Net transfer to the Fund for General Banking Risks -238 839 -15 772 0 -100.0%Write-downs on and provisions for credit risks -341 619 -241 281 -321 383 33.2%Belgium -128 455 -233 724 -156 238 -33.2%Abroad -213 164 -7 557 -165 145 2 085.3%
Details on increases/decreases in write-downs and provisions for credit risks 31-12-2000 31-12-2001Belgium Abroad Belgium Abroad
Total write-downs and provisions -233 724 -7 557 -156 238 -165 145
SpecificFor irrecoverable and doubtful loans -87 531 -33 934 -86 092 -96 430j Write-downs and provisions -134 823 -276 044 -159 043 -158 229j Write-backs and transfers from provisions 47 292 242 110 72 952 61 799For loans with an uncertain outcome -164 713 -24 219 -79 925 -131 948j Write-downs and provisions -177 168 -315 123 -111 577 -204 994j Write-backs and transfers from provisions 12 456 290 904 31 652 73 046Commitment credit -307 25 605 -572 64 290j Provision -1 483 -15 380 -2 800 -10 093j Transfers from provision 1 176 40 985 2 228 74 383
GeneralCredit risks* 18 827 -23 047 10 351 -7 065j Write-downs and provisions 0 -32 053 0 -36 725j Write-backs and transfers from provisions 18 827 9 006 10 351 29 660Country risks 0 48 037 0 6 007j Provision 0 -5 416 0 -174j Transfers from provision 0 53 453 0 6 181
* For international credit and the dioxin crisis/MAP.
j Given that KBC decided in 2001 to transfer the Fund for General Banking Risks to reserves, no transfers were made to this fund.j In 2001, write-downs on and provisions for credit risks rose by nearly a third to 321.3 million euros.j General provisions:
• The provision for country risks remained more or less unchanged (small write-back of 6 million euros).• The provisions for the dioxin crisis and the MestActiePlan (a government scheme to reduce surplus farm manure) were written back in full in 2001.• The general provision for credit risk that was set aside during the first quarter of 2001 in anticipation of worsening economic conditions in the US and Europe was
written back in full to compensate for specific write-downs.• The general provision for foreign loan losses increased due to changes in the size and risk breakdown of the international loan portfolio.
j Specific write-downs:• In Belgium, specific write-downs were significantly lower than in 2000, when the net increase in such write-downs had been extremely high as a result of a number of
large problem loans, chiefly in the textiles and technology sectors.• Abroad, write-downs had to be posted for a few new, relatively large loans, mainly in the US, and extra provisions were set aside at Kredyt Bank in the fourth
quarter.
Consolidated annual accounts − KBC Bank and Insurance Holding Company NV
KBC Bank & Insurance Group − 2001 Annual Report
115
■ ■ ■ ■ ■ ■ ■ ■ ■ ■
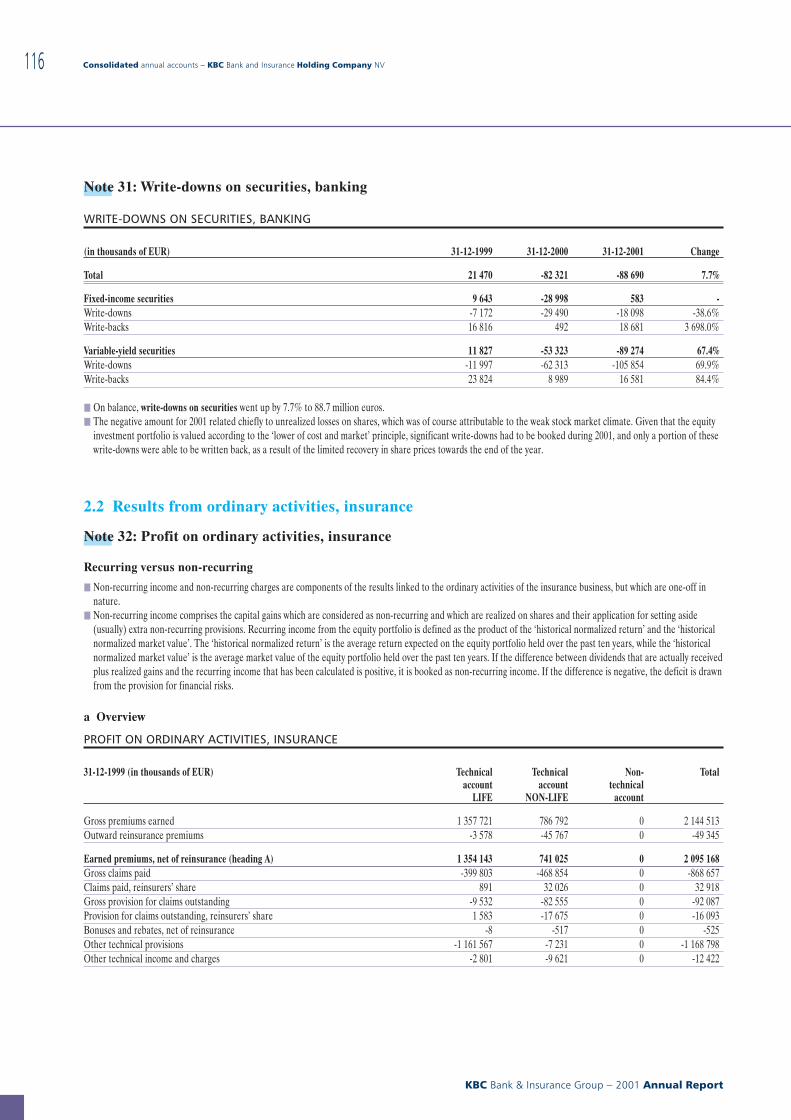
Note 31: Write-downs on securities, banking
WRITE-DOWNS ON SECURITIES, BANKING
(in thousands of EUR) 31-12-1999 31-12-2000 31-12-2001 Change
Total 21 470 -82 321 -88 690 7.7%
Fixed-income securities 9 643 -28 998 583 -Write-downs -7 172 -29 490 -18 098 -38.6%Write-backs 16 816 492 18 681 3 698.0%
Variable-yield securities 11 827 -53 323 -89 274 67.4%Write-downs -11 997 -62 313 -105 854 69.9%Write-backs 23 824 8 989 16 581 84.4%
j On balance, write-downs on securities went up by 7.7% to 88.7 million euros.j The negative amount for 2001 related chiefly to unrealized losses on shares, which was of course attributable to the weak stock market climate. Given that the equity
investment portfolio is valued according to the ‘lower of cost and market’ principle, significant write-downs had to be booked during 2001, and only a portion of thesewrite-downs were able to be written back, as a result of the limited recovery in share prices towards the end of the year.
2.2 Results from ordinary activities, insurance
Note 32: Profit on ordinary activities, insurance
Recurring versus non-recurring
j Non-recurring income and non-recurring charges are components of the results linked to the ordinary activities of the insurance business, but which are one-off innature.
j Non-recurring income comprises the capital gains which are considered as non-recurring and which are realized on shares and their application for setting aside(usually) extra non-recurring provisions. Recurring income from the equity portfolio is defined as the product of the ‘historical normalized return’ and the ‘historicalnormalized market value’. The ‘historical normalized return’ is the average return expected on the equity portfolio held over the past ten years, while the ‘historicalnormalized market value’ is the average market value of the equity portfolio held over the past ten years. If the difference between dividends that are actually receivedplus realized gains and the recurring income that has been calculated is positive, it is booked as non-recurring income. If the difference is negative, the deficit is drawnfrom the provision for financial risks.
a Overview
PROFIT ON ORDINARY ACTIVITIES, INSURANCE
31-12-1999 (in thousands of EUR) Technicalaccount
LIFE
Technicalaccount
NON-LIFE
Non-technical
account
Total
Gross premiums earned 1 357 721 786 792 0 2 144 513Outward reinsurance premiums -3 578 -45 767 0 -49 345
Earned premiums, net of reinsurance (heading A) 1 354 143 741 025 0 2 095 168Gross claims paid -399 803 -468 854 0 -868 657Claims paid, reinsurers’ share 891 32 026 0 32 918Gross provision for claims outstanding -9 532 -82 555 0 -92 087Provision for claims outstanding, reinsurers’ share 1 583 -17 675 0 -16 093Bonuses and rebates, net of reinsurance -8 -517 0 -525Other technical provisions -1 161 567 -7 231 0 -1 168 798Other technical income and charges -2 801 -9 621 0 -12 422
Consolidated annual accounts − KBC Bank and Insurance Holding Company NV
KBC Bank & Insurance Group − 2001 Annual Report
116
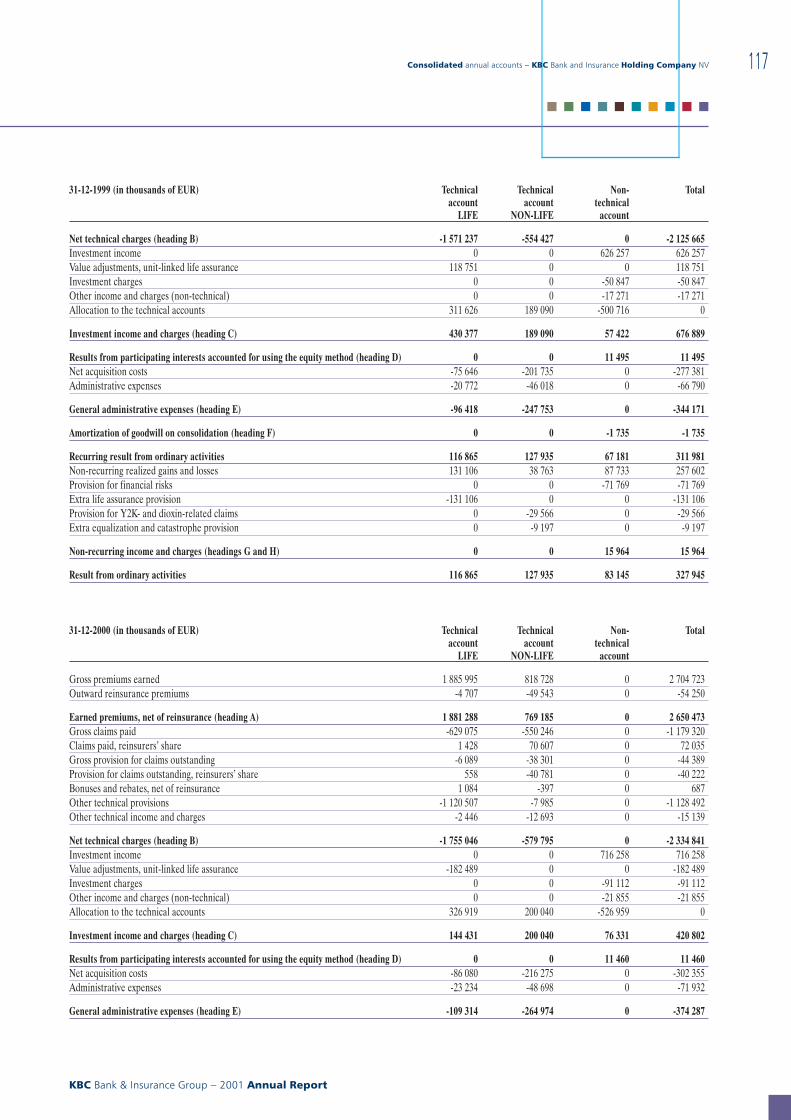
31-12-1999 (in thousands of EUR) Technicalaccount
LIFE
Technicalaccount
NON-LIFE
Non-technical
account
Total
Net technical charges (heading B) -1 571 237 -554 427 0 -2 125 665Investment income 0 0 626 257 626 257Value adjustments, unit-linked life assurance 118 751 0 0 118 751Investment charges 0 0 -50 847 -50 847Other income and charges (non-technical) 0 0 -17 271 -17 271Allocation to the technical accounts 311 626 189 090 -500 716 0
Investment income and charges (heading C) 430 377 189 090 57 422 676 889
Results from participating interests accounted for using the equity method (heading D) 0 0 11 495 11 495Net acquisition costs -75 646 -201 735 0 -277 381Administrative expenses -20 772 -46 018 0 -66 790
General administrative expenses (heading E) -96 418 -247 753 0 -344 171
Amortization of goodwill on consolidation (heading F) 0 0 -1 735 -1 735
Recurring result from ordinary activities 116 865 127 935 67 181 311 981Non-recurring realized gains and losses 131 106 38 763 87 733 257 602Provision for financial risks 0 0 -71 769 -71 769Extra life assurance provision -131 106 0 0 -131 106Provision for Y2K- and dioxin-related claims 0 -29 566 0 -29 566Extra equalization and catastrophe provision 0 -9 197 0 -9 197
Non-recurring income and charges (headings G and H) 0 0 15 964 15 964
Result from ordinary activities 116 865 127 935 83 145 327 945
31-12-2000 (in thousands of EUR) Technicalaccount
LIFE
Technicalaccount
NON-LIFE
Non-technical
account
Total
Gross premiums earned 1 885 995 818 728 0 2 704 723Outward reinsurance premiums -4 707 -49 543 0 -54 250
Earned premiums, net of reinsurance (heading A) 1 881 288 769 185 0 2 650 473Gross claims paid -629 075 -550 246 0 -1 179 320Claims paid, reinsurers’ share 1 428 70 607 0 72 035Gross provision for claims outstanding -6 089 -38 301 0 -44 389Provision for claims outstanding, reinsurers’ share 558 -40 781 0 -40 222Bonuses and rebates, net of reinsurance 1 084 -397 0 687Other technical provisions -1 120 507 -7 985 0 -1 128 492Other technical income and charges -2 446 -12 693 0 -15 139
Net technical charges (heading B) -1 755 046 -579 795 0 -2 334 841Investment income 0 0 716 258 716 258Value adjustments, unit-linked life assurance -182 489 0 0 -182 489Investment charges 0 0 -91 112 -91 112Other income and charges (non-technical) 0 0 -21 855 -21 855Allocation to the technical accounts 326 919 200 040 -526 959 0
Investment income and charges (heading C) 144 431 200 040 76 331 420 802
Results from participating interests accounted for using the equity method (heading D) 0 0 11 460 11 460Net acquisition costs -86 080 -216 275 0 -302 355Administrative expenses -23 234 -48 698 0 -71 932
General administrative expenses (heading E) -109 314 -264 974 0 -374 287
Consolidated annual accounts − KBC Bank and Insurance Holding Company NV
KBC Bank & Insurance Group − 2001 Annual Report
117
■ ■ ■ ■ ■ ■ ■ ■ ■ ■
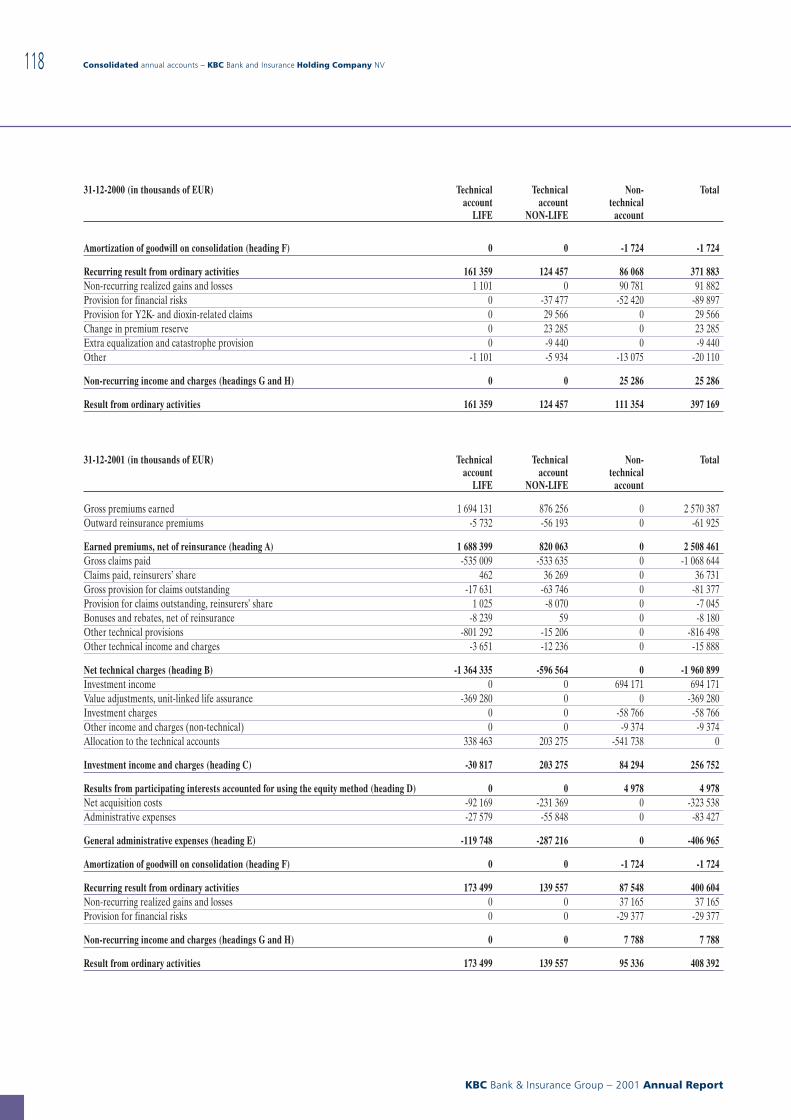
31-12-2000 (in thousands of EUR) Technicalaccount
LIFE
Technicalaccount
NON-LIFE
Non-technical
account
Total
Amortization of goodwill on consolidation (heading F) 0 0 -1 724 -1 724
Recurring result from ordinary activities 161 359 124 457 86 068 371 883Non-recurring realized gains and losses 1 101 0 90 781 91 882Provision for financial risks 0 -37 477 -52 420 -89 897Provision for Y2K- and dioxin-related claims 0 29 566 0 29 566Change in premium reserve 0 23 285 0 23 285Extra equalization and catastrophe provision 0 -9 440 0 -9 440Other -1 101 -5 934 -13 075 -20 110
Non-recurring income and charges (headings G and H) 0 0 25 286 25 286
Result from ordinary activities 161 359 124 457 111 354 397 169
31-12-2001 (in thousands of EUR) Technicalaccount
LIFE
Technicalaccount
NON-LIFE
Non-technical
account
Total
Gross premiums earned 1 694 131 876 256 0 2 570 387Outward reinsurance premiums -5 732 -56 193 0 -61 925
Earned premiums, net of reinsurance (heading A) 1 688 399 820 063 0 2 508 461Gross claims paid -535 009 -533 635 0 -1 068 644Claims paid, reinsurers’ share 462 36 269 0 36 731Gross provision for claims outstanding -17 631 -63 746 0 -81 377Provision for claims outstanding, reinsurers’ share 1 025 -8 070 0 -7 045Bonuses and rebates, net of reinsurance -8 239 59 0 -8 180Other technical provisions -801 292 -15 206 0 -816 498Other technical income and charges -3 651 -12 236 0 -15 888
Net technical charges (heading B) -1 364 335 -596 564 0 -1 960 899Investment income 0 0 694 171 694 171Value adjustments, unit-linked life assurance -369 280 0 0 -369 280Investment charges 0 0 -58 766 -58 766Other income and charges (non-technical) 0 0 -9 374 -9 374Allocation to the technical accounts 338 463 203 275 -541 738 0
Investment income and charges (heading C) -30 817 203 275 84 294 256 752
Results from participating interests accounted for using the equity method (heading D) 0 0 4 978 4 978Net acquisition costs -92 169 -231 369 0 -323 538Administrative expenses -27 579 -55 848 0 -83 427
General administrative expenses (heading E) -119 748 -287 216 0 -406 965
Amortization of goodwill on consolidation (heading F) 0 0 -1 724 -1 724
Recurring result from ordinary activities 173 499 139 557 87 548 400 604Non-recurring realized gains and losses 0 0 37 165 37 165Provision for financial risks 0 0 -29 377 -29 377
Non-recurring income and charges (headings G and H) 0 0 7 788 7 788
Result from ordinary activities 173 499 139 557 95 336 408 392
Consolidated annual accounts − KBC Bank and Insurance Holding Company NV
KBC Bank & Insurance Group − 2001 Annual Report
118
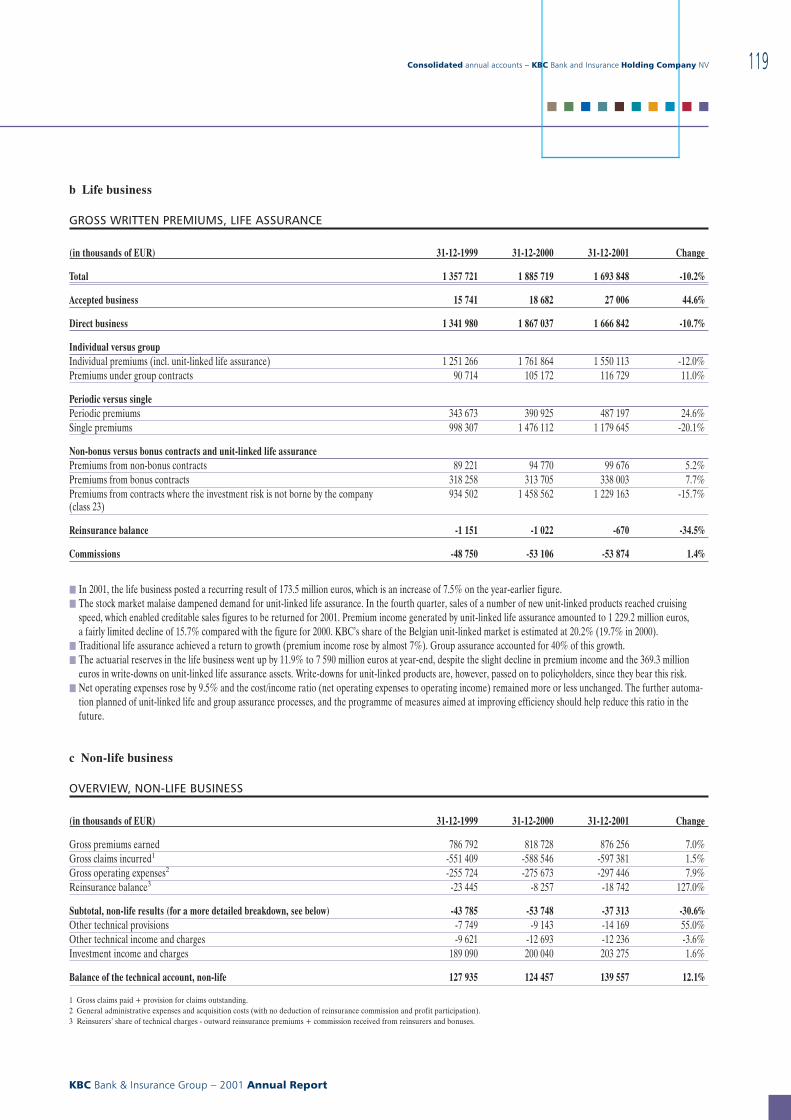
b Life business
GROSS WRITTEN PREMIUMS, LIFE ASSURANCE
(in thousands of EUR) 31-12-1999 31-12-2000 31-12-2001 Change
Total 1 357 721 1 885 719 1 693 848 -10.2%
Accepted business 15 741 18 682 27 006 44.6%
Direct business 1 341 980 1 867 037 1 666 842 -10.7%
Individual versus groupIndividual premiums (incl. unit-linked life assurance) 1 251 266 1 761 864 1 550 113 -12.0%Premiums under group contracts 90 714 105 172 116 729 11.0%
Periodic versus singlePeriodic premiums 343 673 390 925 487 197 24.6%Single premiums 998 307 1 476 112 1 179 645 -20.1%
Non-bonus versus bonus contracts and unit-linked life assurancePremiums from non-bonus contracts 89 221 94 770 99 676 5.2%Premiums from bonus contracts 318 258 313 705 338 003 7.7%Premiums from contracts where the investment risk is not borne by the company(class 23)
934 502 1 458 562 1 229 163 -15.7%
Reinsurance balance -1 151 -1 022 -670 -34.5%
Commissions -48 750 -53 106 -53 874 1.4%
j In 2001, the life business posted a recurring result of 173.5 million euros, which is an increase of 7.5% on the year-earlier figure.j The stock market malaise dampened demand for unit-linked life assurance. In the fourth quarter, sales of a number of new unit-linked products reached cruising
speed, which enabled creditable sales figures to be returned for 2001. Premium income generated by unit-linked life assurance amounted to 1 229.2 million euros,a fairly limited decline of 15.7% compared with the figure for 2000. KBC’s share of the Belgian unit-linked market is estimated at 20.2% (19.7% in 2000).
j Traditional life assurance achieved a return to growth (premium income rose by almost 7%). Group assurance accounted for 40% of this growth.j The actuarial reserves in the life business went up by 11.9% to 7 590 million euros at year-end, despite the slight decline in premium income and the 369.3 million
euros in write-downs on unit-linked life assurance assets. Write-downs for unit-linked products are, however, passed on to policyholders, since they bear this risk.j Net operating expenses rose by 9.5% and the cost/income ratio (net operating expenses to operating income) remained more or less unchanged. The further automa-
tion planned of unit-linked life and group assurance processes, and the programme of measures aimed at improving efficiency should help reduce this ratio in thefuture.
c Non-life business
OVERVIEW, NON-LIFE BUSINESS
(in thousands of EUR) 31-12-1999 31-12-2000 31-12-2001 Change
Gross premiums earned 786 792 818 728 876 256 7.0%Gross claims incurred1 -551 409 -588 546 -597 381 1.5%Gross operating expenses2 -255 724 -275 673 -297 446 7.9%Reinsurance balance3 -23 445 -8 257 -18 742 127.0%
Subtotal, non-life results (for a more detailed breakdown, see below) -43 785 -53 748 -37 313 -30.6%Other technical provisions -7 749 -9 143 -14 169 55.0%Other technical income and charges -9 621 -12 693 -12 236 -3.6%Investment income and charges 189 090 200 040 203 275 1.6%
Balance of the technical account, non-life 127 935 124 457 139 557 12.1%
1 Gross claims paid + provision for claims outstanding.2 General administrative expenses and acquisition costs (with no deduction of reinsurance commission and profit participation).3 Reinsurers’ share of technical charges - outward reinsurance premiums + commission received from reinsurers and bonuses.
Consolidated annual accounts − KBC Bank and Insurance Holding Company NV
KBC Bank & Insurance Group − 2001 Annual Report
119
■ ■ ■ ■ ■ ■ ■ ■ ■ ■
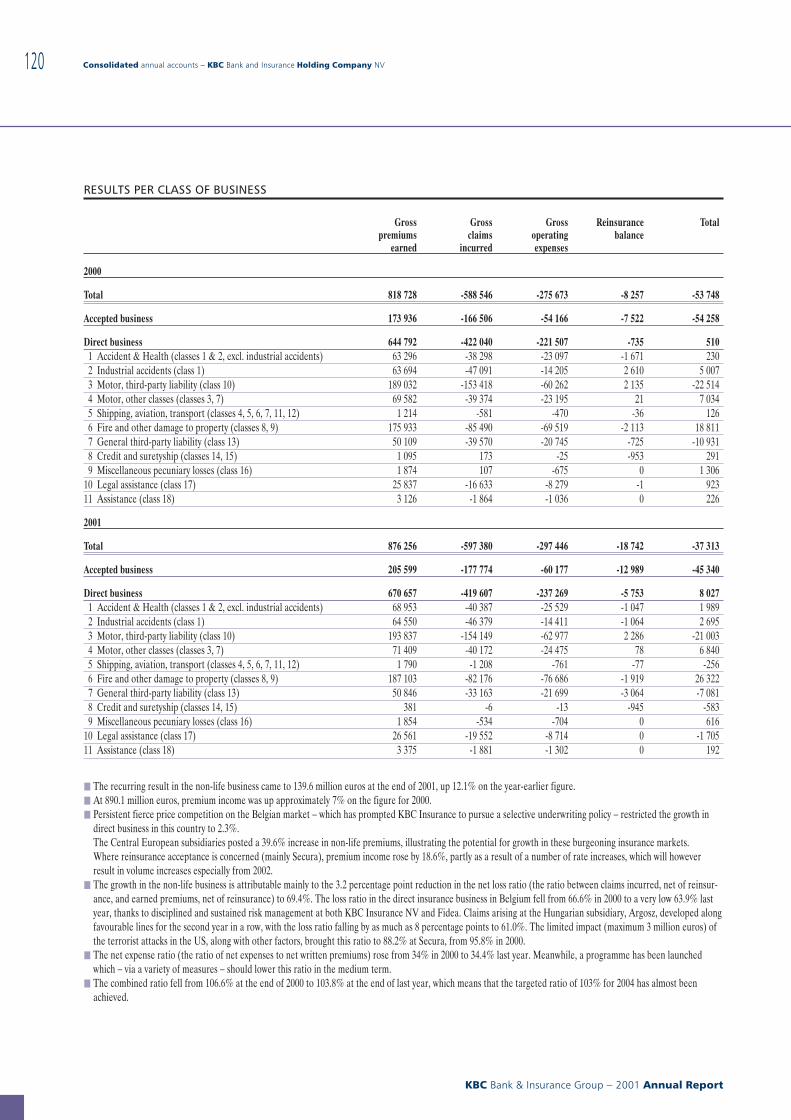
RESULTS PER CLASS OF BUSINESS
Grosspremiums
earned
Grossclaims
incurred
Grossoperatingexpenses
Reinsurancebalance
Total
2000
Total 818 728 -588 546 -275 673 -8 257 -53 748
Accepted business 173 936 -166 506 -54 166 -7 522 -54 258
Direct business 644 792 -422 040 -221 507 -735 5101 Accident & Health (classes 1 & 2, excl. industrial accidents) 63 296 -38 298 -23 097 -1 671 2302 Industrial accidents (class 1) 63 694 -47 091 -14 205 2 610 5 0073 Motor, third-party liability (class 10) 189 032 -153 418 -60 262 2 135 -22 5144 Motor, other classes (classes 3, 7) 69 582 -39 374 -23 195 21 7 0345 Shipping, aviation, transport (classes 4, 5, 6, 7, 11, 12) 1 214 -581 -470 -36 1266 Fire and other damage to property (classes 8, 9) 175 933 -85 490 -69 519 -2 113 18 8117 General third-party liability (class 13) 50 109 -39 570 -20 745 -725 -10 9318 Credit and suretyship (classes 14, 15) 1 095 173 -25 -953 2919 Miscellaneous pecuniary losses (class 16) 1 874 107 -675 0 1 306
10 Legal assistance (class 17) 25 837 -16 633 -8 279 -1 92311 Assistance (class 18) 3 126 -1 864 -1 036 0 226
2001
Total 876 256 -597 380 -297 446 -18 742 -37 313
Accepted business 205 599 -177 774 -60 177 -12 989 -45 340
Direct business 670 657 -419 607 -237 269 -5 753 8 0271 Accident & Health (classes 1 & 2, excl. industrial accidents) 68 953 -40 387 -25 529 -1 047 1 9892 Industrial accidents (class 1) 64 550 -46 379 -14 411 -1 064 2 6953 Motor, third-party liability (class 10) 193 837 -154 149 -62 977 2 286 -21 0034 Motor, other classes (classes 3, 7) 71 409 -40 172 -24 475 78 6 8405 Shipping, aviation, transport (classes 4, 5, 6, 7, 11, 12) 1 790 -1 208 -761 -77 -2566 Fire and other damage to property (classes 8, 9) 187 103 -82 176 -76 686 -1 919 26 3227 General third-party liability (class 13) 50 846 -33 163 -21 699 -3 064 -7 0818 Credit and suretyship (classes 14, 15) 381 -6 -13 -945 -5839 Miscellaneous pecuniary losses (class 16) 1 854 -534 -704 0 616
10 Legal assistance (class 17) 26 561 -19 552 -8 714 0 -1 70511 Assistance (class 18) 3 375 -1 881 -1 302 0 192
j The recurring result in the non-life business came to 139.6 million euros at the end of 2001, up 12.1% on the year-earlier figure.j At 890.1 million euros, premium income was up approximately 7% on the figure for 2000.j Persistent fierce price competition on the Belgian market − which has prompted KBC Insurance to pursue a selective underwriting policy − restricted the growth in
direct business in this country to 2.3%.The Central European subsidiaries posted a 39.6% increase in non-life premiums, illustrating the potential for growth in these burgeoning insurance markets.Where reinsurance acceptance is concerned (mainly Secura), premium income rose by 18.6%, partly as a result of a number of rate increases, which will howeverresult in volume increases especially from 2002.
j The growth in the non-life business is attributable mainly to the 3.2 percentage point reduction in the net loss ratio (the ratio between claims incurred, net of reinsur-ance, and earned premiums, net of reinsurance) to 69.4%. The loss ratio in the direct insurance business in Belgium fell from 66.6% in 2000 to a very low 63.9% lastyear, thanks to disciplined and sustained risk management at both KBC Insurance NV and Fidea. Claims arising at the Hungarian subsidiary, Argosz, developed alongfavourable lines for the second year in a row, with the loss ratio falling by as much as 8 percentage points to 61.0%. The limited impact (maximum 3 million euros) ofthe terrorist attacks in the US, along with other factors, brought this ratio to 88.2% at Secura, from 95.8% in 2000.
j The net expense ratio (the ratio of net expenses to net written premiums) rose from 34% in 2000 to 34.4% last year. Meanwhile, a programme has been launchedwhich − via a variety of measures − should lower this ratio in the medium term.
j The combined ratio fell from 106.6% at the end of 2000 to 103.8% at the end of last year, which means that the targeted ratio of 103% for 2004 has almost beenachieved.
Consolidated annual accounts − KBC Bank and Insurance Holding Company NV
KBC Bank & Insurance Group − 2001 Annual Report
120
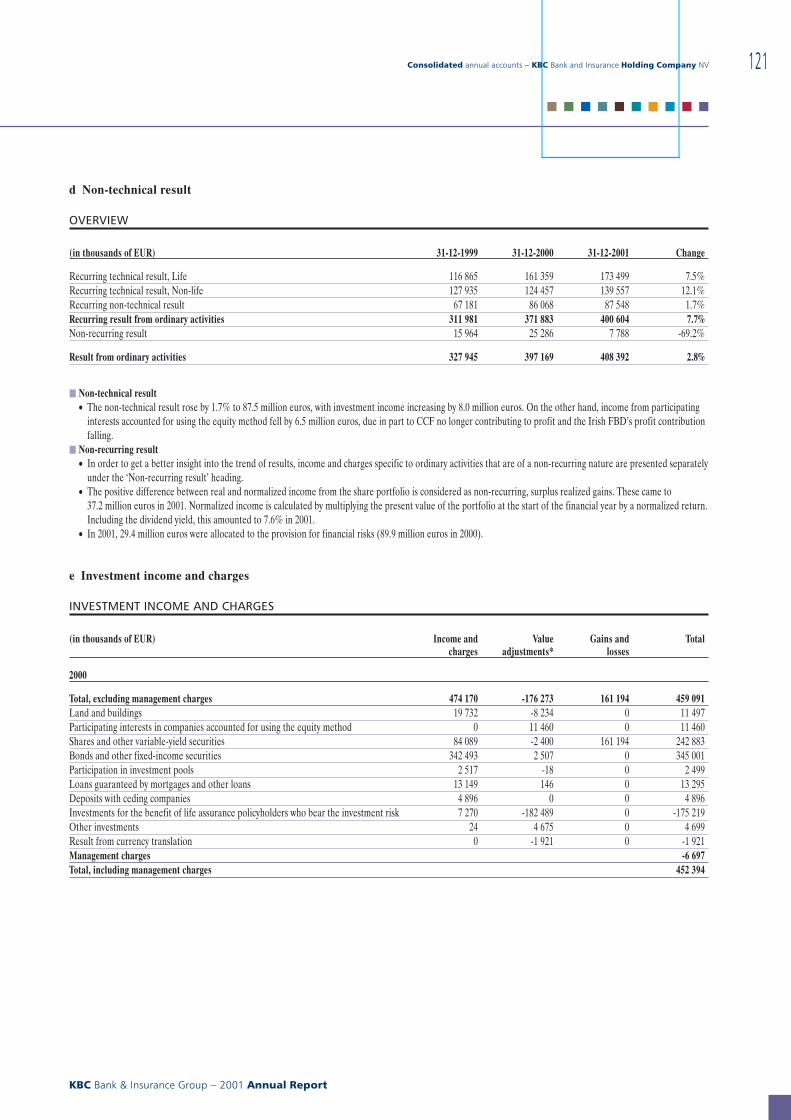
d Non-technical result
OVERVIEW
(in thousands of EUR) 31-12-1999 31-12-2000 31-12-2001 Change
Recurring technical result, Life 116 865 161 359 173 499 7.5%Recurring technical result, Non-life 127 935 124 457 139 557 12.1%Recurring non-technical result 67 181 86 068 87 548 1.7%Recurring result from ordinary activities 311 981 371 883 400 604 7.7%Non-recurring result 15 964 25 286 7 788 -69.2%
Result from ordinary activities 327 945 397 169 408 392 2.8%
j Non-technical result• The non-technical result rose by 1.7% to 87.5 million euros, with investment income increasing by 8.0 million euros. On the other hand, income from participating
interests accounted for using the equity method fell by 6.5 million euros, due in part to CCF no longer contributing to profit and the Irish FBD’s profit contributionfalling.
j Non-recurring result• In order to get a better insight into the trend of results, income and charges specific to ordinary activities that are of a non-recurring nature are presented separately
under the ‘Non-recurring result’ heading.• The positive difference between real and normalized income from the share portfolio is considered as non-recurring, surplus realized gains. These came to
37.2 million euros in 2001. Normalized income is calculated by multiplying the present value of the portfolio at the start of the financial year by a normalized return.Including the dividend yield, this amounted to 7.6% in 2001.
• In 2001, 29.4 million euros were allocated to the provision for financial risks (89.9 million euros in 2000).
e Investment income and charges
INVESTMENT INCOME AND CHARGES
(in thousands of EUR) Income andcharges
Valueadjustments*
Gains andlosses
Total
2000
Total, excluding management charges 474 170 -176 273 161 194 459 091Land and buildings 19 732 -8 234 0 11 497Participating interests in companies accounted for using the equity method 0 11 460 0 11 460Shares and other variable-yield securities 84 089 -2 400 161 194 242 883Bonds and other fixed-income securities 342 493 2 507 0 345 001Participation in investment pools 2 517 -18 0 2 499Loans guaranteed by mortgages and other loans 13 149 146 0 13 295Deposits with ceding companies 4 896 0 0 4 896Investments for the benefit of life assurance policyholders who bear the investment risk 7 270 -182 489 0 -175 219Other investments 24 4 675 0 4 699Result from currency translation 0 -1 921 0 -1 921Management charges -6 697Total, including management charges 452 394
Consolidated annual accounts − KBC Bank and Insurance Holding Company NV
KBC Bank & Insurance Group − 2001 Annual Report
121
■ ■ ■ ■ ■ ■ ■ ■ ■ ■
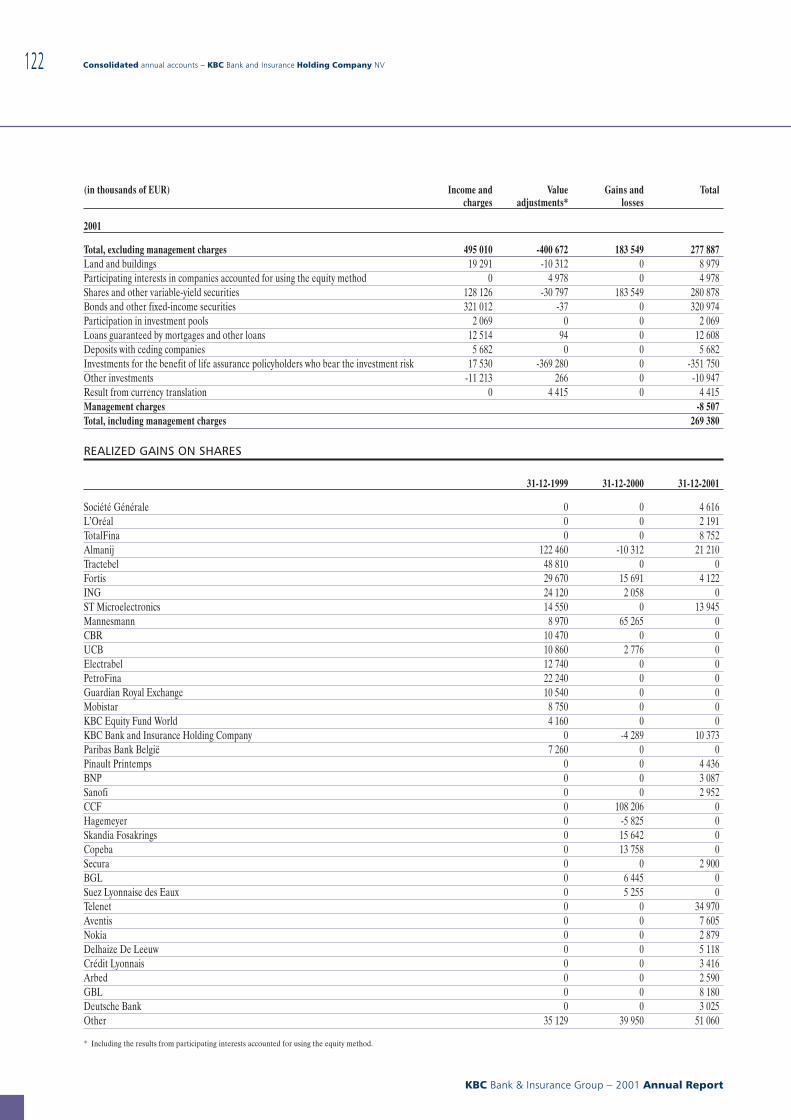
(in thousands of EUR) Income andcharges
Valueadjustments*
Gains andlosses
Total
2001
Total, excluding management charges 495 010 -400 672 183 549 277 887Land and buildings 19 291 -10 312 0 8 979Participating interests in companies accounted for using the equity method 0 4 978 0 4 978Shares and other variable-yield securities 128 126 -30 797 183 549 280 878Bonds and other fixed-income securities 321 012 -37 0 320 974Participation in investment pools 2 069 0 0 2 069Loans guaranteed by mortgages and other loans 12 514 94 0 12 608Deposits with ceding companies 5 682 0 0 5 682Investments for the benefit of life assurance policyholders who bear the investment risk 17 530 -369 280 0 -351 750Other investments -11 213 266 0 -10 947Result from currency translation 0 4 415 0 4 415Management charges -8 507Total, including management charges 269 380
REALIZED GAINS ON SHARES
31-12-1999 31-12-2000 31-12-2001
Société Générale 0 0 4 616L’Oréal 0 0 2 191TotalFina 0 0 8 752Almanij 122 460 -10 312 21 210Tractebel 48 810 0 0Fortis 29 670 15 691 4 122ING 24 120 2 058 0ST Microelectronics 14 550 0 13 945Mannesmann 8 970 65 265 0CBR 10 470 0 0UCB 10 860 2 776 0Electrabel 12 740 0 0PetroFina 22 240 0 0Guardian Royal Exchange 10 540 0 0Mobistar 8 750 0 0KBC Equity Fund World 4 160 0 0KBC Bank and Insurance Holding Company 0 -4 289 10 373Paribas Bank België 7 260 0 0Pinault Printemps 0 0 4 436BNP 0 0 3 087Sanofi 0 0 2 952CCF 0 108 206 0Hagemeyer 0 -5 825 0Skandia Fosakrings 0 15 642 0Copeba 0 13 758 0Secura 0 0 2 900BGL 0 6 445 0Suez Lyonnaise des Eaux 0 5 255 0Telenet 0 0 34 970Aventis 0 0 7 605Nokia 0 0 2 879Delhaize De Leeuw 0 0 5 118Crédit Lyonnais 0 0 3 416Arbed 0 0 2 590GBL 0 0 8 180Deutsche Bank 0 0 3 025Other 35 129 39 950 51 060
* Including the results from participating interests accounted for using the equity method.
Consolidated annual accounts − KBC Bank and Insurance Holding Company NV
KBC Bank & Insurance Group − 2001 Annual Report
122
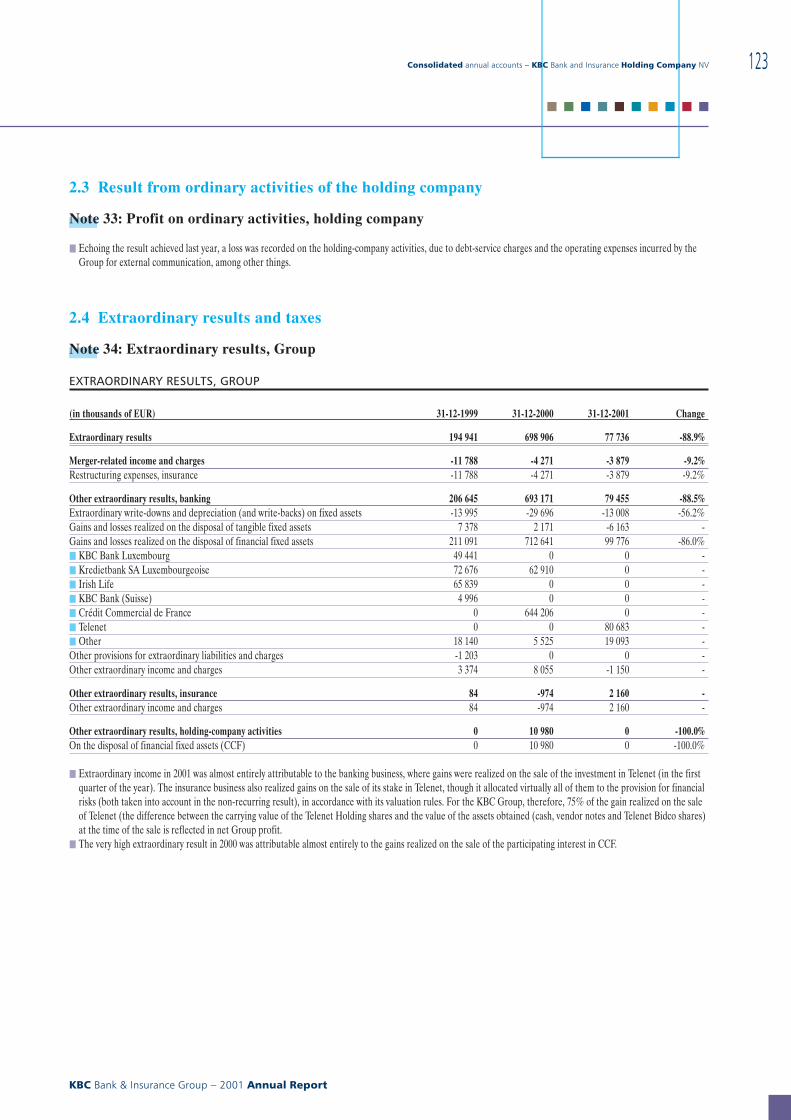
2.3 Result from ordinary activities of the holding company
Note 33: Profit on ordinary activities, holding company
j Echoing the result achieved last year, a loss was recorded on the holding-company activities, due to debt-service charges and the operating expenses incurred by theGroup for external communication, among other things.
2.4 Extraordinary results and taxes
Note 34: Extraordinary results, Group
EXTRAORDINARY RESULTS, GROUP
(in thousands of EUR) 31-12-1999 31-12-2000 31-12-2001 Change
Extraordinary results 194 941 698 906 77 736 -88.9%
Merger-related income and charges -11 788 -4 271 -3 879 -9.2%Restructuring expenses, insurance -11 788 -4 271 -3 879 -9.2%
Other extraordinary results, banking 206 645 693 171 79 455 -88.5%Extraordinary write-downs and depreciation (and write-backs) on fixed assets -13 995 -29 696 -13 008 -56.2%Gains and losses realized on the disposal of tangible fixed assets 7 378 2 171 -6 163 -Gains and losses realized on the disposal of financial fixed assets 211 091 712 641 99 776 -86.0%j KBC Bank Luxembourg 49 441 0 0 -j Kredietbank SA Luxembourgeoise 72 676 62 910 0 -j Irish Life 65 839 0 0 -j KBC Bank (Suisse) 4 996 0 0 -j Crédit Commercial de France 0 644 206 0 -j Telenet 0 0 80 683 -j Other 18 140 5 525 19 093 -Other provisions for extraordinary liabilities and charges -1 203 0 0 -Other extraordinary income and charges 3 374 8 055 -1 150 -
Other extraordinary results, insurance 84 -974 2 160 -Other extraordinary income and charges 84 -974 2 160 -
Other extraordinary results, holding-company activities 0 10 980 0 -100.0%On the disposal of financial fixed assets (CCF) 0 10 980 0 -100.0%
j Extraordinary income in 2001 was almost entirely attributable to the banking business, where gains were realized on the sale of the investment in Telenet (in the firstquarter of the year). The insurance business also realized gains on the sale of its stake in Telenet, though it allocated virtually all of them to the provision for financialrisks (both taken into account in the non-recurring result), in accordance with its valuation rules. For the KBC Group, therefore, 75% of the gain realized on the saleof Telenet (the difference between the carrying value of the Telenet Holding shares and the value of the assets obtained (cash, vendor notes and Telenet Bidco shares)at the time of the sale is reflected in net Group profit.
j The very high extraordinary result in 2000 was attributable almost entirely to the gains realized on the sale of the participating interest in CCF.
Consolidated annual accounts − KBC Bank and Insurance Holding Company NV
KBC Bank & Insurance Group − 2001 Annual Report
123
■ ■ ■ ■ ■ ■ ■ ■ ■ ■
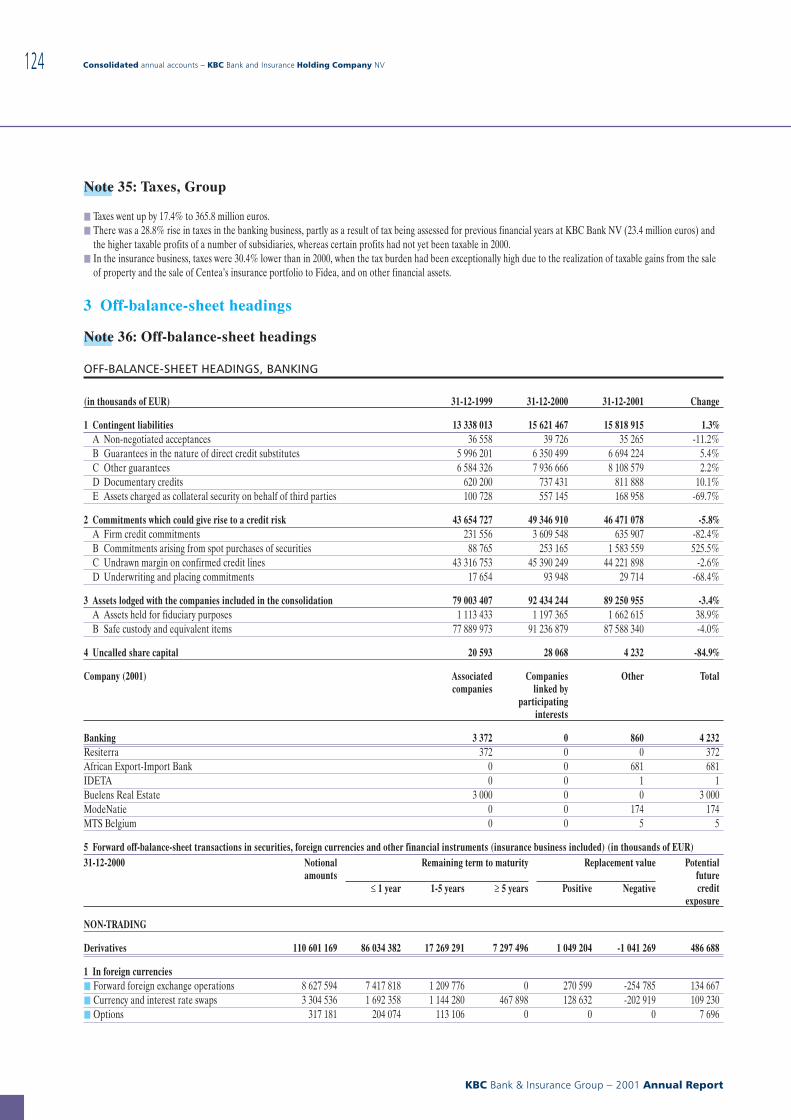
Note 35: Taxes, Group
j Taxes went up by 17.4% to 365.8 million euros.j There was a 28.8% rise in taxes in the banking business, partly as a result of tax being assessed for previous financial years at KBC Bank NV (23.4 million euros) and
the higher taxable profits of a number of subsidiaries, whereas certain profits had not yet been taxable in 2000.j In the insurance business, taxes were 30.4% lower than in 2000, when the tax burden had been exceptionally high due to the realization of taxable gains from the sale
of property and the sale of Centea’s insurance portfolio to Fidea, and on other financial assets.
3 Off-balance-sheet headings
Note 36: Off-balance-sheet headings
OFF-BALANCE-SHEET HEADINGS, BANKING
(in thousands of EUR) 31-12-1999 31-12-2000 31-12-2001 Change
1 Contingent liabilities 13 338 013 15 621 467 15 818 915 1.3%A Non-negotiated acceptances 36 558 39 726 35 265 -11.2%B Guarantees in the nature of direct credit substitutes 5 996 201 6 350 499 6 694 224 5.4%C Other guarantees 6 584 326 7 936 666 8 108 579 2.2%D Documentary credits 620 200 737 431 811 888 10.1%E Assets charged as collateral security on behalf of third parties 100 728 557 145 168 958 -69.7%
2 Commitments which could give rise to a credit risk 43 654 727 49 346 910 46 471 078 -5.8%A Firm credit commitments 231 556 3 609 548 635 907 -82.4%B Commitments arising from spot purchases of securities 88 765 253 165 1 583 559 525.5%C Undrawn margin on confirmed credit lines 43 316 753 45 390 249 44 221 898 -2.6%D Underwriting and placing commitments 17 654 93 948 29 714 -68.4%
3 Assets lodged with the companies included in the consolidation 79 003 407 92 434 244 89 250 955 -3.4%A Assets held for fiduciary purposes 1 113 433 1 197 365 1 662 615 38.9%B Safe custody and equivalent items 77 889 973 91 236 879 87 588 340 -4.0%
4 Uncalled share capital 20 593 28 068 4 232 -84.9%
Company (2001) Associatedcompanies
Companieslinked by
participatinginterests
Other Total
Banking 3 372 0 860 4 232Resiterra 372 0 0 372African Export-Import Bank 0 0 681 681IDETA 0 0 1 1Buelens Real Estate 3 000 0 0 3 000ModeNatie 0 0 174 174MTS Belgium 0 0 5 5
5 Forward off-balance-sheet transactions in securities, foreign currencies and other financial instruments (insurance business included) (in thousands of EUR)31-12-2000 Notional
amountsRemaining term to maturity Replacement value Potential
futurecredit
exposure≤ 1 year 1-5 years ≥ 5 years Positive Negative
NON-TRADING
Derivatives 110 601 169 86 034 382 17 269 291 7 297 496 1 049 204 -1 041 269 486 688
1 In foreign currenciesj Forward foreign exchange operations 8 627 594 7 417 818 1 209 776 0 270 599 -254 785 134 667j Currency and interest rate swaps 3 304 536 1 692 358 1 144 280 467 898 128 632 -202 919 109 230j Options 317 181 204 074 113 106 0 0 0 7 696
Consolidated annual accounts − KBC Bank and Insurance Holding Company NV
KBC Bank & Insurance Group − 2001 Annual Report
124
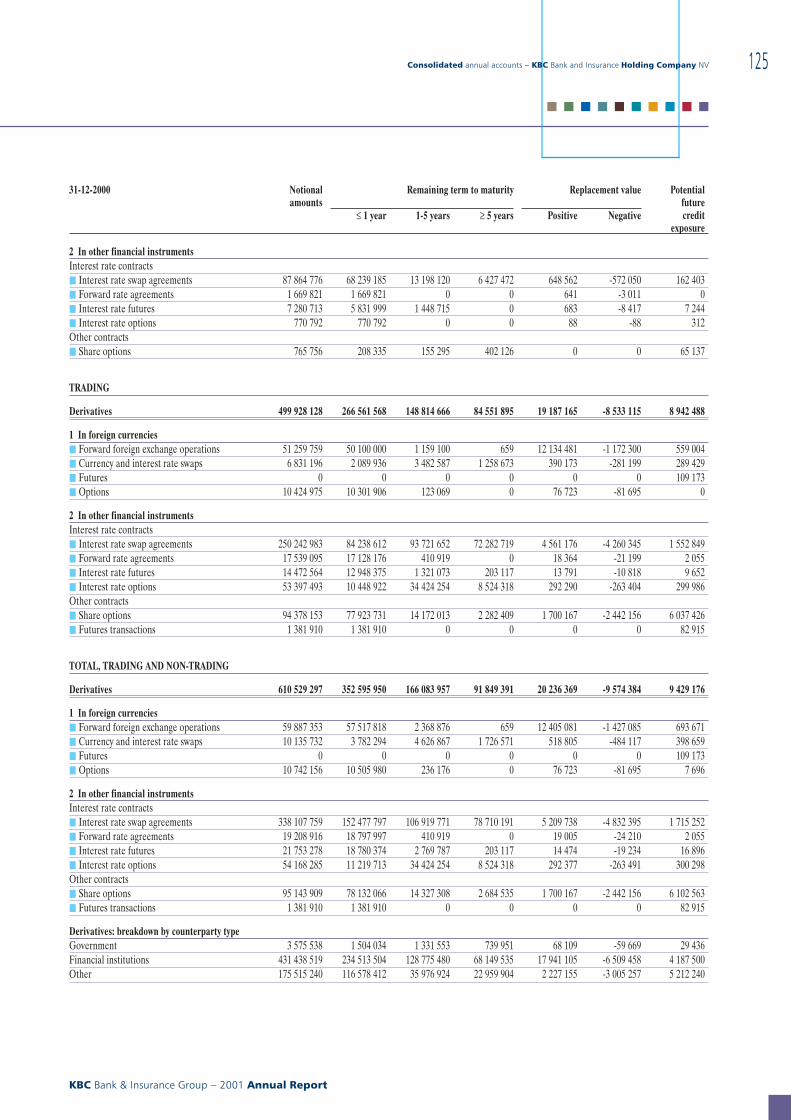
31-12-2000 Notionalamounts
Remaining term to maturity Replacement value Potentialfuturecredit
exposure≤ 1 year 1-5 years ≥ 5 years Positive Negative
2 In other financial instrumentsInterest rate contractsj Interest rate swap agreements 87 864 776 68 239 185 13 198 120 6 427 472 648 562 -572 050 162 403j Forward rate agreements 1 669 821 1 669 821 0 0 641 -3 011 0j Interest rate futures 7 280 713 5 831 999 1 448 715 0 683 -8 417 7 244j Interest rate options 770 792 770 792 0 0 88 -88 312Other contractsj Share options 765 756 208 335 155 295 402 126 0 0 65 137
TRADING
Derivatives 499 928 128 266 561 568 148 814 666 84 551 895 19 187 165 -8 533 115 8 942 488
1 In foreign currenciesj Forward foreign exchange operations 51 259 759 50 100 000 1 159 100 659 12 134 481 -1 172 300 559 004j Currency and interest rate swaps 6 831 196 2 089 936 3 482 587 1 258 673 390 173 -281 199 289 429j Futures 0 0 0 0 0 0 109 173j Options 10 424 975 10 301 906 123 069 0 76 723 -81 695 0
2 In other financial instrumentsInterest rate contractsj Interest rate swap agreements 250 242 983 84 238 612 93 721 652 72 282 719 4 561 176 -4 260 345 1 552 849j Forward rate agreements 17 539 095 17 128 176 410 919 0 18 364 -21 199 2 055j Interest rate futures 14 472 564 12 948 375 1 321 073 203 117 13 791 -10 818 9 652j Interest rate options 53 397 493 10 448 922 34 424 254 8 524 318 292 290 -263 404 299 986Other contractsj Share options 94 378 153 77 923 731 14 172 013 2 282 409 1 700 167 -2 442 156 6 037 426j Futures transactions 1 381 910 1 381 910 0 0 0 0 82 915
TOTAL, TRADING AND NON-TRADING
Derivatives 610 529 297 352 595 950 166 083 957 91 849 391 20 236 369 -9 574 384 9 429 176
1 In foreign currenciesj Forward foreign exchange operations 59 887 353 57 517 818 2 368 876 659 12 405 081 -1 427 085 693 671j Currency and interest rate swaps 10 135 732 3 782 294 4 626 867 1 726 571 518 805 -484 117 398 659j Futures 0 0 0 0 0 0 109 173j Options 10 742 156 10 505 980 236 176 0 76 723 -81 695 7 696
2 In other financial instrumentsInterest rate contractsj Interest rate swap agreements 338 107 759 152 477 797 106 919 771 78 710 191 5 209 738 -4 832 395 1 715 252j Forward rate agreements 19 208 916 18 797 997 410 919 0 19 005 -24 210 2 055j Interest rate futures 21 753 278 18 780 374 2 769 787 203 117 14 474 -19 234 16 896j Interest rate options 54 168 285 11 219 713 34 424 254 8 524 318 292 377 -263 491 300 298Other contractsj Share options 95 143 909 78 132 066 14 327 308 2 684 535 1 700 167 -2 442 156 6 102 563j Futures transactions 1 381 910 1 381 910 0 0 0 0 82 915
Derivatives: breakdown by counterparty typeGovernment 3 575 538 1 504 034 1 331 553 739 951 68 109 -59 669 29 436Financial institutions 431 438 519 234 513 504 128 775 480 68 149 535 17 941 105 -6 509 458 4 187 500Other 175 515 240 116 578 412 35 976 924 22 959 904 2 227 155 -3 005 257 5 212 240
Consolidated annual accounts − KBC Bank and Insurance Holding Company NV
KBC Bank & Insurance Group − 2001 Annual Report
125
■ ■ ■ ■ ■ ■ ■ ■ ■ ■
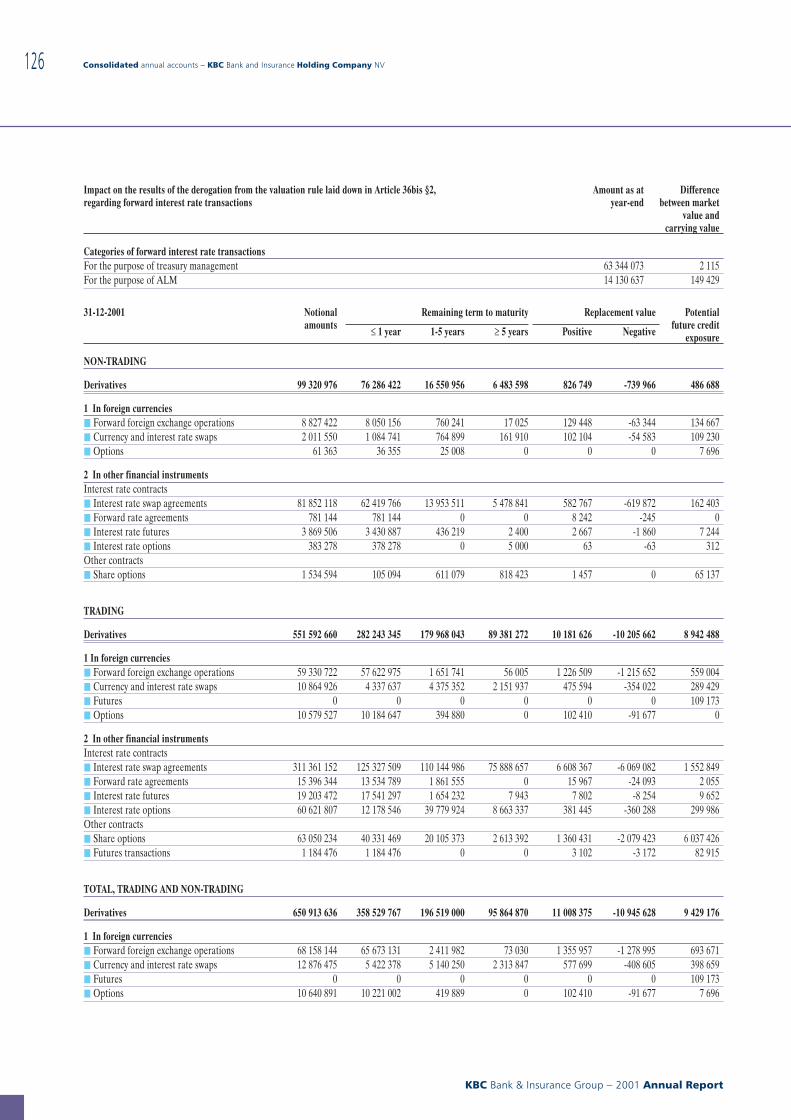
Impact on the results of the derogation from the valuation rule laid down in Article 36bis §2,regarding forward interest rate transactions
Amount as atyear-end
Differencebetween market
value andcarrying value
Categories of forward interest rate transactionsFor the purpose of treasury management 63 344 073 2 115For the purpose of ALM 14 130 637 149 429
31-12-2001 Notionalamounts
Remaining term to maturity Replacement value Potentialfuture credit
exposure≤ 1 year 1-5 years ≥ 5 years Positive Negative
NON-TRADING
Derivatives 99 320 976 76 286 422 16 550 956 6 483 598 826 749 -739 966 486 688
1 In foreign currenciesj Forward foreign exchange operations 8 827 422 8 050 156 760 241 17 025 129 448 -63 344 134 667j Currency and interest rate swaps 2 011 550 1 084 741 764 899 161 910 102 104 -54 583 109 230j Options 61 363 36 355 25 008 0 0 0 7 696
2 In other financial instrumentsInterest rate contractsj Interest rate swap agreements 81 852 118 62 419 766 13 953 511 5 478 841 582 767 -619 872 162 403j Forward rate agreements 781 144 781 144 0 0 8 242 -245 0j Interest rate futures 3 869 506 3 430 887 436 219 2 400 2 667 -1 860 7 244j Interest rate options 383 278 378 278 0 5 000 63 -63 312Other contractsj Share options 1 534 594 105 094 611 079 818 423 1 457 0 65 137
TRADING
Derivatives 551 592 660 282 243 345 179 968 043 89 381 272 10 181 626 -10 205 662 8 942 488
1 In foreign currenciesj Forward foreign exchange operations 59 330 722 57 622 975 1 651 741 56 005 1 226 509 -1 215 652 559 004j Currency and interest rate swaps 10 864 926 4 337 637 4 375 352 2 151 937 475 594 -354 022 289 429j Futures 0 0 0 0 0 0 109 173j Options 10 579 527 10 184 647 394 880 0 102 410 -91 677 0
2 In other financial instrumentsInterest rate contractsj Interest rate swap agreements 311 361 152 125 327 509 110 144 986 75 888 657 6 608 367 -6 069 082 1 552 849j Forward rate agreements 15 396 344 13 534 789 1 861 555 0 15 967 -24 093 2 055j Interest rate futures 19 203 472 17 541 297 1 654 232 7 943 7 802 -8 254 9 652j Interest rate options 60 621 807 12 178 546 39 779 924 8 663 337 381 445 -360 288 299 986Other contractsj Share options 63 050 234 40 331 469 20 105 373 2 613 392 1 360 431 -2 079 423 6 037 426j Futures transactions 1 184 476 1 184 476 0 0 3 102 -3 172 82 915
TOTAL, TRADING AND NON-TRADING
Derivatives 650 913 636 358 529 767 196 519 000 95 864 870 11 008 375 -10 945 628 9 429 176
1 In foreign currenciesj Forward foreign exchange operations 68 158 144 65 673 131 2 411 982 73 030 1 355 957 -1 278 995 693 671j Currency and interest rate swaps 12 876 475 5 422 378 5 140 250 2 313 847 577 699 -408 605 398 659j Futures 0 0 0 0 0 0 109 173j Options 10 640 891 10 221 002 419 889 0 102 410 -91 677 7 696
Consolidated annual accounts − KBC Bank and Insurance Holding Company NV
KBC Bank & Insurance Group − 2001 Annual Report
126
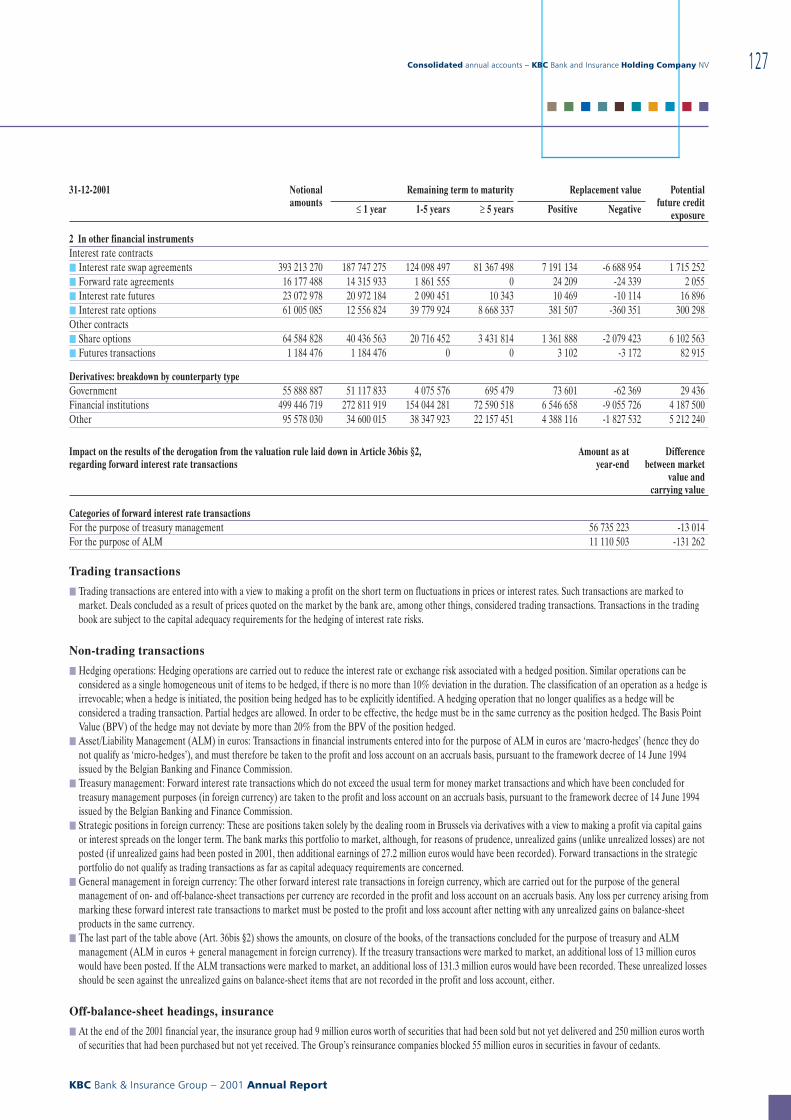
31-12-2001 Notionalamounts
Remaining term to maturity Replacement value Potentialfuture credit
exposure≤ 1 year 1-5 years ≥ 5 years Positive Negative
2 In other financial instrumentsInterest rate contractsj Interest rate swap agreements 393 213 270 187 747 275 124 098 497 81 367 498 7 191 134 -6 688 954 1 715 252j Forward rate agreements 16 177 488 14 315 933 1 861 555 0 24 209 -24 339 2 055j Interest rate futures 23 072 978 20 972 184 2 090 451 10 343 10 469 -10 114 16 896j Interest rate options 61 005 085 12 556 824 39 779 924 8 668 337 381 507 -360 351 300 298Other contractsj Share options 64 584 828 40 436 563 20 716 452 3 431 814 1 361 888 -2 079 423 6 102 563j Futures transactions 1 184 476 1 184 476 0 0 3 102 -3 172 82 915
Derivatives: breakdown by counterparty typeGovernment 55 888 887 51 117 833 4 075 576 695 479 73 601 -62 369 29 436Financial institutions 499 446 719 272 811 919 154 044 281 72 590 518 6 546 658 -9 055 726 4 187 500Other 95 578 030 34 600 015 38 347 923 22 157 451 4 388 116 -1 827 532 5 212 240
Impact on the results of the derogation from the valuation rule laid down in Article 36bis §2,regarding forward interest rate transactions
Amount as atyear-end
Differencebetween market
value andcarrying value
Categories of forward interest rate transactionsFor the purpose of treasury management 56 735 223 -13 014For the purpose of ALM 11 110 503 -131 262
Trading transactions
j Trading transactions are entered into with a view to making a profit on the short term on fluctuations in prices or interest rates. Such transactions are marked tomarket. Deals concluded as a result of prices quoted on the market by the bank are, among other things, considered trading transactions. Transactions in the tradingbook are subject to the capital adequacy requirements for the hedging of interest rate risks.
Non-trading transactions
j Hedging operations: Hedging operations are carried out to reduce the interest rate or exchange risk associated with a hedged position. Similar operations can beconsidered as a single homogeneous unit of items to be hedged, if there is no more than 10% deviation in the duration. The classification of an operation as a hedge isirrevocable; when a hedge is initiated, the position being hedged has to be explicitly identified. A hedging operation that no longer qualifies as a hedge will beconsidered a trading transaction. Partial hedges are allowed. In order to be effective, the hedge must be in the same currency as the position hedged. The Basis PointValue (BPV) of the hedge may not deviate by more than 20% from the BPV of the position hedged.
j Asset/Liability Management (ALM) in euros: Transactions in financial instruments entered into for the purpose of ALM in euros are ‘macro-hedges’ (hence they donot qualify as ‘micro-hedges’), and must therefore be taken to the profit and loss account on an accruals basis, pursuant to the framework decree of 14 June 1994issued by the Belgian Banking and Finance Commission.
j Treasury management: Forward interest rate transactions which do not exceed the usual term for money market transactions and which have been concluded fortreasury management purposes (in foreign currency) are taken to the profit and loss account on an accruals basis, pursuant to the framework decree of 14 June 1994issued by the Belgian Banking and Finance Commission.
j Strategic positions in foreign currency: These are positions taken solely by the dealing room in Brussels via derivatives with a view to making a profit via capital gainsor interest spreads on the longer term. The bank marks this portfolio to market, although, for reasons of prudence, unrealized gains (unlike unrealized losses) are notposted (if unrealized gains had been posted in 2001, then additional earnings of 27.2 million euros would have been recorded). Forward transactions in the strategicportfolio do not qualify as trading transactions as far as capital adequacy requirements are concerned.
j General management in foreign currency: The other forward interest rate transactions in foreign currency, which are carried out for the purpose of the generalmanagement of on- and off-balance-sheet transactions per currency are recorded in the profit and loss account on an accruals basis. Any loss per currency arising frommarking these forward interest rate transactions to market must be posted to the profit and loss account after netting with any unrealized gains on balance-sheetproducts in the same currency.
j The last part of the table above (Art. 36bis §2) shows the amounts, on closure of the books, of the transactions concluded for the purpose of treasury and ALMmanagement (ALM in euros + general management in foreign currency). If the treasury transactions were marked to market, an additional loss of 13 million euroswould have been posted. If the ALM transactions were marked to market, an additional loss of 131.3 million euros would have been recorded. These unrealized lossesshould be seen against the unrealized gains on balance-sheet items that are not recorded in the profit and loss account, either.
Off-balance-sheet headings, insurance
j At the end of the 2001 financial year, the insurance group had 9 million euros worth of securities that had been sold but not yet delivered and 250 million euros worthof securities that had been purchased but not yet received. The Group’s reinsurance companies blocked 55 million euros in securities in favour of cedants.
Consolidated annual accounts − KBC Bank and Insurance Holding Company NV
KBC Bank & Insurance Group − 2001 Annual Report
127
■ ■ ■ ■ ■ ■ ■ ■ ■ ■
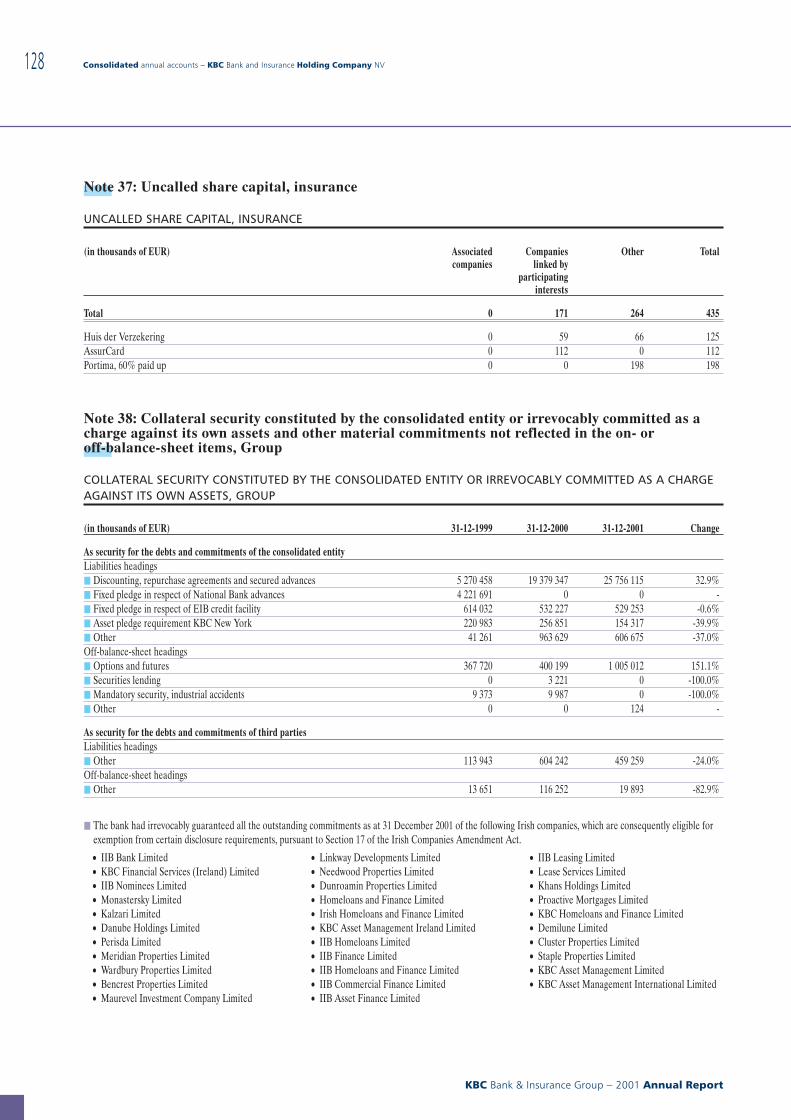
Note 37: Uncalled share capital, insurance
UNCALLED SHARE CAPITAL, INSURANCE
(in thousands of EUR) Associatedcompanies
Companieslinked by
participatinginterests
Other Total
Total 0 171 264 435
Huis der Verzekering 0 59 66 125AssurCard 0 112 0 112Portima, 60% paid up 0 0 198 198
Note 38: Collateral security constituted by the consolidated entity or irrevocably committed as acharge against its own assets and other material commitments not reflected in the on- oroff-balance-sheet items, Group
COLLATERAL SECURITY CONSTITUTED BY THE CONSOLIDATED ENTITY OR IRREVOCABLY COMMITTED AS A CHARGEAGAINST ITS OWN ASSETS, GROUP
(in thousands of EUR) 31-12-1999 31-12-2000 31-12-2001 Change
As security for the debts and commitments of the consolidated entityLiabilities headingsj Discounting, repurchase agreements and secured advances 5 270 458 19 379 347 25 756 115 32.9%j Fixed pledge in respect of National Bank advances 4 221 691 0 0 -j Fixed pledge in respect of EIB credit facility 614 032 532 227 529 253 -0.6%j Asset pledge requirement KBC New York 220 983 256 851 154 317 -39.9%j Other 41 261 963 629 606 675 -37.0%Off-balance-sheet headingsj Options and futures 367 720 400 199 1 005 012 151.1%j Securities lending 0 3 221 0 -100.0%j Mandatory security, industrial accidents 9 373 9 987 0 -100.0%j Other 0 0 124 -
As security for the debts and commitments of third partiesLiabilities headingsj Other 113 943 604 242 459 259 -24.0%Off-balance-sheet headingsj Other 13 651 116 252 19 893 -82.9%
j The bank had irrevocably guaranteed all the outstanding commitments as at 31 December 2001 of the following Irish companies, which are consequently eligible forexemption from certain disclosure requirements, pursuant to Section 17 of the Irish Companies Amendment Act.
• IIB Bank Limited• KBC Financial Services (Ireland) Limited• IIB Nominees Limited• Monastersky Limited• Kalzari Limited• Danube Holdings Limited• Perisda Limited• Meridian Properties Limited• Wardbury Properties Limited• Bencrest Properties Limited• Maurevel Investment Company Limited
• Linkway Developments Limited• Needwood Properties Limited• Dunroamin Properties Limited• Homeloans and Finance Limited• Irish Homeloans and Finance Limited• KBC Asset Management Ireland Limited• IIB Homeloans Limited• IIB Finance Limited• IIB Homeloans and Finance Limited• IIB Commercial Finance Limited• IIB Asset Finance Limited
• IIB Leasing Limited• Lease Services Limited• Khans Holdings Limited• Proactive Mortgages Limited• KBC Homeloans and Finance Limited• Demilune Limited• Cluster Properties Limited• Staple Properties Limited• KBC Asset Management Limited• KBC Asset Management International Limited
Consolidated annual accounts − KBC Bank and Insurance Holding Company NV
KBC Bank & Insurance Group − 2001 Annual Report
128
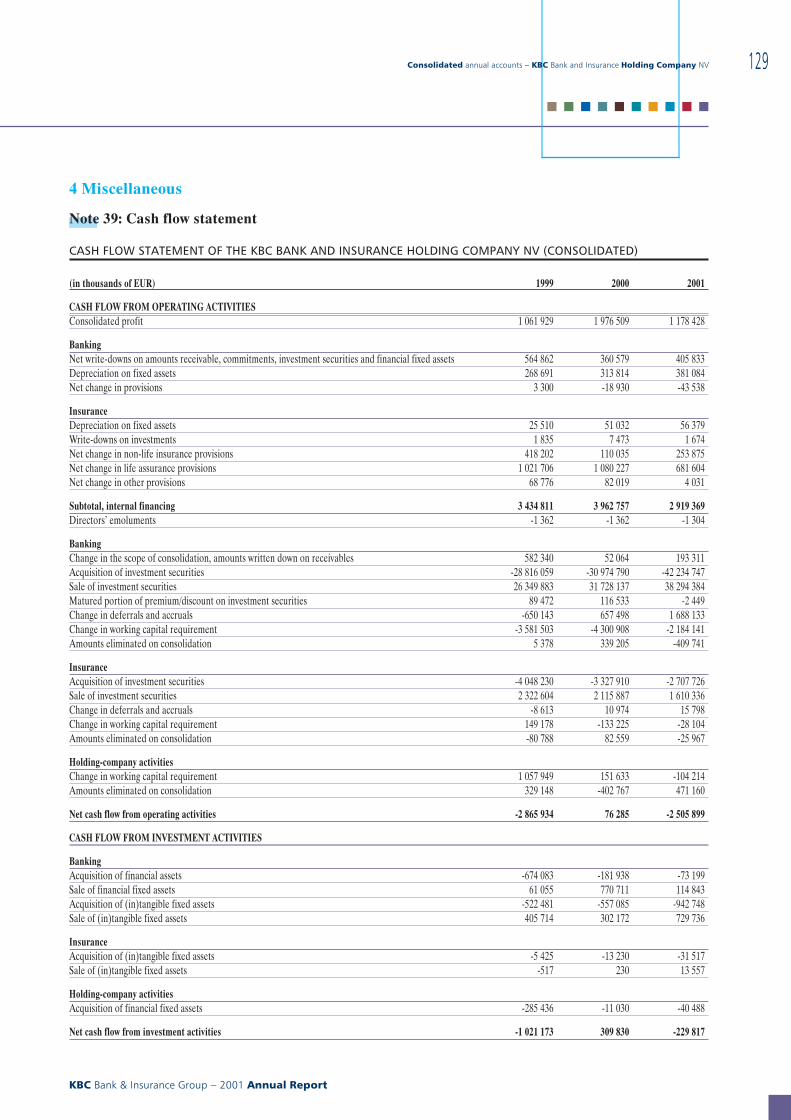
4 Miscellaneous
Note 39: Cash flow statement
CASH FLOW STATEMENT OF THE KBC BANK AND INSURANCE HOLDING COMPANY NV (CONSOLIDATED)
(in thousands of EUR) 1999 2000 2001
CASH FLOW FROM OPERATING ACTIVITIESConsolidated profit 1 061 929 1 976 509 1 178 428
BankingNet write-downs on amounts receivable, commitments, investment securities and financial fixed assets 564 862 360 579 405 833Depreciation on fixed assets 268 691 313 814 381 084Net change in provisions 3 300 -18 930 -43 538
InsuranceDepreciation on fixed assets 25 510 51 032 56 379Write-downs on investments 1 835 7 473 1 674Net change in non-life insurance provisions 418 202 110 035 253 875Net change in life assurance provisions 1 021 706 1 080 227 681 604Net change in other provisions 68 776 82 019 4 031
Subtotal, internal financing 3 434 811 3 962 757 2 919 369Directors’ emoluments -1 362 -1 362 -1 304
BankingChange in the scope of consolidation, amounts written down on receivables 582 340 52 064 193 311Acquisition of investment securities -28 816 059 -30 974 790 -42 234 747Sale of investment securities 26 349 883 31 728 137 38 294 384Matured portion of premium/discount on investment securities 89 472 116 533 -2 449Change in deferrals and accruals -650 143 657 498 1 688 133Change in working capital requirement -3 581 503 -4 300 908 -2 184 141Amounts eliminated on consolidation 5 378 339 205 -409 741
InsuranceAcquisition of investment securities -4 048 230 -3 327 910 -2 707 726Sale of investment securities 2 322 604 2 115 887 1 610 336Change in deferrals and accruals -8 613 10 974 15 798Change in working capital requirement 149 178 -133 225 -28 104Amounts eliminated on consolidation -80 788 82 559 -25 967
Holding-company activitiesChange in working capital requirement 1 057 949 151 633 -104 214Amounts eliminated on consolidation 329 148 -402 767 471 160
Net cash flow from operating activities -2 865 934 76 285 -2 505 899
CASH FLOW FROM INVESTMENT ACTIVITIES
BankingAcquisition of financial assets -674 083 -181 938 -73 199Sale of financial fixed assets 61 055 770 711 114 843Acquisition of (in)tangible fixed assets -522 481 -557 085 -942 748Sale of (in)tangible fixed assets 405 714 302 172 729 736
InsuranceAcquisition of (in)tangible fixed assets -5 425 -13 230 -31 517Sale of (in)tangible fixed assets -517 230 13 557
Holding-company activitiesAcquisition of financial fixed assets -285 436 -11 030 -40 488
Net cash flow from investment activities -1 021 173 309 830 -229 817
Consolidated annual accounts − KBC Bank and Insurance Holding Company NV
KBC Bank & Insurance Group − 2001 Annual Report
129
■ ■ ■ ■ ■ ■ ■ ■ ■ ■
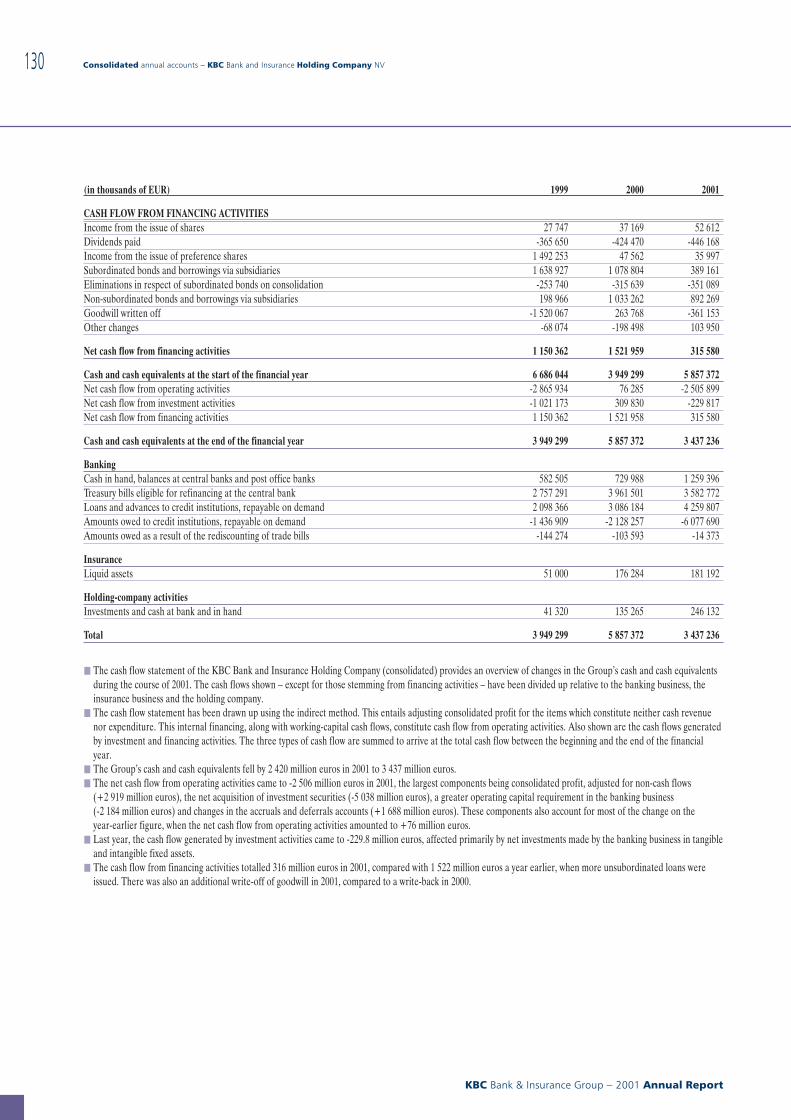
(in thousands of EUR) 1999 2000 2001
CASH FLOW FROM FINANCING ACTIVITIESIncome from the issue of shares 27 747 37 169 52 612Dividends paid -365 650 -424 470 -446 168Income from the issue of preference shares 1 492 253 47 562 35 997Subordinated bonds and borrowings via subsidiaries 1 638 927 1 078 804 389 161Eliminations in respect of subordinated bonds on consolidation -253 740 -315 639 -351 089Non-subordinated bonds and borrowings via subsidiaries 198 966 1 033 262 892 269Goodwill written off -1 520 067 263 768 -361 153Other changes -68 074 -198 498 103 950
Net cash flow from financing activities 1 150 362 1 521 959 315 580
Cash and cash equivalents at the start of the financial year 6 686 044 3 949 299 5 857 372Net cash flow from operating activities -2 865 934 76 285 -2 505 899Net cash flow from investment activities -1 021 173 309 830 -229 817Net cash flow from financing activities 1 150 362 1 521 958 315 580
Cash and cash equivalents at the end of the financial year 3 949 299 5 857 372 3 437 236
BankingCash in hand, balances at central banks and post office banks 582 505 729 988 1 259 396Treasury bills eligible for refinancing at the central bank 2 757 291 3 961 501 3 582 772Loans and advances to credit institutions, repayable on demand 2 098 366 3 086 184 4 259 807Amounts owed to credit institutions, repayable on demand -1 436 909 -2 128 257 -6 077 690Amounts owed as a result of the rediscounting of trade bills -144 274 -103 593 -14 373
InsuranceLiquid assets 51 000 176 284 181 192
Holding-company activitiesInvestments and cash at bank and in hand 41 320 135 265 246 132
Total 3 949 299 5 857 372 3 437 236
j The cash flow statement of the KBC Bank and Insurance Holding Company (consolidated) provides an overview of changes in the Group’s cash and cash equivalentsduring the course of 2001. The cash flows shown − except for those stemming from financing activities − have been divided up relative to the banking business, theinsurance business and the holding company.
j The cash flow statement has been drawn up using the indirect method. This entails adjusting consolidated profit for the items which constitute neither cash revenuenor expenditure. This internal financing, along with working-capital cash flows, constitute cash flow from operating activities. Also shown are the cash flows generatedby investment and financing activities. The three types of cash flow are summed to arrive at the total cash flow between the beginning and the end of the financialyear.
j The Group’s cash and cash equivalents fell by 2 420 million euros in 2001 to 3 437 million euros.j The net cash flow from operating activities came to -2 506 million euros in 2001, the largest components being consolidated profit, adjusted for non-cash flows
(+2 919 million euros), the net acquisition of investment securities (-5 038 million euros), a greater operating capital requirement in the banking business(-2 184 million euros) and changes in the accruals and deferrals accounts (+1 688 million euros). These components also account for most of the change on theyear-earlier figure, when the net cash flow from operating activities amounted to +76 million euros.
j Last year, the cash flow generated by investment activities came to -229.8 million euros, affected primarily by net investments made by the banking business in tangibleand intangible fixed assets.
j The cash flow from financing activities totalled 316 million euros in 2001, compared with 1 522 million euros a year earlier, when more unsubordinated loans wereissued. There was also an additional write-off of goodwill in 2001, compared to a write-back in 2000.
Consolidated annual accounts − KBC Bank and Insurance Holding Company NV
KBC Bank & Insurance Group − 2001 Annual Report
130
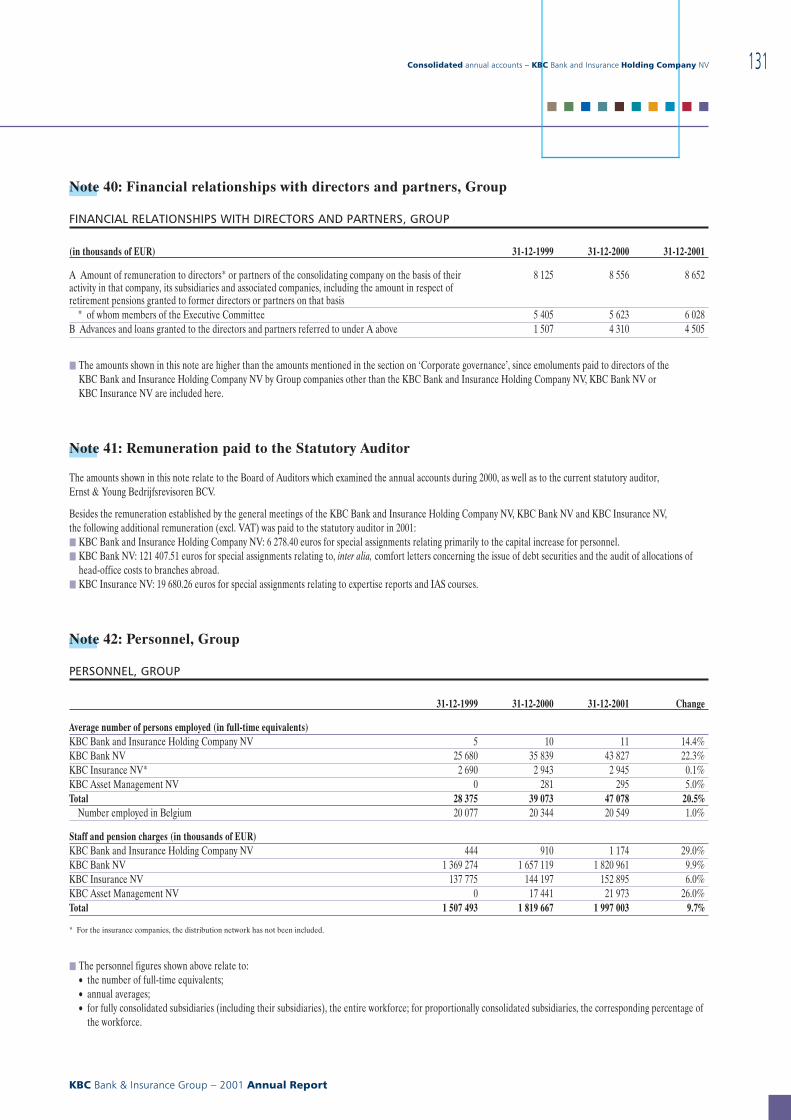
Note 40: Financial relationships with directors and partners, Group
FINANCIAL RELATIONSHIPS WITH DIRECTORS AND PARTNERS, GROUP
(in thousands of EUR) 31-12-1999 31-12-2000 31-12-2001
A Amount of remuneration to directors* or partners of the consolidating company on the basis of theiractivity in that company, its subsidiaries and associated companies, including the amount in respect ofretirement pensions granted to former directors or partners on that basis
8 125 8 556 8 652
* of whom members of the Executive Committee 5 405 5 623 6 028B Advances and loans granted to the directors and partners referred to under A above 1 507 4 310 4 505
j The amounts shown in this note are higher than the amounts mentioned in the section on ‘Corporate governance’, since emoluments paid to directors of theKBC Bank and Insurance Holding Company NV by Group companies other than the KBC Bank and Insurance Holding Company NV, KBC Bank NV orKBC Insurance NV are included here.
Note 41: Remuneration paid to the Statutory Auditor
The amounts shown in this note relate to the Board of Auditors which examined the annual accounts during 2000, as well as to the current statutory auditor,Ernst & Young Bedrijfsrevisoren BCV.
Besides the remuneration established by the general meetings of the KBC Bank and Insurance Holding Company NV, KBC Bank NV and KBC Insurance NV,the following additional remuneration (excl. VAT) was paid to the statutory auditor in 2001:j KBC Bank and Insurance Holding Company NV: 6 278.40 euros for special assignments relating primarily to the capital increase for personnel.j KBC Bank NV: 121 407.51 euros for special assignments relating to, inter alia, comfort letters concerning the issue of debt securities and the audit of allocations of
head-office costs to branches abroad.j KBC Insurance NV: 19 680.26 euros for special assignments relating to expertise reports and IAS courses.
Note 42: Personnel, Group
PERSONNEL, GROUP
31-12-1999 31-12-2000 31-12-2001 Change
Average number of persons employed (in full-time equivalents)KBC Bank and Insurance Holding Company NV 5 10 11 14.4%KBC Bank NV 25 680 35 839 43 827 22.3%KBC Insurance NV* 2 690 2 943 2 945 0.1%KBC Asset Management NV 0 281 295 5.0%Total 28 375 39 073 47 078 20.5%
Number employed in Belgium 20 077 20 344 20 549 1.0%
Staff and pension charges (in thousands of EUR)KBC Bank and Insurance Holding Company NV 444 910 1 174 29.0%KBC Bank NV 1 369 274 1 657 119 1 820 961 9.9%KBC Insurance NV 137 775 144 197 152 895 6.0%KBC Asset Management NV 0 17 441 21 973 26.0%Total 1 507 493 1 819 667 1 997 003 9.7%
* For the insurance companies, the distribution network has not been included.
j The personnel figures shown above relate to:• the number of full-time equivalents;• annual averages;• for fully consolidated subsidiaries (including their subsidiaries), the entire workforce; for proportionally consolidated subsidiaries, the corresponding percentage of
the workforce.
Consolidated annual accounts − KBC Bank and Insurance Holding Company NV
KBC Bank & Insurance Group − 2001 Annual Report
131
■ ■ ■ ■ ■ ■ ■ ■ ■ ■
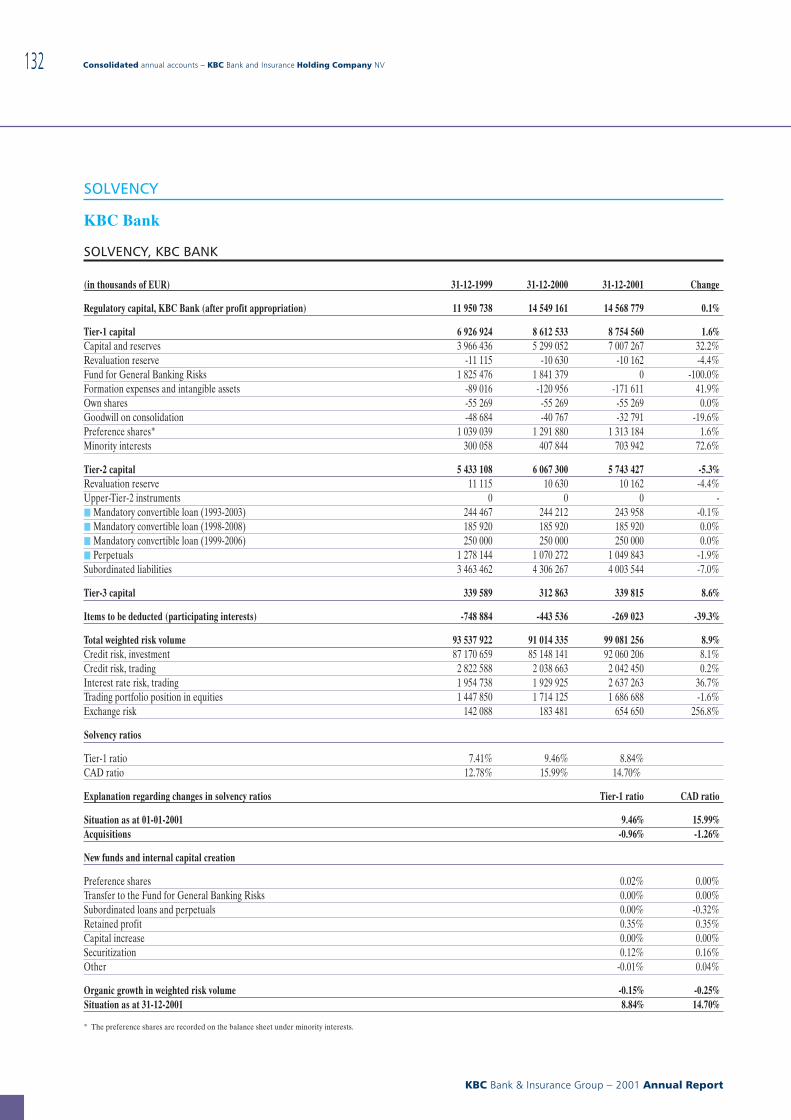
SOLVENCY
KBC Bank
SOLVENCY, KBC BANK
(in thousands of EUR) 31-12-1999 31-12-2000 31-12-2001 Change
Regulatory capital, KBC Bank (after profit appropriation) 11 950 738 14 549 161 14 568 779 0.1%
Tier-1 capital 6 926 924 8 612 533 8 754 560 1.6%Capital and reserves 3 966 436 5 299 052 7 007 267 32.2%Revaluation reserve -11 115 -10 630 -10 162 -4.4%Fund for General Banking Risks 1 825 476 1 841 379 0 -100.0%Formation expenses and intangible assets -89 016 -120 956 -171 611 41.9%Own shares -55 269 -55 269 -55 269 0.0%Goodwill on consolidation -48 684 -40 767 -32 791 -19.6%Preference shares* 1 039 039 1 291 880 1 313 184 1.6%Minority interests 300 058 407 844 703 942 72.6%
Tier-2 capital 5 433 108 6 067 300 5 743 427 -5.3%Revaluation reserve 11 115 10 630 10 162 -4.4%Upper-Tier-2 instruments 0 0 0 -j Mandatory convertible loan (1993-2003) 244 467 244 212 243 958 -0.1%j Mandatory convertible loan (1998-2008) 185 920 185 920 185 920 0.0%j Mandatory convertible loan (1999-2006) 250 000 250 000 250 000 0.0%j Perpetuals 1 278 144 1 070 272 1 049 843 -1.9%Subordinated liabilities 3 463 462 4 306 267 4 003 544 -7.0%
Tier-3 capital 339 589 312 863 339 815 8.6%
Items to be deducted (participating interests) -748 884 -443 536 -269 023 -39.3%
Total weighted risk volume 93 537 922 91 014 335 99 081 256 8.9%Credit risk, investment 87 170 659 85 148 141 92 060 206 8.1%Credit risk, trading 2 822 588 2 038 663 2 042 450 0.2%Interest rate risk, trading 1 954 738 1 929 925 2 637 263 36.7%Trading portfolio position in equities 1 447 850 1 714 125 1 686 688 -1.6%Exchange risk 142 088 183 481 654 650 256.8%
Solvency ratios
Tier-1 ratio 7.41% 9.46% 8.84%CAD ratio 12.78% 15.99% 14.70%
Explanation regarding changes in solvency ratios Tier-1 ratio CAD ratio
Situation as at 01-01-2001 9.46% 15.99%Acquisitions -0.96% -1.26%
New funds and internal capital creation
Preference shares 0.02% 0.00%Transfer to the Fund for General Banking Risks 0.00% 0.00%Subordinated loans and perpetuals 0.00% -0.32%Retained profit 0.35% 0.35%Capital increase 0.00% 0.00%Securitization 0.12% 0.16%Other -0.01% 0.04%
Organic growth in weighted risk volume -0.15% -0.25%Situation as at 31-12-2001 8.84% 14.70%
* The preference shares are recorded on the balance sheet under minority interests.
Consolidated annual accounts − KBC Bank and Insurance Holding Company NV
KBC Bank & Insurance Group − 2001 Annual Report
132
j KBC Bank’s consolidated own funds went up by 1 708 million euros to 7 007 million euros in 2001, mainly because of:• the retention of profit (318.8 million euros);• the transfer of the Fund for General Banking Risks to the reserves (1 838.6 million euros), though this does not have an impact on tier-1 capital;• the change in imputed goodwill on consolidation (-427.2 million euros), chiefly because of new acquisitions.
j Besides being affected by accounting equity, tier-1 capital was influenced primarily by the increase in minority interests (+296.1 million euros, due in part to the fullconsolidation of Kredyt Bank and the inclusion of the merged K&H Bank) and the bigger deduction for intangible fixed assets (-50.7 million euros, mainly accountedfor by Kredyt Bank, as well).
j Given the growth in accounting equity, preference shares included in tier-1 capital also increased by 21.3 million euros. Only 15% of tier-1 capital can be made up ofpreference shares, so the remainder of the preference shares have been included in tier-2 capital under perpetuals.
j The decline in subordinated liabilities is accounted for by the decline in the average remaining term to maturity used to calculate tier-2 capital.j Fewer items were deducted due principally to the full consolidation of Kredyt Bank and KBC Peel Hunt (equity method in 2000). On the other hand,
the securitization operations resulted in an additional deduction of 41.1 million euros.j Weighted risk volume rose by 8.9% to 99 081 million euros, owing to:
• the increase in weighted risks consequent on acquisitions (+7 785 million euros), especially Kredyt Bank;• the organic growth of weighted risks (+1 484 million euros);• a securitization-related decline of 1 202 million euros.
j The acquisitions made in 2001 had a bigger impact on the CAD ratio than on the tier-1 ratio, because the items to be deducted in 2001 − following the fullconsolidation of KBC Peel Hunt and Kredyt Bank − were smaller. These items are not taken into account in the tier-1 ratio.
j KBC Bank’s solvency ratios are well above the in-house targets of 7% and 11%, respectively, for the tier-1 ratio and the CAD ratio. Consequently, the excess isavailable to achieve further organic and external growth. By stringently curtailing organic growth in risk-weighted assets, by internal capital growth and by a betterspread of the capital employed across the various activities based on their risk/return ratio, KBC Bank aims to keep its solvency ratios above the in-house targets.
Consolidated annual accounts − KBC Bank and Insurance Holding Company NV
KBC Bank & Insurance Group − 2001 Annual Report
133
■ ■ ■ ■ ■ ■ ■ ■ ■ ■
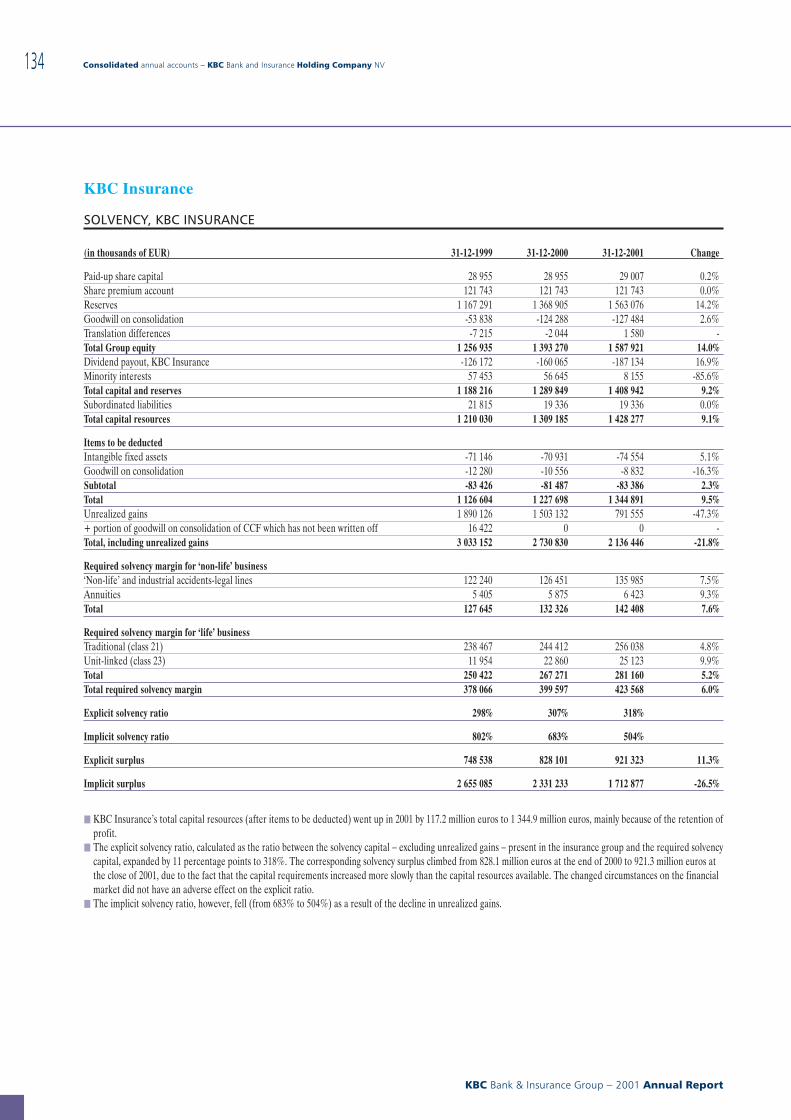
KBC Insurance
SOLVENCY, KBC INSURANCE
(in thousands of EUR) 31-12-1999 31-12-2000 31-12-2001 Change
Paid-up share capital 28 955 28 955 29 007 0.2%Share premium account 121 743 121 743 121 743 0.0%Reserves 1 167 291 1 368 905 1 563 076 14.2%Goodwill on consolidation -53 838 -124 288 -127 484 2.6%Translation differences -7 215 -2 044 1 580 -Total Group equity 1 256 935 1 393 270 1 587 921 14.0%Dividend payout, KBC Insurance -126 172 -160 065 -187 134 16.9%Minority interests 57 453 56 645 8 155 -85.6%Total capital and reserves 1 188 216 1 289 849 1 408 942 9.2%Subordinated liabilities 21 815 19 336 19 336 0.0%Total capital resources 1 210 030 1 309 185 1 428 277 9.1%
Items to be deductedIntangible fixed assets -71 146 -70 931 -74 554 5.1%Goodwill on consolidation -12 280 -10 556 -8 832 -16.3%Subtotal -83 426 -81 487 -83 386 2.3%Total 1 126 604 1 227 698 1 344 891 9.5%Unrealized gains 1 890 126 1 503 132 791 555 -47.3%+ portion of goodwill on consolidation of CCF which has not been written off 16 422 0 0 -Total, including unrealized gains 3 033 152 2 730 830 2 136 446 -21.8%
Required solvency margin for ‘non-life’ business‘Non-life’ and industrial accidents-legal lines 122 240 126 451 135 985 7.5%Annuities 5 405 5 875 6 423 9.3%Total 127 645 132 326 142 408 7.6%
Required solvency margin for ‘life’ businessTraditional (class 21) 238 467 244 412 256 038 4.8%Unit-linked (class 23) 11 954 22 860 25 123 9.9%Total 250 422 267 271 281 160 5.2%Total required solvency margin 378 066 399 597 423 568 6.0%
Explicit solvency ratio 298% 307% 318%
Implicit solvency ratio 802% 683% 504%
Explicit surplus 748 538 828 101 921 323 11.3%
Implicit surplus 2 655 085 2 331 233 1 712 877 -26.5%
j KBC Insurance’s total capital resources (after items to be deducted) went up in 2001 by 117.2 million euros to 1 344.9 million euros, mainly because of the retention ofprofit.
j The explicit solvency ratio, calculated as the ratio between the solvency capital − excluding unrealized gains − present in the insurance group and the required solvencycapital, expanded by 11 percentage points to 318%. The corresponding solvency surplus climbed from 828.1 million euros at the end of 2000 to 921.3 million euros atthe close of 2001, due to the fact that the capital requirements increased more slowly than the capital resources available. The changed circumstances on the financialmarket did not have an adverse effect on the explicit ratio.
j The implicit solvency ratio, however, fell (from 683% to 504%) as a result of the decline in unrealized gains.
Consolidated annual accounts − KBC Bank and Insurance Holding Company NV
KBC Bank & Insurance Group − 2001 Annual Report
134
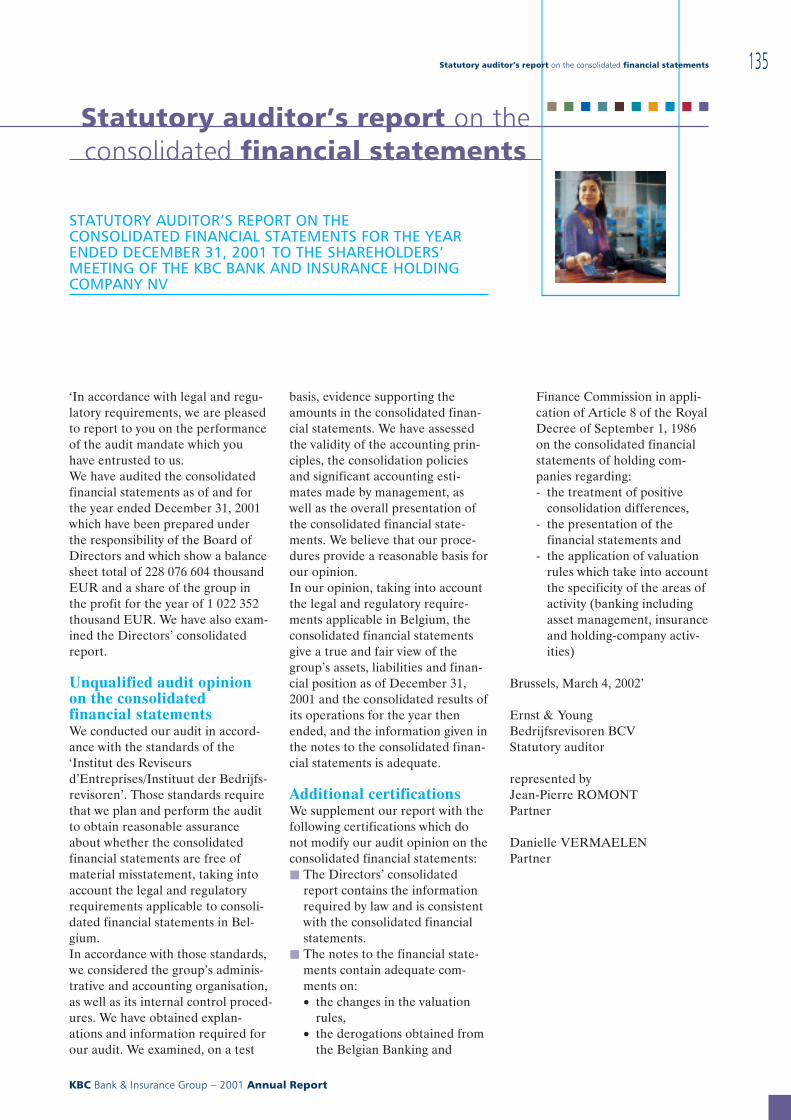
Statutory auditor’s report on theconsolidated financial statements
STATUTORY AUDITOR’S REPORT ON THECONSOLIDATED FINANCIAL STATEMENTS FOR THE YEARENDED DECEMBER 31, 2001 TO THE SHAREHOLDERS’MEETING OF THE KBC BANK AND INSURANCE HOLDINGCOMPANY NV
‘In accordance with legal and regu-latory requirements, we are pleasedto report to you on the performanceof the audit mandate which youhave entrusted to us.We have audited the consolidatedfinancial statements as of and forthe year ended December 31, 2001which have been prepared underthe responsibility of the Board ofDirectors and which show a balancesheet total of 228 076 604 thousandEUR and a share of the group inthe profit for the year of 1 022 352thousand EUR. We have also exam-ined the Directors’ consolidatedreport.
Unqualified audit opinionon the consolidatedfinancial statementsWe conducted our audit in accord-ance with the standards of the‘Institut des Reviseursd’Entreprises/Instituut der Bedrijfs-revisoren’. Those standards requirethat we plan and perform the auditto obtain reasonable assuranceabout whether the consolidatedfinancial statements are free ofmaterial misstatement, taking intoaccount the legal and regulatoryrequirements applicable to consoli-dated financial statements in Bel-gium.In accordance with those standards,we considered the group’s adminis-trative and accounting organisation,as well as its internal control proced-ures. We have obtained explan-ations and information required forour audit. We examined, on a test
basis, evidence supporting theamounts in the consolidated finan-cial statements. We have assessedthe validity of the accounting prin-ciples, the consolidation policiesand significant accounting esti-mates made by management, aswell as the overall presentation ofthe consolidated financial state-ments. We believe that our proce-dures provide a reasonable basis forour opinion.In our opinion, taking into accountthe legal and regulatory require-ments applicable in Belgium, theconsolidated financial statementsgive a true and fair view of thegroup’s assets, liabilities and finan-cial position as of December 31,2001 and the consolidated results ofits operations for the year thenended, and the information given inthe notes to the consolidated finan-cial statements is adequate.
Additional certificationsWe supplement our report with thefollowing certifications which donot modify our audit opinion on theconsolidated financial statements:j The Directors’ consolidated
report contains the informationrequired by law and is consistentwith the consolidated financialstatements.
j The notes to the financial state-ments contain adequate com-ments on:• the changes in the valuation
rules,• the derogations obtained from
the Belgian Banking and
Finance Commission in appli-cation of Article 8 of the RoyalDecree of September 1, 1986on the consolidated financialstatements of holding com-panies regarding:- the treatment of positive
consolidation differences,- the presentation of the
financial statements and- the application of valuation
rules which take into accountthe specificity of the areas ofactivity (banking includingasset management, insuranceand holding-company activ-ities)
Brussels, March 4, 2002’
Ernst & YoungBedrijfsrevisoren BCVStatutory auditor
represented byJean-Pierre ROMONTPartner
Danielle VERMAELENPartner
Statutory auditor’s report on the consolidated financial statements
KBC Bank & Insurance Group − 2001 Annual Report
135
■ ■ ■ ■ ■ ■ ■ ■ ■ ■
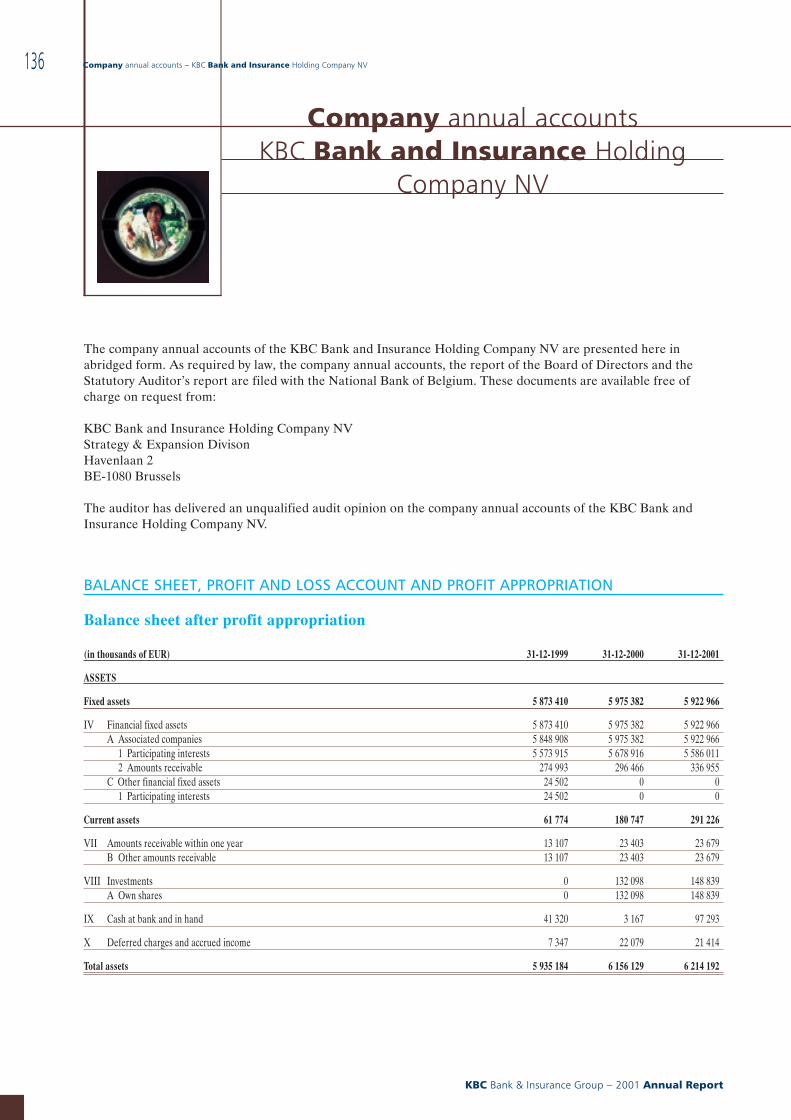
Company annual accountsKBC Bank and Insurance Holding
Company NV
The company annual accounts of the KBC Bank and Insurance Holding Company NV are presented here inabridged form. As required by law, the company annual accounts, the report of the Board of Directors and theStatutory Auditor’s report are filed with the National Bank of Belgium. These documents are available free ofcharge on request from:
KBC Bank and Insurance Holding Company NVStrategy & Expansion DivisonHavenlaan 2BE-1080 Brussels
The auditor has delivered an unqualified audit opinion on the company annual accounts of the KBC Bank andInsurance Holding Company NV.
BALANCE SHEET, PROFIT AND LOSS ACCOUNT AND PROFIT APPROPRIATION
Balance sheet after profit appropriation
(in thousands of EUR) 31-12-1999 31-12-2000 31-12-2001
ASSETS
Fixed assets 5 873 410 5 975 382 5 922 966
IV Financial fixed assets 5 873 410 5 975 382 5 922 966A Associated companies 5 848 908 5 975 382 5 922 966
1 Participating interests 5 573 915 5 678 916 5 586 0112 Amounts receivable 274 993 296 466 336 955
C Other financial fixed assets 24 502 0 01 Participating interests 24 502 0 0
Current assets 61 774 180 747 291 226
VII Amounts receivable within one year 13 107 23 403 23 679B Other amounts receivable 13 107 23 403 23 679
VIII Investments 0 132 098 148 839A Own shares 0 132 098 148 839
IX Cash at bank and in hand 41 320 3 167 97 293
X Deferred charges and accrued income 7 347 22 079 21 414
Total assets 5 935 184 6 156 129 6 214 192
Company annual accounts − KBC Bank and Insurance Holding Company NV
KBC Bank & Insurance Group − 2001 Annual Report
136
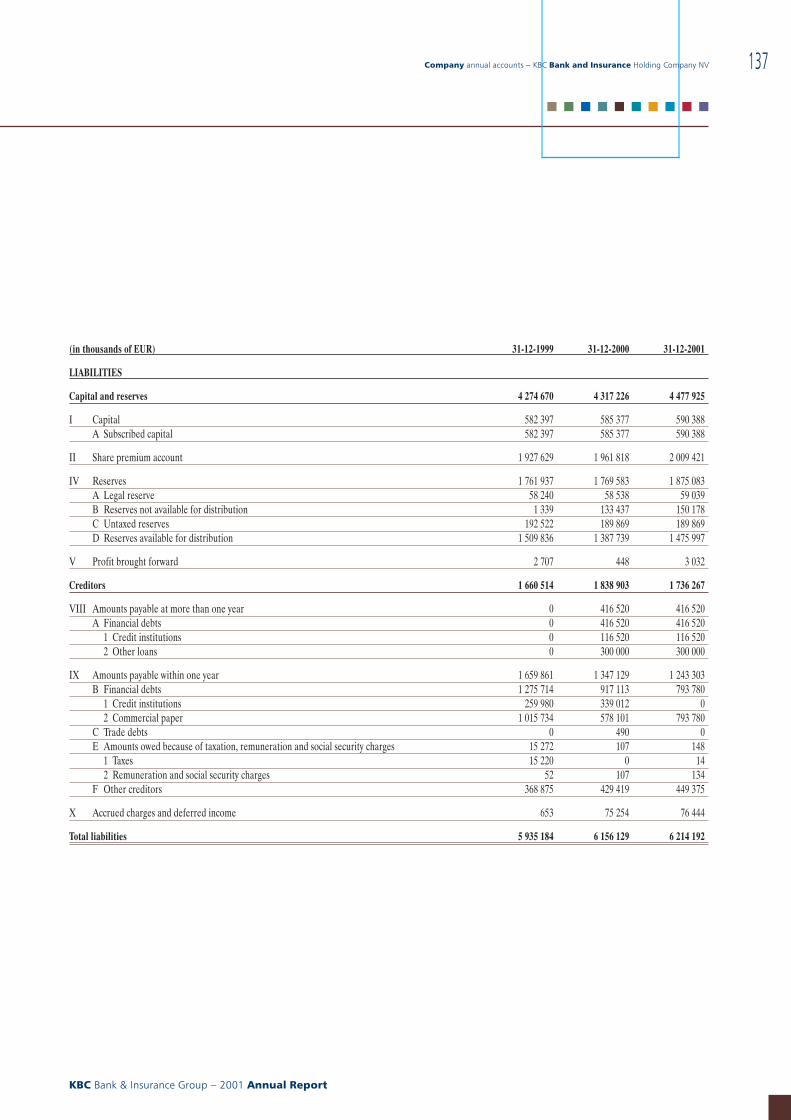
(in thousands of EUR) 31-12-1999 31-12-2000 31-12-2001
LIABILITIES
Capital and reserves 4 274 670 4 317 226 4 477 925
I Capital 582 397 585 377 590 388A Subscribed capital 582 397 585 377 590 388
II Share premium account 1 927 629 1 961 818 2 009 421
IV Reserves 1 761 937 1 769 583 1 875 083A Legal reserve 58 240 58 538 59 039B Reserves not available for distribution 1 339 133 437 150 178C Untaxed reserves 192 522 189 869 189 869D Reserves available for distribution 1 509 836 1 387 739 1 475 997
V Profit brought forward 2 707 448 3 032
Creditors 1 660 514 1 838 903 1 736 267
VIII Amounts payable at more than one year 0 416 520 416 520A Financial debts 0 416 520 416 520
1 Credit institutions 0 116 520 116 5202 Other loans 0 300 000 300 000
IX Amounts payable within one year 1 659 861 1 347 129 1 243 303B Financial debts 1 275 714 917 113 793 780
1 Credit institutions 259 980 339 012 02 Commercial paper 1 015 734 578 101 793 780
C Trade debts 0 490 0E Amounts owed because of taxation, remuneration and social security charges 15 272 107 148
1 Taxes 15 220 0 142 Remuneration and social security charges 52 107 134
F Other creditors 368 875 429 419 449 375
X Accrued charges and deferred income 653 75 254 76 444
Total liabilities 5 935 184 6 156 129 6 214 192
Company annual accounts − KBC Bank and Insurance Holding Company NV
KBC Bank & Insurance Group − 2001 Annual Report
137
■ ■ ■ ■ ■ ■ ■ ■ ■ ■
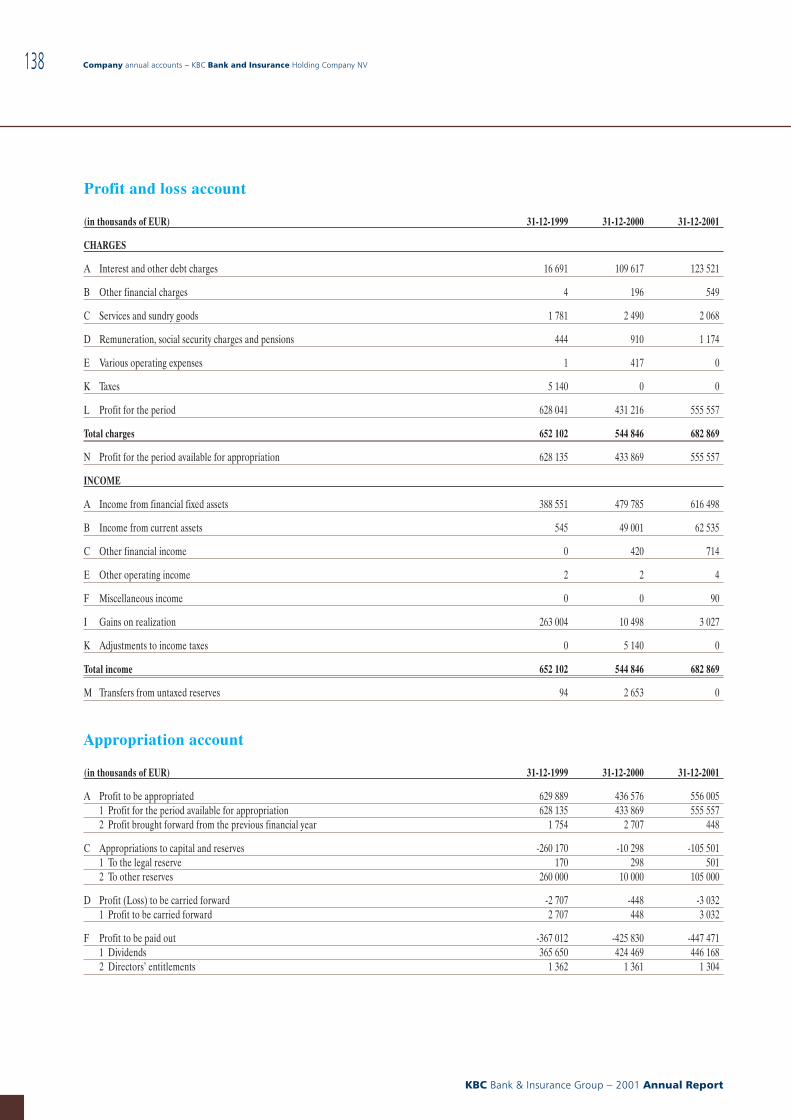
Profit and loss account
(in thousands of EUR) 31-12-1999 31-12-2000 31-12-2001
CHARGES
A Interest and other debt charges 16 691 109 617 123 521
B Other financial charges 4 196 549
C Services and sundry goods 1 781 2 490 2 068
D Remuneration, social security charges and pensions 444 910 1 174
E Various operating expenses 1 417 0
K Taxes 5 140 0 0
L Profit for the period 628 041 431 216 555 557
Total charges 652 102 544 846 682 869
N Profit for the period available for appropriation 628 135 433 869 555 557
INCOME
A Income from financial fixed assets 388 551 479 785 616 498
B Income from current assets 545 49 001 62 535
C Other financial income 0 420 714
E Other operating income 2 2 4
F Miscellaneous income 0 0 90
I Gains on realization 263 004 10 498 3 027
K Adjustments to income taxes 0 5 140 0
Total income 652 102 544 846 682 869
M Transfers from untaxed reserves 94 2 653 0
Appropriation account
(in thousands of EUR) 31-12-1999 31-12-2000 31-12-2001
A Profit to be appropriated 629 889 436 576 556 0051 Profit for the period available for appropriation 628 135 433 869 555 5572 Profit brought forward from the previous financial year 1 754 2 707 448
C Appropriations to capital and reserves -260 170 -10 298 -105 5011 To the legal reserve 170 298 5012 To other reserves 260 000 10 000 105 000
D Profit (Loss) to be carried forward -2 707 -448 -3 0321 Profit to be carried forward 2 707 448 3 032
F Profit to be paid out -367 012 -425 830 -447 4711 Dividends 365 650 424 469 446 1682 Directors’ entitlements 1 362 1 361 1 304
Company annual accounts − KBC Bank and Insurance Holding Company NV
KBC Bank & Insurance Group − 2001 Annual Report
138
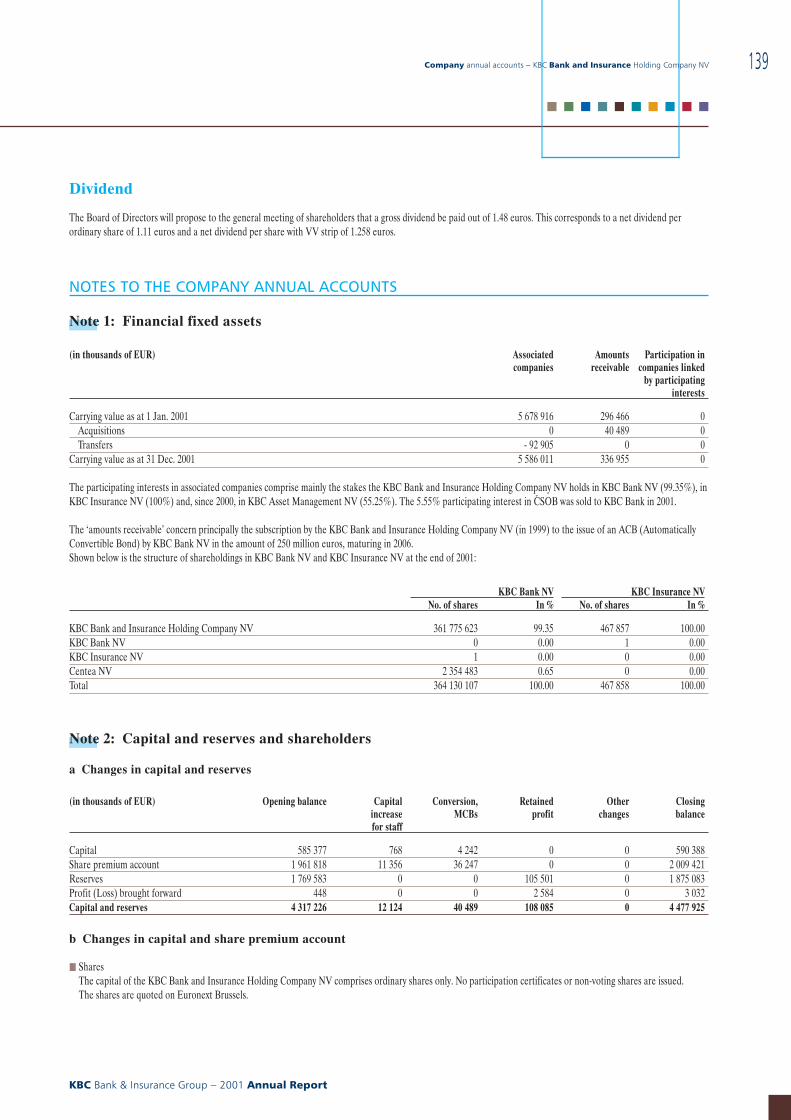
Dividend
The Board of Directors will propose to the general meeting of shareholders that a gross dividend be paid out of 1.48 euros. This corresponds to a net dividend perordinary share of 1.11 euros and a net dividend per share with VV strip of 1.258 euros.
NOTES TO THE COMPANY ANNUAL ACCOUNTS
Note 1: Financial fixed assets
(in thousands of EUR) Associatedcompanies
Amountsreceivable
Participation incompanies linked
by participatinginterests
Carrying value as at 1 Jan. 2001 5 678 916 296 466 0Acquisitions 0 40 489 0Transfers - 92 905 0 0
Carrying value as at 31 Dec. 2001 5 586 011 336 955 0
The participating interests in associated companies comprise mainly the stakes the KBC Bank and Insurance Holding Company NV holds in KBC Bank NV (99.35%), inKBC Insurance NV (100%) and, since 2000, in KBC Asset Management NV (55.25%). The 5.55% participating interest in C{SOB was sold to KBC Bank in 2001.
The ‘amounts receivable’ concern principally the subscription by the KBC Bank and Insurance Holding Company NV (in 1999) to the issue of an ACB (AutomaticallyConvertible Bond) by KBC Bank NV in the amount of 250 million euros, maturing in 2006.Shown below is the structure of shareholdings in KBC Bank NV and KBC Insurance NV at the end of 2001:
KBC Bank NV KBC Insurance NVNo. of shares In % No. of shares In %
KBC Bank and Insurance Holding Company NV 361 775 623 99.35 467 857 100.00KBC Bank NV 0 0.00 1 0.00KBC Insurance NV 1 0.00 0 0.00Centea NV 2 354 483 0.65 0 0.00Total 364 130 107 100.00 467 858 100.00
Note 2: Capital and reserves and shareholders
a Changes in capital and reserves
(in thousands of EUR) Opening balance Capitalincreasefor staff
Conversion,MCBs
Retainedprofit
Otherchanges
Closingbalance
Capital 585 377 768 4 242 0 0 590 388Share premium account 1 961 818 11 356 36 247 0 0 2 009 421Reserves 1 769 583 0 0 105 501 0 1 875 083Profit (Loss) brought forward 448 0 0 2 584 0 3 032Capital and reserves 4 317 226 12 124 40 489 108 085 0 4 477 925
b Changes in capital and share premium account
j SharesThe capital of the KBC Bank and Insurance Holding Company NV comprises ordinary shares only. No participation certificates or non-voting shares are issued.The shares are quoted on Euronext Brussels.
Company annual accounts − KBC Bank and Insurance Holding Company NV
KBC Bank & Insurance Group − 2001 Annual Report
139
■ ■ ■ ■ ■ ■ ■ ■ ■ ■
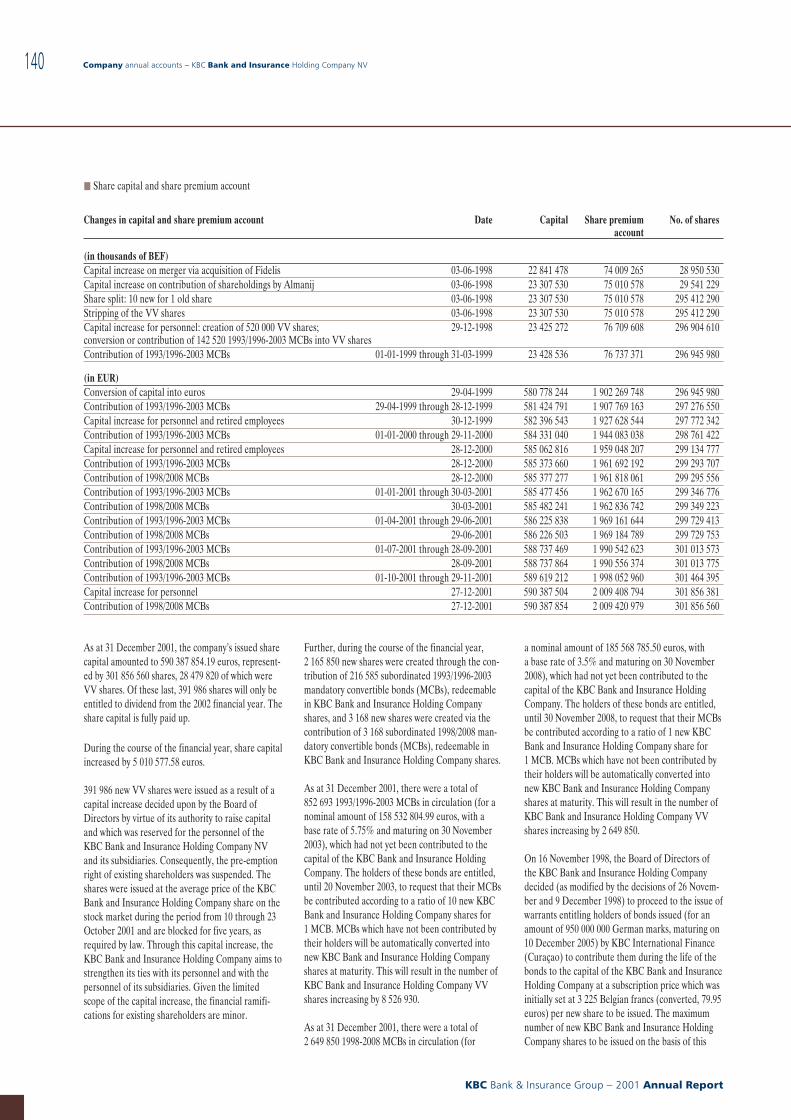
j Share capital and share premium account
Changes in capital and share premium account Date Capital Share premiumaccount
No. of shares
(in thousands of BEF)Capital increase on merger via acquisition of Fidelis 03-06-1998 22 841 478 74 009 265 28 950 530Capital increase on contribution of shareholdings by Almanij 03-06-1998 23 307 530 75 010 578 29 541 229Share split: 10 new for 1 old share 03-06-1998 23 307 530 75 010 578 295 412 290Stripping of the VV shares 03-06-1998 23 307 530 75 010 578 295 412 290Capital increase for personnel: creation of 520 000 VV shares;conversion or contribution of 142 520 1993/1996-2003 MCBs into VV shares
29-12-1998 23 425 272 76 709 608 296 904 610
Contribution of 1993/1996-2003 MCBs 01-01-1999 through 31-03-1999 23 428 536 76 737 371 296 945 980
(in EUR)Conversion of capital into euros 29-04-1999 580 778 244 1 902 269 748 296 945 980Contribution of 1993/1996-2003 MCBs 29-04-1999 through 28-12-1999 581 424 791 1 907 769 163 297 276 550Capital increase for personnel and retired employees 30-12-1999 582 396 543 1 927 628 544 297 772 342Contribution of 1993/1996-2003 MCBs 01-01-2000 through 29-11-2000 584 331 040 1 944 083 038 298 761 422Capital increase for personnel and retired employees 28-12-2000 585 062 816 1 959 048 207 299 134 777Contribution of 1993/1996-2003 MCBs 28-12-2000 585 373 660 1 961 692 192 299 293 707Contribution of 1998/2008 MCBs 28-12-2000 585 377 277 1 961 818 061 299 295 556Contribution of 1993/1996-2003 MCBs 01-01-2001 through 30-03-2001 585 477 456 1 962 670 165 299 346 776Contribution of 1998/2008 MCBs 30-03-2001 585 482 241 1 962 836 742 299 349 223Contribution of 1993/1996-2003 MCBs 01-04-2001 through 29-06-2001 586 225 838 1 969 161 644 299 729 413Contribution of 1998/2008 MCBs 29-06-2001 586 226 503 1 969 184 789 299 729 753Contribution of 1993/1996-2003 MCBs 01-07-2001 through 28-09-2001 588 737 469 1 990 542 623 301 013 573Contribution of 1998/2008 MCBs 28-09-2001 588 737 864 1 990 556 374 301 013 775Contribution of 1993/1996-2003 MCBs 01-10-2001 through 29-11-2001 589 619 212 1 998 052 960 301 464 395Capital increase for personnel 27-12-2001 590 387 504 2 009 408 794 301 856 381Contribution of 1998/2008 MCBs 27-12-2001 590 387 854 2 009 420 979 301 856 560
As at 31 December 2001, the company’s issued sharecapital amounted to 590 387 854.19 euros, represent-ed by 301 856 560 shares, 28 479 820 of which wereVV shares. Of these last, 391 986 shares will only beentitled to dividend from the 2002 financial year. Theshare capital is fully paid up.
During the course of the financial year, share capitalincreased by 5 010 577.58 euros.
391 986 new VV shares were issued as a result of acapital increase decided upon by the Board ofDirectors by virtue of its authority to raise capitaland which was reserved for the personnel of theKBC Bank and Insurance Holding Company NVand its subsidiaries. Consequently, the pre-emptionright of existing shareholders was suspended. Theshares were issued at the average price of the KBCBank and Insurance Holding Company share on thestock market during the period from 10 through 23October 2001 and are blocked for five years, asrequired by law. Through this capital increase, theKBC Bank and Insurance Holding Company aims tostrengthen its ties with its personnel and with thepersonnel of its subsidiaries. Given the limitedscope of the capital increase, the financial ramifi-cations for existing shareholders are minor.
Further, during the course of the financial year,2 165 850 new shares were created through the con-tribution of 216 585 subordinated 1993/1996-2003mandatory convertible bonds (MCBs), redeemablein KBC Bank and Insurance Holding Companyshares, and 3 168 new shares were created via thecontribution of 3 168 subordinated 1998/2008 man-datory convertible bonds (MCBs), redeemable inKBC Bank and Insurance Holding Company shares.
As at 31 December 2001, there were a total of852 693 1993/1996-2003 MCBs in circulation (for anominal amount of 158 532 804.99 euros, with abase rate of 5.75% and maturing on 30 November2003), which had not yet been contributed to thecapital of the KBC Bank and Insurance HoldingCompany. The holders of these bonds are entitled,until 20 November 2003, to request that their MCBsbe contributed according to a ratio of 10 new KBCBank and Insurance Holding Company shares for1 MCB. MCBs which have not been contributed bytheir holders will be automatically converted intonew KBC Bank and Insurance Holding Companyshares at maturity. This will result in the number ofKBC Bank and Insurance Holding Company VVshares increasing by 8 526 930.
As at 31 December 2001, there were a total of2 649 850 1998-2008 MCBs in circulation (for
a nominal amount of 185 568 785.50 euros, witha base rate of 3.5% and maturing on 30 November2008), which had not yet been contributed to thecapital of the KBC Bank and Insurance HoldingCompany. The holders of these bonds are entitled,until 30 November 2008, to request that their MCBsbe contributed according to a ratio of 1 new KBCBank and Insurance Holding Company share for1 MCB. MCBs which have not been contributed bytheir holders will be automatically converted intonew KBC Bank and Insurance Holding Companyshares at maturity. This will result in the number ofKBC Bank and Insurance Holding Company VVshares increasing by 2 649 850.
On 16 November 1998, the Board of Directors ofthe KBC Bank and Insurance Holding Companydecided (as modified by the decisions of 26 Novem-ber and 9 December 1998) to proceed to the issue ofwarrants entitling holders of bonds issued (for anamount of 950 000 000 German marks, maturing on10 December 2005) by KBC International Finance(Curaçao) to contribute them during the life of thebonds to the capital of the KBC Bank and InsuranceHolding Company at a subscription price which wasinitially set at 3 225 Belgian francs (converted, 79.95euros) per new share to be issued. The maximumnumber of new KBC Bank and Insurance HoldingCompany shares to be issued on the basis of this
Company annual accounts − KBC Bank and Insurance Holding Company NV
KBC Bank & Insurance Group − 2001 Annual Report
140
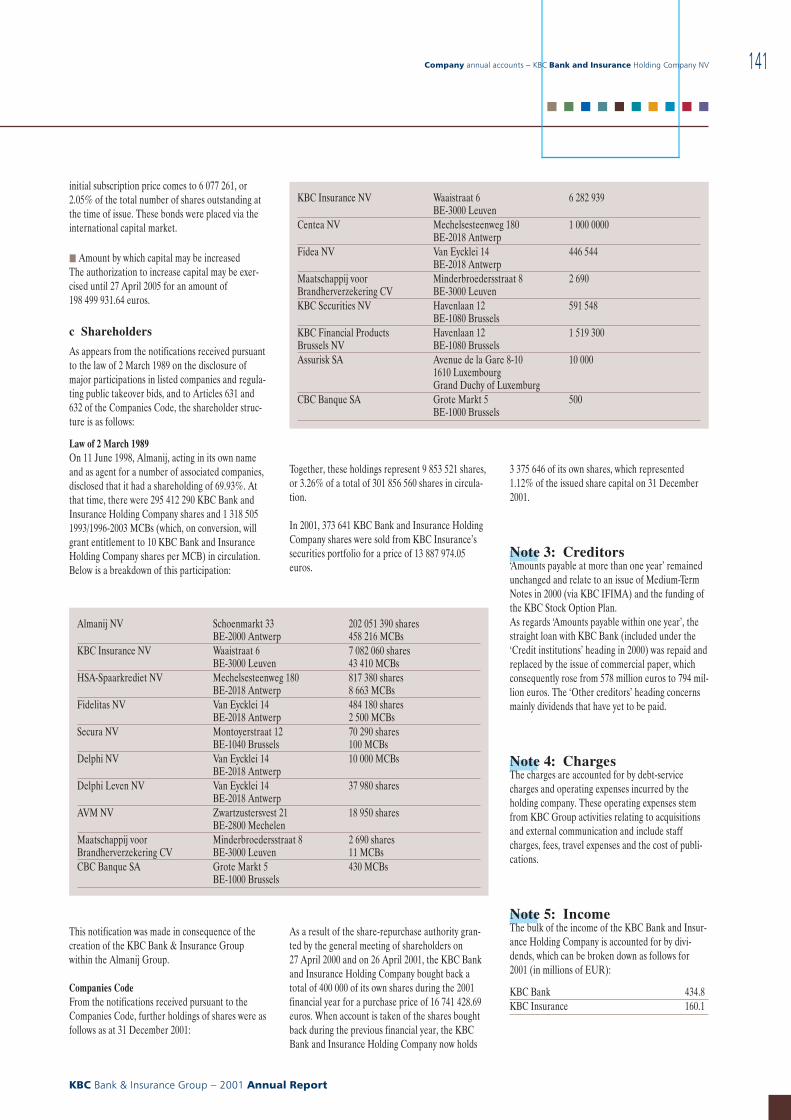
initial subscription price comes to 6 077 261, or2.05% of the total number of shares outstanding atthe time of issue. These bonds were placed via theinternational capital market.
j Amount by which capital may be increasedThe authorization to increase capital may be exer-cised until 27 April 2005 for an amount of198 499 931.64 euros.
c Shareholders
As appears from the notifications received pursuantto the law of 2 March 1989 on the disclosure ofmajor participations in listed companies and regula-ting public takeover bids, and to Articles 631 and632 of the Companies Code, the shareholder struc-ture is as follows:
Law of 2 March 1989On 11 June 1998, Almanij, acting in its own nameand as agent for a number of associated companies,disclosed that it had a shareholding of 69.93%. Atthat time, there were 295 412 290 KBC Bank andInsurance Holding Company shares and 1 318 5051993/1996-2003 MCBs (which, on conversion, willgrant entitlement to 10 KBC Bank and InsuranceHolding Company shares per MCB) in circulation.Below is a breakdown of this participation:
This notification was made in consequence of thecreation of the KBC Bank & Insurance Groupwithin the Almanij Group.
Companies CodeFrom the notifications received pursuant to theCompanies Code, further holdings of shares were asfollows as at 31 December 2001:
Together, these holdings represent 9 853 521 shares,or 3.26% of a total of 301 856 560 shares in circula-tion.
In 2001, 373 641 KBC Bank and Insurance HoldingCompany shares were sold from KBC Insurance’ssecurities portfolio for a price of 13 887 974.05euros.
As a result of the share-repurchase authority gran-ted by the general meeting of shareholders on27 April 2000 and on 26 April 2001, the KBC Bankand Insurance Holding Company bought back atotal of 400 000 of its own shares during the 2001financial year for a purchase price of 16 741 428.69euros. When account is taken of the shares boughtback during the previous financial year, the KBCBank and Insurance Holding Company now holds
3 375 646 of its own shares, which represented1.12% of the issued share capital on 31 December2001.
Note 3: Creditors‘Amounts payable at more than one year’ remainedunchanged and relate to an issue of Medium-TermNotes in 2000 (via KBC IFIMA) and the funding ofthe KBC Stock Option Plan.As regards ‘Amounts payable within one year’, thestraight loan with KBC Bank (included under the‘Credit institutions’ heading in 2000) was repaid andreplaced by the issue of commercial paper, whichconsequently rose from 578 million euros to 794 mil-lion euros. The ‘Other creditors’ heading concernsmainly dividends that have yet to be paid.
Note 4: ChargesThe charges are accounted for by debt-servicecharges and operating expenses incurred by theholding company. These operating expenses stemfrom KBC Group activities relating to acquisitionsand external communication and include staffcharges, fees, travel expenses and the cost of publi-cations.
Note 5: IncomeThe bulk of the income of the KBC Bank and Insur-ance Holding Company is accounted for by divi-dends, which can be broken down as follows for2001 (in millions of EUR):
KBC Bank 434.8KBC Insurance 160.1
Almanij NV Schoenmarkt 33BE-2000 Antwerp
202 051 390 shares458 216 MCBs
KBC Insurance NV Waaistraat 6BE-3000 Leuven
7 082 060 shares43 410 MCBs
HSA-Spaarkrediet NV Mechelsesteenweg 180BE-2018 Antwerp
817 380 shares8 663 MCBs
Fidelitas NV Van Eycklei 14BE-2018 Antwerp
484 180 shares2 500 MCBs
Secura NV Montoyerstraat 12BE-1040 Brussels
70 290 shares100 MCBs
Delphi NV Van Eycklei 14BE-2018 Antwerp
10 000 MCBs
Delphi Leven NV Van Eycklei 14BE-2018 Antwerp
37 980 shares
AVM NV Zwartzustersvest 21BE-2800 Mechelen
18 950 shares
Maatschappij voorBrandherverzekering CV
Minderbroedersstraat 8BE-3000 Leuven
2 690 shares11 MCBs
CBC Banque SA Grote Markt 5BE-1000 Brussels
430 MCBs
KBC Insurance NV Waaistraat 6BE-3000 Leuven
6 282 939
Centea NV Mechelsesteenweg 180BE-2018 Antwerp
1 000 0000
Fidea NV Van Eycklei 14BE-2018 Antwerp
446 544
Maatschappij voorBrandherverzekering CV
Minderbroedersstraat 8BE-3000 Leuven
2 690
KBC Securities NV Havenlaan 12BE-1080 Brussels
591 548
KBC Financial ProductsBrussels NV
Havenlaan 12BE-1080 Brussels
1 519 300
Assurisk SA Avenue de la Gare 8-101610 LuxembourgGrand Duchy of Luxemburg
10 000
CBC Banque SA Grote Markt 5BE-1000 Brussels
500
Company annual accounts − KBC Bank and Insurance Holding Company NV
KBC Bank & Insurance Group − 2001 Annual Report
141
■ ■ ■ ■ ■ ■ ■ ■ ■ ■
GENERAL INFORMATION
General information on theKBC Bank and InsuranceHolding Company NV
NameKBC Bank and InsuranceHolding Company NV
Established9 February 1935 asthe Kredietbank NV;the present name datesfrom 4 June 1998
Registered officeHavenlaan 2, BE-1080 Brussels
Brussels Trade Register77 445
Legal form‘naamloze vennootschap’ (publiclimited company) under Belgianlaw, which solicits or has solicitedsavings from the public; the com-pany is a financial holding com-pany registered with the BelgianBanking and Finance Commis-sion.
Lifeindefinite
Objectthe company is a financialholding company which has asobject the direct or indirect hold-ing and management of share-holdings in other companies,including − but not restricted to −credit institutions, insurancecompanies and other financialinstitutions (Article 2 of theArticles of Association).
Documents open to publicinspection
The Articles of Association of thecompany are open to public inspec-tion at the Registry of the BrusselsCommercial Court.
The annual accounts have beenfiled with the National Bank of Bel-gium. Decisions concerning theappointment and dismissal of mem-bers of the Board of Directors arepublished in the ‘Appendices to theBelgian Official Gazette’. Financialreports about the company andconvening notices of general meet-ings of shareholders are also pub-lished in the financial press.
Copies of the company’s annualreports are available at its regis-tered office. They are forwardedannually to the holders of regis-tered shares and to those who haveapplied for a copy.
General Meeting ofShareholders
Each year, at the registered officeof the company or elsewhere, asindicated in the convening notice, ageneral meeting is held on the finalThursday in April or, if that day is alegal holiday, on the last businessday immediately preceding it, ateleven a.m. To be admitted to thegeneral meeting, holders of bearershares or bonds must deposit thesesecurities at least four business daysprior to the meeting at the regis-tered office of the company or else-where, as indicated in the conven-ing notice.
The holders of registered shares orbonds are likewise required tonotify the company in writing at itsregistered office and within thesame time constraints of theirintention to attend the generalmeeting. Bondholders are entitledto attend the general meeting, butthey have only advisory votingcapacity.
Company annual accounts − KBC Bank and Insurance Holding Company NV
KBC Bank & Insurance Group − 2001 Annual Report
142
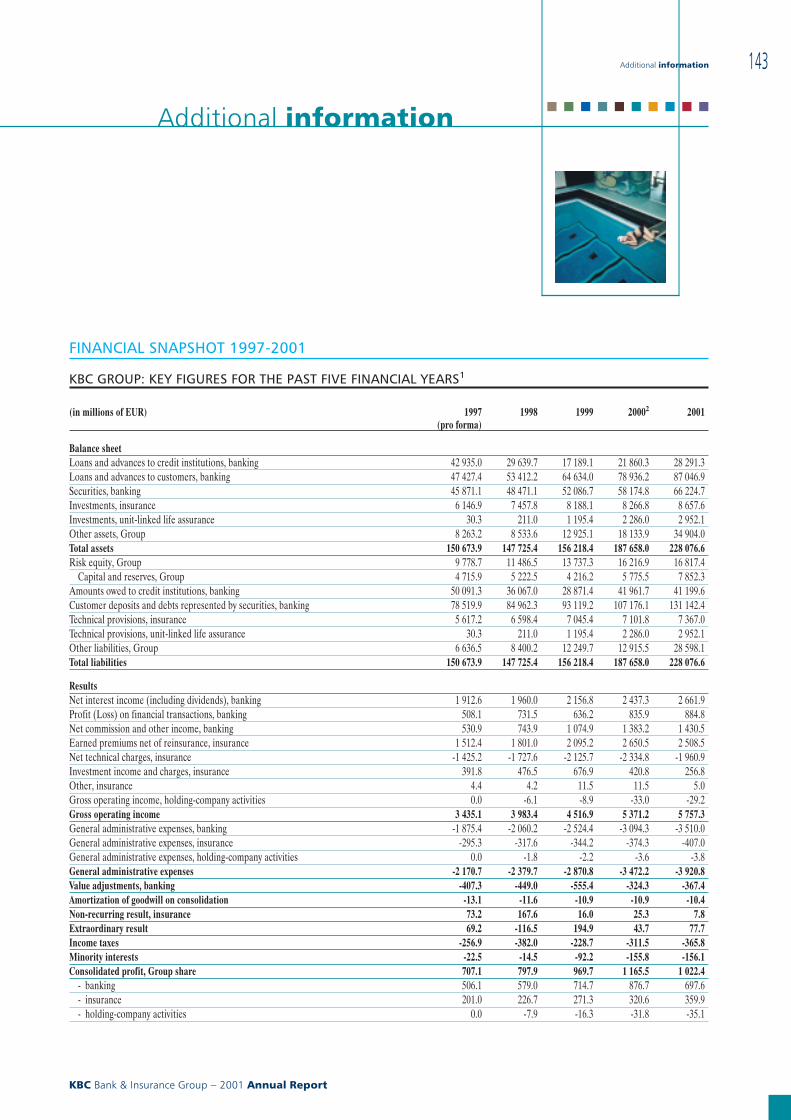
Additional information
FINANCIAL SNAPSHOT 1997-2001
KBC GROUP: KEY FIGURES FOR THE PAST FIVE FINANCIAL YEARS1
(in millions of EUR) 1997(pro forma)
1998 1999 20002 2001
Balance sheetLoans and advances to credit institutions, banking 42 935.0 29 639.7 17 189.1 21 860.3 28 291.3Loans and advances to customers, banking 47 427.4 53 412.2 64 634.0 78 936.2 87 046.9Securities, banking 45 871.1 48 471.1 52 086.7 58 174.8 66 224.7Investments, insurance 6 146.9 7 457.8 8 188.1 8 266.8 8 657.6Investments, unit-linked life assurance 30.3 211.0 1 195.4 2 286.0 2 952.1Other assets, Group 8 263.2 8 533.6 12 925.1 18 133.9 34 904.0Total assets 150 673.9 147 725.4 156 218.4 187 658.0 228 076.6Risk equity, Group 9 778.7 11 486.5 13 737.3 16 216.9 16 817.4
Capital and reserves, Group 4 715.9 5 222.5 4 216.2 5 775.5 7 852.3Amounts owed to credit institutions, banking 50 091.3 36 067.0 28 871.4 41 961.7 41 199.6Customer deposits and debts represented by securities, banking 78 519.9 84 962.3 93 119.2 107 176.1 131 142.4Technical provisions, insurance 5 617.2 6 598.4 7 045.4 7 101.8 7 367.0Technical provisions, unit-linked life assurance 30.3 211.0 1 195.4 2 286.0 2 952.1Other liabilities, Group 6 636.5 8 400.2 12 249.7 12 915.5 28 598.1Total liabilities 150 673.9 147 725.4 156 218.4 187 658.0 228 076.6
ResultsNet interest income (including dividends), banking 1 912.6 1 960.0 2 156.8 2 437.3 2 661.9Profit (Loss) on financial transactions, banking 508.1 731.5 636.2 835.9 884.8Net commission and other income, banking 530.9 743.9 1 074.9 1 383.2 1 430.5Earned premiums net of reinsurance, insurance 1 512.4 1 801.0 2 095.2 2 650.5 2 508.5Net technical charges, insurance -1 425.2 -1 727.6 -2 125.7 -2 334.8 -1 960.9Investment income and charges, insurance 391.8 476.5 676.9 420.8 256.8Other, insurance 4.4 4.2 11.5 11.5 5.0Gross operating income, holding-company activities 0.0 -6.1 -8.9 -33.0 -29.2Gross operating income 3 435.1 3 983.4 4 516.9 5 371.2 5 757.3General administrative expenses, banking -1 875.4 -2 060.2 -2 524.4 -3 094.3 -3 510.0General administrative expenses, insurance -295.3 -317.6 -344.2 -374.3 -407.0General administrative expenses, holding-company activities 0.0 -1.8 -2.2 -3.6 -3.8General administrative expenses -2 170.7 -2 379.7 -2 870.8 -3 472.2 -3 920.8Value adjustments, banking -407.3 -449.0 -555.4 -324.3 -367.4Amortization of goodwill on consolidation -13.1 -11.6 -10.9 -10.9 -10.4Non-recurring result, insurance 73.2 167.6 16.0 25.3 7.8Extraordinary result 69.2 -116.5 194.9 43.7 77.7Income taxes -256.9 -382.0 -228.7 -311.5 -365.8Minority interests -22.5 -14.5 -92.2 -155.8 -156.1Consolidated profit, Group share 707.1 797.9 969.7 1 165.5 1 022.4
- banking 506.1 579.0 714.7 876.7 697.6- insurance 201.0 226.7 271.3 320.6 359.9- holding-company activities 0.0 -7.9 -16.3 -31.8 -35.1
Additional information
KBC Bank & Insurance Group − 2001 Annual Report
143
■ ■ ■ ■ ■ ■ ■ ■ ■ ■
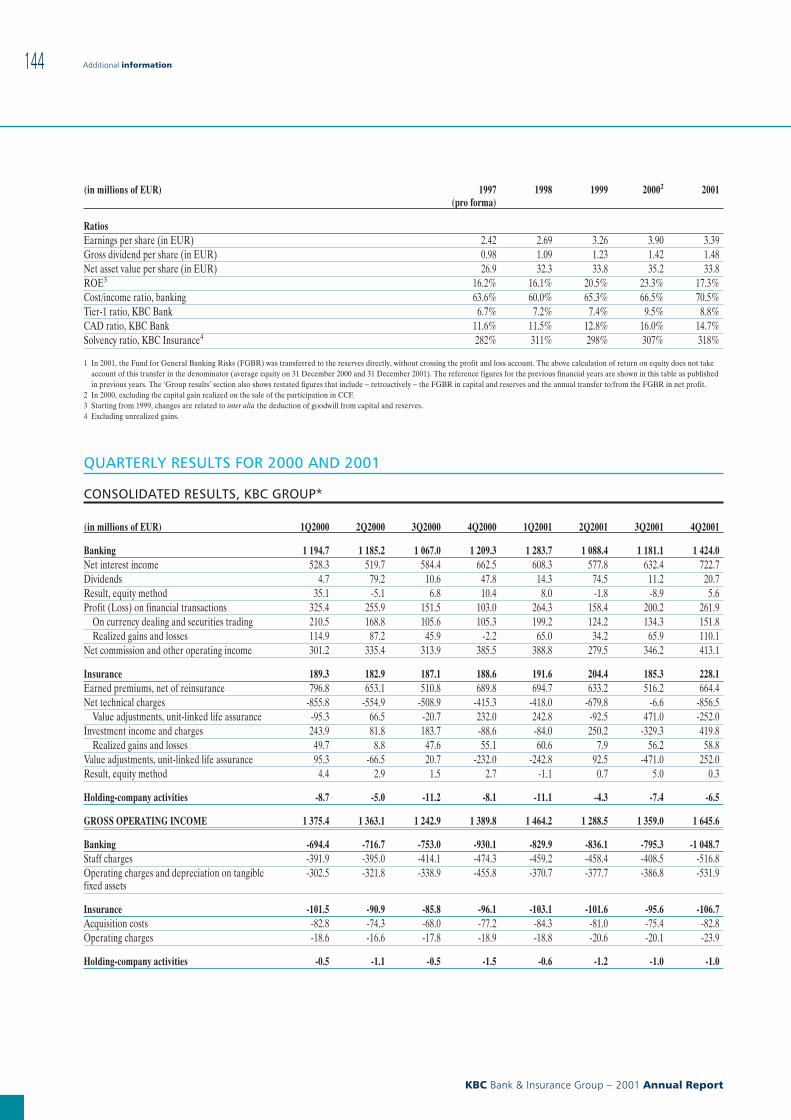
(in millions of EUR) 1997(pro forma)
1998 1999 20002 2001
RatiosEarnings per share (in EUR) 2.42 2.69 3.26 3.90 3.39Gross dividend per share (in EUR) 0.98 1.09 1.23 1.42 1.48Net asset value per share (in EUR) 26.9 32.3 33.8 35.2 33.8ROE3 16.2% 16.1% 20.5% 23.3% 17.3%Cost/income ratio, banking 63.6% 60.0% 65.3% 66.5% 70.5%Tier-1 ratio, KBC Bank 6.7% 7.2% 7.4% 9.5% 8.8%CAD ratio, KBC Bank 11.6% 11.5% 12.8% 16.0% 14.7%Solvency ratio, KBC Insurance4 282% 311% 298% 307% 318%
1 In 2001, the Fund for General Banking Risks (FGBR) was transferred to the reserves directly, without crossing the profit and loss account. The above calculation of return on equity does not takeaccount of this transfer in the denominator (average equity on 31 December 2000 and 31 December 2001). The reference figures for the previous financial years are shown in this table as publishedin previous years. The ‘Group results’ section also shows restated figures that include − retroactively − the FGBR in capital and reserves and the annual transfer to/from the FGBR in net profit.
2 In 2000, excluding the capital gain realized on the sale of the participation in CCF.3 Starting from 1999, changes are related to inter alia the deduction of goodwill from capital and reserves.4 Excluding unrealized gains.
QUARTERLY RESULTS FOR 2000 AND 2001
CONSOLIDATED RESULTS, KBC GROUP*
(in millions of EUR) 1Q2000 2Q2000 3Q2000 4Q2000 1Q2001 2Q2001 3Q2001 4Q2001
Banking 1 194.7 1 185.2 1 067.0 1 209.3 1 283.7 1 088.4 1 181.1 1 424.0Net interest income 528.3 519.7 584.4 662.5 608.3 577.8 632.4 722.7Dividends 4.7 79.2 10.6 47.8 14.3 74.5 11.2 20.7Result, equity method 35.1 -5.1 6.8 10.4 8.0 -1.8 -8.9 5.6Profit (Loss) on financial transactions 325.4 255.9 151.5 103.0 264.3 158.4 200.2 261.9
On currency dealing and securities trading 210.5 168.8 105.6 105.3 199.2 124.2 134.3 151.8Realized gains and losses 114.9 87.2 45.9 -2.2 65.0 34.2 65.9 110.1
Net commission and other operating income 301.2 335.4 313.9 385.5 388.8 279.5 346.2 413.1
Insurance 189.3 182.9 187.1 188.6 191.6 204.4 185.3 228.1Earned premiums, net of reinsurance 796.8 653.1 510.8 689.8 694.7 633.2 516.2 664.4Net technical charges -855.8 -554.9 -508.9 -415.3 -418.0 -679.8 -6.6 -856.5
Value adjustments, unit-linked life assurance -95.3 66.5 -20.7 232.0 242.8 -92.5 471.0 -252.0Investment income and charges 243.9 81.8 183.7 -88.6 -84.0 250.2 -329.3 419.8
Realized gains and losses 49.7 8.8 47.6 55.1 60.6 7.9 56.2 58.8Value adjustments, unit-linked life assurance 95.3 -66.5 20.7 -232.0 -242.8 92.5 -471.0 252.0Result, equity method 4.4 2.9 1.5 2.7 -1.1 0.7 5.0 0.3
Holding-company activities -8.7 -5.0 -11.2 -8.1 -11.1 -4.3 -7.4 -6.5
GROSS OPERATING INCOME 1 375.4 1 363.1 1 242.9 1 389.8 1 464.2 1 288.5 1 359.0 1 645.6
Banking -694.4 -716.7 -753.0 -930.1 -829.9 -836.1 -795.3 -1 048.7Staff charges -391.9 -395.0 -414.1 -474.3 -459.2 -458.4 -408.5 -516.8Operating charges and depreciation on tangiblefixed assets
-302.5 -321.8 -338.9 -455.8 -370.7 -377.7 -386.8 -531.9
Insurance -101.5 -90.9 -85.8 -96.1 -103.1 -101.6 -95.6 -106.7Acquisition costs -82.8 -74.3 -68.0 -77.2 -84.3 -81.0 -75.4 -82.8Operating charges -18.6 -16.6 -17.8 -18.9 -18.8 -20.6 -20.1 -23.9
Holding-company activities -0.5 -1.1 -0.5 -1.5 -0.6 -1.2 -1.0 -1.0
Additional information
KBC Bank & Insurance Group − 2001 Annual Report
144
(in millions of EUR) 1Q2000 2Q2000 3Q2000 4Q2000 1Q2001 2Q2001 3Q2001 4Q2001
GENERAL ADMINISTRATIVE EXPENSES -796.4 -808.8 -839.3 -1 027.7 -933.6 -938.9 -891.9 -1 156.4
OPERATING RESULT 579.0 554.3 403.6 362.1 530.6 349.6 467.1 489.3- banking 500.3 468.5 314.0 279.2 453.8 252.3 385.8 375.3- insurance 87.8 92.0 101.3 92.5 88.5 102.8 89.7 121.4
Value adjustments -100.2 -173.6 -95.1 44.7 -82.5 -35.9 -159.9 -89.1Write-downs on and provisions for credit risks -20.8 -59.3 -38.5 -122.7 -58.7 -23.5 -78.9 -160.4Value adjustments on securities -15.6 -9.4 -13.5 -43.8 -23.4 -5.2 -85.0 24.9Net allocation to the contingency funds -42.6 -75.7 -62.2 164.7 -1.4 -5.2 2.8 3.8Provisions for other liabilities and charges -21.3 -29.2 19.1 46.5 0.9 -2.0 1.2 42.6
Amortization of goodwill on consolidation -2.7 -2.8 -2.7 -2.7 -2.6 -2.6 -2.6 -2.6
Non-recurring result, insurance 5.7 3.2 -1.0 17.4 7.4 5.4 2.0 -7.0
Extraordinary result 3.0 1.6 -1.1 40.2 83.3 8.8 -27.2 12.9
PROFIT (LOSS) BEFORE TAX 484.8 382.7 303.7 461.7 536.2 325.2 279.4 403.4- banking 400.8 294.0 216.7 366.0 453.7 229.0 192.8 295.0- insurance 93.1 94.9 98.3 105.6 95.5 107.7 87.6 115.9
Income taxes -75.1 -85.3 -77.0 -74.2 -133.2 -57.3 -82.4 -92.8- banking -55.6 -72.1 -58.9 -56.1 -112.6 -42.1 -76.5 -81.3- insurance -24.3 -12.5 -17.8 -19.0 -19.9 -13.3 -5.1 -12.8
CONSOLIDATED PROFIT 409.7 297.4 226.7 387.4 403.0 267.9 197.0 310.6
Minority interests -38.8 -37.1 -41.1 -38.8 -47.5 -38.1 -38.2 -32.2
CONSOLIDATED PROFIT,Group share
370.8 260.4 185.6 348.7 355.4 229.8 158.8 278.4
- banking 308.1 186.4 117.6 264.6 292.6 149.8 72.9 182.4- insurance 68.4 79.6 80.0 92.7 76.6 93.4 87.7 102.2- holding-company activities -5.6 -5.7 -11.9 -8.7 -13.7 -13.4 -1.8 -6.2
* In 2000, excluding the capital gain realized on the sale of the participation in CCF. At the end of 2001, the Fund for General Banking Risks (FGBR) was transferred to the reserves directly, withoutcrossing the profit and loss account. The reference figures for the previous periods are shown in this table as published in previous interim reports. The ‘Group results’ section also shows restated(annual) reference figures that include − retroactively − the FGBR in capital and reserves and the annual transfer to/from the FGBR in net profit.
PENDING LITIGATION
A number of employees of KBCBank NV and its sister company,Kredietbank SA Luxembourgeoise,together with the President of theExecutive Committee of KBC BankNV, were placed under suspicion inthe so-called KB-Lux case. ThePresident and the members of staffconcerned deny these allegationsand will defend themselves in court.
Through its Czech subsidiary C{SOBa.s., KBC Bank NV is involved (asclaimant and/or defendant) in anumber of civil and criminal cases,as well as in government proced-ures arising from a ‘sales agree-ment’ which C{SOB concluded with
Investicní a Postovní banka, a.s.(IPB), another Czech bank whichwas placed under forced adminis-tration a few days prior to thisacquisition.
Like a number of other banks, KBCBank NV is involved in a disputewith the Belgian VAT Administra-tion concerning specific aspects ofthe way in which the VAT deduc-tion percentage is calculated; thispercentage determines how muchVAT the bank can recover. In previ-ous tax audits, however, the bank’smethod of calculation had beencondoned. The courts have in themeantime found in favour of one ofthe other banks, a decision that wasnot appealed by the competent
authorities by the relevant deadline.KBC Bank NV has also taken thismatter to court and likewise expectsa favourable decision to bereturned.
KBC Insurance NV is involved in adispute with the Belgian tax author-ities concerning the way in whichthe former ABB calculated tech-nical provisions for its life assur-ance activities (ABB used a tech-nical rate of 4% instead of the4.75% used to calculate the inven-tory provisions, or the guaranteedreturn for the persons insured).The tax authorities claim that thedifference between these two calcu-lations is taxable. After its appealwas rejected, KBC Insurance NV
Additional information
KBC Bank & Insurance Group − 2001 Annual Report
145
■ ■ ■ ■ ■ ■ ■ ■ ■ ■
petitioned the courts in this regardand has set aside a provision of 55.3million euros.
The Group is a party in a numberof other legal claims and is eitheritself or via its subsidiaries involvedin other legal proceedings whichhave arisen in the ordinary courseof business. Although the outcomeis uncertain and some claims arefor relatively large amounts in dam-ages, the Group’s managementdoes not believe that the liabilitiesarising from these claims willadversely affect the Group’s consoli-dated financial position or results.
KBC AND SOCIALLYRESPONSIBLE BUSINESS
KBC has always implicitly adheredto responsible business practices,but it has now chosen to clarify,structure and report on its specificsustainable business policies andpractices, codes of conduct andachievements.
In keeping with its mission state-ment set out in the 1998 annualreport and based on the ‘stakehold-er model’, KBC’s socially respon-sible business principles arereflected in its personnel policy, indetailed codes regulating its deal-ings with customers and other part-ners and in its sponsorship ofnumerous social, cultural and envir-onmental initiatives. Particularlynoteworthy is the contribution KBChas made for over thirty years nowthrough its Stichting Leefmilieu toconducting research and dissem-
inating information on the environ-ment. At the same time, KBC hasalso benefited from the assistancethat this foundation has providedby evaluating environmental issuesand problems encountered by KBCin its lending activities.
KBC does not consider sociallyresponsible business to be either apassing fad or a PR tool. It is noth-ing new for KBC, or indeed formany other enterprises. However,with companies having ever moreresponsibility thrust upon them andbeing called increasingly to accountfor their actions in today’s society,it behooves them to make clear toall concerned what their policiesare in this regard and how they areput into practice.
Socially responsible business entailsmore than merely complying withlaws and regulations and makingdonations to charities and worth-while initiatives. It is an attitude,a culture driving and inspiringthe entire company, not only outof a concern for its own long-termprofitability and continuity, butalso out of a respect for all itsstakeholders.
Socially responsible or sustainablebusiness policies and practicesshould first and foremost serve acompany’s own interests. Indeed,they are to a large extent determin-ing factors in a company’s profit-ability and continuity, as theyensure good employer/employeerelationships, a transparent socialdialogue, prudent use of companyresources, and loyalty and integrity
on the part of both managementand personnel, etc.
Moreover, since a company’sultimate social objective is to createwealth in order to improve the wel-fare of the community it serves,it would be contradictory andcounterproductive if this wealth-creation were to undermine thewelfare of present and/or futuregenerations by, for instance, impov-erishing or polluting the environ-ment.
A company will also seek to main-tain good, lasting relationships withthe community to which it belongs.Accordingly, it will tend to complywith both the spirit and the letter ofthe law and respond to changingnorms. Using its financial strength,talent for organization and otherresources, it will also support initia-tives that would otherwise not beable to be brought to fruition andthat enhance the social and culturaldevelopment of the community.
For all companies, there are twoaspects to sustainability: sustain-ability of the goods or services pro-duced and sustainability of the busi-ness itself in the interests of thestakeholders. For bancassurancecompanies, including KBC, the situ-ation is no different. Owing to abancassurer’s special intermediaryrole, there is a third facet to sustain-ability, i.e. the encouragement ofsocially responsible behaviour onthe part of investors, savers, bor-rowers, and the insured, etc., and/orthe pro-active protection/support ofthe weaker groups in society and of
Additional information
KBC Bank & Insurance Group − 2001 Annual Report
146
projects that have a social, culturaland ecological utility. Conductingbusiness on such a ‘pro-active’socially responsible basis may, how-ever, raise sensitive issues andcould potentially deteriorate intointerference, pedantry or an abuseof power. If a bank or an insurerdetects an additional risk in whatsome/many might consider to benot entirely socially responsibleconduct, it can point this out to theclient and, partly in its own justi-fiable interests, require that higherinterest or insurance premiums bepaid.
KBC is currently refining and clari-fying its existing code of sociallyresponsible conduct based on threedifferent issues: Will the servicepass consumer tests? Are the inter-ests of all stakeholders beingrespected? And are socially-respon-sible incentives feasible or indeeddesirable in certain cases?KBC intends, going forward, toreport on these matters and on howit contributes through its own activ-ities to environmental conservation(although it causes little pollutionitself), as well as on its extensivecontribution to cultural projects,the social economy and develop-ment aid.
Additional information
KBC Bank & Insurance Group − 2001 Annual Report
147
■ ■ ■ ■ ■ ■ ■ ■ ■ ■
Information for shareholdersand the general public
GENERAL PUBLIC
Information on products, servicesand publications of the KBC Groupcan be obtained from theKBC-Telecenter on weekdaysbetween 8 a.m. and 10 p.m. and onSaturdays and bank holidaysbetween 9 a.m. and 5 p.m.Tel. + 32 78 152 153 (Dutch)Tel. + 32 78 152 154 (French,English, German)Fax + 32 3 283 29 50E-mail [email protected]
If there are any problems regardingservice, or if your branch or agentis unable to help you, pleasecontact:
Bank:KBC Bank NVCustomer Service DepartmentBrusselsesteenweg 100BE-3000 LeuvenTel. + 32 78 15 20 45Fax + 32 16 86 30 38E-mail [email protected]
Insurance:KBC Insurance NVOmbudsmanWaaistraat 6BE-3000 LeuvenTel. + 32 16 24 37 38Fax + 32 16 24 37 37E-mail [email protected]
SHAREHOLDERS
Information concerning thestrategy and results of theKBC Group is available fromDorette Webers, Investor RelationsManager, or Nele Kindt, InvestorRelations Assistant.Havenlaan 2BE-1080 BrusselsTel. + 32 2 429 55 94 or+ 32 2 429 49 16Fax + 32 2 429 44 16Web site www.kbc.comE-mail [email protected] [email protected]
FINANCIAL CALENDAR
j Publication of results for the2001 financial year4 March 2002General Meeting of Shareholders25 April 2002Dividend payment29 April 2002
j Publication of first-quarterresults for 200223 May 2002
j Publication of half-yearresults for 20022 September 2002
j Publication of third-quarterresults for 200221 November 2002
For the most up-to-date version ofthe financial calendar, see theKBC Web site.
WEB SITE
The annual, half-year and quarterlyreports, as well as press releasesand other financial information canbe found on KBC’s Web site atwww.kbc.com.
Editor-in-chief:Luc Albrecht
Production co-ordinationand layout:Nancy Van der Auwermeulen
Language Serviceco-ordination:Elke De Backer
English translation:Patricia Hollinger,Mark Graham,Peter von Bergen,Marina Kanamori
Sub-editing:Elke De Backer
Print co-ordination:Eddy Moyaers
Printer:Van der Poorten, Leuven
This annual report has beenprinted on paper which is notharmful to the environment.
Publisher:Leo van de Gender,Brusselsesteenweg 100,3000 Leuven.
Information for shareholders and the general public
KBC Bank & Insurance Group − 2001 Annual Report
148
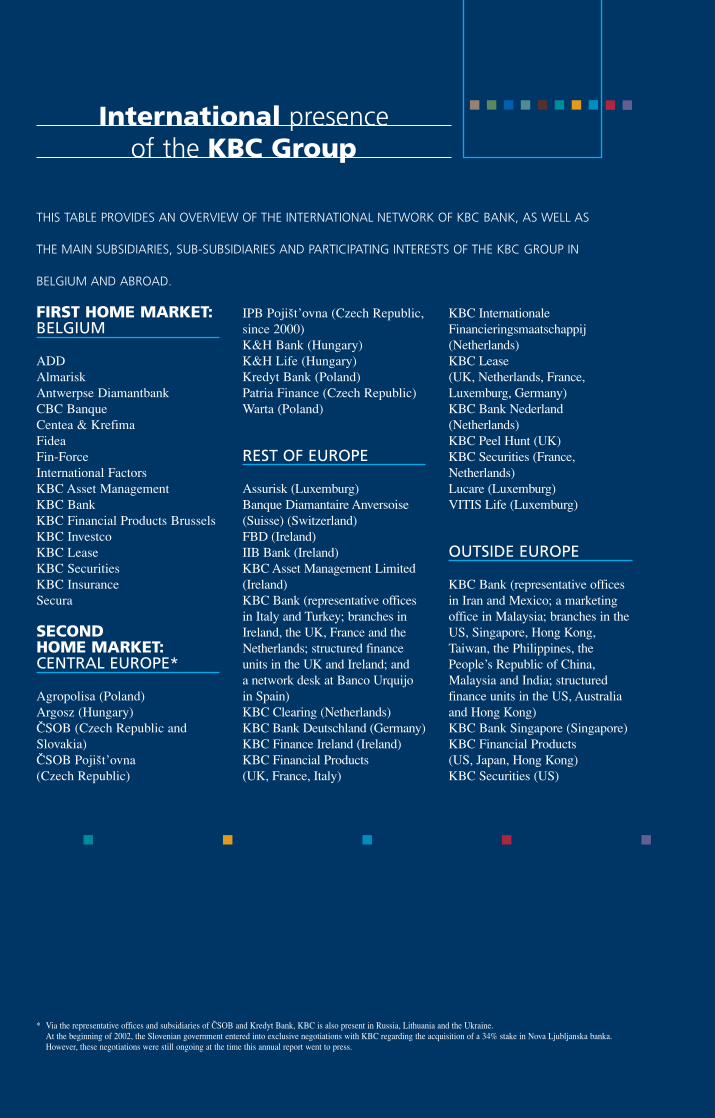
FIRST HOME MARKET:BELGIUM
ADDAlmariskAntwerpse DiamantbankCBC BanqueCentea & KrefimaFideaFin-ForceInternational FactorsKBC Asset ManagementKBC BankKBC Financial Products BrusselsKBC InvestcoKBC LeaseKBC SecuritiesKBC InsuranceSecura
SECOND HOME MARKET: CENTRAL EUROPE*
Agropolisa (Poland)Argosz (Hungary)CSOB (Czech Republic andSlovakia)CSOB Pojist’ovna (Czech Republic)
IPB Pojist’ovna (Czech Republic,since 2000)K&H Bank (Hungary)K&H Life (Hungary)Kredyt Bank (Poland)Patria Finance (Czech Republic)Warta (Poland)
REST OF EUROPE
Assurisk (Luxemburg)Banque Diamantaire Anversoise(Suisse) (Switzerland)FBD (Ireland)IIB Bank (Ireland)KBC Asset Management Limited(Ireland)KBC Bank (representative officesin Italy and Turkey; branches inIreland, the UK, France and theNetherlands; structured financeunits in the UK and Ireland; and a network desk at Banco Urquijoin Spain)KBC Clearing (Netherlands)KBC Bank Deutschland (Germany)KBC Finance Ireland (Ireland)KBC Financial Products (UK, France, Italy)
KBC InternationaleFinancieringsmaatschappij(Netherlands)KBC Lease (UK, Netherlands, France,Luxemburg, Germany)KBC Bank Nederland(Netherlands)KBC Peel Hunt (UK)KBC Securities (France,Netherlands)Lucare (Luxemburg)VITIS Life (Luxemburg)
OUTSIDE EUROPE
KBC Bank (representative officesin Iran and Mexico; a marketingoffice in Malaysia; branches in theUS, Singapore, Hong Kong,Taiwan, the Philippines, thePeople’s Republic of China,Malaysia and India; structuredfinance units in the US, Australiaand Hong Kong)KBC Bank Singapore (Singapore)KBC Financial Products (US, Japan, Hong Kong)KBC Securities (US)
International presence of the KBC Group
Annual Report 2001
2001 An
nu
al R
ep
ort
KBCBa
nk &
Insu
ran
ce
Gro
up
THIS TABLE PROVIDES AN OVERVIEW OF THE INTERNATIONAL NETWORK OF KBC BANK, AS WELL AS
THE MAIN SUBSIDIARIES, SUB-SUBSIDIARIES AND PARTICIPATING INTERESTS OF THE KBC GROUP IN
BELGIUM AND ABROAD.
* Via the representative offices and subsidiaries of CSOB and Kredyt Bank, KBC is also present in Russia, Lithuania and the Ukraine. At the beginning of 2002, the Slovenian government entered into exclusive negotiations with KBC regarding the acquisition of a 34% stake in Nova Ljubljanska banka.However, these negotiations were still ongoing at the time this annual report went to press.
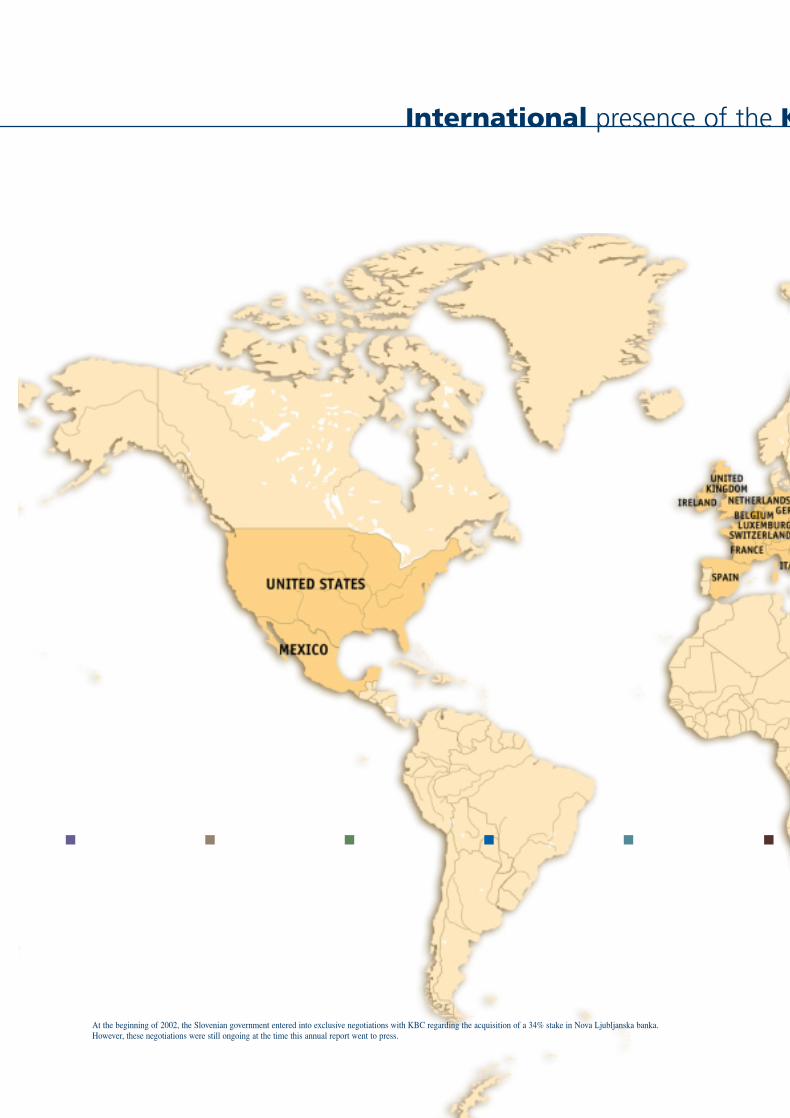
KBC Group profile
STRATEGY
KBC HAS THE AMBITION TO BE A PROFITABLE MULTI-CHANNEL BANCASSURER, WITH A GEOGRAPHIC FOCUS ON
EUROPE. IN WESTERN EUROPE, THE GROUP BOASTS A LEADING POSITION IN BELGIUM AND CURRENTLY HAS
A LIMITED PRESENCE IN OTHER COUNTRIES, AS WELL. IN CENTRAL EUROPE, IT IS ONE OF THE PREMIER FINANCIAL
SERVICES GROUPS. KBC FOCUSES ON FOUR ACTIVITIES, NAMELY RETAIL AND PRIVATE BANCASSURANCE,
CORPORATE SERVICES, ASSET MANAGEMENT AND MARKET ACTIVITIES. THE GROUP’S EXPLICIT AIM IS TO CREATE
LASTING VALUE FOR ITS SHAREHOLDERS THROUGH THE PURSUIT OF ITS BUSINESS ACTIVITIES.
Key figures, KBC Group (in millions of EUR) 31-12-1999 31-12-2000 31-12-2001
Total assets 156 218 187 658 228 077
Capital and reserves1 4 216 5 776 7 852Risk equity 13 737 16 217 16 817Tier-1 ratio, KBC Bank 7.4% 9.5% 8.8%CAD ratio, KBC Bank 12.8% 16.0% 14.7%Explicit solvency ratio, KBC Insurance 298% 307% 318%
Consolidated net profit, Group share1, 2 969.7 1 165.5 1 022.4ROE1, 2, 3 20.5% 23.3% 17.3%
Key figures per area of activity Share in Group ROE(31-12-2001)4 profit (incl. FGBR)
Retail and private bancassurance 35.6% 13.9%Central Europe 11.5% 7.5%Corporate services 21.1% 8.3%Asset management 9.3% 6
Market activities 4.5% 4.1%Group item 18.0% -Total 100.0% 13.2%
Long-term ratings (31-12-2001) Fitch Moody’s S&P’s
KBC Bank5 AA- Aa3 A+KBC Insurance7 AA - A+
1 In 2001, the Fund for General Banking Risks (FGBR) was transferred to the reserves directly, without crossing the profit and loss account. The above calculation of return on equity for2001 does not take account of this transfer in the denominator (average equity on 31 December 2000 and 31 December 2001). The reference figures for the previous financial years areshown in this table as published in previous years. The ‘Group results’ section also shows restated figures that include – retroactively – the FGBR in capital and reserves and the annualtransfer to/from the FGBR in net profit.
2 In 2000, excluding the capital gain realized on the sale of the participation in CCF. 3 ROE takes into account the derogation allowed by the BFC regarding the immediate deduction from capital and reserves of the goodwill paid on recent acquisitions. If the goodwill in
question were capitalized and amortized over a period of twenty years, the return on equity for 2001 would come to 12.7% (10.2%, including the FGBR).4 In this ‘ROE’ figure, the FGBR is considered a component of capital and reserves and the transfers to the FGBR components of profit.5 Moody’s and S&P’s ratings: ‘on negative outlook’.6 Since there are hardly any risk-weighted assets in this area of activity, ROE is not really relevant here.7 ‘Claims paying ability’ rating. S&P’s rating: ‘on negative outlook’.
International presence of the KBC Group
At the beginning of 2002, the Slovenian government entered into exclusive negotiations with KBC regarding the acquisition of a 34% stake in Nova Ljubljanska banka.However, these negotiations were still ongoing at the time this annual report went to press.
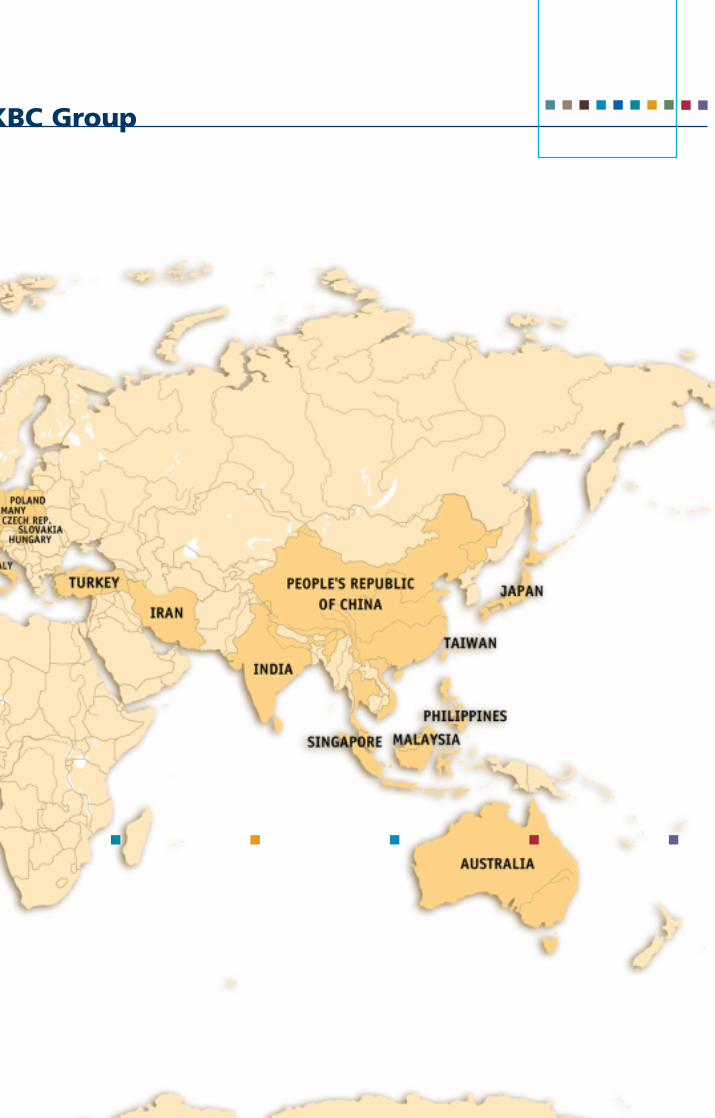

FIRST HOME MARKET:BELGIUM
ADDAlmariskAntwerpse DiamantbankCBC BanqueCentea & KrefimaFideaFin-ForceInternational FactorsKBC Asset ManagementKBC BankKBC Financial Products BrusselsKBC InvestcoKBC LeaseKBC SecuritiesKBC InsuranceSecura
SECOND HOME MARKET: CENTRAL EUROPE*
Agropolisa (Poland)Argosz (Hungary)CSOB (Czech Republic andSlovakia)CSOB Pojist’ovna (Czech Republic)
IPB Pojist’ovna (Czech Republic,since 2000)K&H Bank (Hungary)K&H Life (Hungary)Kredyt Bank (Poland)Patria Finance (Czech Republic)Warta (Poland)
REST OF EUROPE
Assurisk (Luxemburg)Banque Diamantaire Anversoise(Suisse) (Switzerland)FBD (Ireland)IIB Bank (Ireland)KBC Asset Management Limited(Ireland)KBC Bank (representative officesin Italy and Turkey; branches inIreland, the UK, France and theNetherlands; structured financeunits in the UK and Ireland; and a network desk at Banco Urquijoin Spain)KBC Clearing (Netherlands)KBC Bank Deutschland (Germany)KBC Finance Ireland (Ireland)KBC Financial Products (UK, France, Italy)
KBC InternationaleFinancieringsmaatschappij(Netherlands)KBC Lease (UK, Netherlands, France,Luxemburg, Germany)KBC Bank Nederland(Netherlands)KBC Peel Hunt (UK)KBC Securities (France,Netherlands)Lucare (Luxemburg)VITIS Life (Luxemburg)
OUTSIDE EUROPE
KBC Bank (representative officesin Iran and Mexico; a marketingoffice in Malaysia; branches in theUS, Singapore, Hong Kong,Taiwan, the Philippines, thePeople’s Republic of China,Malaysia and India; structuredfinance units in the US, Australiaand Hong Kong)KBC Bank Singapore (Singapore)KBC Financial Products (US, Japan, Hong Kong)KBC Securities (US)
International presence of the KBC Group
Annual Report 2001
2001 An
nu
al R
ep
ort
KBCBa
nk &
Insu
ran
ce
Gro
up
THIS TABLE PROVIDES AN OVERVIEW OF THE INTERNATIONAL NETWORK OF KBC BANK, AS WELL AS
THE MAIN SUBSIDIARIES, SUB-SUBSIDIARIES AND PARTICIPATING INTERESTS OF THE KBC GROUP IN
BELGIUM AND ABROAD.
* Via the representative offices and subsidiaries of CSOB and Kredyt Bank, KBC is also present in Russia, Lithuania and the Ukraine. At the beginning of 2002, the Slovenian government entered into exclusive negotiations with KBC regarding the acquisition of a 34% stake in Nova Ljubljanska banka.However, these negotiations were still ongoing at the time this annual report went to press.