KBC Group - KBC.com · KBC Group 1Q 2016 results Press presentation Johan Thijs, CEO KBC Group ......
22
1 KBC Group 1Q 2016 results Press presentation Johan Thijs, CEO KBC Group Luc Popelier, CFO KBC Group More detailed analyst presentation available at www.kbc.com.
Transcript of KBC Group - KBC.com · KBC Group 1Q 2016 results Press presentation Johan Thijs, CEO KBC Group ......

1
KBC Group 1Q 2016 results
Press presentationJohan Thijs, CEO KBC GroupLuc Popelier, CFO KBC Group
More detailed analyst presentation available at www.kbc.com.

2
This presentation is provided for informational purposes only. It does not constitute an offer to sell or the solicitation to buy anysecurity issued by the KBC Group.
KBC believes that this presentation is reliable, although some information is condensed and therefore incomplete. KBC cannot beheld liable for any loss or damage resulting from the use of the information.
This presentation contains non-IFRS information and forward-looking statements with respect to the strategy, earnings and capitaltrends of KBC, involving numerous assumptions and uncertainties. There is a risk that these statements may not be fulfilled andthat future developments differ materially. Moreover, KBC does not undertake any obligation to update the presentation in linewith new developments.
By reading this presentation, each investor is deemed to represent that it possesses sufficient expertise to understand the risksinvolved.
Important information for investors

3
1Q 2016 key takeaways for KBC Group
STRONG BUSINESS PERFORMANCE IN 1Q16Strong net result of 392m EUR in 1Q16, despite unfavorable market circumstances and the large upfront bank taxeso Good commercial bank-insurance franchises in our core markets and core activitieso Q-o-q increase in customer loan and deposit volumes in most of our core countrieso Slightly higher net interest income and net interest margin q-o-qo Limited net asset management inflows and lower net fee and commission income q-o-q (fully in line with guidance)o Higher net gains from financial instruments at fair value (due mainly to the impact of KBC FH in 4Q15), higher net other
income and lower realised AFS gainso Combined ratio (91% in 1Q16) distorted by one-off charges due to the terrorist attacks in Belgium (-30m EUR). Underlying
quality remained excellent (combined ratio of 82% excluding one-off charges). Excellent sales of both non-life and life insurance products
o Cost/income ratio (57% in 1Q16) adjusted for specific items o Unsustainably low impairment charges (due partly to seasonal effect). Net loan provision release of 3m EUR in 1Q16 in
Ireland. We are maintaining our profitability and impairment guidance for Ireland, namely the lower end of the 50m-100m EUR range for FY16 for impairments
SOLID CAPITAL AND ROBUST LIQUIDITY POSITIONSo Common equity ratio (B3 phased-in) of 14.6% based on the Danish Compromise at end 1Q16, which clearly exceeds the new
minimum capital requirements set by the ECB (9.75%) and the NBB (0.5%), i.e. an aggregate 10.25% for 2016. The B3 fullyloaded common equity ratio stood at 14.6% based on the Danish Compromise at end 1Q16
o Fully loaded B3 leverage ratio, based on current CRR legislation, amounted to 5.9% at KBC Groupo Continued strong liquidity position (NSFR at 121% and LCR at 130%) at end 1Q16

4
KBC GroupConsolidated results1Q 2016 performance

5
KBC Group: Strong business performance in 1Q 2016
Net result
392
600666
510
441
765
4Q 2015
862
-344
3Q 20152Q 20151Q 2015 1Q 2016
Amounts in millions of EUR
Goodwill impairmentsImpact of KBC Financial Holding

6
20162015
330
1 234
1 564
209
399
129
143
20162015
542
60
245
221
20162015
24
Amounts in millions of EUR
1Q
2Q - 4Q
BE BU CZ BU IM BU
Net result per business unit:IM BU*: turnaround achieved
* International Markets (IM) BU includes Hungary, Slovakia, Bulgaria and Ireland
Profit breakdown for InternationalMarkets: 20m EUR for Slovakia, 12m EURfor Hungary, 4m EUR for Bulgaria and23m EUR for Ireland

7
Net interest income: Slightly higher Net Interest Income (NII) and Margin (NIM)
NII slightly up q-o-q:(+) lower funding costs, additional rate cuts on savings accountsand continued good volume growth in current accounts andloans(-) lower reinvestment yields, pressure on commercial loanmargins in most core countries and a decrease of 2m EUR in NIIfrom the dealing room
Amounts in millions of EUR
-2%
+
1Q 2016
1 067
4Q 2015
1 066
1Q 2015
1 091
Q-o-q increase of NIM is duealmost entirely to rate cuts onsavings accounts and lowerfunding costs partly offset bylower reinvestment yields andpressure on commercial loanmargins in most core countries
1Q15 4Q15 1Q16
2.10% 1.95% 1.96%
Net Interest Margin
8
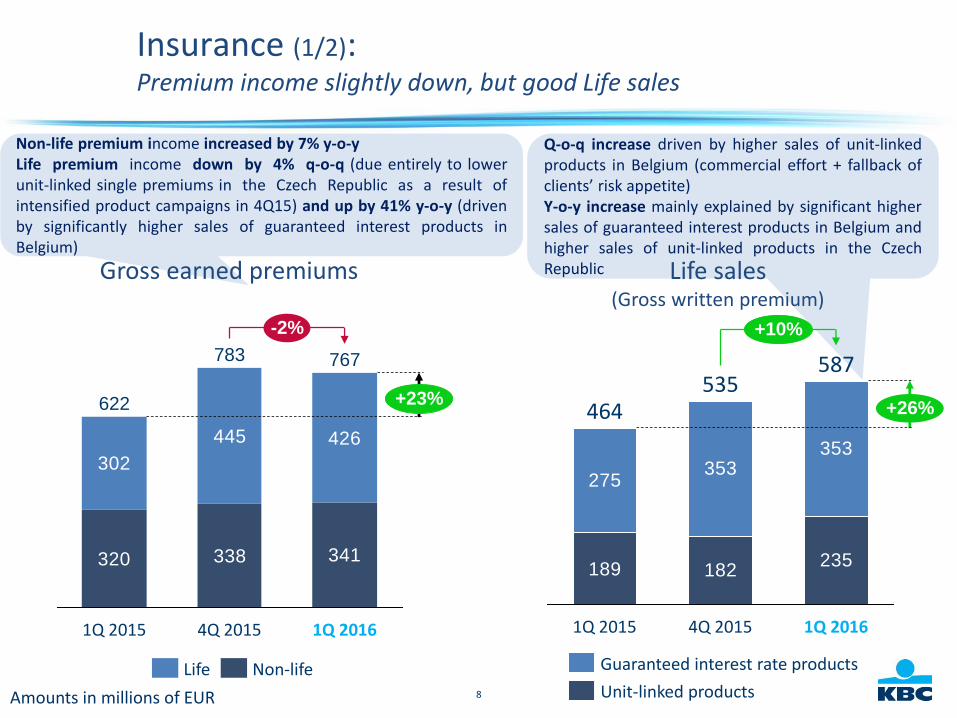
Q-o-q increase driven by higher sales of unit-linkedproducts in Belgium (commercial effort + fallback ofclients’ risk appetite)Y-o-y increase mainly explained by significant highersales of guaranteed interest products in Belgium andhigher sales of unit-linked products in the CzechRepublic
Non-life premium income increased by 7% y-o-yLife premium income down by 4% q-o-q (due entirely to lowerunit-linked single premiums in the Czech Republic as a result ofintensified product campaigns in 4Q15) and up by 41% y-o-y (drivenby significantly higher sales of guaranteed interest products inBelgium)
Insurance (1/2): Premium income slightly down, but good Life sales
Gross earned premiums
320 338 341
302
445 426
-2%
1Q 2016
767
4Q 2015
783
1Q 2015
622 +23%
Amounts in millions of EUR
Non-lifeLife
189 182235
275353
353
587
+26%
+10%
1Q 20164Q 2015
535
1Q 2015
464
Unit-linked products
Guaranteed interest rate products
Life sales(Gross written premium)

9
Insurance (2/2):Strong non-life sales with excellent combined ratio (excl. one-off charges)
Amounts in millions of EUR
445418
+6%
1Q 20161Q 2015
Up by 6% y-o-y thanks to a goodcommercial performance in all majorproduct lines in our core markets andpremium increases
Non-life sales (Gross written premium)
Relatively low technical charges due to mildwinter conditions across all countrieswhich were offset by one-off charges dueto terrorist attacks in Belgium (-30m EUR)
82%
FY
91%
9M
89%
1H
86%
1Q
82%
2016
2015
One-off charges
9%
91%

10
Net fee and commission income:Small net asset management inflows and lower fee and commission income (in line with guidance)
Net fee and commission income Assets under management (AUM)
• Q-o-q decrease was the result chiefly of:- lower management fees from mutual funds & unit-linked products (lower AuM and
high cash level in CPPI) and lower entry fees from mutual funds in Belgium- lower fees from payment services in the Czech Republic (seasonal effect & impact of
interchange fees regulation) and Hungary- lower fees from credit files and bank guarantees in BE, CZ and SK- higher commissions paid on insurance sales- partly offset by higher entry fees from unit-linked life insurance products
• Although the recovery of net F&C has been delayed due to the marketcircumstances in 1Q16, we expect a positive reversal of the trend in net F&C in2Q16. Net F&C income will remain an important top-line contributor
Q-o-q: small net inflows and negativeprice effect (-1%)
Y-o-y: flat owing to net inflows (+4%) andnegative price effect (-5%)
Amounts in millions of EUR Amounts in billions of EUR
346371
459
-25%
-7%
1Q 20164Q 20151Q 2015
207209208
-1%
1Q 2016
0%
4Q 20151Q 2015

11
The other net income drivers:Higher FV gains and other net income, lower gains realised on AFS assets
Gains realised on AFS assetsNet gains on financial instruments at fair value
Q-o-q increase attributable chiefly to:(+) -156m EUR translation differences by liquidating KBC FH (4Q15), +20m EUR inALM derivatives (+12m EUR in 4Q15) due to positive time value and a one-off benefitfrom unwinding the hedge on the previous TLTRO (+21m EUR), despite a significantdecrease q-o-q in IRS rates and better dealing room income & +12m EUR Own CreditRisk (mainly methodology change)
(-) negative change in market, credit and fair value adjustments (as a result ofwidening spreads and increased volumes)
93
-68
57 +63%
1Q 20164Q 20151Q 2015
+2730
80
1Q 20164Q 20151Q 2015
Amounts in millions of EUR
514749
1Q 20164Q 20151Q 2015
Other net income

12
Opex excluding bank tax down 7% q-o-q due to:- seasonal effects such as traditionally lower marketing,
ICT and professional fee expenses- lower depreciation and amortisation costs in Ireland,
the Group Centre and Hungary- No restructuring charges in CZ in 1Q16
Operating expenses:Expenses up, due entirely to higher bank taxes
861 914 851
264 335
1 186
1Q 2016
5%
+23%
4Q 2015
96249
1Q 2015
1 125
Special bank taxes Operating expenses
* adjusted for specific items: MtM ALM derivatives, equally spread special bank taxes, etc.
Amounts in millions of EUR
1Q15 4Q15 1Q16
53% 59% 57%
Quarterly C/I ratio*-7%
13
2015
160
2016
222
241
62
2015
20
2016
15
35
28
2015
7961
154
2016
75
2015
264
417
2016
153
335
Amounts in millions of EUR
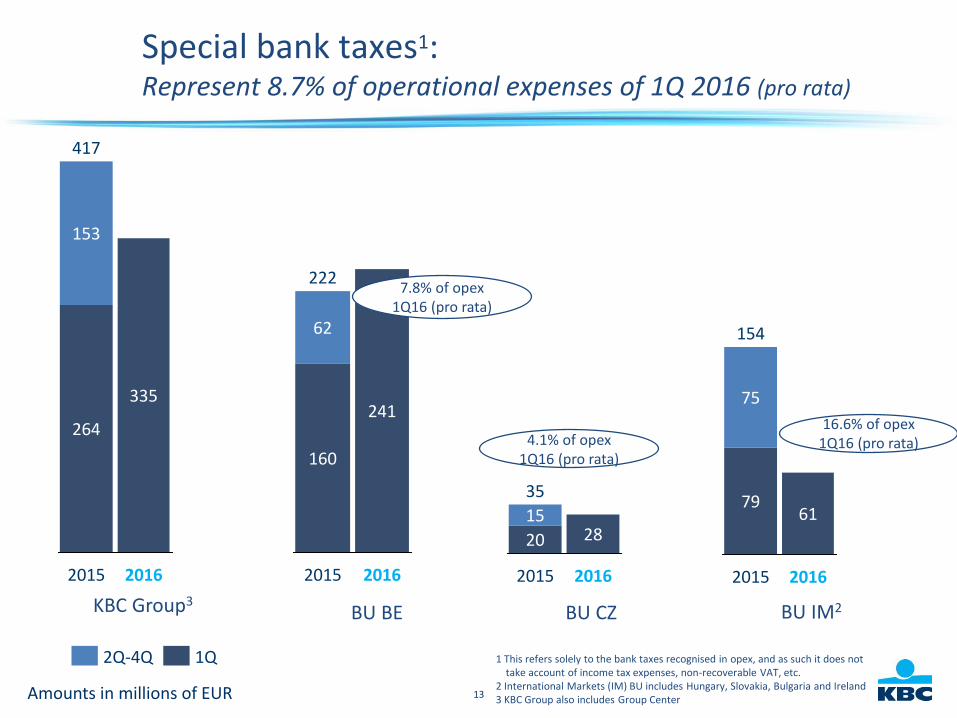
Special bank taxes1:Represent 8.7% of operational expenses of 1Q 2016 (pro rata)
1 This refers solely to the bank taxes recognised in opex, and as such it does not take account of income tax expenses, non-recoverable VAT, etc.
2 International Markets (IM) BU includes Hungary, Slovakia, Bulgaria and Ireland3 KBC Group also includes Group Center
1Q2Q-4Q
BU BE BU CZ BU IM2KBC Group3
7.8% of opex1Q16 (pro rata)
4.1% of opex1Q16 (pro rata)
16.6% of opex1Q16 (pro rata)
14
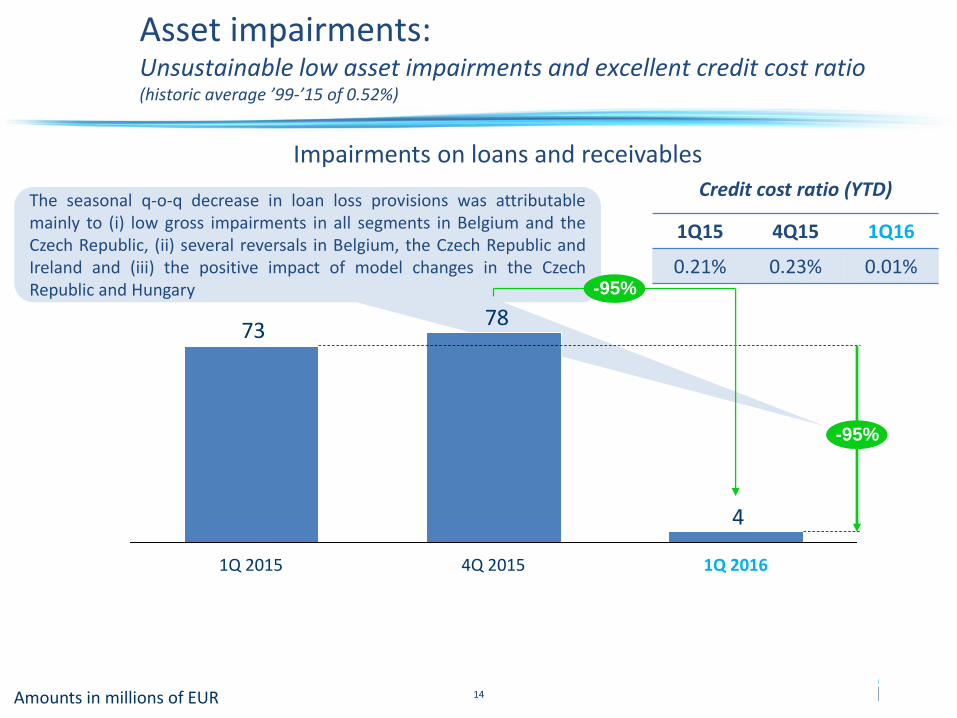
The seasonal q-o-q decrease in loan loss provisions was attributablemainly to (i) low gross impairments in all segments in Belgium and theCzech Republic, (ii) several reversals in Belgium, the Czech Republic andIreland and (iii) the positive impact of model changes in the CzechRepublic and Hungary
Asset impairments:Unsustainable low asset impairments and excellent credit cost ratio (historic average ’99-’15 of 0.52%)
Impairments on loans and receivables
Amounts in millions of EUR
4
7873
-95%
-95%
1Q 2015 4Q 2015 1Q 2016
1Q15 4Q15 1Q16
0.21% 0.23% 0.01%
Credit cost ratio (YTD)

15
KBC GroupBalance sheet, capital and liquidity

16
Balance sheet (1/2):Loans and deposits continue to grow in most core countries
Deposits***
3%
4%
3%
MortgagesLoans**
* Volume growth making abstraction of Fx effects and divestments/acquisitions** Loans to customers, excluding reverse repos (and bonds)*** Customer deposits, including debt certificates but excluding repos. Please be aware of the significant impact of calling most of the hybrid tier-1 instruments and maturing wholesale debt
Y-O-Y ORGANIC* VOLUME GROWTH FOR KBC GROUP

17
Balance sheet (2/2):Loans and deposits continue to grow in most core countries
Deposits***
3%
Mortgages
3%
Loans**
4%
Deposits***
8%
Mortgages
10%
Loans**
10%
Deposits***
17%
Mortgages
-3%
Loans**
-5%
Deposits***
15%
Mortgages
16%
Loans**
15%
-5%
Loans** Mortgages
2%
Deposits***
13%
Deposits***
10%
Mortgages
2%
Loans**
11%
* Volume growth making abstraction of Fx effects and divestments/acquisitions** Loans to customers including reverse repos (and not including bonds) *** Customer deposits, including debt certificates and including repos
BECZ
Y-O-Y ORGANIC* VOLUME GROWTH FOR MAIN ENTITIES

18
Capital and liquidity ratios (1/2):Capital ratio resides comfortably above regulatory minimum
KBC Group Basel 3 CET1 ratio (Danish compromise)
10.25% regulatoryminimum*
1.1%
14.6%
9.6%
2.2%
1Q14
12.9% 13.2%
9.9%
2.2%
1.1%1.2%
1H14
10.6% 11.0%
14.4%15.2%
9M15
2.4%
13.7%
17.2%16.9%
1H15
1.2%1.2%
2.4%
13.3%11.4%
14.7%
1Q15FY14
1.1%
2.2%
FY15
1.1%
2.3% 2.3%
1Q169M14
14.0%
11.25% pro forma regulatory minimum*
1.1%12.2%
1Q14
2.1%
9.0%
2.1%
1.1% 2.2%
1H159M14 FY14
13.7%
10.4%
1.1%
FY15 1Q16
11.0%
12.9%2.2%
13.2%
17.4%
1.2%
9.7%
1.2%
14.3%
16.7%
1H14 1Q15
2.2%
2.3%
9M15
1.1%
14.0%
14.9%2.3%
11.7%
14.6%1.1%
14.9%
Phased-in
Fully loaded
* Minimum capital requirements set by the ECB (9.75%) and the NBB (0.5%), i.e. an aggregate 10.25% for 2016. As announced by the NBB the systemic buffer (CET1 phased-in of 0.5% in2016 under the Danish Compromise) will gradually increase over a 3-year period, reaching 1.5% in 2018
State aid
Penalty on State aid

19
Capital and liquidity ratios (2/2):Liquidity continues to be strong
KBC Group’s liquidity ratios*
* Liquidity coverage ratio (LCR) and net stable funding ratio (NSFR) are calculated based on KBC’s interpretation of the current Basel Committee guidance, which may change inthe future. The LCR can be relatively volatile in future due to its calculation method, as month-to-month changes in the difference between inflows and outflows can causeimportant swings in the ratio even if liquid assets remain stable
121% 121%
end 2015 1Q 2016
NSFR
130%127%
end 2015 1Q 2016
LCR
Target = 105%
20
KBC Group 1Q 2016 wrap up

21
Wrap up
More detailed analyst presentation available on www.kbc.com.
Strong commercial bank-insurance results in our core countries
Successful underlying earnings track record
Solid capital and robust liquidity position

22
Looking forward to 2016
* Subject to the approval of the General Meeting of Shareholders
Looking forward, management envisages:
Continued stable and solid returns for the Belgium & Czech Republic Business Units
Turnaround achieved in the International Markets Business Unit
As per guidance already issued, profitability in Ireland expected to continue for the FY16…
…moreover, we are maintaining our guidance on impairments for Ireland, namely the lower end of the 50m-100m EUR range for FY16
A phased-in B3 common equity ratio of minimum 10.25% for 2016
LCR and NSFR of at least 105%
Dividend payout ratio (including the coupon paid on AT1) ≥ 50% as of FY2016*