STAUFF Fluid Technology Components for Mobile Construction Machinery.pdf 2015
«KAZAKHSTAN INDUSTRY DEVELOPMENT INSTITUTE» JSC
ASTANA, 2013
«KAZAKHSTAN INDUSTRY DEVELOPMENT INSTITUTE» JSC
1

MAIN DIRECTIONS OF COMPANY’S ACTIVITY
«K
IDI»
JSC
Applied field researches
Industry sectors analyses
Integrated Map of Priority Goods and Services (IMPGS)
Monitoring
Forced industrially-innovative development state program (FIID SP)
Industry sectors’ programs
Industrialization map
«Productivity 2020» 55 projects were included into the
program for a total sum of 154,3 bln. tenge
2

Technical regulation
The local content
MONITORING OF KEY POLICIES
Monitoring, analysis, assessment of industry sectors programs realization
The analysis and forecasting assessment of industry sector program indicators achievement on 2013, 2014 years
The analysis of indicators and parameters of industrially-innovative development in the cut of regions since 2008 to the current period of 2013
The analysis of perspectivity and efficiency of key measures of the governmental support
Handbook granting
• General indicators of FIID SP
• Industry sectors
• Key measures of industry support
• Indicators of industrially-innovative development of regions
Innovations Technological modernization
Investments
Minerals and raw materials complex
The nuclear industry
MONITORING OF KEY POLICIES:
Electric power industry
Tourist industry
3
Project management system
Programs ‘ monitoring
Project selection
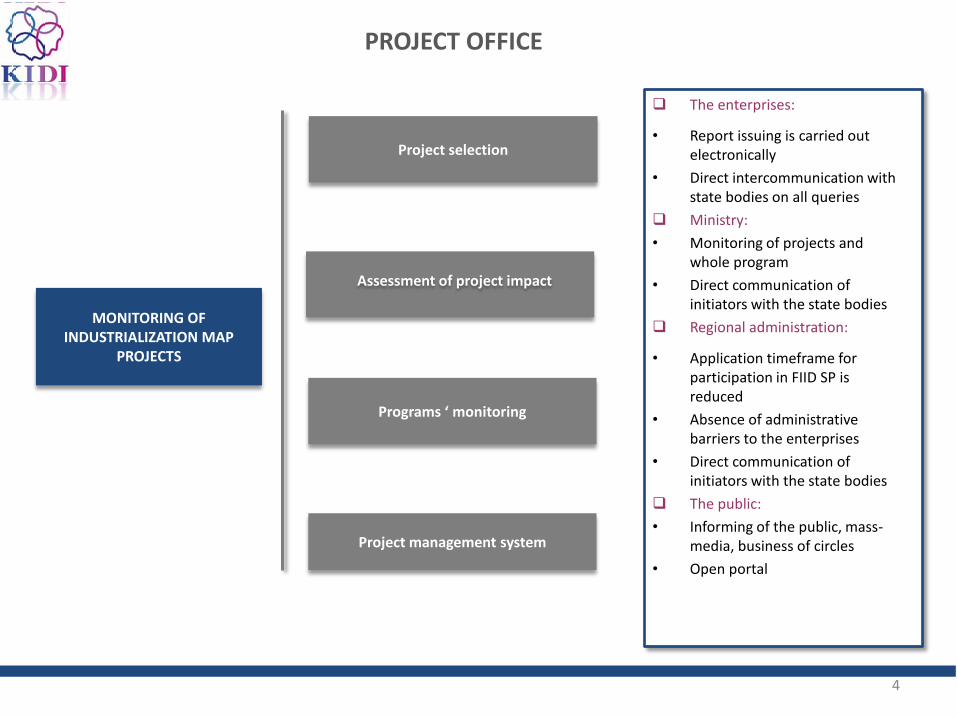
MONITORING OF INDUSTRIALIZATION MAP
PROJECTS
The enterprises:
• Report issuing is carried out electronically
• Direct intercommunication with state bodies on all queries
Ministry:
• Monitoring of projects and whole program
• Direct communication of initiators with the state bodies
Regional administration:
• Application timeframe for participation in FIID SP is reduced
• Absence of administrative barriers to the enterprises
• Direct communication of initiators with the state bodies
The public:
• Informing of the public, mass-media, business of circles
• Open portal
Assessment of project impact
PROJECT OFFICE
4
Mining and metallurgical complex sector
Machinery engineering sector
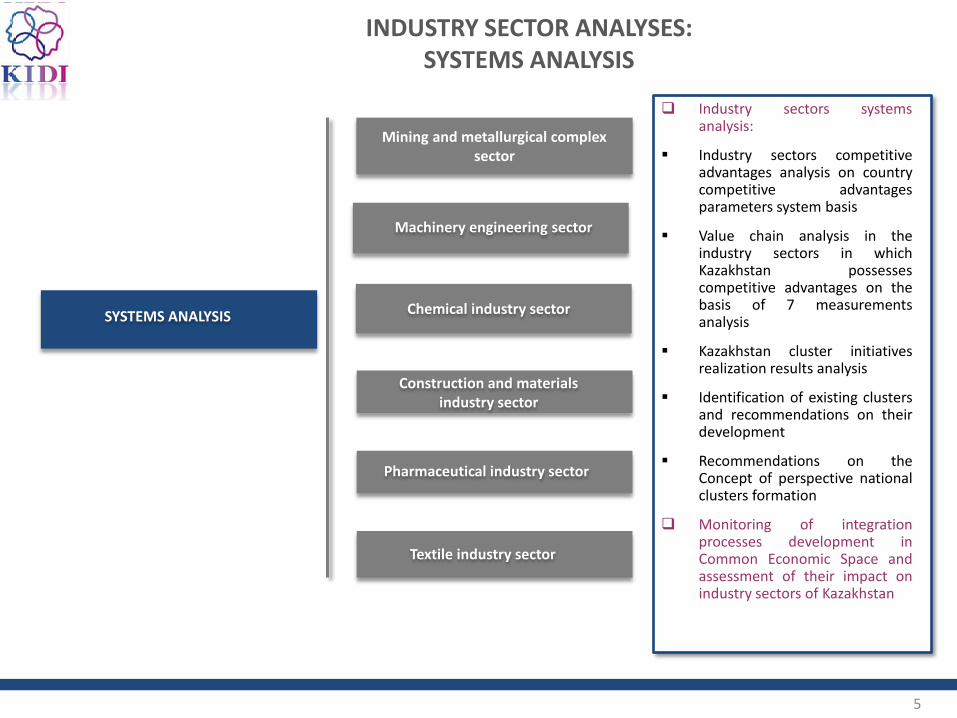
SYSTEMS ANALYSIS
Industry sectors systems analysis:
Industry sectors competitive advantages analysis on country competitive advantages parameters system basis
Value chain analysis in the industry sectors in which Kazakhstan possesses competitive advantages on the basis of 7 measurements analysis
Kazakhstan cluster initiatives realization results analysis
Identification of existing clusters and recommendations on their development
Recommendations on the Concept of perspective national clusters formation
Monitoring of integration processes development in Common Economic Space and assessment of their impact on industry sectors of Kazakhstan
INDUSTRY SECTOR ANALYSES: SYSTEMS ANALYSIS
Chemical industry sector
Construction and materials industry sector
Pharmaceutical industry sector
Textile industry sector
5

6
AN OUTLOOK: MACHINERY ENGINEERING SECTOR OF THE REPUBLIC OF KAZAKHSTAN
The development of manufacturing the machinery and equipment for mining sector
On the beginning of 2009 the volume of the proved stocks of oil according to BP made 39,6 billion barrels or 6,5 billions of tons that makes 3,2 % from world stocks. Now there are 493 deposits that are known, containing 1225 types of mineral raw materials. The volume of mining industry for 2012 according to operational data has made 10,2 trillion tenge
The development of manufacturing the machinery and equipment for agriculture
sector
The main areas of land resources of the country are located in the reserve land (46.7%) and agricultural land (32.6%) Agricultural lands occupy 222.6 million ha or 81.7%. Kazakhstan in 2012 exported 7,459 million of tons of wheat and meslin (a mixture of wheat and rye). In value terms, exports of wheat and meslin in 2012 amounted to 1.599 billion U.S. dollars. Kazakhstan is among the six in world grain exporters list
The development of the automobile components manufacturing
Production market volume for vehicles in 2012 amounted to more than U.S. $ 3 billion; By 2017 it is planned to go into series production capacity for 300 thousand cars per year At present, the production of automobile components in Kazakhstan is practically does not exist

7
AN OUTLOOK: MACHINERY ENGINEERING SECTOR OF THE REPUBLIC OF KAZAKHSTAN
The development of the power engineering machinery
The total installed capacity of power plants in Kazakhstan is 18 992.7 MW available capacity - 14 558.0
MW. Currently in Kazakhstan, 41% of the generation capacity of thermal power plants and 68% of generating capacity hydropower plants have worked for more than 30 years. By 2015, the projected production of electricity in the minimum and maximum scenario is 65-86 billion kWh
The development of the special purpose vehicles
(road construction)
Kazakhstan’s car park has about 5 million vehicles. (3.5 million cars and 1.5 million trucks). By 2015 it is planned to construct, reconstruct and repair about 12 thousand kilometers of roads of national significance, to reconstruct about 10 thousand km of local roads. The total length of railways is about 15,000 kilometers. More than 68% of the total turnover and more than 57% of passenger traffic of the country accounted by the railways
Mining and metallurgical complex sector
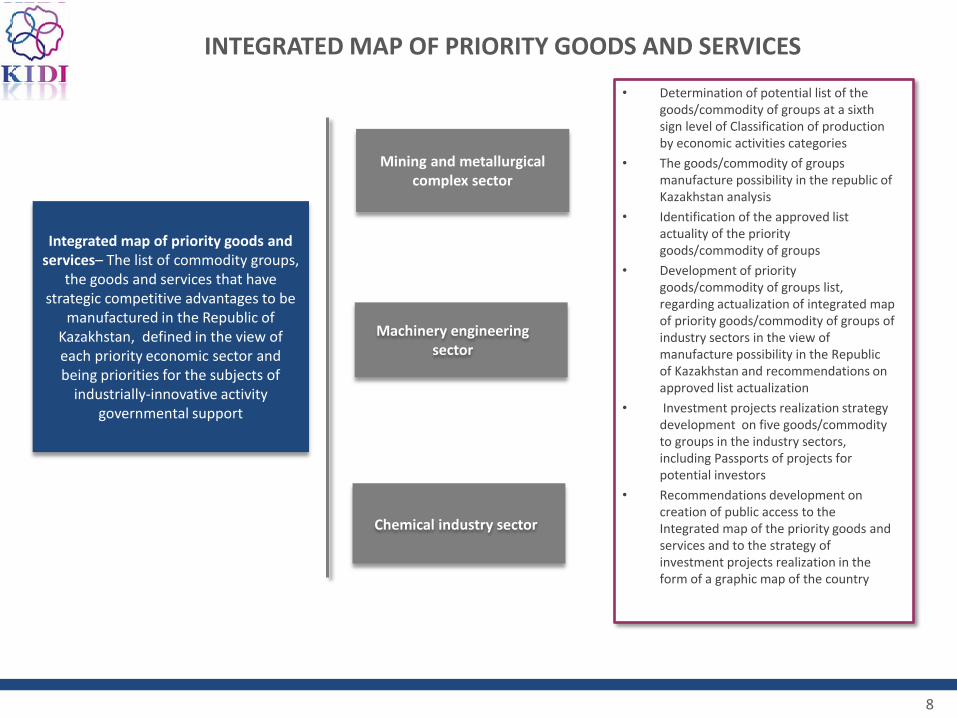
Integrated map of priority goods and services– The list of commodity groups,
the goods and services that have strategic competitive advantages to be
manufactured in the Republic of Kazakhstan, defined in the view of each priority economic sector and being priorities for the subjects of
industrially-innovative activity governmental support
Machinery engineering sector
• Determination of potential list of the goods/commodity of groups at a sixth sign level of Classification of production by economic activities categories
• The goods/commodity of groups manufacture possibility in the republic of Kazakhstan analysis
• Identification of the approved list actuality of the priority goods/commodity of groups
• Development of priority goods/commodity of groups list, regarding actualization of integrated map of priority goods/commodity of groups of industry sectors in the view of manufacture possibility in the Republic of Kazakhstan and recommendations on approved list actualization
• Investment projects realization strategy development on five goods/commodity to groups in the industry sectors, including Passports of projects for potential investors
• Recommendations development on creation of public access to the Integrated map of the priority goods and services and to the strategy of investment projects realization in the form of a graphic map of the country
8
Chemical industry sector
INTEGRATED MAP OF PRIORITY GOODS AND SERVICES

9
PRIORITY SEGMENTS OF MACHINE-BUILDING INDUSTRY (RoK)
I. Automotive components II. Machinery for AIC
III. Machinery for M&M and special equipment IV. Electrical machinery
1) Import of the RoK and 13 neighboring countries in 2012 (annual growth rate) 2) Market of the RoK, mln. $
43 bln. $ (+23%)
296
379
634
0
200
400
600
2010 2011 2012
Market of the RoK, mln. $ 3,7
bln. $ (+32%)
7 bln. $
(+29%)
CES 14 countries
Import of the RoK and 13 neighboring countries in 2012 (annual growth rate)
Thus, the wear is 80%: - harvesters – 71% - tractors – 93% - drills – 95%
297
2248
1893
2907
0
1000
2000
3000
2001 2002 2003 2004 2005 2006 2007 2008 2009 2010 2011 2012
114 bln. $ (+18%)
1) Import of the RoK and 13 neighboring countries in 2012 (annual growth rate) 2) Market of the RoK, mln. $
Market share of local manufacturers is 12%
1035 1087
1278
0
200
400
600
800
1000
1200
1400
2010 2011 2012
Market of the RoK, mln. $
Kazakhstan 1,2 bln. $
16%
CES 11 bln. $
28%
CIS 13 bln. $
27%
14 countries 23 bln. $
20%
Import, 2012
* Annual growth rate (2001-2012)
23
77 65 83
147
264
127
216
309
0
100
200
300
2010 2011 2012
Electrical and electronicequipment
Bodies, trailers andsemi-trailers
Other parts andaccessories (exceptengines)

MINING AND METTALURGICAL COMPLEX
10
The volume of MMC RK in volume and value terms
0
0,2
0,4
0,6
0,8
1
1,2
0,00
20,00
40,00
60,00
80,00
100,00
120,00
140,00
160,00
180,00
2004 2005 2006 2007 2008 2009 2010 2011
Bil
lion
ten
ge
mil
lion
ton
es
Mining of metal ores (tons) Iron and steel (tons) Production of non-ferrous metals (tons)
Mining of metal ores (price) Iron and steel (price) Production of non-ferrous metals (price)
Mineral deposit (unit) All objets
Stock on 01.01.2011 Production
volume in 2010
Backup objects
balance А+В+С1+С2 Off-balance
sheet
Number of
objects Inventory balance
Off-balance sheet
reserves
Gold (kg) 304 2240099,0 451623,0 45285,082 139 245196,6 119908,9
Copper (tonnes) 108 38822,9 10759,8 472,3 34 3567,0 1303,7
Chrome ore (tonnes) 21 378136,1 4262,9 3915,13 8 6344,0 510,0
Iron ore (tonnes) 63 18576080,5 12042473,4 46219,6 20 10453294,5 7905457,7
Manganese ore (tonnes) 36 642097,3 165788,9 3036,5 12 151965,6 11809,2
Molybdenum (tons) 46 1071466,1 982198,2 439,01 22 40098,8 402686,4
Titan (tonnes) 15 24066,3 2230,5 13,299 8 5574,7 1820,0
Nickel (tonnes) 42 2027,6 623,8 0 24 98,2 409,7
Zirconium (tonnes) 10 2157,7 414,2 3,4 6 1256,6 261,3
Inventory levels and production of major mineral resources of Kazakhstan
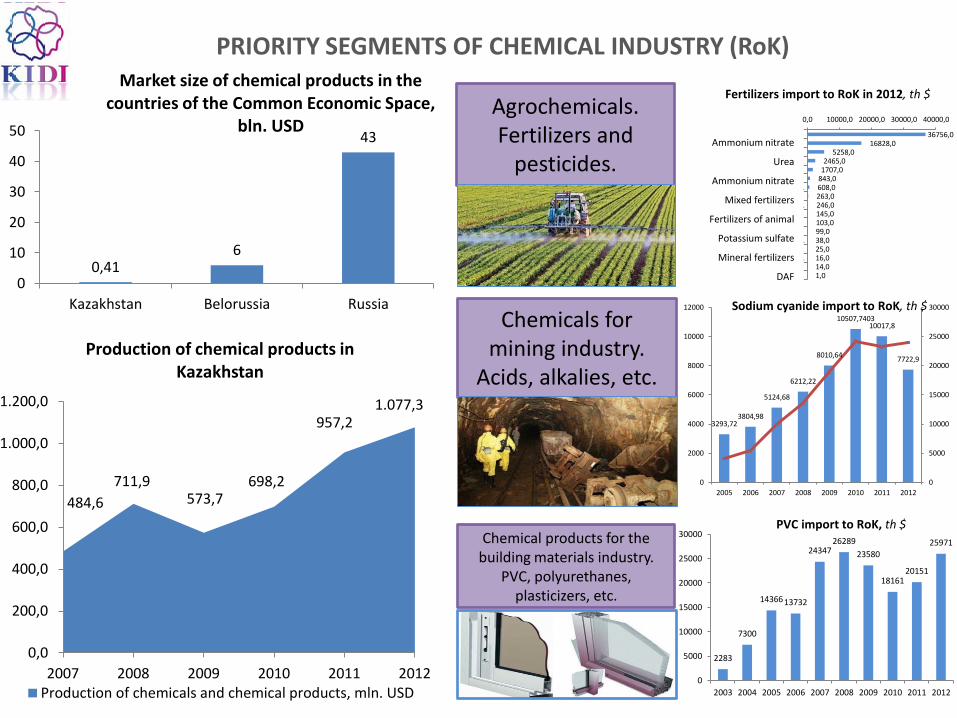
PRIORITY SEGMENTS OF CHEMICAL INDUSTRY (RoK)
Agrochemicals. Fertilizers and
pesticides.
Chemicals for mining industry.
Acids, alkalies, etc.
Chemical products for the building materials industry.
PVC, polyurethanes, plasticizers, etc.
36756,0 16828,0
5258,0 2465,0
1707,0 843,0 608,0 263,0 246,0 145,0 103,0 99,0 38,0 25,0 16,0 14,0 1,0
0,0 10000,0 20000,0 30000,0 40000,0
Аммиачная селитра
Карбамид
Нитрат натрия
Смешанные удобрения …
Удобрения животного …
Сульфат калия
Минеральные или …
Минеральные …
ДАФ
Fertilizers import to RoK in 2012, th $
3293,72 3804,98
5124,68
6212,22
8010,64
10507,7403 10017,8
7722,9
0
5000
10000
15000
20000
25000
30000
0
2000
4000
6000
8000
10000
12000
2005 2006 2007 2008 2009 2010 2011 2012
Sodium cyanide import to RoK, th $
2283
7300
14366 13732
24347 26289
23580
18161 20151
25971
0
5000
10000
15000
20000
25000
30000
2003 2004 2005 2006 2007 2008 2009 2010 2011 2012
PVC import to RoK, th $
0,41 6
43
0
10
20
30
40
50
Kazakhstan Belorussia Russia
Market size of chemical products in the countries of the Common Economic Space,
bln. USD
484,6
711,9 573,7
698,2
957,2 1.077,3
0,0
200,0
400,0
600,0
800,0
1.000,0
1.200,0
2007 2008 2009 2010 2011 2012
Production of chemical products in Kazakhstan
Production of chemicals and chemical products, mln. USD
Ammonium nitrate
Urea
Ammonium nitrate
Mixed fertilizers
Fertilizers of animal
Potassium sulfate
Mineral fertilizers
DAF

AGRICULTURE DEVELOPMENT
5.757 7.084 7.513
-
2.000
4.000
6.000
8.000
2010 2011 2012
Cattle breeding market volume, $ mln.
3.415
8.596
5.066
-
2.000
4.000
6.000
8.000
10.000
2010 2011 2012
Crop production market volume, $ mln.
In 2011 land under cultivation consisted of 21,2 million hectares, grain production – 27 million tons, grain export – 15 million tons.
Land under cultivation in 2012 consisted of 21,5 million hectares, that on 1,4% more than in 2011. Land under grain crops have increased concerning 2011 on 45,3 thousand hectares (on 1,0), under wheat were reduced on 359,5 thousand hectares.
In 2012 for crediting of subjects of agrarian and industrial complex from the Republican budget and other sources it was allocated 95,9 bln. tenge (=$ 640 mln.), including 80 bln. tenge (= $ 533 mln.)- the budgetary credit. As of December 31st, 2012 it was financed 65,1 bln. tenge (=$433 mln.), including by purchasing grains under the guarantee of socially-enterprise corporation (SPK) - 13,4 bln. tenge.
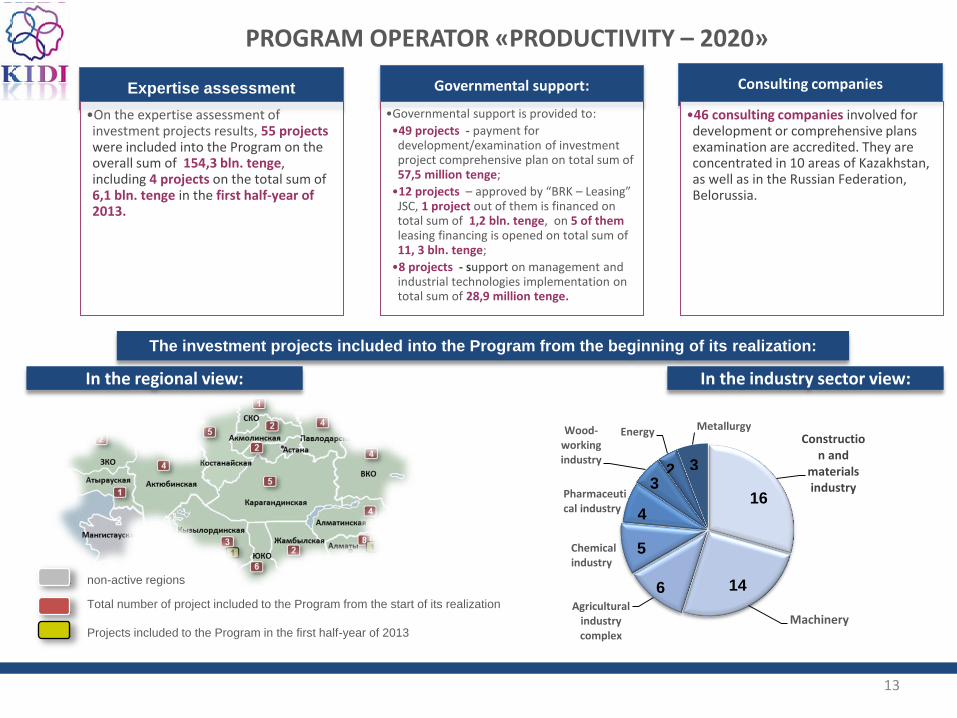
PROGRAM OPERATOR «PRODUCTIVITY – 2020»
non-active regions
Total number of project included to the Program from the start of its realization
Projects included to the Program in the first half-year of 2013
Construction and
materials industry
Machinery Agricultural
industry complex
Chemical industry
Pharmaceutical industry
Wood-working industry
Energy Metallurgy
16
14 6
5
4
3 2 3
In the regional view: In the industry sector view:
The investment projects included into the Program from the beginning of its realization:
Expertise assessment
•On the expertise assessment of investment projects results, 55 projects were included into the Program on the overall sum of 154,3 bln. tenge, including 4 projects on the total sum of 6,1 bln. tenge in the first half-year of 2013.
Governmental support:
•Governmental support is provided to:
•49 projects - payment for development/examination of investment project comprehensive plan on total sum of 57,5 million tenge;
•12 projects – approved by “BRK – Leasing” JSC, 1 project out of them is financed on total sum of 1,2 bln. tenge, on 5 of them leasing financing is opened on total sum of 11, 3 bln. tenge;
•8 projects - support on management and industrial technologies implementation on total sum of 28,9 million tenge.
Consulting companies
•46 consulting companies involved for development or comprehensive plans examination are accredited. They are concentrated in 10 areas of Kazakhstan, as well as in the Russian Federation, Belorussia.
13
• «Kazakhstan industry development institute» JSC is ready to become an information and analytical link on support of your companies entrance to Kazakhstan market.
14

OBRIGADO!
15