Kaggle Otto Challenge: How we achieved 85th out of 3,514 and what we learnt
42
Kaggle Otto Challenge How we achieved 85 th out of 3,514 and what we learnt Eugene Yan & Wang Weimin
-
Upload
eugene-yan-ziyou -
Category
Data & Analytics
-
view
11.800 -
download
0
Transcript of Kaggle Otto Challenge: How we achieved 85th out of 3,514 and what we learnt

Kaggle Otto ChallengeHow we achieved 85th out of 3,514 and what we learnt
Eugene Yan & Wang Weimin

Kaggle: A platform for predictive modeling competitions

Otto Production Classification Challenge: Classify products into 9 main product categories
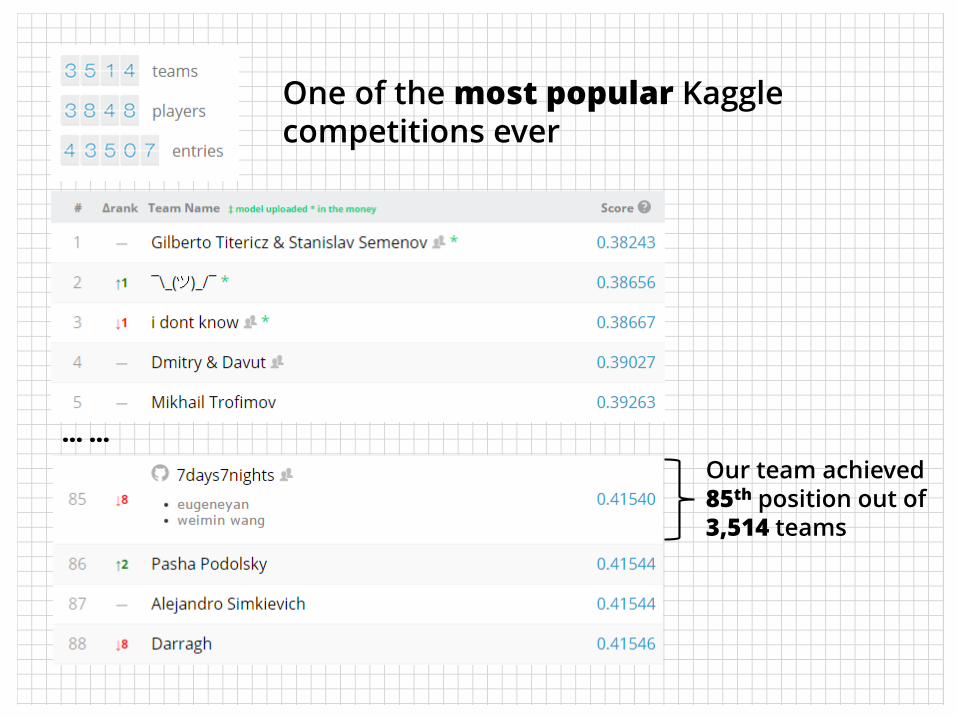
One of the most popular Kagglecompetitions ever
… …
Our team achieved 85th position out of 3,514 teams

… …
93 (obfuscated) numerical features provided
Target with 9categories
Let’s take a look at the data

Evaluation Metric: (minimize) multi-class log loss
𝑁 = no. of products in dataset (𝑀 = no. of class labels (i.e., 9 classes)𝑙𝑜𝑔 = natural logarithm𝑦𝑖𝑗 = 1 if observation 𝑖 is in class 𝑗 and 0 otherwise
𝑝𝑖𝑗 = predicted probability that observation 𝑖 belongs to class 𝑗
Minimizing multi-class log loss heavily penalizes falsely confident predictions

Validation (two main approaches)

Training set Holdout
Parameter tuning using 5 fold cross-
validationLocal
validation using
holdout
Train models on 80% train set and validate against 20% local holdout
Ensemble by fitting predictions from 80% train set on 20% local holdout
Reduces risk of overfitting leaderboard
Build model twice for submission– Once for local validation– Once for leaderboard submission
Parameter tuning and validation using 5 fold
cross-validation
Train models on full data set with 5-fold cross-validation
Build model once for submission
Low risk of overfitting if cv score is close to leaderboard score (i.e., training data similar to testing data)

Feature Engineering

Do we need all 93 features?
Can we reduce noise to reveal more of the signal?

Dimensionality reduction led nowhere: No clear ‘elbow’ from principal components analysis

L1 regularization (lasso) L2 regularization
Feature Selection via elastic net/lasso dropped four features, but led to significant drop in accuracy

The data looks is very skewed—should we make it more ‘normal’?
Would standardizing/ rescalingthe data help?

Feature Transformation: Surprisingly, transforming features helped with tree-based techniques
z-standardization: 𝑥 −𝑚𝑒𝑎𝑛(𝑥)
𝑠𝑡𝑎𝑛𝑑𝑎𝑟𝑑 𝑑𝑒𝑣𝑖𝑎𝑡𝑖𝑜𝑛 (𝑥)
Difference from Mean: 𝑥 − 𝑚𝑒𝑎𝑛 𝑥
Difference from Median: 𝑥 − 𝑚𝑒𝑑𝑖𝑎𝑛 𝑥
Log-transformation: 𝑙𝑜𝑔(𝑥 + 1)
Adding flags: 𝑖𝑓 𝑥 > 0, 𝑡ℎ𝑒𝑛 1, 𝑒𝑙𝑠𝑒 0
Improved tree-based models a bit
Worked better than z-standardization
Didn’t help (because most medians were 0)
Helped with Neural Networks
Terrible =/

Though models like GBM and Neural Nets can approximatedeep interactions, we can help find patterns and explicitly define: Complex features (e.g., week on
week increase) Interactions (e.g., ratios, sums,
differences)

Feature Creation: Aggregated features created by applying functions by row worked well
Row Sums of features
1 - 93
Row Variances
of features 1 - 93
Count of non-zero features (1 – 93)

Feature Creation: Top features selected from RF, GBM, and XGB to create interaction features; top interaction features helped a bit
+ interaction: feat_34 + feat_48, feat_34 + feat_60, etc- interaction: feat_34 - feat_48, feat_34 - feat_60, etc* interaction: feat_34 * feat_48, feat_34 * feat_60, etc/ interaction: feat_34 / feat_48, feat_34 / feat_60, etc
Top 20 features from randomForest’svariable importance

Tree-based Models

R’s caret: adding custom log loss metric
Custom summary function (log loss) for use with caret

Bagging random forests: leads to minor improvement
Single rf with 150 trees, 12 randomly sampled features (i.e., mtry), nodesize = 4
After bagging 10 rfs

gbm + caret: better than rf for this dataset
GBMParams
Depth = 10 Trees = 350 Shrinkage = 0.02
Depth = 10 Trees = 1000 Shrinkage = 0.01 Node.size = 4 Bag.frac* = 0.8
Depth = 10 Trees = 1000 Shrinkage = 0.01 Node.size = 4 Bag.frac* = 0.8 + aggregated
features
Local Validation
0.52449 0.51109 0.49964
Improvement as shrinkage , no. of trees , and aggregated features are included
*Bag Fraction: fraction of training set randomly selected to build the next tree in gbm. Introduces randomness and helps reduce variance

XGBoost (extreme gradient boosting): better and fasterthan gbm; one of two main models in ensemble
xgbParams
Depth = 10 Trees = 250 Shrinkage = 0.1 Gamma = 1 Node.size = 4 Col.sample = 0.8 Row.sample = 0.9
Depth = 10 Trees = 7500 Shrinkage = 0.005 Gamma = 1 Node.size = 4 Col.sample = 0.8 Row.sample = 0.9 Original features
+ aggregated features
Depth = 10 Trees = 7500 Shrinkage = 0.005 Gamma = 0.5 Node.size = 4 Col.sample = 0.8 Row.sample = 0.9 Original features
only (difference from mean)
LocalValidation
0.46278 0.45173 0.44898
Improvement as shrinkage , no. of treesFeature creation and transformation helped too
Neural Networks

Nolearn + Lasagna: a simple two-layer network with dropout works great
0.15 dropout
1000 hidden units, 0.3 dropout
500 hidden units, 0.3 dropout
Neural Net Params
Activation: Rectifier
Output: Softmax
Batch size: 256
Epochs: 140
Exponentially decreasing learning rate
InputHidden Layer 1
Hidden Layer 2 Output

Tuning Neural Network hyper-parameters:
Use validation data to tune: – Layers, dropout, L2, batch size, etc
Start with a single network (say 93 x 100 x 50 x 9)
Using less data to get faster response
Early stopping
– No-improvement-in-10, 5, 3 …
– Visualize loss v.s. epochs in a graph
Use GPU
Lo
g L
oss
Epochs
Lo
g L
oss
Epochs

Bagging NNs: leads to significant improvement
Single Neural Net
Bag of 10 Neural Nets
Bag of 50 Neural Nets
Neural nets are somewhat unstable—bagging reducesvariance and improve LB score

So many ideas, so little time: Bagging + Stacking
Randomly sample from training data (with replacement) – BAG
Train base model on OOB, and predict on BAG data
Boost the BAG data with meta model
1234567
Training data4363354
127
Bootstrap sample (BAG)
OOB data
1.sample Xgboost(meta)
RF(base)
Test Data
Done!

So many ideas, so little time: TSNE
tsn
e1
tsne2
Tsne1-1223.2-3.23.3
2.21.110.23.111
Tsne23.310-3.22.31.0
210.33-1.1122

Ensemble our models

Wisdom of the Crowd: combining multiple models leads to significant improvement in performance
Different classifiers make up for each other’s weaknesses

Ensemble: how do we combine to minimize log loss over multiple models?
Create predictions using best classifiers
on training set
Find best weights for combining the classifiers by minimizing log loss on holdout set
Our approach:– Append various predictions– Minimize overall log loss using
scipy.optimize.minimize
Competition Metric: the goal is to minimize log loss
– How to do this over multiple models?
– Voting? Averaging?

Ensemble: great improvement over best individual models, though we shouldn’t throw in everything
XGBoost(0.43528)
Bag of 50 NNs(0.43023)
Ensemble(0.41540)
(0.45 × ) + (0.55 × ) =
415th position on leaderboard
350th position on leaderboard
85th position on leaderboard
Our final ensemble
0.445 × XGBoost
0.545 × =Bag of 110 NNs
0.01 × Bag of 10 RFs
Ensemble(0.41542)
+
+
Another ensemble we tried:Sometimes, more ≠ better!

Ideas we didn’t have time to implement
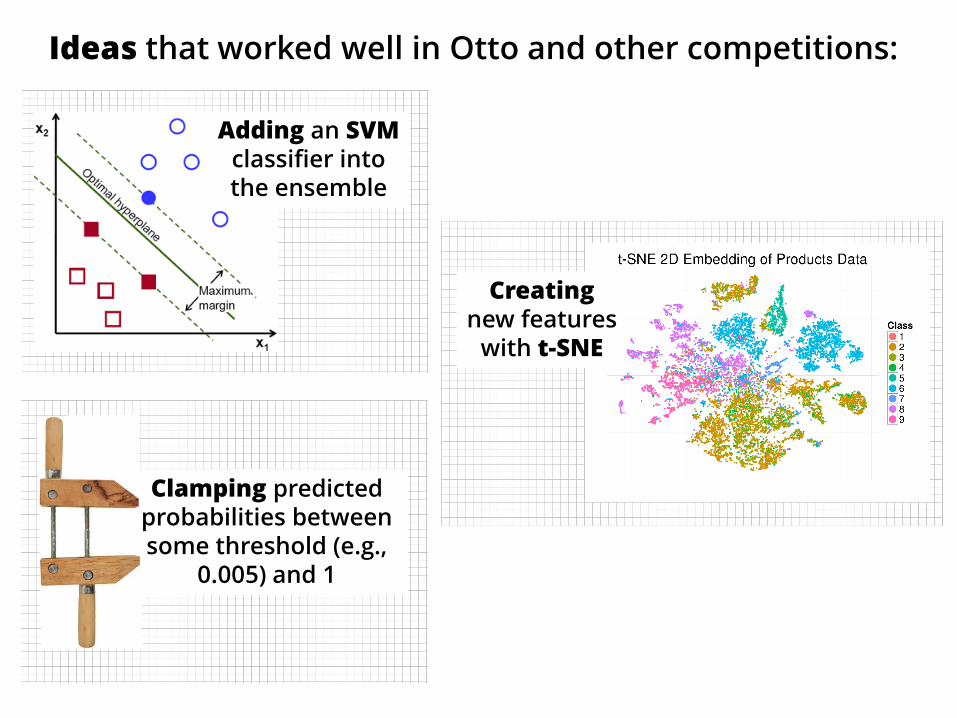
Ideas that worked well in Otto and other competitions:
Clamping predicted probabilities between some threshold (e.g.,
0.005) and 1
Adding an SVMclassifier into the ensemble
Creatingnew features
with t-SNE

Top Solutions

5th place
https://www.kaggle.com/c/otto-group-product-classification-challenge/forums/t/14297/share-your-models/79677#post79677
Use TF-IDF to transform raw features Create new features by fitting models on raw and TF-IDF features Combine created features with original features Bag XGBoost and 2-layer NN 30 times and average predictions

2nd place
http://blog.kaggle.com/2015/06/09/otto-product-classification-winners-interview-2nd-place-alexander-guschin/
Level 0: Split the data into two groups, Raw and TF-IDF Level 1: Create metafeature using different models
– Split data into k folds, training k models on k-1 parts and predict on the 1 part left aside for each k-1 group
Level 2: Train metaclassifier with features and metafeatures and average/ensemble

1st place
https://www.kaggle.com/c/otto-group-product-classification-challenge/forums/t/14335/1st-place-winner-solution-gilberto-titericz-stanislav-semenov

What’s a suggested framework for Kaggle?

Suggested framework for Kaggle competitions:
Understand the problem, metric, and data
Create a reliable validation process that resembles leaderboard
– Use early submissions for this
– Avoid over fitting!
Understand how linear and non-linear models work on the problem
Try many different approaches/model and do the following
– Transform data (rescale, normalize, pca, etc)
– Feature selection/creation
– Tune parameters
– If large disparity between local validation and leaderboard, reassess validation process
Ensemble
Largely adopted from KazAnova: http://blog.kaggle.com/2015/05/07/profiling-top-kagglers-kazanovacurrently-2-in-the-world/
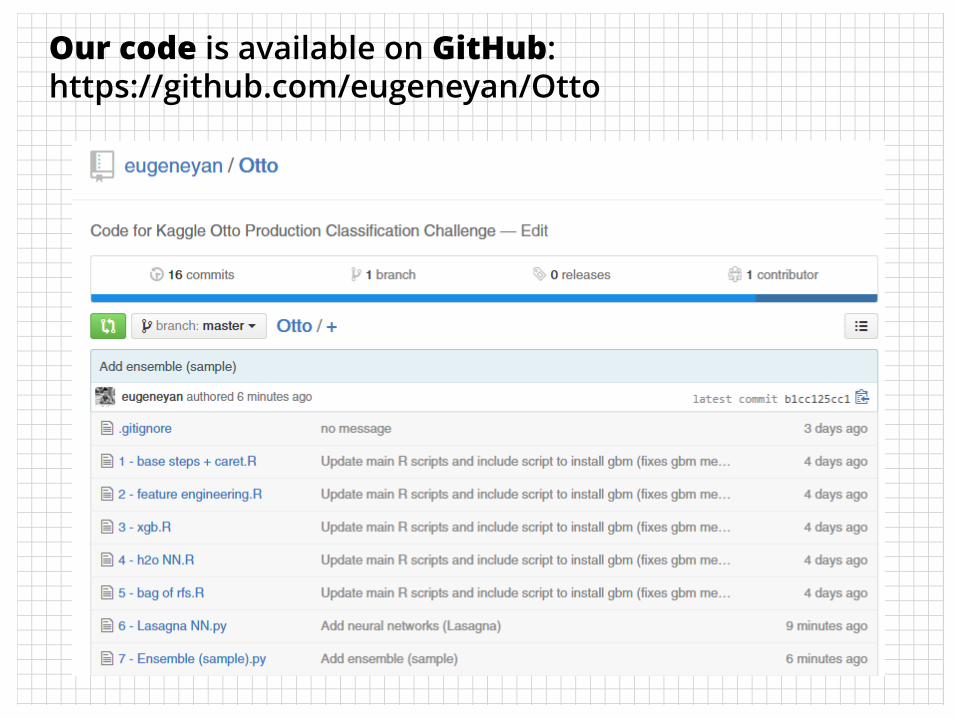
Our code is available on GitHub: https://github.com/eugeneyan/Otto