June IJPSS Volume 2, Issue 6 ISSN: 2249-5894
31
IJPSS Volume 2, Issue 6 ISSN: 2249-5894 _________________________________________________________ A Monthly Double-Blind Peer Reviewed Refereed Open Access International e-Journal - Included in the International Serial Directories Indexed & Listed at: Ulrich's Periodicals Directory ©, U.S.A., Open J-Gage, India as well as in Cabell’s Directories of Publishing Opportunities, U.S.A. International Journal of Physical and Social Sciences http://www.ijmra.us 207 June 2012 Cost of electricity load shedding to Mines in Zimbabwe: Direct Assessment Approach Nyasha Kaseke* Stephen Hosking** __________________________________________________________ ABSTRACT: Zimbabwe’s mining sector has been hit hard by electricity load shedding from the power utility. Load shedding was seen as a solution to the inability of power utility to supply electricity to meet demand. Electricity supply problems has so many cause and some of which are; inability to expand generation capacity, aging equipment, droughts, cost coal supply to thermal plants, vandalism and political disturbances. Mines flooded as a result poor pumping of water outside the tunnels and mine shafts, and also lost productive hours of production. The researchers applied the direct assessment approach to estimate the cost of load shedding. A survey method was adopted for the mines as they are scattered. A questionnaire was opted as a research instrument and was administered face to face to mine captains. The results revealed that low capacity mines incurred higher load shedding cost compared to high capacity mines. It is also seen that high valued mineral mines (gold, diamond and platinum mines) incurred high outage cost as compared to low valued mineral mines (vermiculite, graphite and phosphate). From the study it can be concluded that electricity load shedding resulted in high cost to mining sector in Zimbabwe. It is recommended that the power utility should increase power supply to minimise the load shedding and cost of load shedding. KEY WORDS: Load shedding, electricity supply problems, mining sector, expand generation capacity, cost of load shedding, direct assessment approach. * PhD Student- Nelson Mandela Metropolitan University- Department of Economics and Economic History. ** Lecturer- Nelson Mandela Metropolitan University- Department of Economics and Economic History.
Transcript of June IJPSS Volume 2, Issue 6 ISSN: 2249-5894

IJPSS Volume 2, Issue 6 ISSN: 2249-5894 _________________________________________________________
A Monthly Double-Blind Peer Reviewed Refereed Open Access International e-Journal - Included in the International Serial Directories Indexed & Listed at: Ulrich's Periodicals Directory ©, U.S.A., Open J-Gage, India as well as in Cabell’s Directories of Publishing Opportunities, U.S.A.
International Journal of Physical and Social Sciences http://www.ijmra.us
207
June 2012
Cost of electricity load shedding to Mines in
Zimbabwe: Direct Assessment Approach
Nyasha Kaseke*
Stephen Hosking**
__________________________________________________________
ABSTRACT:
Zimbabwe’s mining sector has been hit hard by electricity load shedding from the power utility. Load
shedding was seen as a solution to the inability of power utility to supply electricity to meet demand.
Electricity supply problems has so many cause and some of which are; inability to expand generation
capacity, aging equipment, droughts, cost coal supply to thermal plants, vandalism and political
disturbances. Mines flooded as a result poor pumping of water outside the tunnels and mine shafts, and
also lost productive hours of production. The researchers applied the direct assessment approach to
estimate the cost of load shedding. A survey method was adopted for the mines as they are scattered. A
questionnaire was opted as a research instrument and was administered face to face to mine captains. The
results revealed that low capacity mines incurred higher load shedding cost compared to high capacity
mines. It is also seen that high valued mineral mines (gold, diamond and platinum mines) incurred high
outage cost as compared to low valued mineral mines (vermiculite, graphite and phosphate). From the
study it can be concluded that electricity load shedding resulted in high cost to mining sector in
Zimbabwe. It is recommended that the power utility should increase power supply to minimise the load
shedding and cost of load shedding.
KEY WORDS: Load shedding, electricity supply problems, mining sector, expand generation capacity,
cost of load shedding, direct assessment approach.
* PhD Student- Nelson Mandela Metropolitan University- Department of Economics and Economic
History.
** Lecturer- Nelson Mandela Metropolitan University- Department of Economics and Economic History.

IJPSS Volume 2, Issue 6 ISSN: 2249-5894 _________________________________________________________
A Monthly Double-Blind Peer Reviewed Refereed Open Access International e-Journal - Included in the International Serial Directories Indexed & Listed at: Ulrich's Periodicals Directory ©, U.S.A., Open J-Gage, India as well as in Cabell’s Directories of Publishing Opportunities, U.S.A.
International Journal of Physical and Social Sciences http://www.ijmra.us
208
June 2012
1. INTRODUCTION:
Zimbabwe’s Mining sector has been recovering from the plunging time of hyperinflation and
low world prices. Zimbabwe has not been able to solve the electricity crisis problem. Zimbabwe
is endowed with mineral wealth, which has been unsuccessfully exploited for economic
development of the country (Confederation of Zimbabwe Industries (CZI) 2009). The range of
minerals includes gold, coal, nickel, platinum, diamond, chrome and cobalt, and others. Gold,
diamonds and platinum are notably Zimbabwe’s foreign currency cash cows. However, the
exploitation of these minerals has been hampered by persistent electricity load shedding.
Mining takes the third position in terms of GDP contribution at about 12.7 percent and is the
second foreign currency earner (ZIMSTATS 2009).This significant contribution to GDP and
economic activities of the economy explains why mining is a highly regulated sector. The
growth in the mining sector has been driven by the key sub-sectors, including platinum group
metals (24%), gold (77%), chrome (147%) and coal (40%) from the previous year - 2008
(Chamber of Mines of Zimbabwe 2010). The diamond sector is expected to become a significant
contributor going forward if the disputes with KPCS are sorted out (Chamber of Mines of
Zimbabwe 2010).
The key legislation governing this sector is the Mines and Minerals Act (Chapter 21:05), the
Minerals Marketing Corporation of Zimbabwe Act (Chapter 21:04) and the Chamber of Mines of
Zimbabwe. The said legislation provide for the licensing, exploration and marketing of minerals
in Zimbabwe.
Zimbabwean government acknowledges the importance of the mining sector to the socio-
economic development of the country. Currently, the sector employs on average, 55000 people
formally per annum (ZIMSTATS 2009; CZI 2009 and Chamber of Mines of Zimbabwe, 2010).
The figure has been higher than this before but due to downturn of global market prices, world
recession and other problems domestically such as political environment and power outages; the
sector is not spared but to cut employment (CZI 2009). Mining is particularly susceptible to
power quality issues (Bert et al. 2006). Many mine sites are remotely located with respect to grid
feeder lines (Ministry of Mines 2009). Therefore, they have their direct connection using own
transformers (ZESA 2009). This makes it easier to treat mines independently.

IJPSS Volume 2, Issue 6 ISSN: 2249-5894 _________________________________________________________
A Monthly Double-Blind Peer Reviewed Refereed Open Access International e-Journal - Included in the International Serial Directories Indexed & Listed at: Ulrich's Periodicals Directory ©, U.S.A., Open J-Gage, India as well as in Cabell’s Directories of Publishing Opportunities, U.S.A.
International Journal of Physical and Social Sciences http://www.ijmra.us
209
June 2012
The objective of the study is to estimate cost of load shedding to the mining sector in Zimbabwe.
Electricity is demanded greatly for mining operations. Continuous load shedding make lives of
mining labourers to be on danger. The researchers proposed a survey framework to elicit cost of
outages. The study is organised as follows: background of the study, literature review,
methodology, survey administration, analysis of data and presentation, conclusion and
recommendations.
2. BACKGROUND:
2. 1 The Zimbabwean Problem
Power shortages in Zimbabwe are not a problem for mines only but for the whole nation. The
source of this problem is known to all and sundry.
The unprecedented meltdown of Zimbabwe’s economy can easily be traced to self-engineered
political instability by the present government. Subsequently, the roots of political instability
further led to economic mismanagement and corruption in the economy. When in November
1997 it was announced that war veterans were to be given unbudgeted payments of magnitude
which threatened fiscal targets, external investors bolted out of the Zimbabwe Stock Exchange
and domestic market foresaw an imminent devaluation the Zimbabwe dollar crashed by almost a
fourth of its value in local currency terms and it has been sliding by the day since that time. This
proved to be the start of real crisis of management of the economy.
By the end ofe 1999 the Zimbabwe economy was already in a severe macroeconomic crisis:
GDP had fallen to below two percent, inflation had average 58.5 percent and exports had
stagnated, forcing sharp contraction of imports. The government pursued a political agenda
instead of formulating an agenda to tackle this downward tumble which further impacted
negatively on the economy.
From February 2000 the government of Zimbabwe voluntarily abrogated the rule of law by
allowing farm invasions, political harassment and murders. The underlying causes of
Zimbabwe’s economic crisis had started, with its political roots embedded in two main factors:
Economic activity disruptions as a result of state-sponsored lawlessness; and
IJPSS Volume 2, Issue 6 ISSN: 2249-5894 _________________________________________________________
A Monthly Double-Blind Peer Reviewed Refereed Open Access International e-Journal - Included in the International Serial Directories Indexed & Listed at: Ulrich's Periodicals Directory ©, U.S.A., Open J-Gage, India as well as in Cabell’s Directories of Publishing Opportunities, U.S.A.
International Journal of Physical and Social Sciences http://www.ijmra.us
210
June 2012
Brushing aside decisions of the law courts by the sitting government.
This clearly undermined business confidence, affected current output and decimated investment,
causing fuel shortages, accumulation of arrears in international payments and an increase in the
budget deficit.
The government has refused to acknowledge the importance of the environment under which
economic progress takes place, and that any improvement of macroeconomic management,
investments, liberalization of markets and trade and widening of the space for the private sector
activity have to be invariably underpinned by good governance and civic peace
Thus from 1997 the one party government adopted a total irresponsible politically driven
economic management system that finally culminated in the 2000 illegal farm invasions and
violent disruptions of economic activities that have proved that such venality leads to
unsustainable and irretrievable economic downfall of the economy.
Zimbabwe is now being ostracized by her major traditional trading partners. While there are no
explicit measures that are being imposed by regional partners the Southern Africa Development
Community (SADC), The common Market for East and Southern Africa (COMESA) and the
African Union (AU) Zimbabwe has been effectively isolated from many international regional
pacts currently enjoyed by other countries in the region. Poor governance and political instability
affected domestic electricity production and electricity import facilities. Zimbabwe was cut from
the Southern African Power Pool (SAPP) grid due to non-payment and problems within other
members of the group.
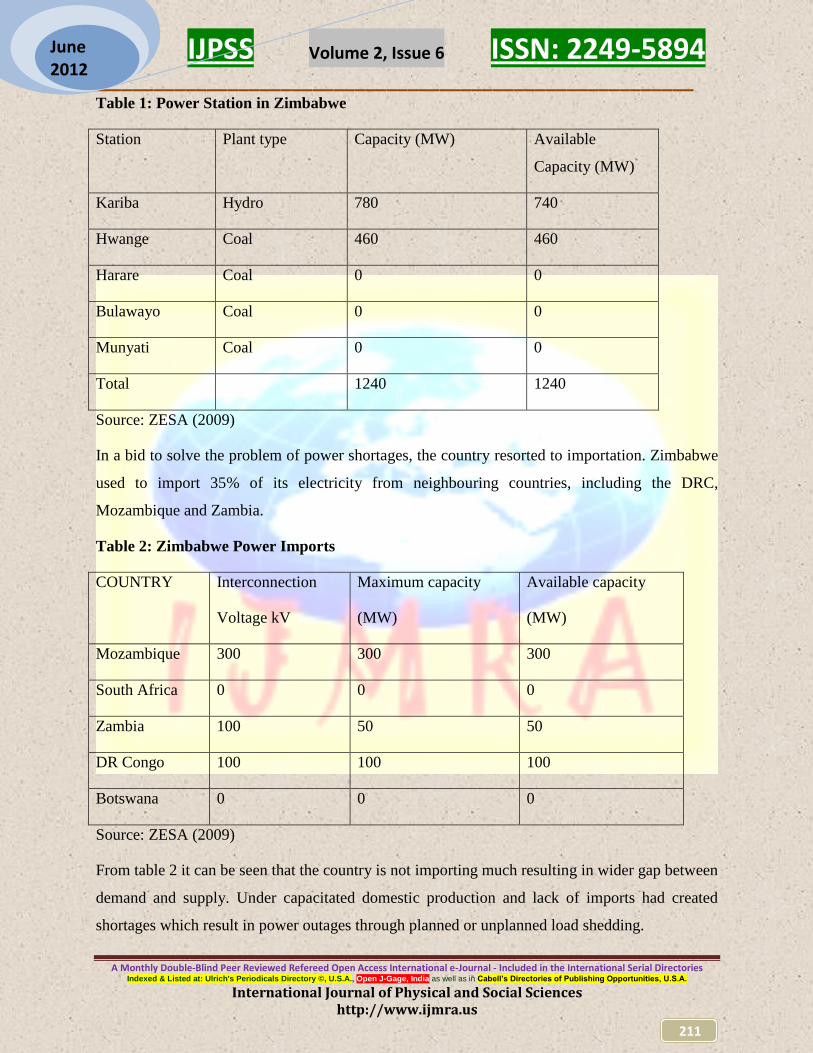
2.2 Electricity sources in Zimbabwe
ZESA Holdings is the nucleus of the generation, transmission and distribution of electricity in
Zimbabwe. Zimbabwe has five major power stations, with a total capacity of 1240 MW (ZESA
2007). These facilities do not meet electricity demand. Electricity generation in Zimbabwe is
mainly from coal and hydro plants, with a capacity of 1240 MW, while the Kariba hydropower
plant generates 780 MW as shown in table 1 (ZESA 2009).
IJPSS Volume 2, Issue 6 ISSN: 2249-5894 _________________________________________________________
A Monthly Double-Blind Peer Reviewed Refereed Open Access International e-Journal - Included in the International Serial Directories Indexed & Listed at: Ulrich's Periodicals Directory ©, U.S.A., Open J-Gage, India as well as in Cabell’s Directories of Publishing Opportunities, U.S.A.
International Journal of Physical and Social Sciences http://www.ijmra.us
211
June 2012
Table 1: Power Station in Zimbabwe
Station Plant type Capacity (MW) Available
Capacity (MW)
Kariba Hydro 780 740
Hwange Coal 460 460
Harare Coal 0 0
Bulawayo Coal 0 0
Munyati Coal 0 0
Total 1240 1240
Source: ZESA (2009)
In a bid to solve the problem of power shortages, the country resorted to importation. Zimbabwe
used to import 35% of its electricity from neighbouring countries, including the DRC,
Mozambique and Zambia.
Table 2: Zimbabwe Power Imports
COUNTRY Interconnection
Voltage kV
Maximum capacity
(MW)
Available capacity
(MW)
Mozambique 300 300 300
South Africa 0 0 0
Zambia 100 50 50
DR Congo 100 100 100
Botswana 0 0 0
Source: ZESA (2009)
From table 2 it can be seen that the country is not importing much resulting in wider gap between
demand and supply. Under capacitated domestic production and lack of imports had created
shortages which result in power outages through planned or unplanned load shedding.
IJPSS Volume 2, Issue 6 ISSN: 2249-5894 _________________________________________________________
A Monthly Double-Blind Peer Reviewed Refereed Open Access International e-Journal - Included in the International Serial Directories Indexed & Listed at: Ulrich's Periodicals Directory ©, U.S.A., Open J-Gage, India as well as in Cabell’s Directories of Publishing Opportunities, U.S.A.
International Journal of Physical and Social Sciences http://www.ijmra.us
212
June 2012
2.3 Load Shedding
Load shedding started as early as 1997 (Kayo 2001). Generation plant availability started to
decline. Total systems losses have averaged 11% in 1997 (ZESA 2007). The Zimbabwean dollar
started depreciating against major currencies. Since over 70% of ZESA are imports of foreign
currency related, proper plant, transmission and distribution equipment maintenance was
impossible (ZESA 2006). Consequently, ZESA was exposed to foreign exchange fluctuations
and also was ill-equipped to manage this risk because of government controls on pricing and the
end result was that the tariff had been eroded by the fluctuations (Kayo 2001). ZESA relied
much on government support financially to manage the situation at the least minimum load
shedding to the consumers. ZESA’s costs of operations have increased considerably, particularly
those related to payment for import of power in foreign currency and servicing of foreign debt
(ZESA 2006).
Serious electricity load shedding started in 2000 soon after the land reform program in
Zimbabwe (Kayo 2001). The country was starved of foreign currency required to meet
importation of fuel and electricity (Ministry of Energy and Power Development 2005). Foreign
suppliers demanded advance payment before electricity is supplied. Foreign currency crisis
incapacitated importation of spare parts for plant maintenance. Cost of transporting coal from
Hwange (coal mine) to Bulawayo, Munyati and Harare Thermal Power Stations (TPSs) and high
maintenance cost to these TPSs resulted in decommissioning of the three TPSs. The TPSs used
to contribute (Bulawayo 370MW, Harare 200MW and Munyati 100MW) to the grid (ZESA
2006).
Decommissioning of TPSs worsened the supply of electricity in 2005 when total generation falls
below 50% due to 2005/2006 drought (Ministry of Energy and Power Development 2005). The
supply was constrained whereas demand was growing high from growth in urban households,
rural and growth point electrification (ZESA 2007). In 2006, Zimbabwe was blackmailed for
political reasons, suffered foreign currency deficits, tight economic sanctions, hyper-inflation,
coal mine squabbles and high brain drain which further worsens power generation problems
(ZESA 2006).
Even though Zimbabwe is well networked in the Southern Africa, pressure amounted to foreign
suppliers specifically South Africa due to its high domestic demand, Zimbabwe was

IJPSS Volume 2, Issue 6 ISSN: 2249-5894 _________________________________________________________
A Monthly Double-Blind Peer Reviewed Refereed Open Access International e-Journal - Included in the International Serial Directories Indexed & Listed at: Ulrich's Periodicals Directory ©, U.S.A., Open J-Gage, India as well as in Cabell’s Directories of Publishing Opportunities, U.S.A.
International Journal of Physical and Social Sciences http://www.ijmra.us
213
June 2012
disconnected from ESKOM supplies in 2007 (ZESA 2007). The problem is threatening the
whole region; Zambia is also experiencing the power cuts. Imports from Zambia, Democratic
Republic of Congo and Mozambique were cut due to payment problems. ESKOM has converted
the debt of electricity to a loan in order to cover its expenses (ZESA 2007). Zimbabwe has to
depend solely from its on domestic generation and the guaranteed 100MW from Mozambique.
Zimbabwe faced transmission, distribution and supply infrastructural problems and the west in
2007 due to vandalism. The Electricity Amendment Bill (Number 17) of 2007 stated that
vandalism is becoming worse and stiffer penalties need to be implemented to those caught on the
wrong side of the law. ZESA technicians and engineers also blamed the poor quality
transformers and related equipment being acquired (ZESA 2009). The performance of these
equipment resulted in high levels of network electricity losses of 17% in 2009. Maintenance was
and is still a big issue in ZESA, qualified engineers, artisans and technicians are leaving for
neighbouring countries, with the highest loss in 2007 of eighty (80) engineers and artisans
(ZESA 2008).
The generation of electricity in 2009 was at 55% of the potential capacity (ZPC 2009). To meet
local demand the rest had to be imported (ZESA 2009). Total electricity supply fell well below
demand. To manage the load, the power utility provider resorted to planned and unplanned load
shedding. The supply of electricity in Zimbabwe depends on weather conditions because the
latter affects water levels for electricity generation at the Kariba Hydro Power Station (HPS) and
reliability of coal supply to Hwange thermal power station (TPS). The latter consumes about 6
000 to 9 000 tonnes of coal per day (ZESA 2009).
Due to predictability of peak demand per day and shortages of electricity supply to meet demand,
ZESA drafted a load shedding programme for its customer sectors showing the times they would
be cut off from power supply (Table 3). The load shedding time table shows the times that
consumers would be shed off from the national grid supply.

IJPSS Volume 2, Issue 6 ISSN: 2249-5894 _________________________________________________________
A Monthly Double-Blind Peer Reviewed Refereed Open Access International e-Journal - Included in the International Serial Directories Indexed & Listed at: Ulrich's Periodicals Directory ©, U.S.A., Open J-Gage, India as well as in Cabell’s Directories of Publishing Opportunities, U.S.A.
International Journal of Physical and Social Sciences http://www.ijmra.us
214
June 2012
Table 3: Load shedding program for 2009 and beyond
Customer category
PERIOD
Morning Time
(0400-1030
hrs)
During The
Day (1030-
1700hrs)
Evening
Times (1700-
2100hrs)
Night Time
(2100-
0400hrs)
Industrial and
mining (24 hour)
ON (reduced
demand by
50%)
ON ON (reduced
demand by
50%)
ON
Industrial-12 hour OFF ON OFF OFF
Commercial (CBD) OFF ON OFF ON
Agricultural OFF ON/OFF OFF ON
Domestic: Urban ON ON/OFF ON ON
Domestic: Rural OFF ON/OFF OFF ON
Notes: 1. Load shedding applies to all areas in the country; 2. The programme applies for all
days of the week; 3.Essential services (water works, sewers, hospitals and CBD of Harare and
Bulawayo) will not be load shed; 4. Business customers on residential feeders follow domestic
time table; 5. Growth points and small towns follow rural timetable; 6. Industrial customers to be
switched off if they do not reduce demand during off peak.
Source: ZESA (2009)
3. LITERATURE REVIEW:
The electricity outages (load shedding) have attracted interest from various scholars over the last
three decades (Ukpong 1973; Ontario Hydro 1980; Bernstein & Heganazy 1988; Lee & Anas
1992; Tierney 1997; Beenstock et al. 1998; Primen 2001; Rose & Lim 2002; Eto, Divan &
IJPSS Volume 2, Issue 6 ISSN: 2249-5894 _________________________________________________________
A Monthly Double-Blind Peer Reviewed Refereed Open Access International e-Journal - Included in the International Serial Directories Indexed & Listed at: Ulrich's Periodicals Directory ©, U.S.A., Open J-Gage, India as well as in Cabell’s Directories of Publishing Opportunities, U.S.A.
International Journal of Physical and Social Sciences http://www.ijmra.us
215
June 2012
Brumsickle 2004; Eto et al. 2001; Rose et al. 2004; Adenikinju 2005; Bose, Shukla, Srivastava
& Yaron 2006). The general conclusion has been that power outages cause significant direct and
indirect costs. Empirical evidence links the scale of these costs to variables such as electricity
consumption per capita and the number of hours with/without electricity per day. Load shedding
is an organised form of electricity outages (Eto, Divan & Brumsickle 2004).
Improved energy supply reliability after the 1950s coincided with rising global economic growth
(World Bank 2004:72). This chapter surveys the global and African literature relevant to
electricity outages. Energy is a prerequisite for economic growth and development (Ebohon
1996; Rosenberg, 1998; Templet 1999; Boston Institute for Development Economics 2006;
Foster & Steinbuks 2008; Calderon 2008). Energy has been shown to be equally as important in
production as other factors such as labour, land and capital (European Commission, 1993). The
relationship between economic growth and electrical power demand has been found to be close
(European Commission 1993; Rosenbergy 1998; Andrews-Speed and Dow, 2000; Ferguson,
Wilkinson & Hill 2000). Energy consumption is positively correlated to economic growth
(Akinlo 2008).
A study by Ferguson et al. (2000) that compared correlations between electricity
consumption/capita with those between total primary energy supply/capita and GDP per capita
showed that there is a stronger correlation between electricity use and wealth creation than there
is between total energy use and wealth. The study also shows that in wealthy countries an
increase in wealth over time correlates with an increasing proportion of energy used in the form
of electricity.
In eleven Sub-Saharan, African countries energy consumption is positively correlated to
economic growth (Akinlo 2008). A study on the impact of energy consumption on economic
growth in Taiwan, using data for the period 1955-2003, found evidence of a level-dependent
effect between the two variables, energy consumption and economic growth (Lee & Chang
2006). A study on the challenges of emerging Asia attributed the accommodation of increased
energy consumption as a key contributor to ‘miracle growth’ (Asian Development Bank (ADB)
1997). Increased energy consumption is correlated with increased life expectancy, improved
health, decreased mortality rates and improved productivity since the 1940s.

IJPSS Volume 2, Issue 6 ISSN: 2249-5894 _________________________________________________________
A Monthly Double-Blind Peer Reviewed Refereed Open Access International e-Journal - Included in the International Serial Directories Indexed & Listed at: Ulrich's Periodicals Directory ©, U.S.A., Open J-Gage, India as well as in Cabell’s Directories of Publishing Opportunities, U.S.A.
International Journal of Physical and Social Sciences http://www.ijmra.us
216
June 2012
A World Bank study (1998) found that improved energy supply contributed approximately 0.8 to
1.9 percent of the accelerated annual growth of the Asian Tigers. Increasing electricity use has
also been a foundation for all productivity improvements in developed countries and it now fuels
the new digital economy (Pineau 2002). Electricity facilitates an array of end-use equipment,
including those for cooking, cooling, lighting, safe storage of food, clean water and sanitation
(Ikeme & Ebohon 2005).
4. METHODOLOGY:
The methodology of the direct assessment approach uses direct loss by which it estimates the
cost of power outages through lost production, lost materials and lost time. The direct assessment
method is an economic appraisal tool that estimates the cost of power outages by allowing
electricity consumers to express their losses in monetary terms (Bose et al. 2006:1439). The
approach is based on the principle that the lost production, materials and time in each productive
sector, or lost goods during an outage (load shedding), can be estimated directly, and this can be
aggregated to a total (de Nooijet al. 2006:284). The approach relies on the individual
respondent’s self assessment method of valuing the cost of electricity outage. Direct cost
estimations, such as the direct financial evaluation approach, the gross economic indices
approach (GNP divided by total electricity consumption), and the case study approach have been
frequently employed in the past (Pollitt, Jamasb & Yu 2006).
In order to estimate the cost of load shedding by the direct assessment, it is important that total
value lost by consumers due to load shedding is ascertained by summing all direct cost
experienced during load shedding. The direct costs incurred by firms go beyond production loss
or output loss. In addition to output loss cost, other direct costs such as materials destruction cost
(in stock), labour cost (payment of idle labourers and cost of overtime and bonuses to meet
production and orders), damage to equipment cost, restart cost, time or opportunity cost per load
shedding are part of the load shedding cost.

IJPSS Volume 2, Issue 6 ISSN: 2249-5894 _________________________________________________________
A Monthly Double-Blind Peer Reviewed Refereed Open Access International e-Journal - Included in the International Serial Directories Indexed & Listed at: Ulrich's Periodicals Directory ©, U.S.A., Open J-Gage, India as well as in Cabell’s Directories of Publishing Opportunities, U.S.A.
International Journal of Physical and Social Sciences http://www.ijmra.us
217
June 2012
Where: is the total direct cost for the ith consumer; is cost of lost output (lost leisure
for households); is the material destruction cost; is labour cost; is the equipment
damage and maintenance cost as a result of load shedding; and R is restart cost.
From equation 1 cost per unit of electricity (kWh) lost can be estimated as:
Where: is the cost per kWh lost and kWhlosj are the total units of electricity (kWh) lost or
unsupplied due to load shedding.
5. ADMINISTERING MINING SURVEY:
5.1 Questionnaire Design
The questionnaire used in the mining sector load shedding cost survey was designed in
consultation with focus groups i.e. Ministry of Mines, Minerals Marketing Corporations of
Zimbabwe (MMCZ), ZESA, Ministry of Energy and Power Development and Mining captains.
It was deemed important to understand the electricity load shedding impacts to mines, how they
experienced the load shedding, the frequency of the load shedding, the time of the load shedding,
the length of load shedding, losses they incur as a result of load shedding and alternative sources
available common to mines. The questionnaire was therefore, drawn up with these aspects in
mind.
The final questionnaire consisted of two parts. The first part contained questions about the mine
considerations i.e. mineral extracted, location, hours of operation, hours of load shedding and the
frequency of load shedding, uninterrupted power supply and advance warning arrangement,
ranking of electricity infrastructure and other publicly provided infrastructures. The second part
included the direct cost estimation of load shedding. This part solicited actual load shedding cost:
level of operation affected by load shedding, monthly production losses, damage to equipment,
labour cost of idle staff, labourers employed and those laid off and deterred investment as a
result of power load shedding. Before the questionnaire was finalised, it was tested in smaller
focus groups followed by a final survey study of personally administered questionnaires to 120
respondents.
IJPSS Volume 2, Issue 6 ISSN: 2249-5894 _________________________________________________________
A Monthly Double-Blind Peer Reviewed Refereed Open Access International e-Journal - Included in the International Serial Directories Indexed & Listed at: Ulrich's Periodicals Directory ©, U.S.A., Open J-Gage, India as well as in Cabell’s Directories of Publishing Opportunities, U.S.A.
International Journal of Physical and Social Sciences http://www.ijmra.us
218
June 2012
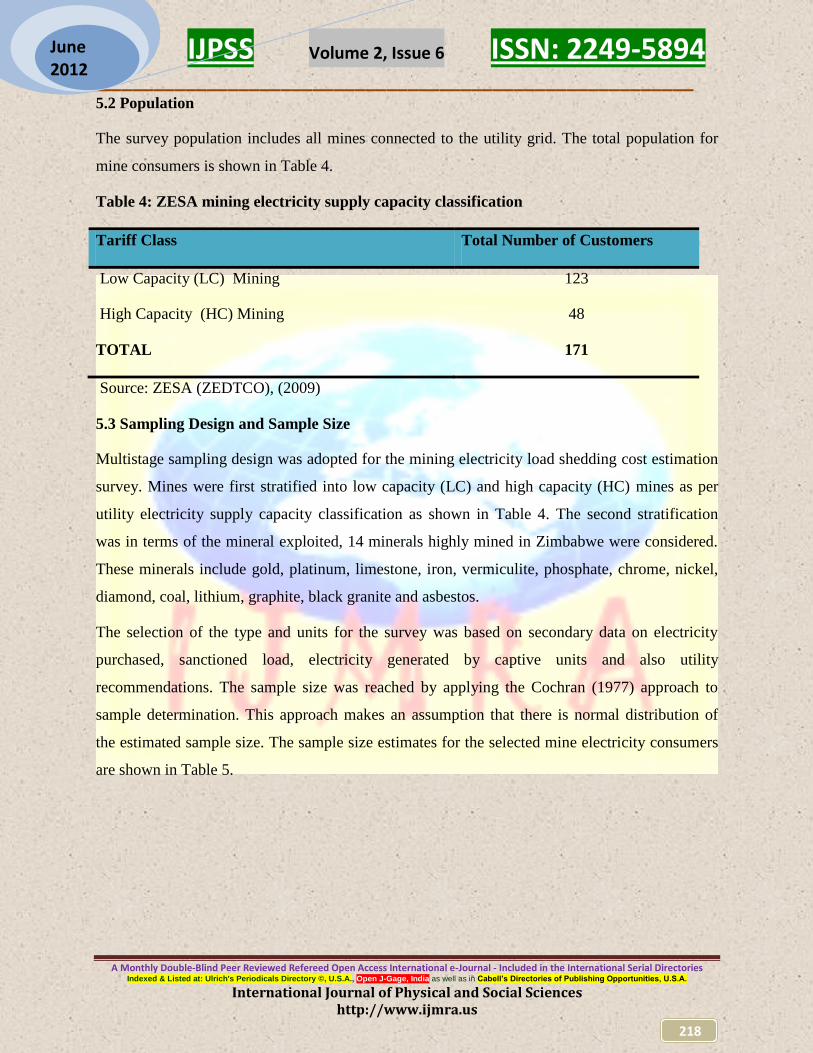
5.2 Population
The survey population includes all mines connected to the utility grid. The total population for
mine consumers is shown in Table 4.
Table 4: ZESA mining electricity supply capacity classification
Tariff Class Total Number of Customers
Low Capacity (LC) Mining 123
High Capacity (HC) Mining 48
TOTAL 171
Source: ZESA (ZEDTCO), (2009)
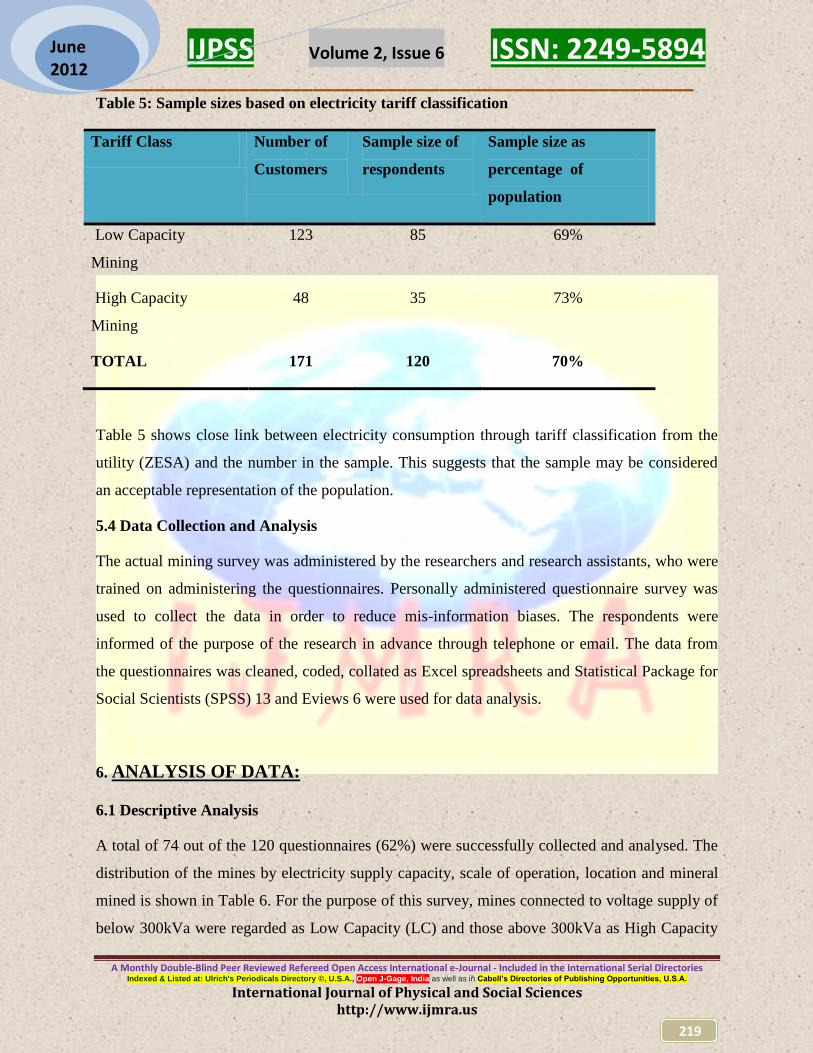
5.3 Sampling Design and Sample Size
Multistage sampling design was adopted for the mining electricity load shedding cost estimation
survey. Mines were first stratified into low capacity (LC) and high capacity (HC) mines as per
utility electricity supply capacity classification as shown in Table 4. The second stratification
was in terms of the mineral exploited, 14 minerals highly mined in Zimbabwe were considered.
These minerals include gold, platinum, limestone, iron, vermiculite, phosphate, chrome, nickel,
diamond, coal, lithium, graphite, black granite and asbestos.
The selection of the type and units for the survey was based on secondary data on electricity
purchased, sanctioned load, electricity generated by captive units and also utility
recommendations. The sample size was reached by applying the Cochran (1977) approach to
sample determination. This approach makes an assumption that there is normal distribution of
the estimated sample size. The sample size estimates for the selected mine electricity consumers
are shown in Table 5.
IJPSS Volume 2, Issue 6 ISSN: 2249-5894 _________________________________________________________
A Monthly Double-Blind Peer Reviewed Refereed Open Access International e-Journal - Included in the International Serial Directories Indexed & Listed at: Ulrich's Periodicals Directory ©, U.S.A., Open J-Gage, India as well as in Cabell’s Directories of Publishing Opportunities, U.S.A.
International Journal of Physical and Social Sciences http://www.ijmra.us
219
June 2012
Table 5: Sample sizes based on electricity tariff classification
Tariff Class Number of
Customers
Sample size of
respondents
Sample size as
percentage of
population
Low Capacity
Mining
123 85 69%
High Capacity
Mining
48 35 73%
TOTAL 171 120 70%
Table 5 shows close link between electricity consumption through tariff classification from the
utility (ZESA) and the number in the sample. This suggests that the sample may be considered
an acceptable representation of the population.
5.4 Data Collection and Analysis
The actual mining survey was administered by the researchers and research assistants, who were
trained on administering the questionnaires. Personally administered questionnaire survey was
used to collect the data in order to reduce mis-information biases. The respondents were
informed of the purpose of the research in advance through telephone or email. The data from
the questionnaires was cleaned, coded, collated as Excel spreadsheets and Statistical Package for
Social Scientists (SPSS) 13 and Eviews 6 were used for data analysis.
6. ANALYSIS OF DATA:
6.1 Descriptive Analysis
A total of 74 out of the 120 questionnaires (62%) were successfully collected and analysed. The
distribution of the mines by electricity supply capacity, scale of operation, location and mineral
mined is shown in Table 6. For the purpose of this survey, mines connected to voltage supply of
below 300kVa were regarded as Low Capacity (LC) and those above 300kVa as High Capacity
IJPSS Volume 2, Issue 6 ISSN: 2249-5894 _________________________________________________________
A Monthly Double-Blind Peer Reviewed Refereed Open Access International e-Journal - Included in the International Serial Directories Indexed & Listed at: Ulrich's Periodicals Directory ©, U.S.A., Open J-Gage, India as well as in Cabell’s Directories of Publishing Opportunities, U.S.A.
International Journal of Physical and Social Sciences http://www.ijmra.us
220
June 2012
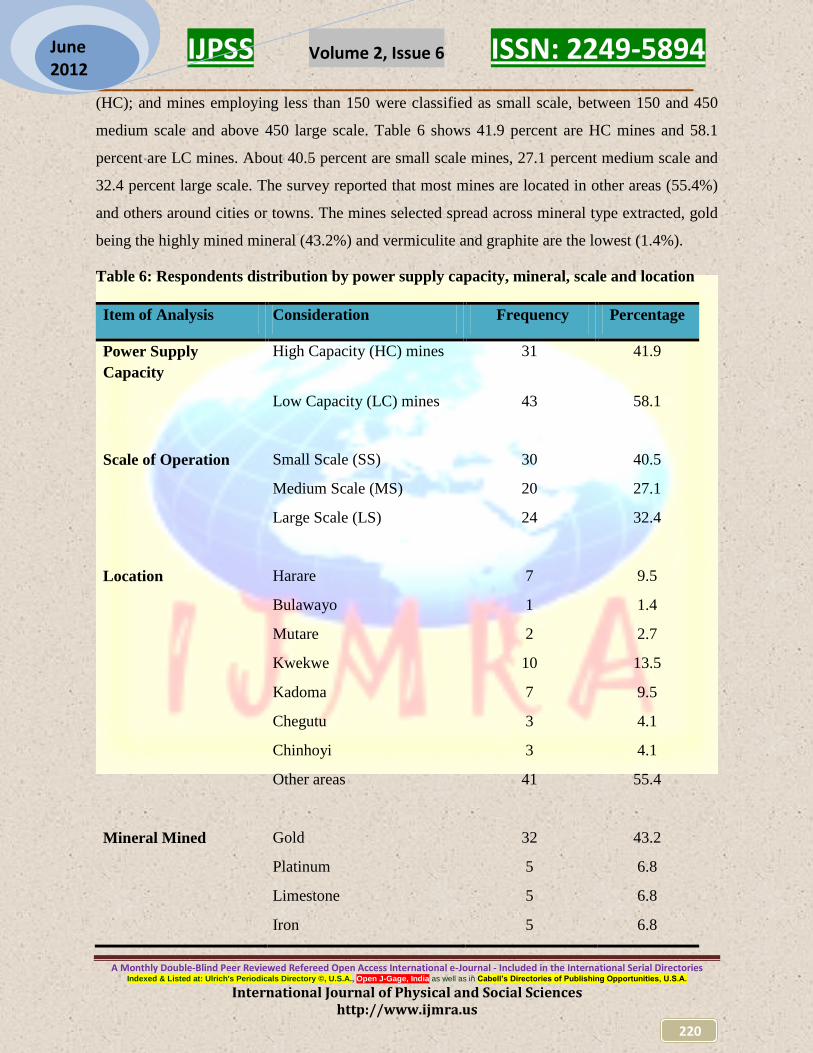
(HC); and mines employing less than 150 were classified as small scale, between 150 and 450
medium scale and above 450 large scale. Table 6 shows 41.9 percent are HC mines and 58.1
percent are LC mines. About 40.5 percent are small scale mines, 27.1 percent medium scale and
32.4 percent large scale. The survey reported that most mines are located in other areas (55.4%)
and others around cities or towns. The mines selected spread across mineral type extracted, gold
being the highly mined mineral (43.2%) and vermiculite and graphite are the lowest (1.4%).
Table 6: Respondents distribution by power supply capacity, mineral, scale and location
Item of Analysis Consideration Frequency Percentage
Power Supply
Capacity
High Capacity (HC) mines 31 41.9
Low Capacity (LC) mines 43 58.1
Scale of Operation Small Scale (SS) 30 40.5
Medium Scale (MS) 20 27.1
Large Scale (LS) 24 32.4
Location Harare 7 9.5
Bulawayo 1 1.4
Mutare 2 2.7
Kwekwe 10 13.5
Kadoma 7 9.5
Chegutu 3 4.1
Chinhoyi 3 4.1
Other areas 41 55.4
Mineral Mined Gold 32 43.2
Platinum 5 6.8
Limestone 5 6.8
Iron 5 6.8

IJPSS Volume 2, Issue 6 ISSN: 2249-5894 _________________________________________________________
A Monthly Double-Blind Peer Reviewed Refereed Open Access International e-Journal - Included in the International Serial Directories Indexed & Listed at: Ulrich's Periodicals Directory ©, U.S.A., Open J-Gage, India as well as in Cabell’s Directories of Publishing Opportunities, U.S.A.
International Journal of Physical and Social Sciences http://www.ijmra.us
221
June 2012
Vermiculite 1 1.4
Phosphate 3 4.1
Chrome 9 12.2
Nickel 1 1.4
Diamond 3 4.1
Coal 2 2.7
Lithium 2 2.7
Graphite 1 1.4
Black Granite 3 4.1
Asbestos 2 2.7
The crisis of electricity supply to the mining sector and economy can be seen in Table 7, 8, 9 and
10 which confirms the load shedding problem. On average, mines experienced load shedding 5
times a week and the load shedding times ranged from a minimum of 1 to a maximum of 7 per
week (see Table 7). About 41.9% mines surveyed showed they experienced 5 load shedding per
week, 8.1% mines reported they experienced load shedding daily and also 8.1% mines reported
they experienced a single load shedding per week. No mine has reported zero load shedding per
week reflecting that all mines were exposed to the power problem although frequencies differ.
Table 7: Frequency of weekly load shedding experienced by mines
Number of load shedding per
week
Frequency Percentage
1 6 8.1
2 2 2.7
3 11 14.9
4 9 12.2
5 31 41.9
6 9 12.2
7 6 8.1

IJPSS Volume 2, Issue 6 ISSN: 2249-5894 _________________________________________________________
A Monthly Double-Blind Peer Reviewed Refereed Open Access International e-Journal - Included in the International Serial Directories Indexed & Listed at: Ulrich's Periodicals Directory ©, U.S.A., Open J-Gage, India as well as in Cabell’s Directories of Publishing Opportunities, U.S.A.
International Journal of Physical and Social Sciences http://www.ijmra.us
222
June 2012
Table 8: Average duration of load shedding in hours reported by mines
Average load shedding duration (hours) Frequency
0.5 2
1 4
2 2
4 10
5 6
6 10
7 14
8 8
9 8
10 8
12 2
The average hours of load shedding by mines ranged from a minimum of ½ an hour per load
shed for one of the mines to 12 hours for another mine (Table 8). About 14 mines experienced
average length of 7 hours, 2 mines reported that they experienced maximum average duration of
12 hours per load shed and also 2 mines reported that they experienced minimum average
duration of ½ an hour load shed. This reflects that mines were exposed to different load shedding
of different duration. Again this has a different effect on how each mine operations is affected by
load shedding. The frequency and duration of load shedding differs depending on whether there
is an arrangement with the power utility by the mine for an uninterrupted power supply or not.
Table 9: Availability of uninterrupted supply and warning arrangement with power utility
Frequency Percentage Average Average outage

IJPSS Volume 2, Issue 6 ISSN: 2249-5894 _________________________________________________________
A Monthly Double-Blind Peer Reviewed Refereed Open Access International e-Journal - Included in the International Serial Directories Indexed & Listed at: Ulrich's Periodicals Directory ©, U.S.A., Open J-Gage, India as well as in Cabell’s Directories of Publishing Opportunities, U.S.A.
International Journal of Physical and Social Sciences http://www.ijmra.us
223
June 2012
weekly
outages
duration (hours)
Mines without
arrangement
54 73.0 6 8
Mines with arrangement 20 27.0 2 2
Table 9 showed that 27% surveyed mines, reported they have an arrangement with the power
utility for an uninterrupted power supply, while 73% reported that they do not have. Those
having an arrangement have fewer load shedding per week than those without. Also, they have
lesser duration of load shedding than those without. The arrangement was signed for
uninterruptive power supply contracts and advance warning between mines and the power utility
where by mines pay their utility bills in foreign currency for ZESA to pay for power imports.
However, all mines acknowledged that the arrangement for an uninterrupted supply and advance
warning could not be achieved 100 percent with the prevailing worsened electricity supply
problems.
Table 10: Decline in mining operation levels caused by load shedding
Percentage Decline in Mining Operations Frequency Percentage
Decline by 0% 1 1.4
Decline by 0-25% 7 9.5
Decline by 26-50% 23 31.1
Decline by 51-75% 26 35.1
Decline by 76-99% 13 17.6
Decline by 100% (no activity) 4 5.4

IJPSS Volume 2, Issue 6 ISSN: 2249-5894 _________________________________________________________
A Monthly Double-Blind Peer Reviewed Refereed Open Access International e-Journal - Included in the International Serial Directories Indexed & Listed at: Ulrich's Periodicals Directory ©, U.S.A., Open J-Gage, India as well as in Cabell’s Directories of Publishing Opportunities, U.S.A.
International Journal of Physical and Social Sciences http://www.ijmra.us
224
June 2012
Among the surveyed mines, 5.4 percent reported having to shut down production at one time or
the other in the year due to load shedding, 35.1 percent reported between 51 and 75 percent
decline, 31.1 percent reported between 26 and 50 percent decline, 17.6 percent reported between
76 and 99 percent decline while a single mine reported no decline.
6.2 Decomposition of Load Shedding Cost by Type of Cost
Table 11 provides a decomposition of cost by type using the mean values from the surveyed
mines. The table also confirms the survey expectations that lost output is the major type of direct
cost incurred by mines.
Table 11: Decomposition of direct cost by type
.
The mean cost totalled over two million dollars (US$) in 2008. Using the total mean of the direct
cost components, the total load shedding cost of the mining sector was found to be
US$153556744. The total cost for the sector translates to US$354840585.
Cost Type Amount (US$) As % of Total
Lost output 1919059.65 92.48
Labour cost 72745.95 3.51
Destruction of material (raw materials and
stocks)
40816.22 1.97
Restart costs, 28313.51 1.36
Damage to equipment 14156.76 0.68
Total 2075091.14 100

IJPSS Volume 2, Issue 6 ISSN: 2249-5894 _________________________________________________________
A Monthly Double-Blind Peer Reviewed Refereed Open Access International e-Journal - Included in the International Serial Directories Indexed & Listed at: Ulrich's Periodicals Directory ©, U.S.A., Open J-Gage, India as well as in Cabell’s Directories of Publishing Opportunities, U.S.A.
International Journal of Physical and Social Sciences http://www.ijmra.us
225
June 2012
6.3 Decomposition of direct cost per mineral
Table 12 provides a decomposition of losses by type of mineral extracted. The table shows
output loss cost, labour cost, material cost, other cost (restart and damage to equipment cost) and
total direct cost. Some mines pointed out that output loss is more significant per load shed if the
load shedding affects the whole shift in operation. Labourers have to be paid regardless of
idleness due to load shedding. Low material destruction cost shows that mineral ores are not
much subjected to load shedding while in stock.
Table 12: Decomposition of cost by type of mineral mined
Mineral Type Output Loss
Cost (US$)
Labour
Cost (US$)
Material
Cost (US$)
Other
Cost(US$)
Total Direct
Cost (US$)
Gold 2688563 82725 44531 44700 2860519
Platinum 1342800 151200 53280 53280 1600560
Limestone 180000 28800 6000 15600 230400
Iron 1801680 64800 25200 34800 1926480
Vermiculite 24000 6000 42000 42000 114000
Phosphate 372000 34000 38000 22000 466000
Chrome 570000 49333 37667 34000 691000
Nickel 3000000 90000 0 18000 3108000
Diamond 700000 104000 126000 134000 1064000
Coal 3612000 75000 9000 105000 3801000
Lithium 2970000 66000 96000 12000 3144000
Graphite 180000 90000 6000 18000 294000
Black
Granite
2080000 26000 8000 16000 2130000
Asbestos 4200000 54000 30000 30000 4314000

IJPSS Volume 2, Issue 6 ISSN: 2249-5894 _________________________________________________________
A Monthly Double-Blind Peer Reviewed Refereed Open Access International e-Journal - Included in the International Serial Directories Indexed & Listed at: Ulrich's Periodicals Directory ©, U.S.A., Open J-Gage, India as well as in Cabell’s Directories of Publishing Opportunities, U.S.A.
International Journal of Physical and Social Sciences http://www.ijmra.us
226
June 2012
From the table, asbestos reported the highest output loss cost while vermiculite reported the
lowest. However, it was different with labour cost where platinum reported the highest while
vermiculite the least again. For material destruction cost diamond reported the highest while
nickel reported the lowest with zero cost. Diamond mines reported the highest for other cost
while limestone the least. Overall, asbestos reported the highest total direct cost while
vermiculite reported the lowest cost.
6.4 Distribution of cost per kWh lost by mineral type
Load shedding cost per kWh lost was obtained by adding all the direct cost. Annual kWhs of
unsupplied electricity due to load shedding from the power utility grid were also computed. A
simple division was then performed dividing total direct cost by unsupplied kWhs.
Table 13: Distribution of per kWh cost by power capacity, scale, location and mineral
Factor Production Loss cost per
kWh (US$)
Power Supply Capacity High Capacity (HC) mines 26
Low Capacity (LC) mines 91
Scale of Operation Small Scale 79.07
Medium Scale 74.26
Large Scale 59.43
City of Location Harare 75
Bulawayo 10
Mutare 37
Kwekwe 58
Kadoma 21
Chegutu 20

IJPSS Volume 2, Issue 6 ISSN: 2249-5894 _________________________________________________________
A Monthly Double-Blind Peer Reviewed Refereed Open Access International e-Journal - Included in the International Serial Directories Indexed & Listed at: Ulrich's Periodicals Directory ©, U.S.A., Open J-Gage, India as well as in Cabell’s Directories of Publishing Opportunities, U.S.A.
International Journal of Physical and Social Sciences http://www.ijmra.us
227
June 2012
Chinhoyi 27
Other areas 63
Mineral Type Gold 54
Platinum 19
Limestone 22
Iron 16
Vermiculite 2
Phosphate 23
Chrome 41
Nickel 56
Diamond 13
Coal 32
Lithium 49
Graphite 12
Black Granite 47
Asbestos 61
Table 13 shows load shedding cost per kWh. Among the minerals, asbestos, nickel and gold
mines recorded the highest load shedding cost per kWh ranging between US$54 to US$61,
followed by lithium, black granite, chrome and coal mines ranging between US$32 to US$ 49,
then phosphate, limestone, platinum, iron, graphite and diamond mines ranging between US$12
to US$23 and vermiculite reported the lowest cost of US$2 per kWh. The overall mean kWh cost
was found to be US$31.07. The cost variation across location is also presented in Table 13. Of
the locations, mines around Harare reported the highest load shedding cost per kWh of US$75,
followed by other small mining towns reporting US$63 per kWh, while Bulawayo reported the
lowest load shedding cost of US$10 per kWh. In terms of electricity supply distribution voltage,
Low Capacity (LC) reported the higher load shedding cost per unsupplied kWh of US$91 and
High Capacity (HC) mines reported load shedding cost of US$26 per kWh unsupplied. This
reflects the presence of arrangement between the power utility and HC mines.

IJPSS Volume 2, Issue 6 ISSN: 2249-5894 _________________________________________________________
A Monthly Double-Blind Peer Reviewed Refereed Open Access International e-Journal - Included in the International Serial Directories Indexed & Listed at: Ulrich's Periodicals Directory ©, U.S.A., Open J-Gage, India as well as in Cabell’s Directories of Publishing Opportunities, U.S.A.
International Journal of Physical and Social Sciences http://www.ijmra.us
228
June 2012
Using the average kWh cost of US31.07, the total direct cost incurred by mines due to
unsupplied kWhs is US$154179096 for 2008 with an average cost per mine of US$2083501.
Considering the total number of mines connected to the grid, this translates to US$356278721.
The two approaches to direct assessment method shows a smaller difference of load shedding
cost, hence reflecting reliability of the data obtained using questionnaires.
6.5 Analysis of Regression Results
The relationship of the factors which contribute to the level of load shedding cost was modelled
by assuming a simple linear relationship between load shedding cost and observed variables. The
relevant dependent and independent variables making up the model, together with expected signs
of their coefficients are described in Table 14.
Table 14: Description of all variables used in multiple regressions
Dependent Variable Description Expected
Sign
TDCOST Total direct cost incurred by mines as a result
of electricity load shedding
Independent Variables
TONUOUT Total number of outages through load shedding +
ADHORS Average duration of load shedding in hours +
TOKWHLOS Total kWh lost +
TWHRS Total working/operational hours (business
hours)
+
CAPACITY Capacity level of operation +
REV Revenue income from the mine -
ELEXP Electricity expenditure -
IJPSS Volume 2, Issue 6 ISSN: 2249-5894 _________________________________________________________
A Monthly Double-Blind Peer Reviewed Refereed Open Access International e-Journal - Included in the International Serial Directories Indexed & Listed at: Ulrich's Periodicals Directory ©, U.S.A., Open J-Gage, India as well as in Cabell’s Directories of Publishing Opportunities, U.S.A.
International Journal of Physical and Social Sciences http://www.ijmra.us
229
June 2012
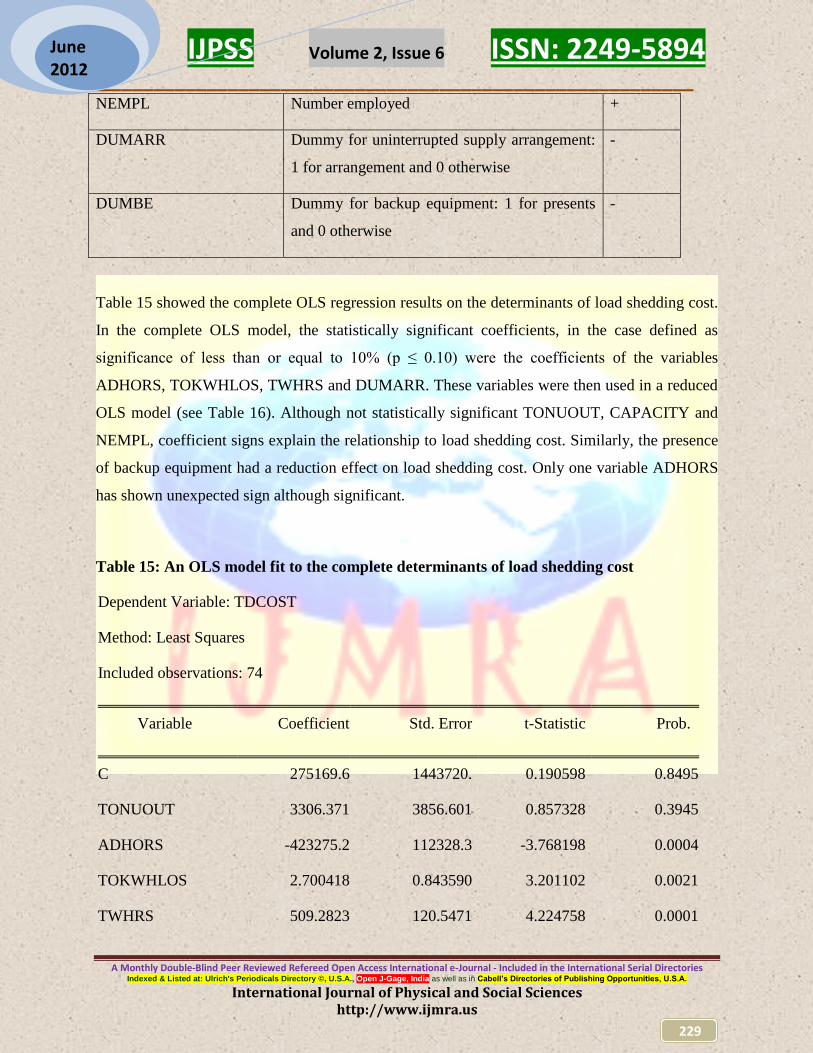
NEMPL Number employed +
DUMARR Dummy for uninterrupted supply arrangement:
1 for arrangement and 0 otherwise
-
DUMBE Dummy for backup equipment: 1 for presents
and 0 otherwise
-
Table 15 showed the complete OLS regression results on the determinants of load shedding cost.
In the complete OLS model, the statistically significant coefficients, in the case defined as
significance of less than or equal to 10% (p ≤ 0.10) were the coefficients of the variables
ADHORS, TOKWHLOS, TWHRS and DUMARR. These variables were then used in a reduced
OLS model (see Table 16). Although not statistically significant TONUOUT, CAPACITY and
NEMPL, coefficient signs explain the relationship to load shedding cost. Similarly, the presence
of backup equipment had a reduction effect on load shedding cost. Only one variable ADHORS
has shown unexpected sign although significant.
Table 15: An OLS model fit to the complete determinants of load shedding cost
Dependent Variable: TDCOST
Method: Least Squares
Included observations: 74
Variable Coefficient Std. Error t-Statistic Prob.
C 275169.6 1443720. 0.190598 0.8495
TONUOUT 3306.371 3856.601 0.857328 0.3945
ADHORS -423275.2 112328.3 -3.768198 0.0004
TOKWHLOS 2.700418 0.843590 3.201102 0.0021
TWHRS 509.2823 120.5471 4.224758 0.0001

IJPSS Volume 2, Issue 6 ISSN: 2249-5894 _________________________________________________________
A Monthly Double-Blind Peer Reviewed Refereed Open Access International e-Journal - Included in the International Serial Directories Indexed & Listed at: Ulrich's Periodicals Directory ©, U.S.A., Open J-Gage, India as well as in Cabell’s Directories of Publishing Opportunities, U.S.A.
International Journal of Physical and Social Sciences http://www.ijmra.us
230
June 2012
CAPACITY 15695.51 19135.96 0.820210 0.4152
REV -0.007238 0.006249 -1.158299 0.2511
ELEXP -0.020050 0.138995 -0.144247 0.8858
NEMPL 160.1790 784.3026 0.204231 0.8388
DUMARR -2468656. 710083.3 -3.476572 0.0009
ABE -173364.1 754676.2 -0.229720 0.8191
R-squared 0.479555 Mean dependent var 2075092.
Adjusted R-squared 0.396945 S.D. dependent var 2519494.
S.E. of regression 1.956554 Akaike info criterion 31.94764
Sum squared resid 241.1486 Schwarz criterion 32.29013
Log likelihood -1171.062 Hannan-Quinn criter. 32.08426
F-statistic 5.805023 Durbin-Watson stat 1.259181
Prob(F-statistic) 0.000004
The adjusted R-squared of the model represent how well the model fits the data (Mendenhall and
Sincich, 1996:78). A minimum adjusted R-squared of 15% or more is considered acceptable
(Hanley and Splash, 1993). At 39.6% for the complete OLS model, the adjusted R-squared is
above minimal acceptability.
IJPSS Volume 2, Issue 6 ISSN: 2249-5894 _________________________________________________________
A Monthly Double-Blind Peer Reviewed Refereed Open Access International e-Journal - Included in the International Serial Directories Indexed & Listed at: Ulrich's Periodicals Directory ©, U.S.A., Open J-Gage, India as well as in Cabell’s Directories of Publishing Opportunities, U.S.A.
International Journal of Physical and Social Sciences http://www.ijmra.us
231
June 2012
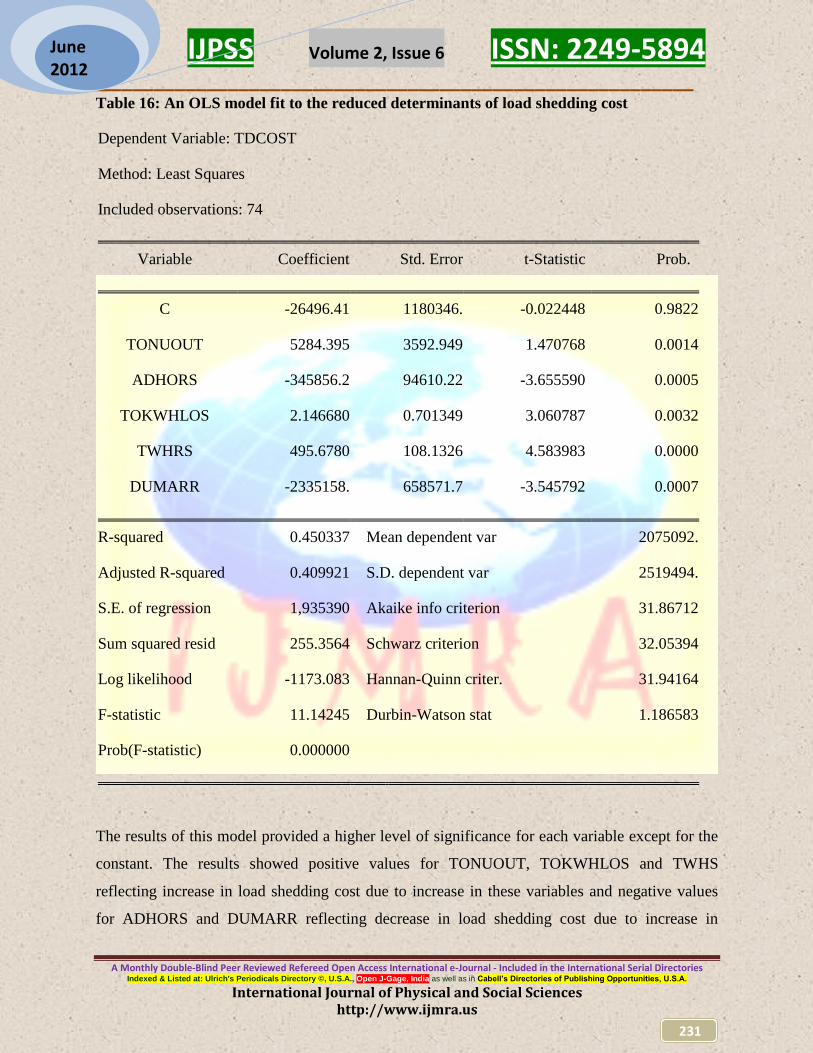
Table 16: An OLS model fit to the reduced determinants of load shedding cost
Dependent Variable: TDCOST
Method: Least Squares
Included observations: 74
Variable Coefficient Std. Error t-Statistic Prob.
C -26496.41 1180346. -0.022448 0.9822
TONUOUT 5284.395 3592.949 1.470768 0.0014
ADHORS -345856.2 94610.22 -3.655590 0.0005
TOKWHLOS 2.146680 0.701349 3.060787 0.0032
TWHRS 495.6780 108.1326 4.583983 0.0000
DUMARR -2335158. 658571.7 -3.545792 0.0007
R-squared 0.450337 Mean dependent var 2075092.
Adjusted R-squared 0.409921 S.D. dependent var 2519494.
S.E. of regression 1,935390 Akaike info criterion 31.86712
Sum squared resid 255.3564 Schwarz criterion 32.05394
Log likelihood -1173.083 Hannan-Quinn criter. 31.94164
F-statistic 11.14245 Durbin-Watson stat 1.186583
Prob(F-statistic) 0.000000
The results of this model provided a higher level of significance for each variable except for the
constant. The results showed positive values for TONUOUT, TOKWHLOS and TWHS
reflecting increase in load shedding cost due to increase in these variables and negative values
for ADHORS and DUMARR reflecting decrease in load shedding cost due to increase in
IJPSS Volume 2, Issue 6 ISSN: 2249-5894 _________________________________________________________
A Monthly Double-Blind Peer Reviewed Refereed Open Access International e-Journal - Included in the International Serial Directories Indexed & Listed at: Ulrich's Periodicals Directory ©, U.S.A., Open J-Gage, India as well as in Cabell’s Directories of Publishing Opportunities, U.S.A.
International Journal of Physical and Social Sciences http://www.ijmra.us
232
June 2012
duration and presence of uninterrupted supply arrangement. ADHORS reported unexpected sign
again.
As with the complete model, the adjusted R-squared was used as a measure of the fit; 40.99% of
the variation in load shedding cost was explained in the OLS reduced model. The adjusted R-
squared value is almost similar to that observed in the complete model, suggesting that no
significant variables were left out of the reduced model. It is however, unadvisable to make
deductions about which model is preferred for determining determinants based on a perceived
negligible change in the adjusted R-squared value. Additional inferential tests, such as
hypothesis testing, should be used for this purpose (Hanley and Splash, 1993). The relevant
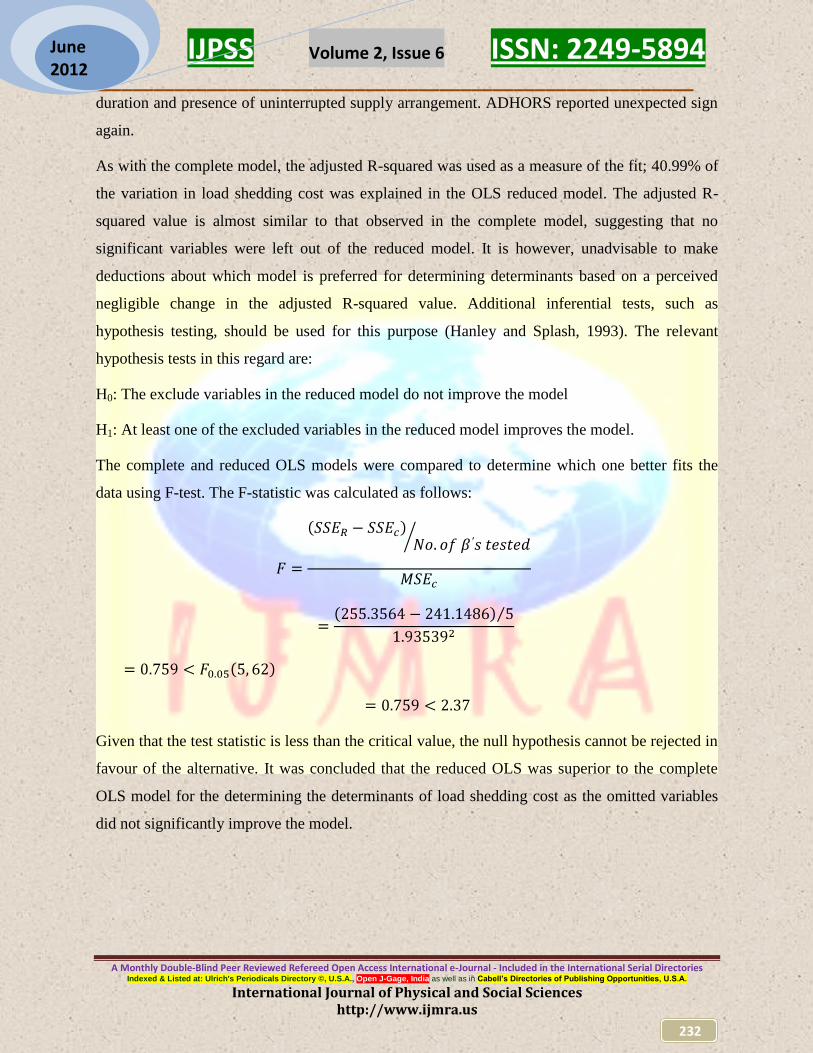
hypothesis tests in this regard are:
H0: The exclude variables in the reduced model do not improve the model
H1: At least one of the excluded variables in the reduced model improves the model.
The complete and reduced OLS models were compared to determine which one better fits the
data using F-test. The F-statistic was calculated as follows:
Given that the test statistic is less than the critical value, the null hypothesis cannot be rejected in
favour of the alternative. It was concluded that the reduced OLS was superior to the complete
OLS model for the determining the determinants of load shedding cost as the omitted variables
did not significantly improve the model.

IJPSS Volume 2, Issue 6 ISSN: 2249-5894 _________________________________________________________
A Monthly Double-Blind Peer Reviewed Refereed Open Access International e-Journal - Included in the International Serial Directories Indexed & Listed at: Ulrich's Periodicals Directory ©, U.S.A., Open J-Gage, India as well as in Cabell’s Directories of Publishing Opportunities, U.S.A.
International Journal of Physical and Social Sciences http://www.ijmra.us
233
June 2012
6.6 Mining Load Shedding Cost Impact Assessment
The impact of load shedding was assessed using total sector load shedding as a proportion of
GDP. The load shedding cost scale was assessed as a proportion of the GDP of US$5.4 billion
for 2009 (RBZ 2010). The impact of load shedding for the mining sector was 4.6 percent of
GDP.
7. CONCLUSION:
One strong conclusion of the study is that poor state of electricity supply in Zimbabwe has
imposed huge cost on the mining sector. The bulk of the cost come in the form of lost output or
lost production. Furthermore, it is concluded that load shedding costs vary proportionately with
power supply capacity and scale of operations. Small scale mines which form the greater
proportion of Low Capacity (LC) mines are more heavily affected by electricity load shedding
compared to High Capacity (HC) mines which form the greater proportion of large scale mines
due to availability of uninterrupted power supply and advance warning arrangement signed by
the majority of HC mines. It is also conclude that mineral type has an influence on the cost of
load shedding, high valued minerals (diamond and gold mines) have generally reported the
highest load shedding cost in both total and per unit of unsupplied kWh and low valued minerals
(vermiculite mines) the least.
8. RECOMMENDATIONS:
Research results have shown that load shedding result in significant cost to mines. Therefore, the
researchers recommend the following:
1. The power utility to increase power generation in order to reduce load shedding to mines.
2. Power utility to communicate to the mines before load shedding them in order for them to
prepare for the load shedding.
3. Mines to concentrate on other activities which do not require electricity during load
shedding times.
4. The power utility (ZESA) should prioritise mining sector as there is a lot of potential for
economic growth and employment through mining and mining related activities.
IJPSS Volume 2, Issue 6 ISSN: 2249-5894 _________________________________________________________
A Monthly Double-Blind Peer Reviewed Refereed Open Access International e-Journal - Included in the International Serial Directories Indexed & Listed at: Ulrich's Periodicals Directory ©, U.S.A., Open J-Gage, India as well as in Cabell’s Directories of Publishing Opportunities, U.S.A.
International Journal of Physical and Social Sciences http://www.ijmra.us
234
June 2012
REFERENCES:
Adenikinju, A. 2005. Analysis of the cost of infrastructure failures in a developing economy:
The case of the electricity sector in Nigeria.Nairobi, Kenya: African Economic Research
Consortium. Available:www.aerc.org/publications/index.asp
Akinlo, A.E. 2008. Energy consumption and economic growth: evidence from 11 Sub-Sahara
African countries, Energy Economics, volume 30, pp. 2391- 2400.
Andrews-Speed, P. and Dow, S. 2000. Reform of China’s electric power industry, Energy
Policy, Volume 28, no. 5,pp. 335-347.
Asian Development Bank. 1997. Handbook for the Economic Analysis of electricity Supply
Projects. Manila: Asian Development bank.
Beenstock, M., Goldin, E. & Haitovsky, Y. 1998. Response Bias in a Conjoint Analysis of
Power Outages. Energy Economics, volume 20, no.2,pp. 135-156.
Bernstein, M. & Heganazy, Y. 1988. Economic costs of electricity shortages: Case study of
Egypt. The Energy Journal, Special Electricity Reliability Issues, volume 9: pp.173-88.
Bose, R.K., Shukla, M. Srivasta, L. & Yaron, G. 2006. Cost of unserved Power in Karnataka,
India. Energy Policy, volume 34,no. 12, pp. 1434-1447.
Boston Institute for Development Economics. 2006. Impact of privatisation in Africa:
Synthesis of Eight Case Studies. Public Private Infrastructure Advisory Facility.
Calderon, C. 2008. Infrastructure and Growth in Africa. Working Paper, Africa
Infrastructure Country Diagnostic.
Chamber of Mines of Zimbabwe. 2010. Chamber of Mines Journal, Harare, Zimbabwe.
Cochran W.G. (1977). Sampling Techniques, 2nd
Edition.New York, USA: John Wiley and
Sons.
Confederation of Zimbabwean Industries (CZI). 2009. Manufacturing Sector Survey for
2009. Harare, Zimbabwe.
De Nooij, M., Kopmans, C. & Bijvoet, C.2006. The value of supply security and cost of
power interruptions: Economic input for damage reduction and investment in networks.
Sciecne Technology Journal, volume 23, pp. 231-256.
Ebohon, O.J. 1996. Energy, economic growth and causality in developing countries: a case
study of Tanzania and Nigeria. Energy policy, volume 24, no.5, pp. 447-453.

IJPSS Volume 2, Issue 6 ISSN: 2249-5894 _________________________________________________________
A Monthly Double-Blind Peer Reviewed Refereed Open Access International e-Journal - Included in the International Serial Directories Indexed & Listed at: Ulrich's Periodicals Directory ©, U.S.A., Open J-Gage, India as well as in Cabell’s Directories of Publishing Opportunities, U.S.A.
International Journal of Physical and Social Sciences http://www.ijmra.us
235
June 2012
Eto, J., Koomey, J., Lehman, B., Martin, N., Mills, E., Webber, C. & Worrell, E. 2001.
Scoping Study on Trends in the Economic Value of Electricity Reliability to the U.S.
Economy. Barkeley, CA: LawrenceBerkeley National Laboratories, Pub LBNL-47911: pp. 1-
23.
Eto, J., Divan, D. & Brumsickle, W. 2004. Pilot Evaluation of Electricity-Reliability and
Power-Quality Monitoring in California's Silicon Valley with the I-Grid System.Barkeley,
CA: Lawrence Berkeley National Laboratory. LBNL-52740: pp. 1-34.
European Commission.1993. Growth, competitiveness, employment: the challenges and ways
forward into the 21st century. European Union, Brussels: White paper COM (93) 700.
Foster, V. & Steinbuks, J. 2008. Paying the price for unreliable power supplies: In-house
generation of electricity by firms in Africa. Africa Infrastructure Country Diagnostic.
Ferguson, R., Wilkinson, W. & Hill, R. 2000. Electricity use and economic development.
Energy Policy, volume 28, pp. 923-934.
Ikeme, J. & Ebohon, O.J. 2005. Nigeria’s electric power sector reform: what should form the
key objectives? Energy Policy, volume 33, pp. 1213-1221.
Kayo, D. 2001. Power sector reform in Zimbabwe: Proceedings of a reginal policy seminar
on power reforms in Africa. Nairobi, Kenya: AFREPREN. Available:www.afrepre.org
/Pubs/wpp1.htm.
Kayo, D. 2002. Power sector reform in Zimbabwe: Will reforms increase electrification and
strengthen local participation? Energy Policy, volume 30.
Lee, K.S. & Anas, A. 1992. Impacts of Infrastructure Deficiencies on Nigerian
Manufacturing: Private Alternative and Policy Options. Washington DC, USA:
Infrastructure and Urban Development Department.
Lee, C. & Chang, C. 2006. The impact of energy consumption on economic growth:
Evidence from linear and nonlinear models in Taiwan. Energy volume, volume 32, no.12, pp.
2282-2294.
Ministry of Energy and Power Development. 2005. Annual Report, Harare, Zimbabwe
Ministry of Mines. 2009. Annual Report, Harare, Zimbabwe.
Ontario Hydro. 1980. Ontario Hydro survey on Power System Reliability: Viewpoint of
Farm Operators. Final Report No. R&U 78-5, December.

IJPSS Volume 2, Issue 6 ISSN: 2249-5894 _________________________________________________________
A Monthly Double-Blind Peer Reviewed Refereed Open Access International e-Journal - Included in the International Serial Directories Indexed & Listed at: Ulrich's Periodicals Directory ©, U.S.A., Open J-Gage, India as well as in Cabell’s Directories of Publishing Opportunities, U.S.A.
International Journal of Physical and Social Sciences http://www.ijmra.us
236
June 2012
Pineau, P. O. 2002. Electricity sector reform in Cameroon: is privatisation the solution?
Energy Policy, volume 30, no. 11-12, pp. 999-1012.
Pollit, M., Jamasb, T. & Yu, W. 2006. Incoporating the price of Quality in Efficiency
Analysis: The case of Electricity Distribution Regulation in the UK. Cambridge, UK:
University of Cambridge.
Primen. 2001. The Cost of Power Disturbances to Industrial and Digital Economy
Companies. Primen; TR-1006274. Available: EPRI. June 29. Madison WI.
Rose, A. & Lim, D. 2002. Business Interruption Losses from Natural Hazards: Conceptual
and Methodology Issues in the Case of the Northridge Earthquake. Environmental Hazards:
Humanand Social Dimensions,volume 4, pp.1-14.
Rose, A., Oladosu, G. & Salvino, D. 2004. Regional Economic Impacts of Electricity
Outages in Los Angeles: A Computable General Equilibrium Analysis. In M. Crew & M.
Spiegel (Eds.).Obtaining the Best from Regulation and Competition.Dordrecht: Kluwer.
Rosenberg, N. 1998. The role of electricity in industrial development. The Energy Journal,
volume 19, no. 2, pp. 7-24.
Templet, P.H. 1999. Energy, diversity and development in economic systems: an empirical
analysis.Ecological Economics, volume 30, no. 2, pp. 223-233.
Tierney, K. 1997.Impacts of Recent Disasters on Businesses: The 1993 Midwest Floods and
the 1994 Northridge Earthquake. In Jones, B. (Ed.).Economic Consequences of Earthquakes:
Preparing for the Unexpected. Buffalo, NY: National Center for Earthquake Engineering
Research.
Ukpong, I.I. 1973. The economic consequences of electric power failures. The Nigerian
Journal of Economic and Social Studies, volume 15, no. 1, pp.53-74.
World Bank. 2004a.Making Services Work for Poor People. World Development Report.
Washington, DC: The World Bank.
World Bank.2004b.Azerbaijan. Raising Rates: Short-Term Implications of Residential
Electricity Tariff Rebalancing. Europe and Central Asia Environmentally and Socially
Sustainable Development Department Report, no. 30749-AZ.
ZESA. 2001. Harare, Zimbabwe: Annual Report.
ZESA. 2003. Harare, Zimbabwe: Annual Report.
ZESA. 2004. Harare, Zimbabwe: Annual Report.

IJPSS Volume 2, Issue 6 ISSN: 2249-5894 _________________________________________________________
A Monthly Double-Blind Peer Reviewed Refereed Open Access International e-Journal - Included in the International Serial Directories Indexed & Listed at: Ulrich's Periodicals Directory ©, U.S.A., Open J-Gage, India as well as in Cabell’s Directories of Publishing Opportunities, U.S.A.
International Journal of Physical and Social Sciences http://www.ijmra.us
237
June 2012
ZESA. 2005. Harare, Zimbabwe: Annual Report.
ZESA. 2006. Harare, Zimbabwe: Annual Report.
ZESA. 2007. Harare, Zimbabwe: Annual Report.
ZESA. 2008. Harare, Zimbabwe: Annual Report.
ZESA. 2009. Harare, Zimbabwe: Annual Report.
Zimbabwe Power Company (ZPC), subsidiary of ZESA. 2009. Annual Report, Harare,
Zimbabwe.
Zimbabwe Electricity Supply Authority (ZESA). 2009. Daily Electricity Demand
Assessment, Harare, Zimbabwe: ZESA.
ZIMSTATS. 2009. Annual Statistics for Zimbabwe, Harare, Zimbabwe