
June 4, 2014. Value of the Area Mailer Industry Focus Groups: Immediate Issue Resolution Provides...
55
MEGAN J. BRENNAN CHIEF OPERATING OFFICER CAPITAL METRO FOCUS GROUP June 4, 2014 Greensboro Mid-Carolinas Greater So Carolina Baltimore Cap NOVA Atlanta Richmond
-
Upload
dwayne-james -
Category
Documents
-
view
213 -
download
0
Transcript of June 4, 2014. Value of the Area Mailer Industry Focus Groups: Immediate Issue Resolution Provides...
MEGAN J. BRENNAN
CHIEF OPERATING OFFICER
CAPITAL METRO FOCUS GROUP
June 4, 2014
Greensboro
Mid-Carolinas
Greater So Carolina
Baltimore
CapNOVA
Atlanta
Richmond
THANK YOU FOR YOUR PARTICIPATIONIN THIS VALUABLE PROCESS
Value of the Area Mailer Industry Focus Groups:
Immediate Issue Resolution
Provides a Forum for Crucial Feedback / Suggestions / Ideas
Builds Critical Relationships at All Levels of the Organization
Forum to Communicate Operational Changes
2
Capital Metro Focus Group
3
USPS Core Objectives
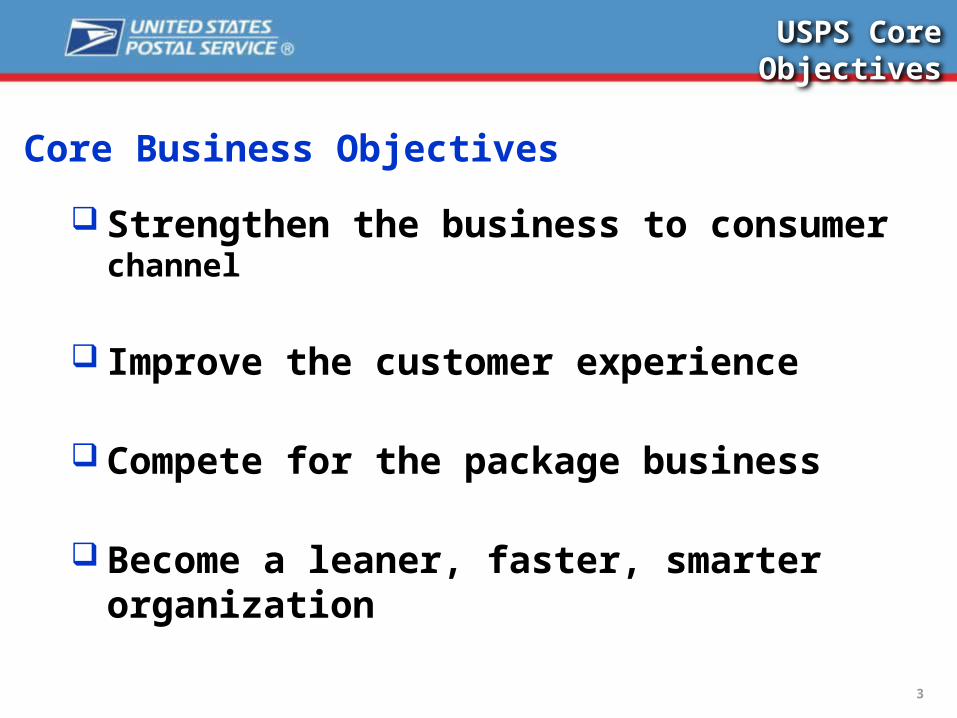
Core Business Objectives
Strengthen the business to consumer channel
Improve the customer experience
Compete for the package business
Become a leaner, faster, smarter organization
4
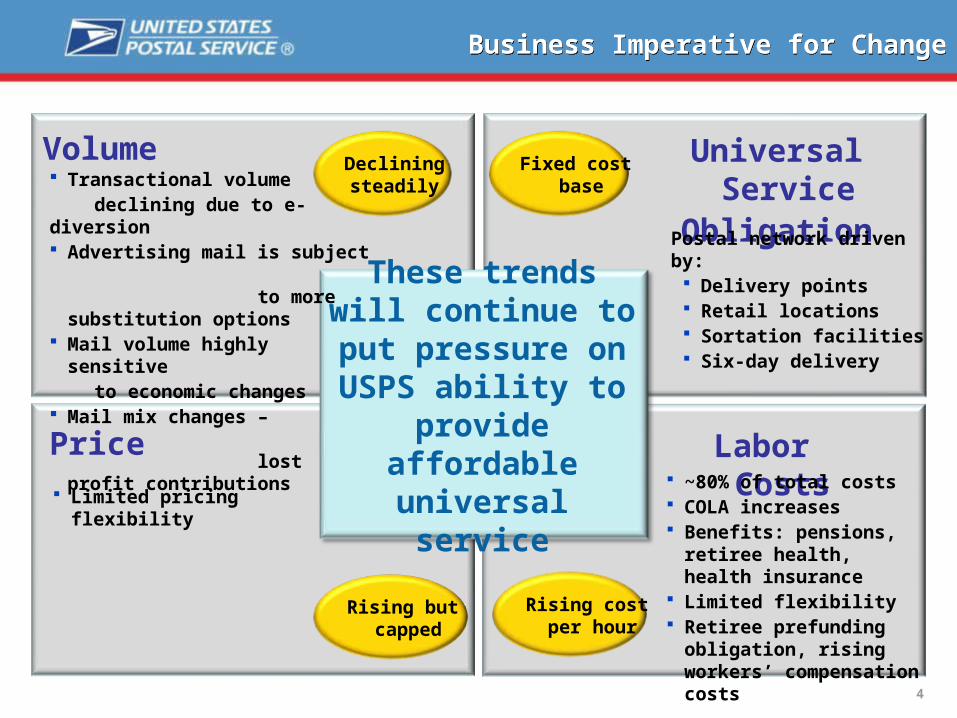
Volume
Price Labor Costs
Universal Service Obligation
Limited pricing flexibility
Postal network driven by: Delivery points Retail locations Sortation facilities Six-day delivery
~80% of total costs COLA increases Benefits: pensions, retiree
health, health insurance Limited flexibility Retiree prefunding
obligation, rising workers’ compensation costs
These trends will continue to put
pressure on USPS ability to provide
affordable universal service
Decliningsteadily Transactional volume
declining due to e-diversion Advertising mail is subject
to more substitution options
Mail volume highly sensitive to economic changes Mail mix changes –
lost profit contributions
Fixed cost base
Rising but capped
Rising cost per hour
Business Imperative for ChangeBusiness Imperative for Change
800
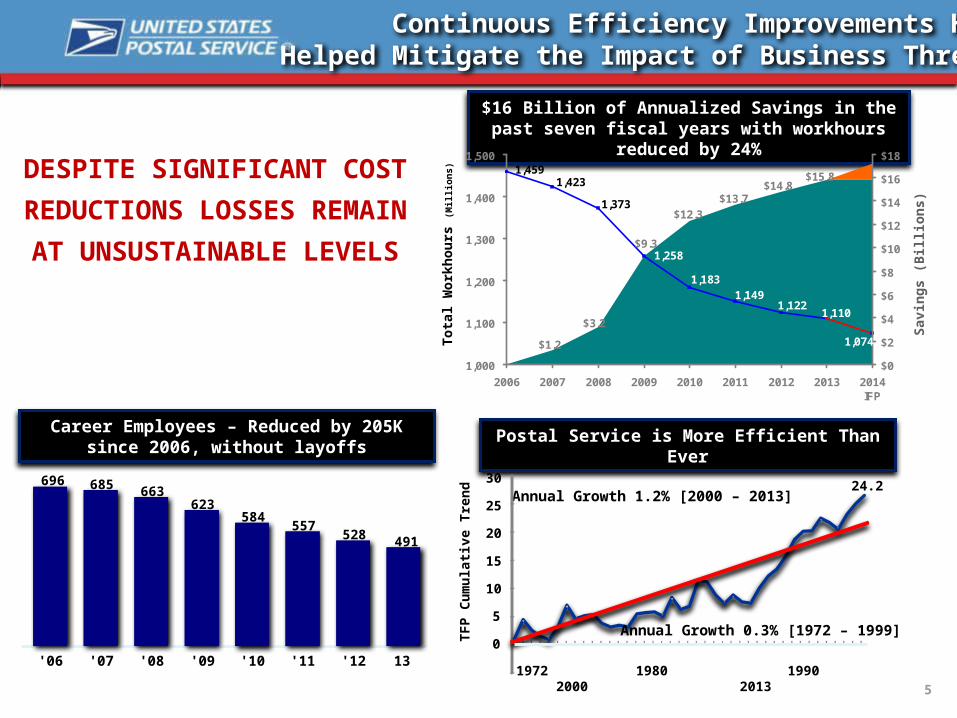
696
'06
685
'07
663
'08
623
'09
584
'10
557
'11
528
'12
491
13
DESPITE SIGNIFICANT COST
REDUCTIONS LOSSES REMAIN
AT UNSUSTAINABLE LEVELS
$15.8
$1.2
$3.2
$9.3
$12.3$13.7
$14.8
1,074
1,1491,183
1,258
1,122
1,459
1,110
1,373
1,423
1,000
1,100
1,200
1,300
1,400
1,500
2006 2007 2008 2009 2010 2011 2012 2013 2014IFP
$0
$2
$4
$6
$8
$10
$12
$14
$16
$18
Career Employees – Reduced by 205K since 2006, without layoffs
Postal Service is More Efficient Than Ever
$16 Billion of Annualized Savings in the past seven fiscal years with workhours reduced by 24%
Tota
l Wo
rkh
ou
rs (M
illio
ns)
Sav
ing
s (B
illio
ns)
Annual Growth 1.2% [2000 – 2013]
0
5
10
15
20
25
30T
FP
Cu
mu
lati
ve T
ren
d
24.2
1972 1980 1990 2000 2013
Annual Growth 0.3% [1972 – 1999]
5
Continuous Efficiency Improvements HaveHelped Mitigate the Impact of Business Threats
6
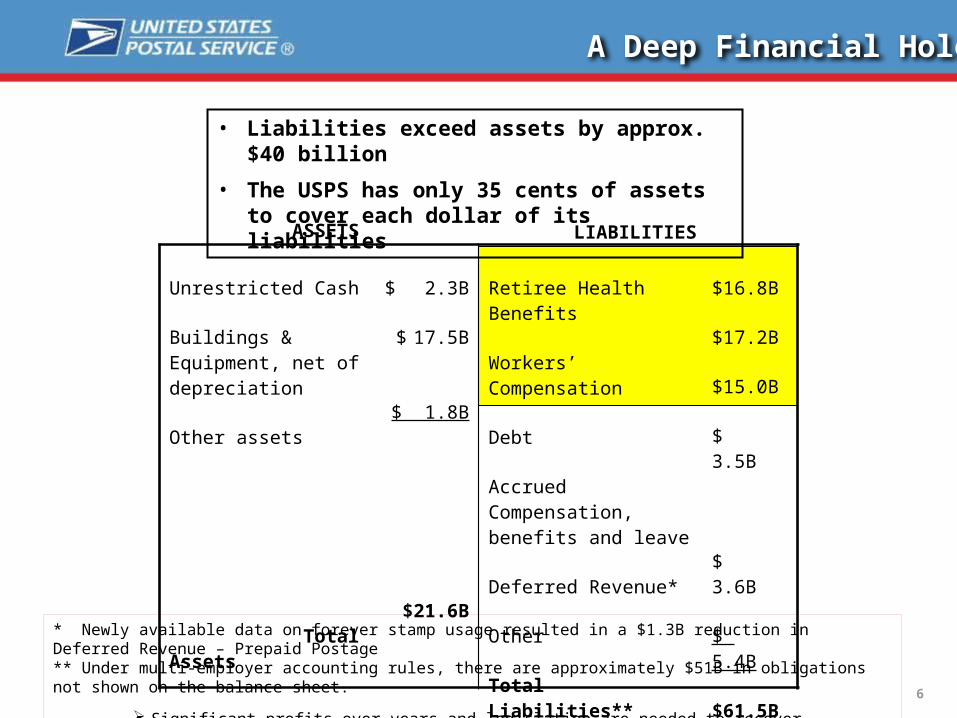
A Deep Financial Hole
Unrestricted Cash
Buildings & Equipment, net of depreciation
Other assets
Total Assets
$ 2.3B
$ 17.5B
$ 1.8B
$21.6B
Retiree Health Benefits
Workers’ Compensation
Debt
Accrued Compensation, benefits and leave
Deferred Revenue*
Other
Total Liabilities**
$16.8B
$17.2B
$15.0B
$ 3.5B
$ 3.6B
$ 5.4B
$61.5B
ASSETS LIABILITIES
• Liabilities exceed assets by approx. $40 billion
• The USPS has only 35 cents of assets to cover each dollar of its liabilities
* Newly available data on forever stamp usage resulted in a $1.3B reduction in Deferred Revenue – Prepaid Postage** Under multi-employer accounting rules, there are approximately $51B in obligations not shown on the balance sheet.
Significant profits over years and legislation are needed to recover.
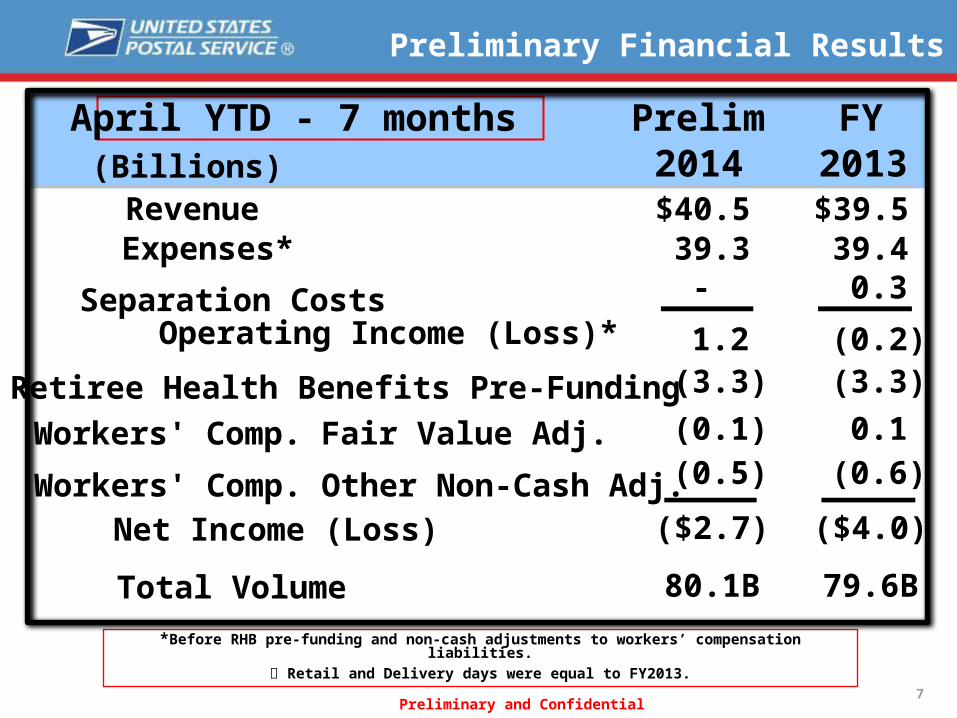
*Before RHB pre-funding and non-cash adjustments to workers’ compensation liabilities.
Retail and Delivery days were equal to FY2013.
Preliminary and Confidential
Preliminary Financial Results
April YTD - 7 months Prelim FY(Billions) 2014 2013
$39.5Revenue $40.539.4 Expenses* 39.3 0.3 Separation Costs -
(0.2) Operating Income (Loss)* 1.2 (3.3) Retiree Health Benefits Pre-Funding (3.3)
0.1 Workers' Comp. Fair Value Adj. (0.1) (0.6) Workers' Comp. Other Non-Cash Adj. (0.5)
($4.0)Net Income (Loss) ($2.7)
79.6BTotal Volume 80.1B
7
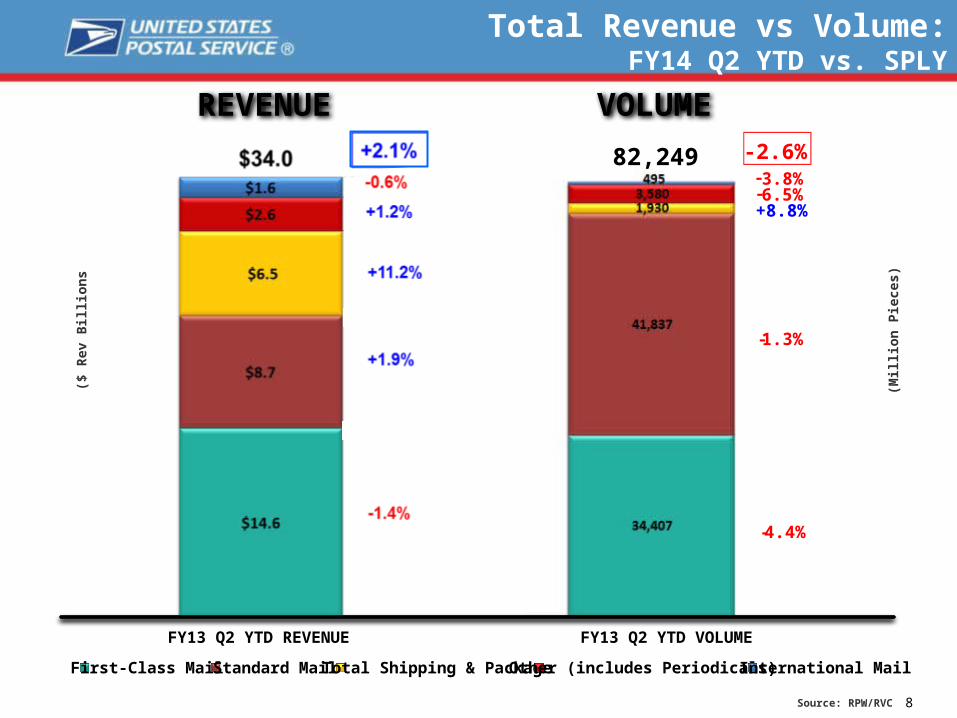
8
Total Revenue vs Volume:FY14 Q2 YTD vs. SPLY
Source: RPW/RVC
FY13 Q2 YTD VOLUME
First-Class Mail Standard Mail Total Shipping & Package Other (includes Periodicals) International Mail
(Mill
ion
Pie
ces)
- 2.6%82,249
-4.4%
+8.8%
-3.8%
-1.3%
-6.5%
FY13 Q2 YTD REVENUE
($ R
ev B
illio
ns
REVENUE VOLUME

®
CLOSING THE GAP
9
LEGISLATIVE INITIATIVES
2016 SAVINGS
OPERATIONAL INITIATIVES TRANSFORMING INFRASTRUCTURE
CONTINUOUS IMPROVEMENT
$6.0
WORKFORCE REDUCE THE UNIT COST OF LABOR INCREASED FLEXIBILITY
$2.6B
$11.1B
USPS Business Plan
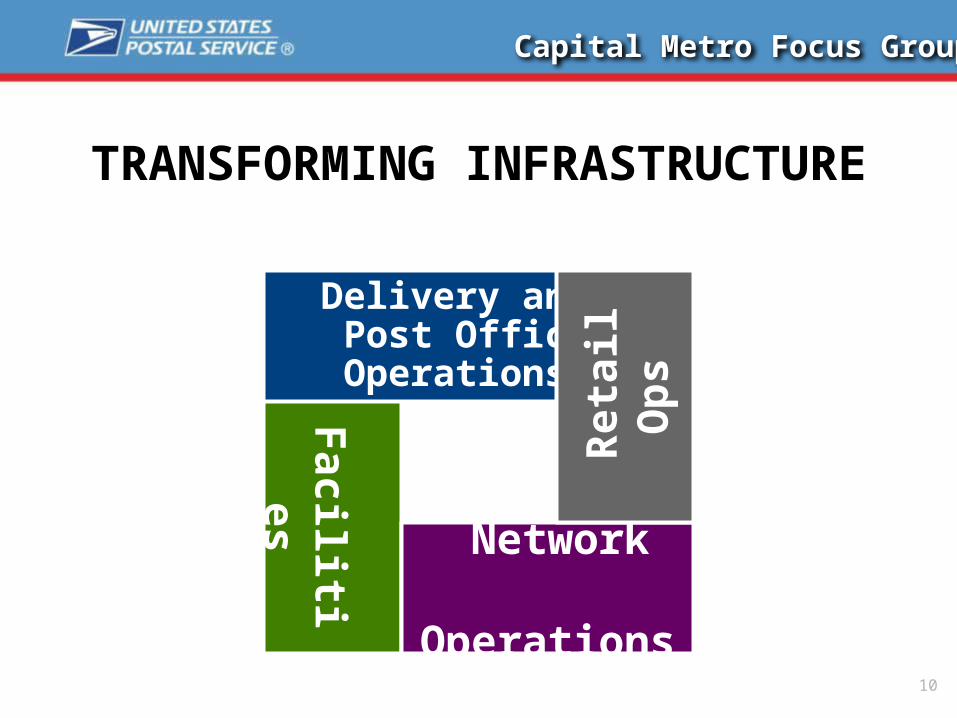
TRANSFORMING INFRASTRUCTURE
10
Capital Metro Focus Group
Facilities
Delivery and Post Office Operations
Network Operations
Ret
ail O
ps
11
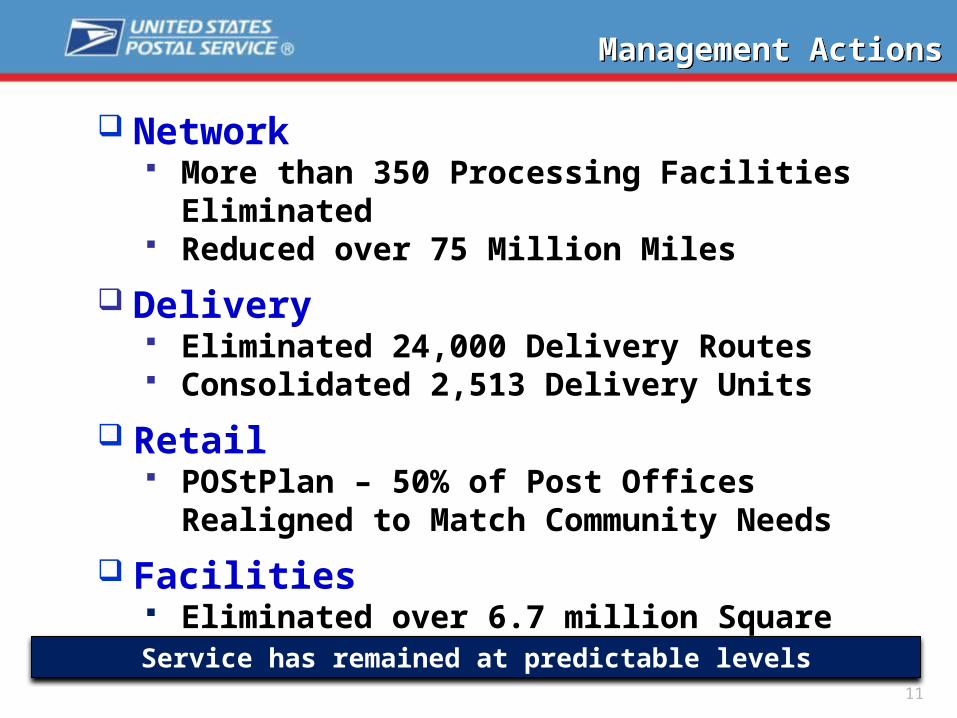
Management ActionsManagement Actions
Network More than 350 Processing Facilities Eliminated Reduced over 75 Million Miles
Delivery Eliminated 24,000 Delivery Routes Consolidated 2,513 Delivery Units
Retail POStPlan – 50% of Post Offices Realigned to
Match Community Needs
Facilities Eliminated over 6.7 million Square Feet
Service has remained at predictable levels
12
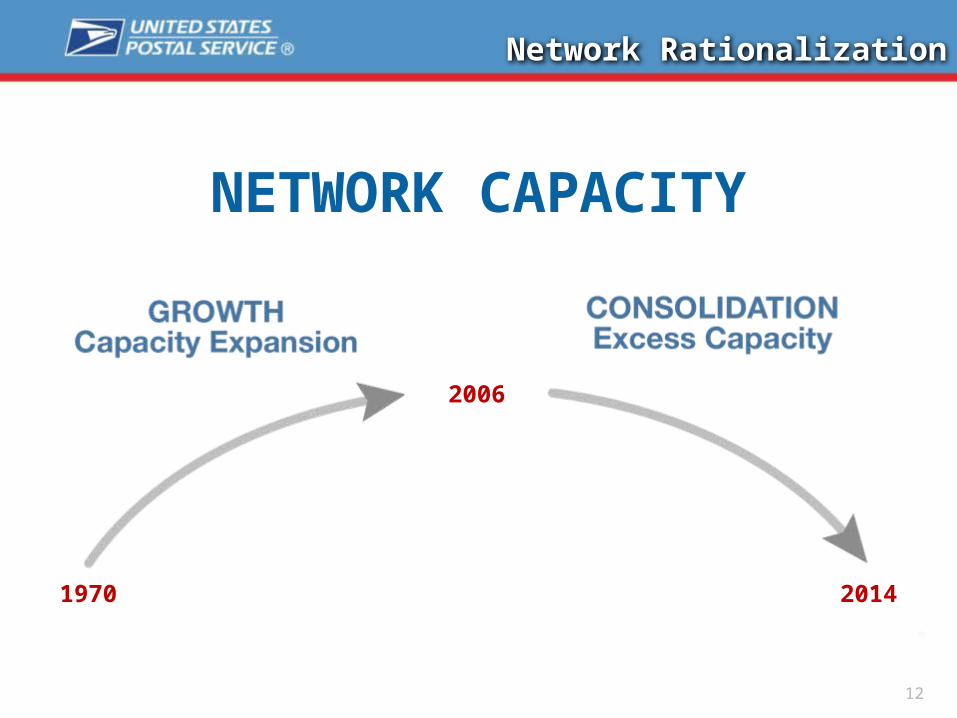
NETWORK CAPACITY
1970 2014
2006
Network Rationalization
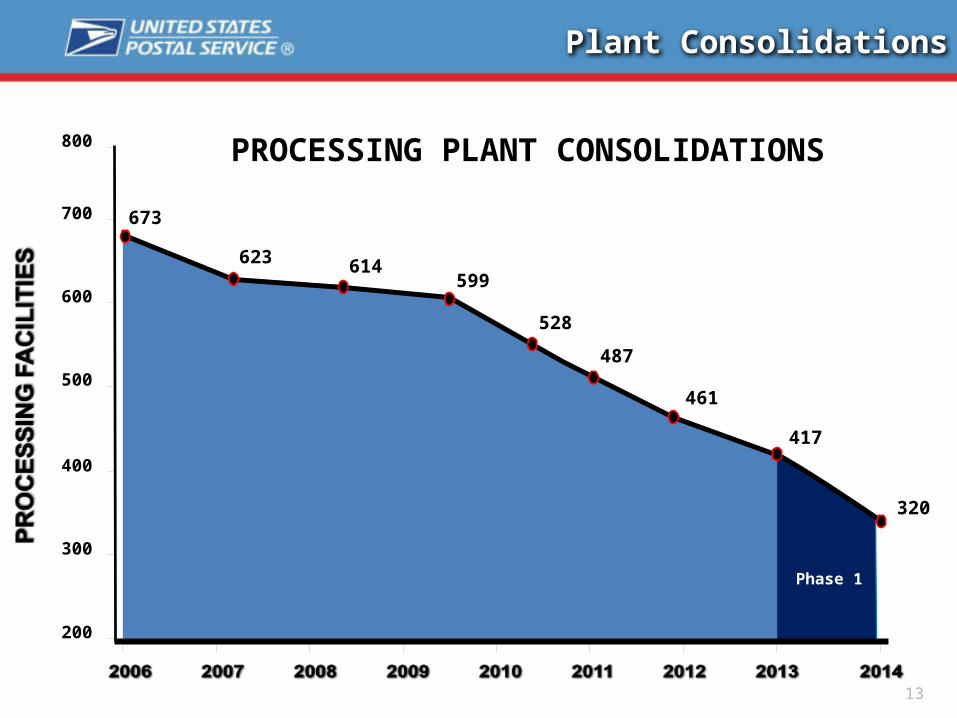
Plant Consolidations
200
300
400
500
600
700
800
Phase 1
673
623 614599
528
461
417
487
320
PROCESSING PLANT CONSOLIDATIONS
13
DELIVERY OPTIMIZATION
14
Capital Metro Focus Group

2013 OPERATING EXPENSES
TRANSPORTATION
11%
OTHER NON-PERSONNEL
15%
OTHER PERSONNEL
10%
RETAIL & CUSTOMER
SERVICE12%
DELIVERY34%
PROCESSING
18%
USPS Delivery Operations
15
USPS LARGEST COST CENTER
• 225K DELIVERY ROUTES
• 133.3M PHYSICAL DELIVERIES
• 212K VEHICLES
• 158.4B PIECES DELIVERED
• 311K LETTER CARRIERS
2013 OPERATING STATISTICS
• 1.0M NEW DELIVERIES
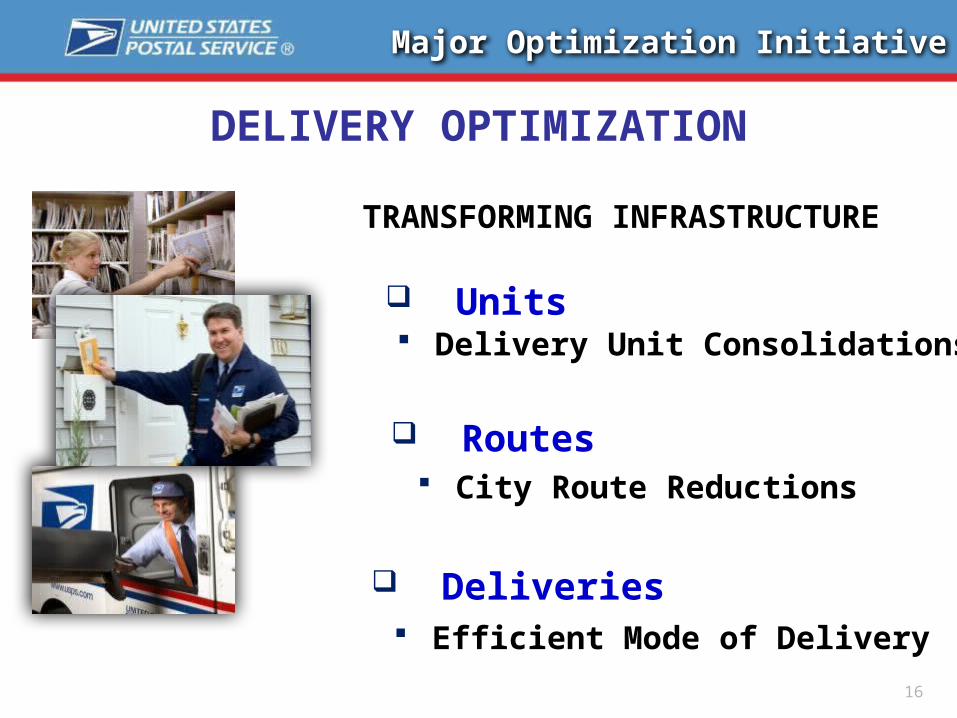
DELIVERY OPTIMIZATION
Major Optimization Initiative
TRANSFORMING INFRASTRUCTURE
Units Delivery Unit Consolidations
Routes City Route Reductions
Deliveries Efficient Mode of Delivery
16

Delivery Mode Conversions
USPS DELIVERY MODES
TOTAL STREET DELIVERIES – 133.3M 17
CURBLINE
DOOR CENTRAL
37.8M 40.5M
31%28%
55.0M
41.0%
FY 2013 GROWTH BY MODE
Door
Curbline
(61.2K)
490.9K
(6%)
47%
Centralized 607.6K 59%
Current Policy/Strategies are Driving Migration to More Efficient Delivery Mode
FY 2013 Growth % Total
Total Growth 1.04M - -
Fiscal Year 2013
18
ACCESS OPTIMIZATION
Capital Metro Focus Group
19
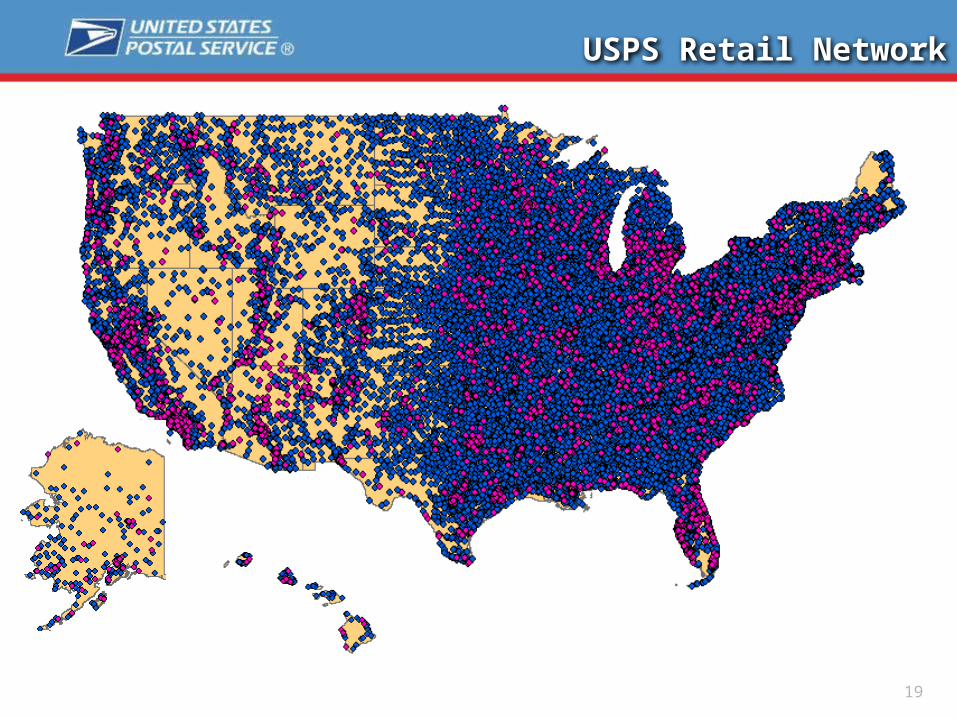
USPS Retail Network
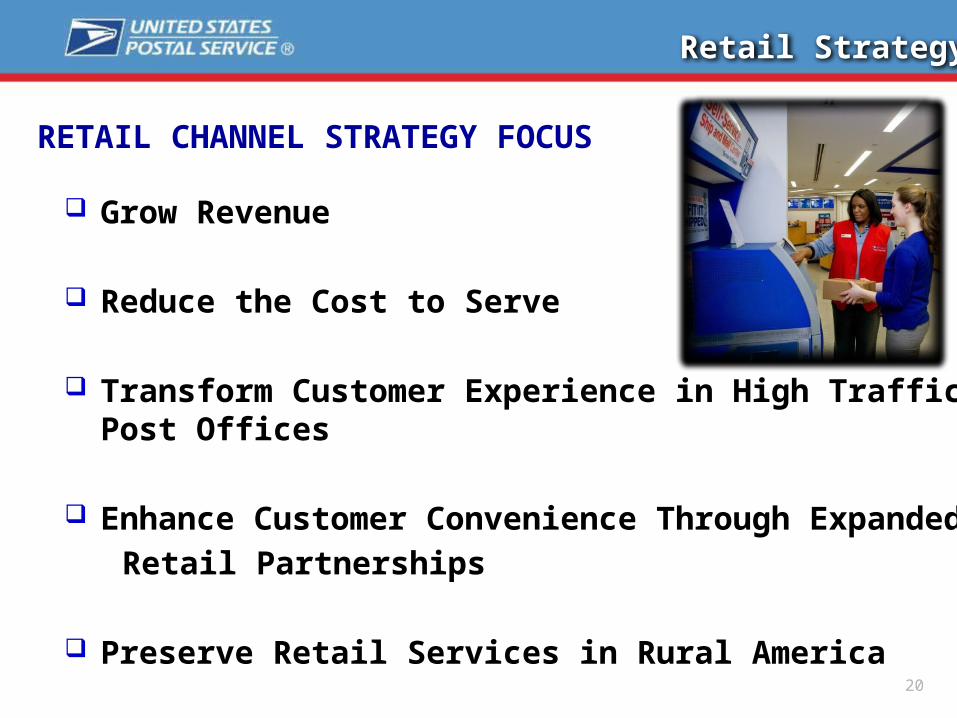
Grow Revenue
Reduce the Cost to Serve
Transform Customer Experience in High Traffic Post Offices
Enhance Customer Convenience Through Expanded
Retail Partnerships
Preserve Retail Services in Rural America
Retail Strategy
RETAIL CHANNEL STRATEGY FOCUS
20
FACILITIES MANAGEMENT & DISPOSAL
21
Capital Metro Area Focus Group
22
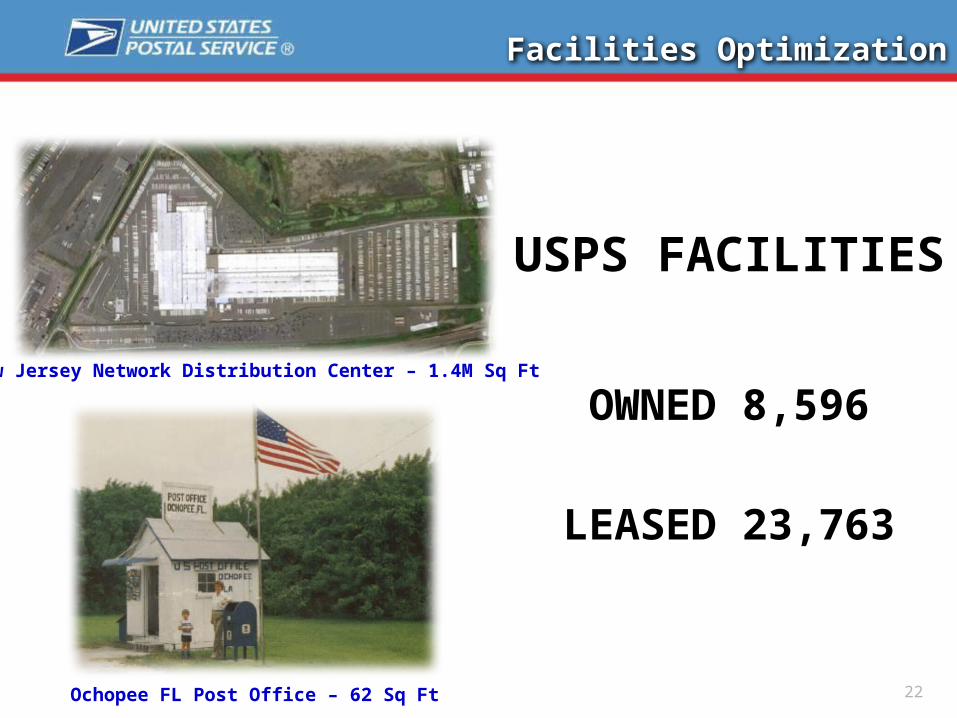
OWNED 8,596
LEASED 23,763
Facilities Optimization
USPS FACILITIES
New Jersey Network Distribution Center – 1.4M Sq Ft
Ochopee FL Post Office – 62 Sq Ft
23
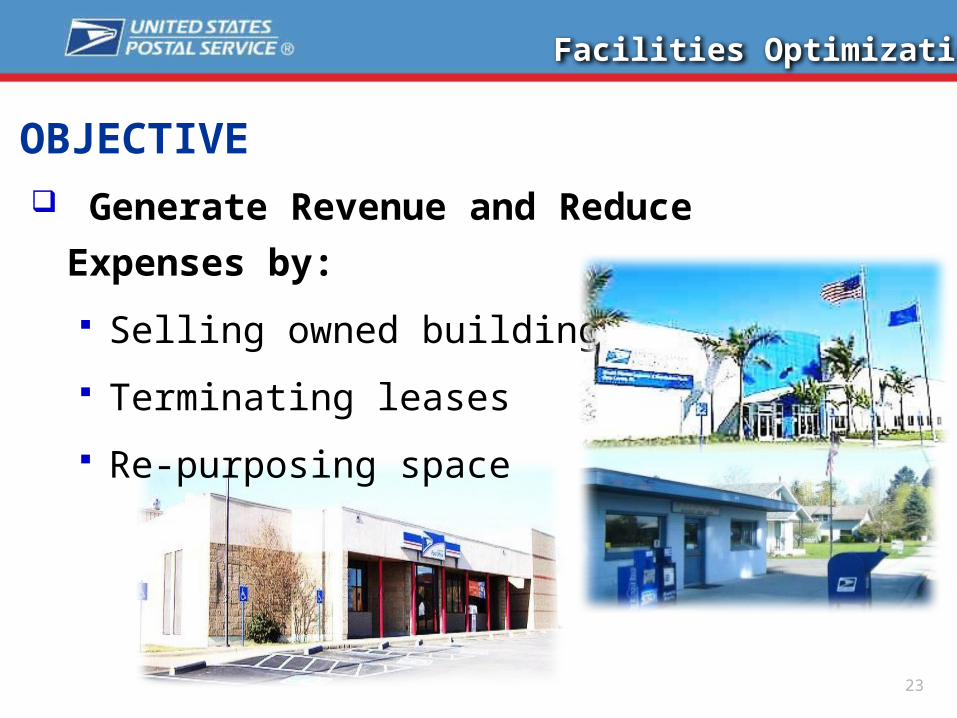
Generate Revenue and Reduce Expenses by:
Selling owned buildings
Terminating leases
Re-purposing space
OBJECTIVE
Facilities Optimization
24
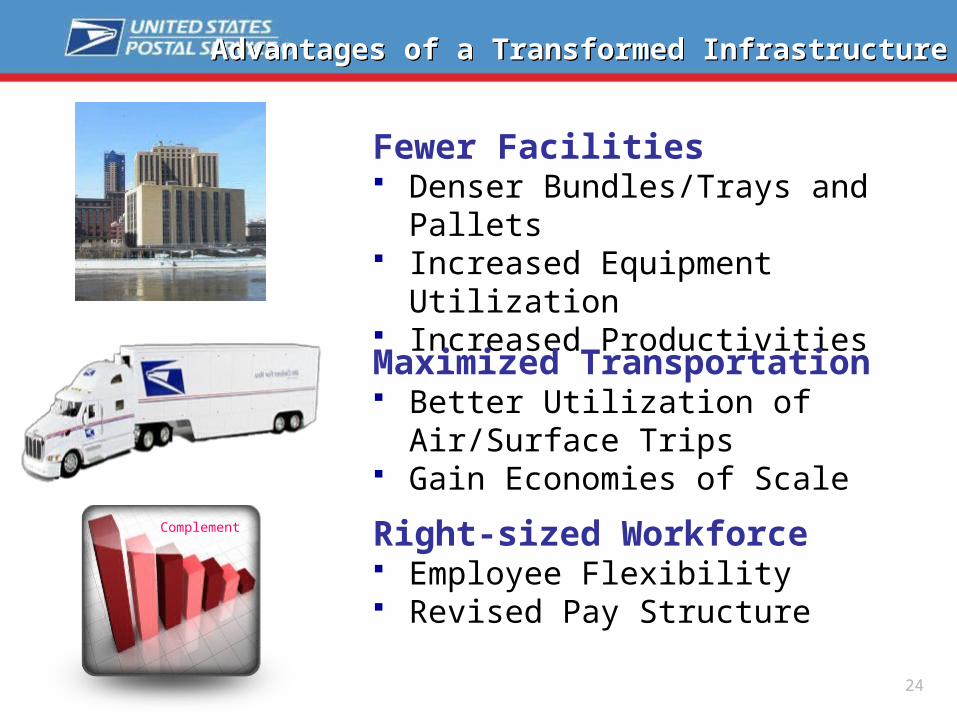
Advantages of a Transformed InfrastructureAdvantages of a Transformed Infrastructure
Fewer Facilities Denser Bundles/Trays and Pallets Increased Equipment Utilization Increased Productivities
Maximized Transportation Better Utilization of Air/Surface Trips Gain Economies of Scale
Right-sized Workforce Employee Flexibility Revised Pay Structure
Complement
25
MAJOR FY 2014 INITIATIVEDSCF STANDARD MAIL LOAD LEVELING
Capital Metro Focus Group

26
Imbalance of Mail Delivered by DOW
Postal Quarter 1 FY 13
45%
40%
35%
30%
25%
20%
15%
10%
5%
0%
Disproportionate amount of Standard Mail is scheduled for delivery on Monday resulting in:
Service Variability Operational Inefficiencies Increased Cost
SAT MON TUE WED THU FRI
27
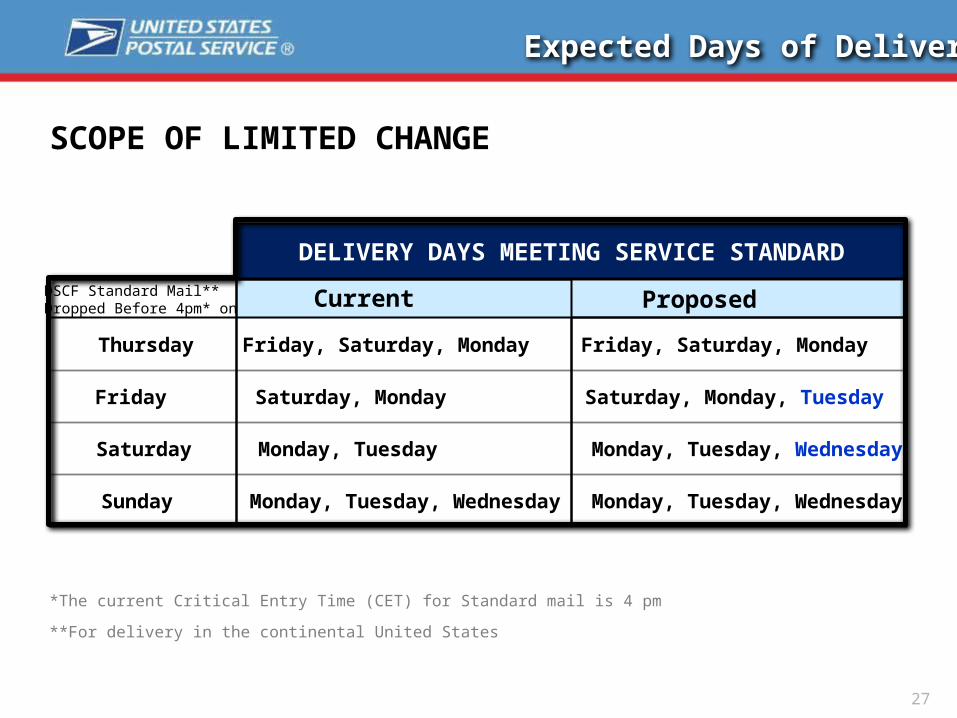
Current Proposed
Thursday Friday, Saturday, Monday Friday, Saturday, Monday
Friday Saturday, Monday Saturday, Monday, Tuesday
Saturday Monday, Tuesday Monday, Tuesday, Wednesday
Sunday Monday, Tuesday, Wednesday Monday, Tuesday, Wednesday
*The current Critical Entry Time (CET) for Standard mail is 4 pm
**For delivery in the continental United States
DSCF Standard Mail**Dropped Before 4pm* on
DELIVERY DAYS MEETING SERVICE STANDARD
Expected Days of Delivery
SCOPE OF LIMITED CHANGE
28
Expected Days of Delivery
WHAT DOESN’T CHANGE
Standard mail dropped at a DDU does not change
Standard mail dropped at a NDC does not change
EDDM Retail does not change
Periodical/Newspaper processing does not change
First-Class does not change
Priority does not change
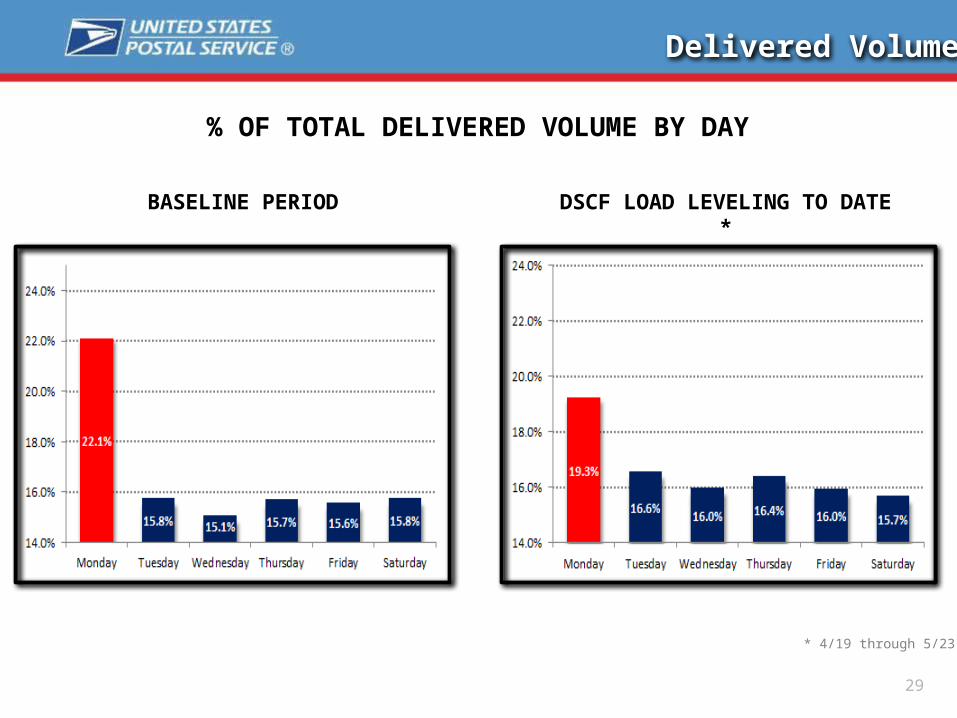
Delivered Volume
29
% OF TOTAL DELIVERED VOLUME BY DAY
BASELINE PERIOD DSCF LOAD LEVELING TO DATE *
* 4/19 through 5/23

Service Performance
30
DSCF STANDARD LETTERS
DSCF STANDARD FLATS
4/12 – 5/17
4/12 – 5/17

31
Standard DSCF Flats
April 11 – May 23
Friday Start-the-Clock
% of Total 23.94% 53.36% 19.60% 2.11% 0.57% 0.20% 0.21%
Cumulative 23.94% 77.30% 96.91% 99.02% 99.59% 99.79% 100.00%
Sat Mon Tue Wed Thu Fri Sat0%
10%
20%
30%
40%
50%
60%
Days to Delivered
Perc
ent o
f Tot
al
Service Variance
Day 1 – Saturday 23.94%Day 2 – Monday 53.36%Day 3 – Tuesday 19.60%
DSCF Standard Mail Load Leveling
Results are Promising Mail Processing working to capacity Reducing average hours per route Balanced workload with consistent service performance
Controls and Monitoring Facility Audits New data driven diagnostic reports Address the Vital Few Opportunities Operational Tiger Teams for site visits and improvement
recommendations
32
33
Benefits
Consistent Delivery Times by Day of the Week
Cost Containment – Maintain Affordable Prices
Predictable and Reliable Service
Less Competition in the Mailbox
Benefit to Mailers and Customers
Increase Visibility

LEVERAGING TECHNOLOGY
34
Capital Metro Focus Group
TO DRIVE BUSINESS VALUE
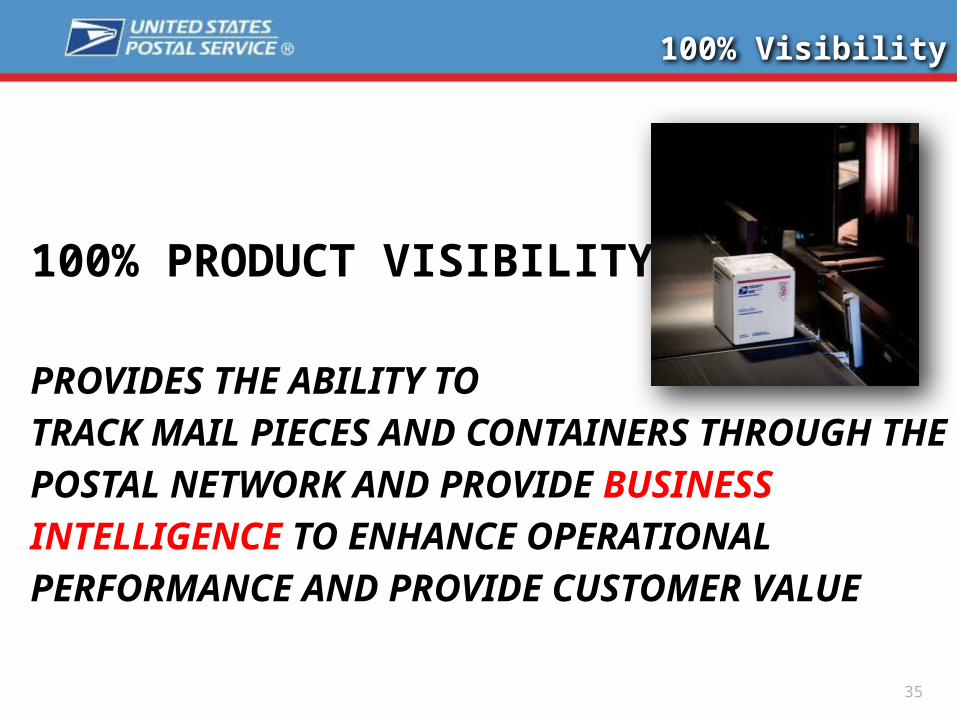
100% PRODUCT VISIBILITY
PROVIDES THE ABILITY TO TRACK MAIL PIECES AND CONTAINERS THROUGH THE POSTAL NETWORK AND PROVIDE BUSINESS INTELLIGENCE TO ENHANCE OPERATIONAL PERFORMANCE AND PROVIDE CUSTOMER VALUE
35
100% Visibility
36
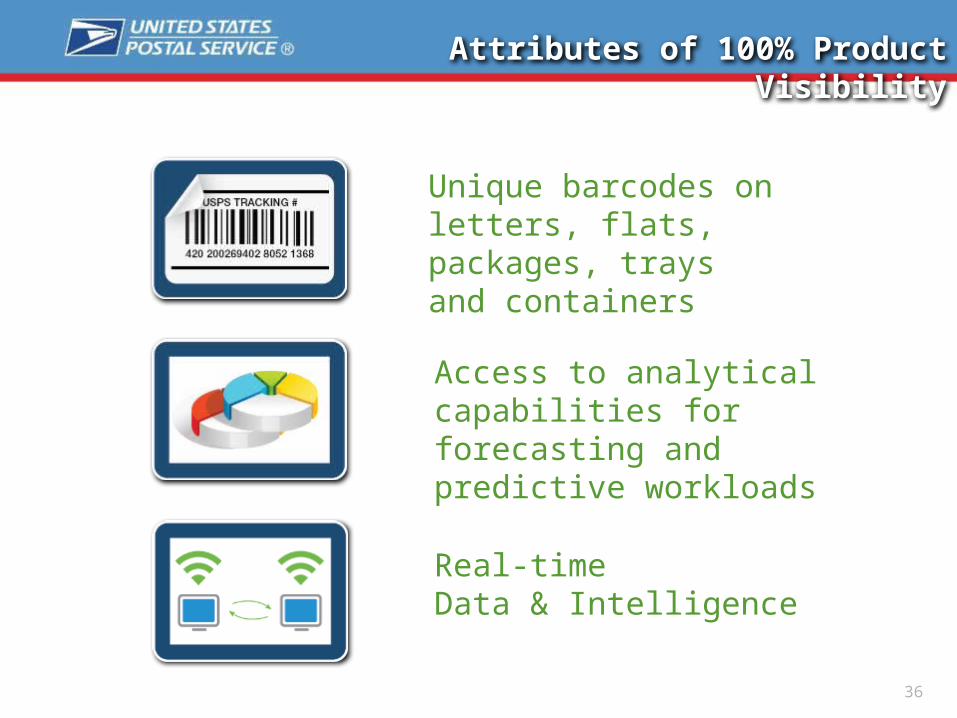
Attributes of 100% Product Visibility
Unique barcodes on letters, flats, packages, trays and containers
Access to analytical capabilities for forecasting and predictive workloads
Real-timeData & Intelligence
37
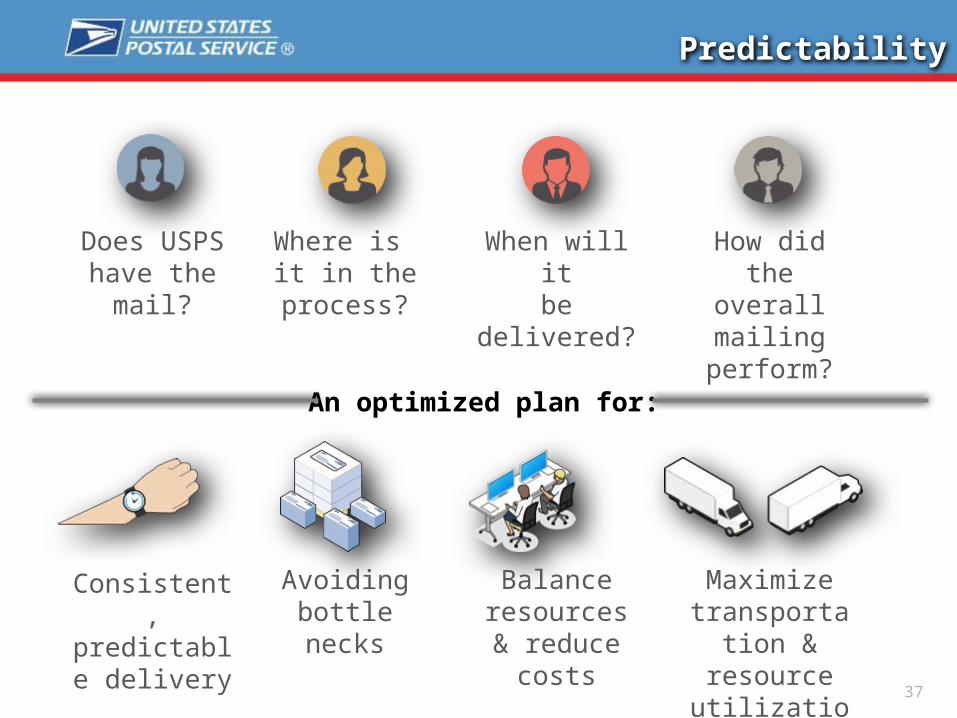
Predictability
Does USPShave the
mail?
Where is it in the process?
When will itbe
delivered?
How did the overall mailing
perform?
An optimized plan for:
Consistent, predictable
delivery
Avoidingbottle necks
Maximize transportation & resource
utilization
Balance resources & reduce costs

38
Predictable and Measureable
Does USPShave the
mail?
Where is it in the process?
When will itbe
delivered?
How did the overall mailing
perform?
An optimized plan for:
Consistent, predictable
delivery
Avoidingbottle necks
Response Rates & ROI
Balance resources & reduce costs
Business Intelligence Enhances the Performance
& Value of Your Mailings
HOW?
IncreasingVisibility ThroughTechnology
39
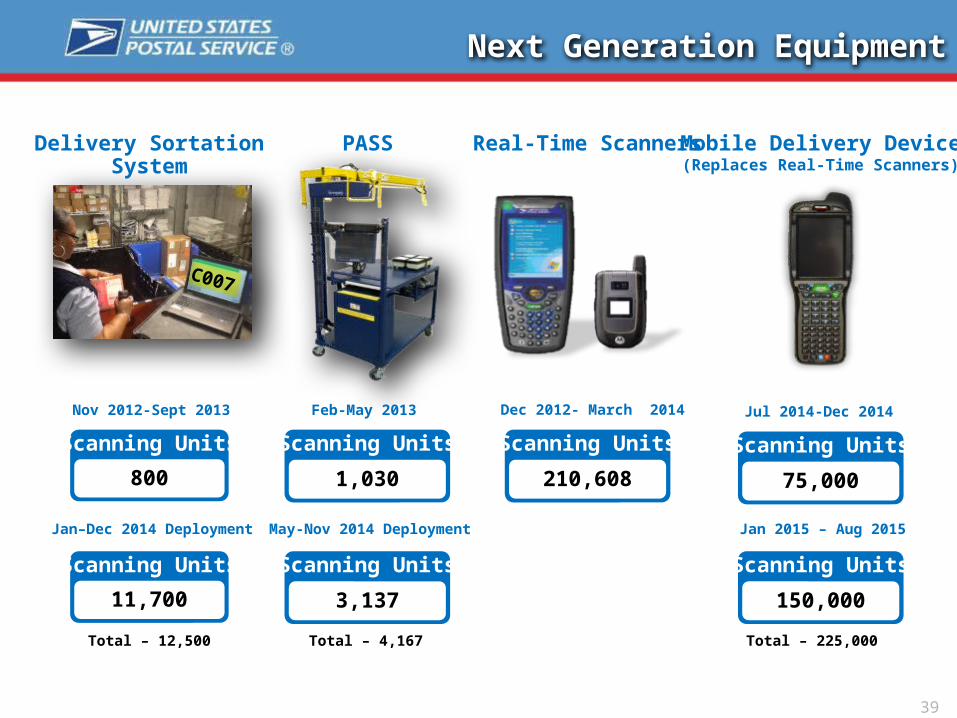
Next Generation Equipment
C007
Nov 2012-Sept 2013
Delivery Sortation System
Scanning Units
800
Dec 2012- March 2014Feb-May 2013
Scanning Units
1,030
PASS Real-Time Scanners
Jan–Dec 2014 Deployment
Scanning Units
11,700
Scanning Units
3,137
Scanning Units
210,608
May-Nov 2014 Deployment
Total – 12,500 Total – 4,167
Jul 2014-Dec 2014
Mobile Delivery Device(Replaces Real-Time Scanners)
Scanning Units
75,000
Scanning Units
150,000
Jan 2015 – Aug 2015
Total – 225,000
40
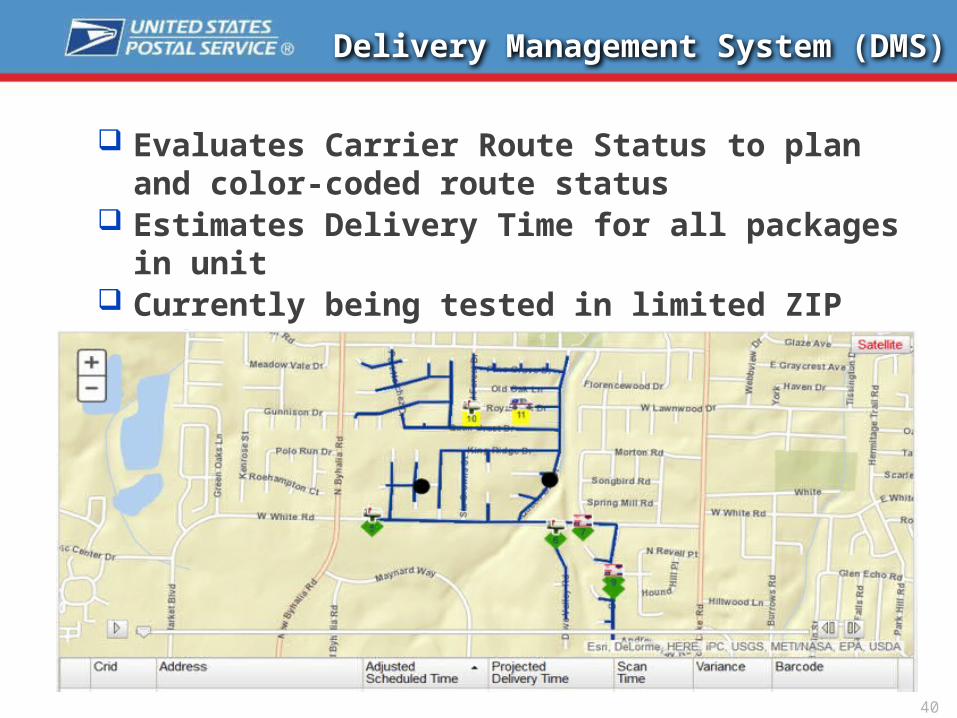
Delivery Management System (DMS)
Evaluates Carrier Route Status to plan and color-coded route status
Estimates Delivery Time for all packages in unit Currently being tested in limited ZIP Codes
41
Predictable and Measureable
Does USPShave the
mail?
Where is it in the process?
When will itbe
delivered?
How did the overall mailing
perform?
An optimized plan for:
Consistent, predictable
delivery
Avoidingbottle necks
Response Rates & ROI
Balance resources & reduce costs
Business Intelligence Enhances the Performance
& Value of Your Mailings
HOW?
Full ServiceIntelligent MailStrategies
42
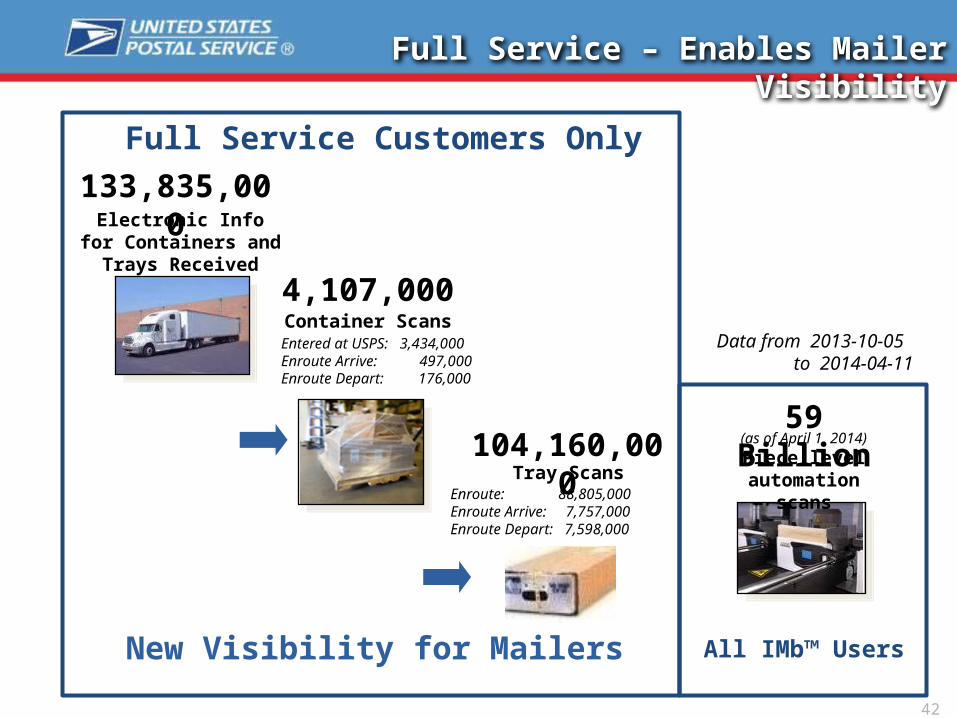
Full Service – Enables Mailer Visibility
Electronic Info for Containers and Trays
Received
Piece level automation scans
Full Service Customers Only
All IMb™ Users
133,835,000
59 Billion(as of April 1, 2014)
Container Scans
Tray Scans
Entered at USPS: 3,434,000Enroute Arrive: 497,000Enroute Depart: 176,000
4,107,000
104,160,000Enroute: 88,805,000Enroute Arrive: 7,757,000Enroute Depart: 7,598,000
New Visibility for Mailers
Data from 2013-10-05 to 2014-04-11

43
Full Service IMb
We Are Committed to Full Implementation of IMb
ACS Recordsfor all Mail
F R E ECheck-in
at BMEU
Electronic
Mail Unit PrivilegesFor Full Service Mailing Sites
DetachAssessments
Based on Trends
Move Update
WHY?
Cost Effective,ConsistentReliable Service
43

GROWTHOPPORTUNITIES
44
Capital Metro Focus Group
Continue to Optimize the Value of Infrastructure
45
Enhance the value of Direct Mail and Catalogs
Increase Marketshare of Packages
Innovate across USPS Business Platforms
Growth Opportunities

46
Growing Direct Mail – The Challenge
Today’s Challenge
Keeping mail relevant in an online world
47
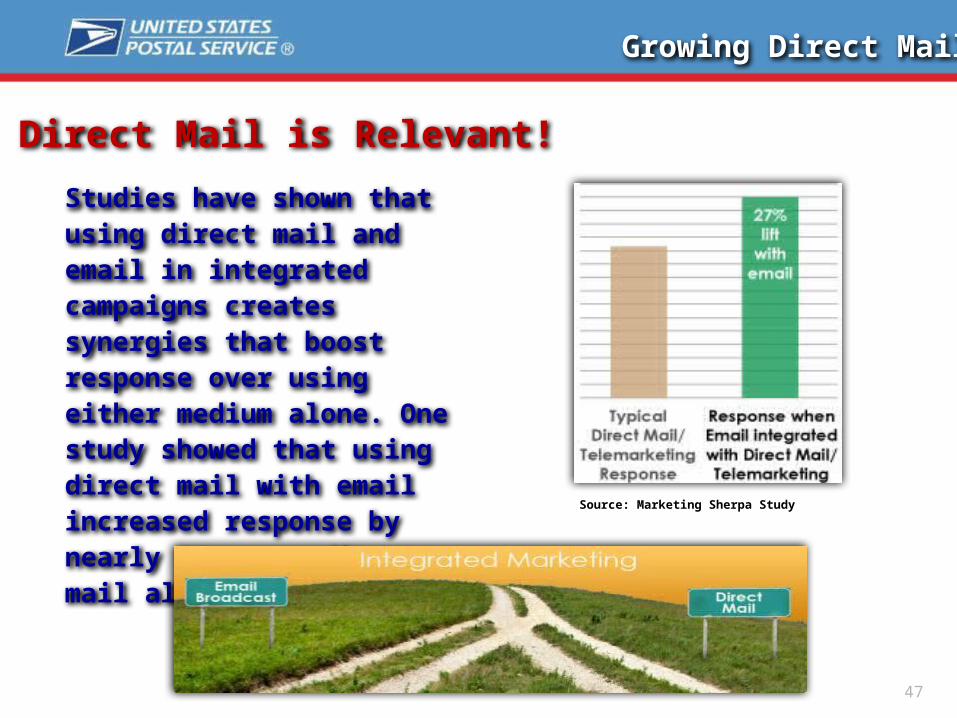
Growing Direct Mail
Studies have shown that using direct mail and email in integrated campaigns creates synergies that boost response over using either medium alone. One study showed that using direct mail with email increased response by nearly 30% over direct mail alone.
Direct Mail is Relevant!
Source: Marketing Sherpa Study

48
Mobile Commerce
Mobile Technology Helping Drive Long-Term Value with Direct Mail and Catalogs.
• Smartphones and tablets interact with the printed page
• Direct Mail or Catalog becomes “catalyst” for mobile commerce
• Direct Mail and Catalog integration with technology increases:• Relevance• Effectiveness• Convenience• Responsiveness• Engagement
NFCMobile Barcode Image Recognition Augmented Reality
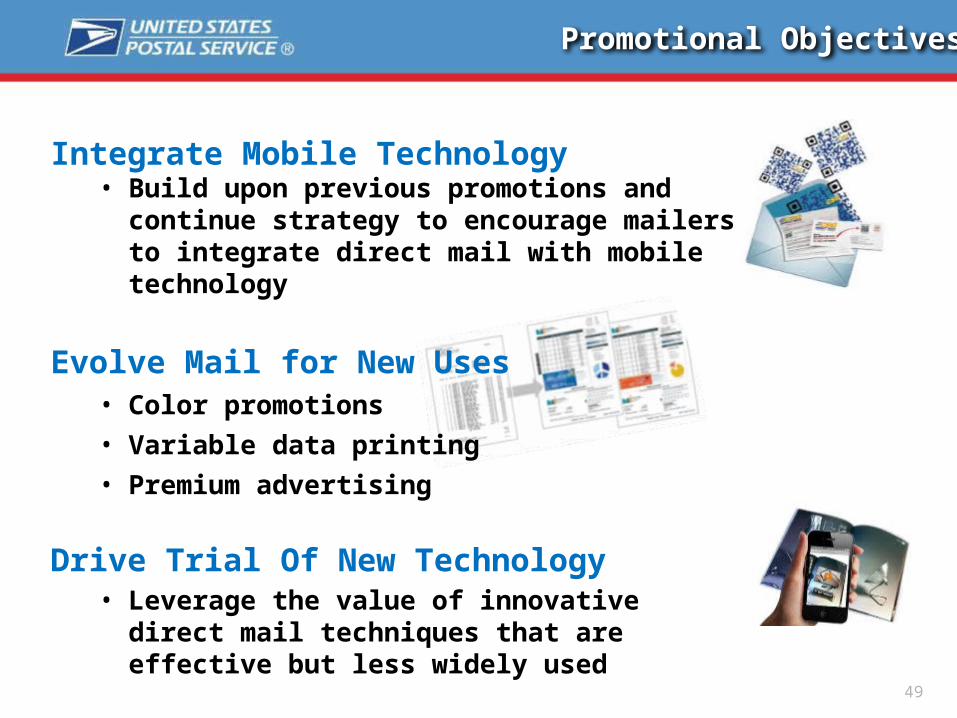
Integrate Mobile Technology• Build upon previous promotions and continue
strategy to encourage mailers to integrate direct mail with mobile technology
Evolve Mail for New Uses• Color promotions
• Variable data printing
• Premium advertising
Drive Trial Of New Technology • Leverage the value of innovative direct mail
techniques that are effective but less widely used
Promotional Objectives
49
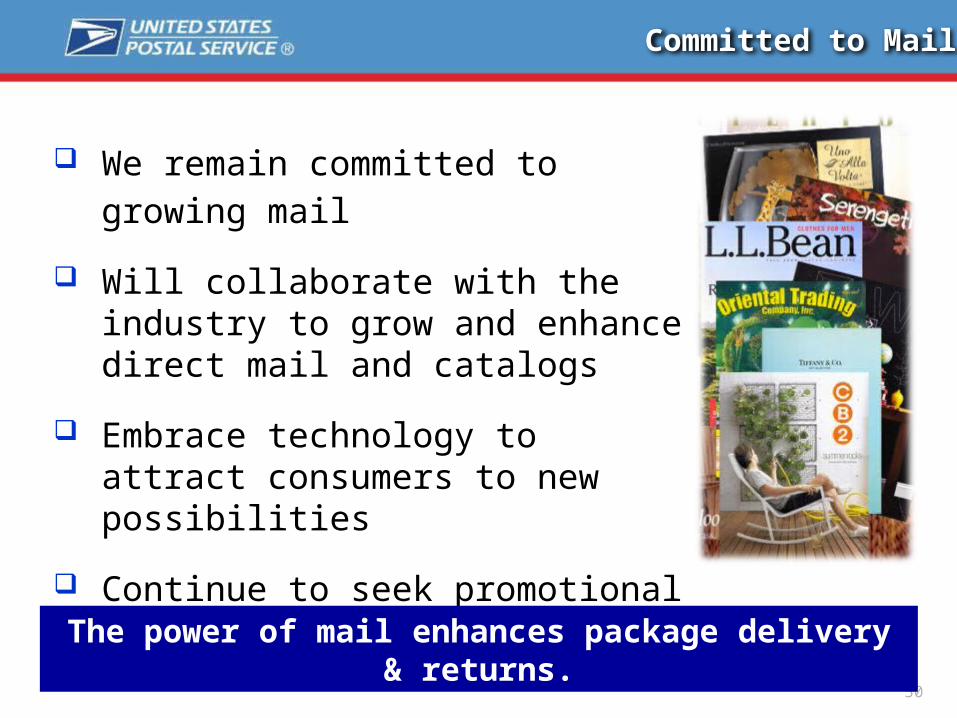
Committed to Mail
We remain committed to growing mail
Will collaborate with the industry to grow and enhance direct mail and catalogs
Embrace technology to attract consumers to new possibilities
Continue to seek promotional ideas from customers
50
The power of mail enhances package delivery & returns.
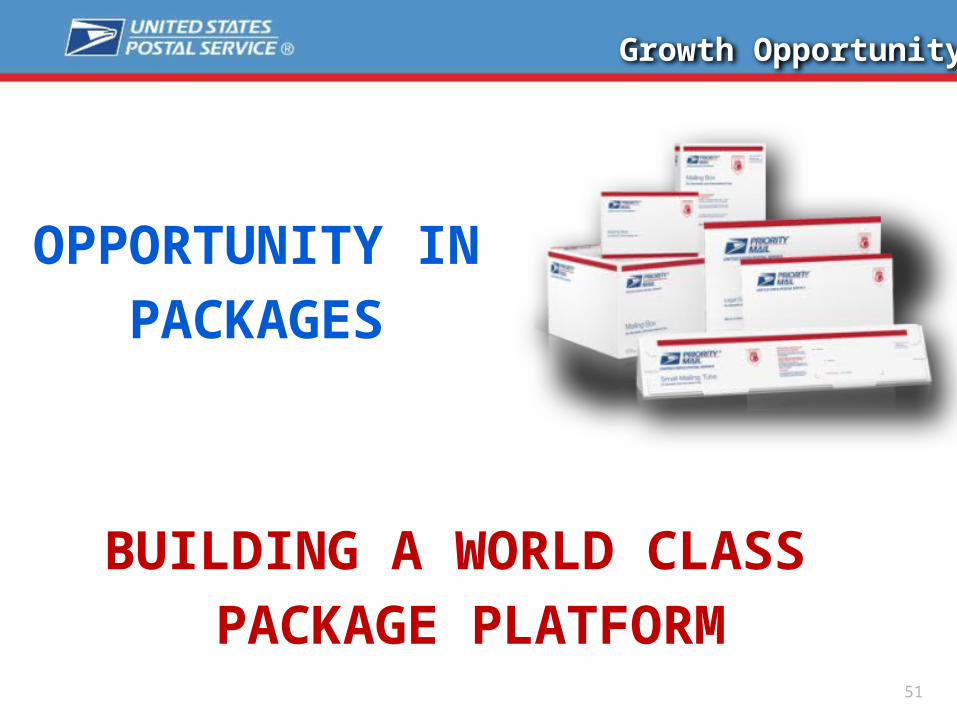
OPPORTUNITY IN
PACKAGES
BUILDING A WORLD CLASS
PACKAGE PLATFORM
Growth Opportunity
51
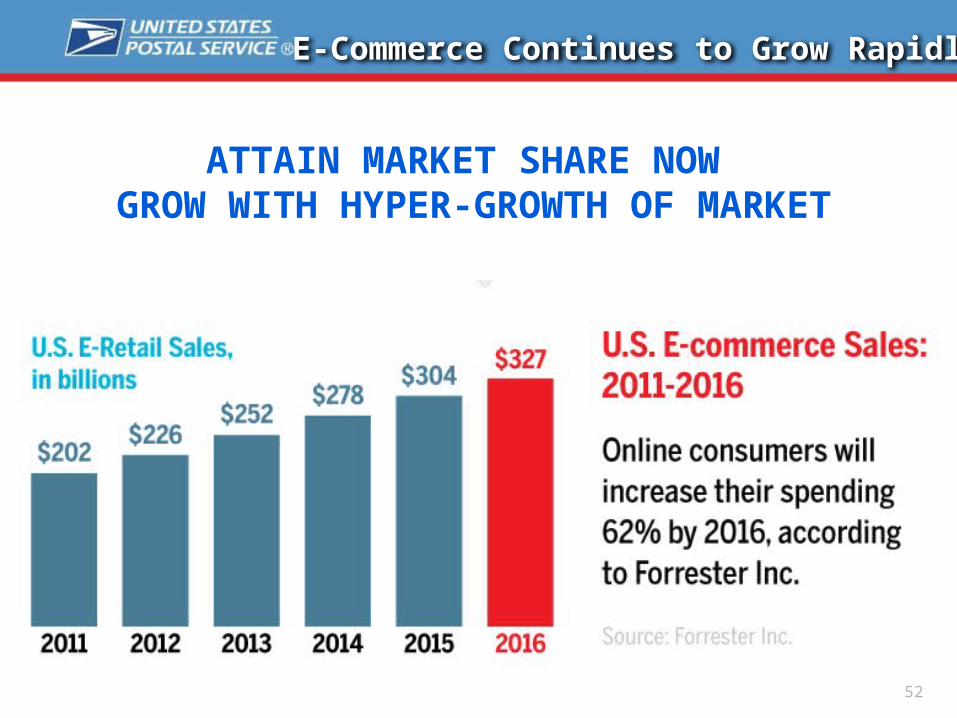
ATTAIN MARKET SHARE NOW GROW WITH HYPER-GROWTH OF MARKET
E-Commerce Continues to Grow Rapidly
52

53
COLLABORATION & OUTREACH
Capital Metro Focus Group
54
USPS – Industry
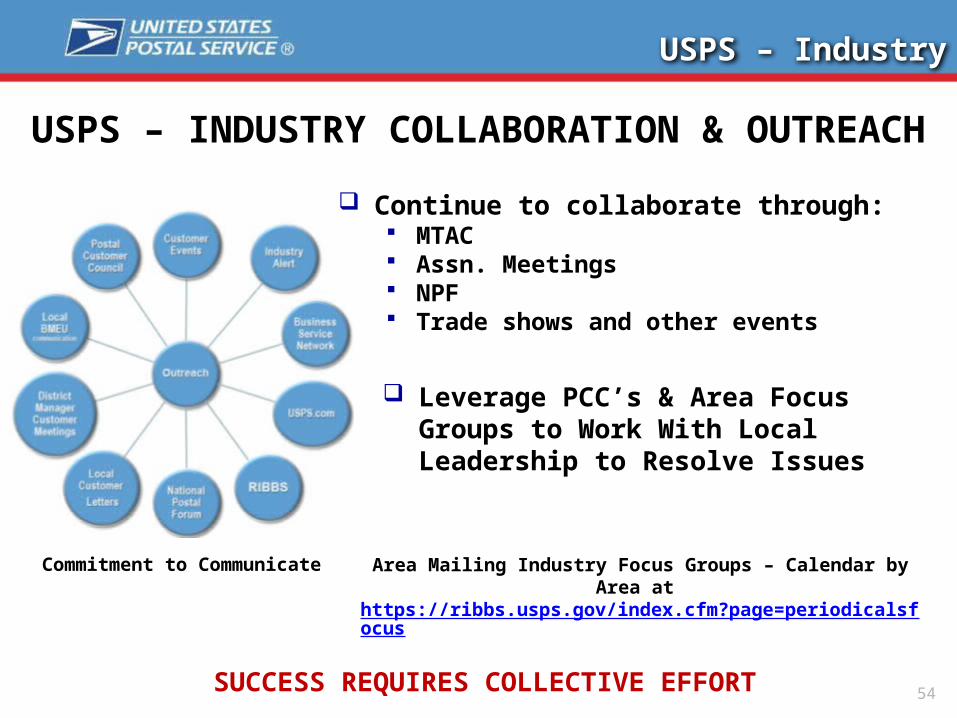
USPS – INDUSTRY COLLABORATION & OUTREACH
Commitment to Communicate
SUCCESS REQUIRES COLLECTIVE EFFORT
Continue to collaborate through: MTAC Assn. Meetings NPF Trade shows and other events
Leverage PCC’s & Area Focus Groups to Work With Local Leadership to Resolve Issues
Area Mailing Industry Focus Groups – Calendar by Area at https://ribbs.usps.gov/index.cfm?page=periodicalsfocus
55
Thank YouQuestions?
Thank YouQuestions?
Capital Metro Focus Group