
JUNE 30, 2013 - getkapt.com · Market value of assets of the Program’s trust fund supplied by the...
23
ANNUAL ACTUARIAL VALUATION OF THE PREPAID TUITION TRUST FUND FOR KENTUCKY’S AFFORDABLE PREPAID TUITION JUNE 30, 2013 Prepared by John T. Condo, FSA, MAAA, Ph.D. Actuarial Resources Corporation of GA
Transcript of JUNE 30, 2013 - getkapt.com · Market value of assets of the Program’s trust fund supplied by the...
ANNUAL ACTUARIAL VALUATION OF THE PREPAID TUITION TRUST FUND FOR KENTUCKY’S AFFORDABLE
PREPAID TUITION
JUNE 30, 2013
Prepared by John T. Condo, FSA, MAAA, Ph.D. Actuarial Resources Corporation of GA

Atlanta · Birmingham · Kansas City · Los Angeles · Tampa · Washington, D.C
September 16, 2013
Mr. David Lawhorn Lead Program Administrator Kentucky’s Affordable Prepaid Tuition 100 Airport Road, P.O. Box 798 Frankfort, KY 40601
Dear Mr. Lawhorn:
We have completed our actuarial analysis of the Prepaid Tuition Trust Fund ("the Fund") for Kentucky’s Affordable Prepaid Tuition ("KAPT" or "the Program") as of June 30, 2013. This report presents our findings with respect to the Fund's expected cash flows and adequacy of the Fund in light of assets in the Fund. The analysis of the funding of the Program was prepared for the KAPT Board for the purpose of assessing the actuarial soundness of the Fund as required by statute. The analyses have been prepared in accordance with generally accepted actuarial principles and practices commonly applicable to similar types of arrangements. Currently the expected value of liabilities is $171,985,473 and the value of assets (including contract revenues) is $119,082,449 for a difference of ($52,903,025) or 30.8% liabilities. These results are based on assumptions approved by KAPT personnel after consultation with us. We appreciate the opportunity to serve the Commonwealth of Kentucky.
Very truly yours,
John T. Condo, FSA, MAAA, Ph.D.
4080 McGinnis Ferry Road, Suite 901 Alpharetta, GA 30005-4143
PH: (770) 752 - 5656 FAX: (770) 752 - 5650 4080 McGinnis Ferry Road, Suite 901 Alpharetta, GA 30005-4143
PH: (770) 752 - 5656 FAX: (770) 752 - 5650

Atlanta · Birmingham · Kansas City · Los Angeles · Tampa · Washington, D.C
TABLE OF CONTENTS
Section Page
I. Executive Summary 1
II Reliances & Compliance with Actuarial Standards 3
III. Description of the Program 4
IV. Summary of Contract Data and Current Assets 6
V. Actuarial Methods and Assumptions 8
VI. Status of the Fund as of June 30, 2013 13
VII. Effect of Future Contract Sales 15
VIII. Sensitivity Testing 16
IX. Monte Carlo Analysis 17
X. Change in Actuarial Assumptions 19
XI. Expected Use of Funds 20

1
I. EXECUTIVE SUMMARY The following are the key findings of our analysis. Status of the Program The KAPT Fund’s liabilities exceed its assets by $52,903,025 resulting in a deficit. This result is based on the assumption that the Program will not sell any additional contracts. Based on actuarial estimates, the Plan’s assets will be exhausted in fiscal year 2020, at which time the liability of the Plan becomes a General Obligation of the Commonwealth of Kentucky. Per KRS 164A.708, once a real liability is expected to accrue, the General Assembly shall appropriate the necessary funds to meet the liability. Over the remaining estimated life of the program, through fiscal year 2032, actuarial estimates show the Commonwealth of Kentucky will need to transfer approximately $95 million. If the Program resumes the sale of appropriately priced contracts, then the deficit is projected to be cured in as few as 10 years, depending on the number of contracts sold. This issue is addressed more fully in the Effects of Future Contract Sales section of this report. Furthermore we note that the results above are based on a single baseline estimate of future experience. Potential volatility and a historical-basis statistical measure of results are addressed more fully in the Monte Carlo Modeling section of this report. The table following summarizes results for June 30, 2013:
Value as of Assets and June 30, 2013 Liabilities
Invested Assets & Contract Receivables $118,890,237 Other Receivables & Accruals 192,212 Actuarial Liabilities 171,914,895 Other Liabilities 70,578 Actuarial Deficit ( $52,903,025) Deficit as a Percent of Liabilities 30.8%

2
Key Assumptions Key economic assumptions are listed below.
Key Assumptions
Yield on Investments All Years 5.94% Investment returns are before expenses.
Key Assumptions (Continued…)
Tuition Inflation All Classes of Contracts All Years 6.75%
Expenses Initial Expenses $487,060 This amount is allocated on a per
contract basis and is projected to decrease over time as the number of contracts decreases.
The tuition inflation assumptions are based on a combination of statistical models of tuition increases and on actuarial judgment. Our statistical models use information from the past 20 years.

3
II. RELIANCES & COMPLIANCE WITH ACTUARIAL STANDARDS OF PRACTICE
In making the projections on which this report is based, we relied on the following information supplied to me as indicated below.
Tuition amounts at Kentucky colleges and universities, public and private, supplied by the staff of KAPT
Program expenses, supplied by the staff of KAPT
Market value of assets of the Program’s trust fund supplied by the Program’s investment advisor, Callan Associates, Inc.
Inventory of KAPT contracts by category, enrollment period, payment method and anticipated matriculation year, supplied by the Program’s records administrator, Intuition Solutions, Inc.
Assumptions regarding future investment returns on the Program’s trust fund, supplied by the Program’s investment advisor, Callan Associates, Inc.
Assumptions regarding the Program’s anticipated asset allocation, supplied by the Program’s investment advisor, Callan Associates, Inc.
There are no actuarial standards of practice that apply specifically to prepaid tuition programs. However, there are two general standards that we believe apply:
Actuarial Standard of Practice #23 “Data Quality”. This standard sets guidelines on review of data supplied by a third party. We have performed reasonableness and consistency checks on the data supplied to us by personnel of the Program and by the records administrator, and are in compliance with this standard. Our review of the data was not an audit of the data.
Actuarial Standard of Practice #41 “Actuarial Communications”. This standard sets general guidelines for actuarial communications. This report is in compliance with Standard #41.

4
III. DESCRIPTION OF THE PROGRAM
The Program was created in 2000 by the Kentucky Legislature "to provide access to participating institutions for the qualified beneficiaries and to provide students and their parents’ economic protection against rising tuition costs." The Legislature created the Prepaid Tuition Trust Fund in the custody of the state treasurer for administration by a board of directors. “The fund shall consist of payments received from prepaid tuition contracts. Income earned from the investments of the fund shall remain in the fund and be credited to it.” Administration of the Program and board governance now resides with the Kentucky Higher Education Assistance Authority. Description of Contracts & Payment Options There are three types of contracts.
The Value Plan, which provides in-state tuition at community colleges and technical colleges. Purchasers have the option of buying one year or two years of tuition under the Value Plan.
The Standard Plan, which provides in-state tuition at any of Kentucky’s eight public universities. The price for Standard Plan contracts is based on the most expensive public university. Purchasers have the option of buying from one year’s tuition to five years’ tuition in one-year increments.
The Premium Plan, which is designed to cover the cost of average tuition at Kentucky’s private colleges and universities. The cost of the Premium Plan contracts is based on the enrollment weighted-average tuition of Kentucky’s private colleges and universities and increases at the same rate as tuition increases at the University of Kentucky. Similar to the Standard Plan, purchasers may purchase one year’s tuition to five years’ tuition in one-year increments.
Contracts are available to students who are at least two years away from initial college enrollment. Benefits can be used at any institution of higher education that is accredited by the U.S. Department of Education anywhere in the country. Benefits paid for out-of-state institutions or graduate schools will not exceed the benefits provided for Kentucky undergraduate benefits described above. Each contract type has three main types of payment options:
Lump Sum Payment
Installment Payments, which come in several varieties: o Monthly payments over three years o Monthly payments over five years o Monthly payments over seven years o Monthly payments until the beneficiary’s projected year of enrollment

5
A combination of a Lump Sum down payment plus Installment Payments, where the installment payments are available in the following options:
o Monthly payments over three years o Monthly payments over five years o Monthly payments over seven years
Residency Requirements There are no residency requirements imposed on the purchasers of KAPT contracts. KAPT beneficiaries can be either:
Kentucky residents at the time the application is signed or
Intend to attend college in Kentucky. Refunds For cancellations other than death, disability, or receipt of a scholarship, the purchaser receives a refund of payments minus administrative charges and cancellation fees if the cancellation occurs before July 1 of the projected year of initial college enrollment. Cancellations for reasons other than death, disability, or receipt of a scholarship that occur on or after July 1 of the projected year of initial college enrollment will receive the tuition payout value of the contract minus administrative and cancellation fees. If the beneficiary dies, becomes disabled, or receives a scholarship, the purchaser will receive the tuition payout value of the contract with no deduction of any administrative or cancellation fees. Change of Beneficiary A contract owner may request a change of beneficiary to a substitute who is a family member of the immediately-preceding beneficiary. Changes in beneficiary for reasons other than death, disability, or receipt of a scholarship of the original beneficiary will be subject to administrative fees.

6
IV. SUMMARY OF CONTRACT DATA AND CURRENT ASSETS Contract Data Data on the number of outstanding contracts and payments was provided by the Program’s records administrator, Intuition Solutions, Inc. The graphs below summarize the data provided concerning these KAPT contracts.
5.3%
92.2%
2.5%
Distribution of KAPT Contracts by Contract Type
Value Plan Standard Plan Premium Plan
138
238
295
388
509 511510487
438449
448
374 381355
402
303 279217
109
31
Distribution of KAPT Contracts by Projected Year of Initial College Enrollment
Current Assets The assets currently held by the Fund are an important part of the determination of the actuarial adequacy of the Program. The investment strategy for those assets is also critical to the yield and to the vulnerability of the Program's actuarial adequacy to changes in the return earned on investments.
7
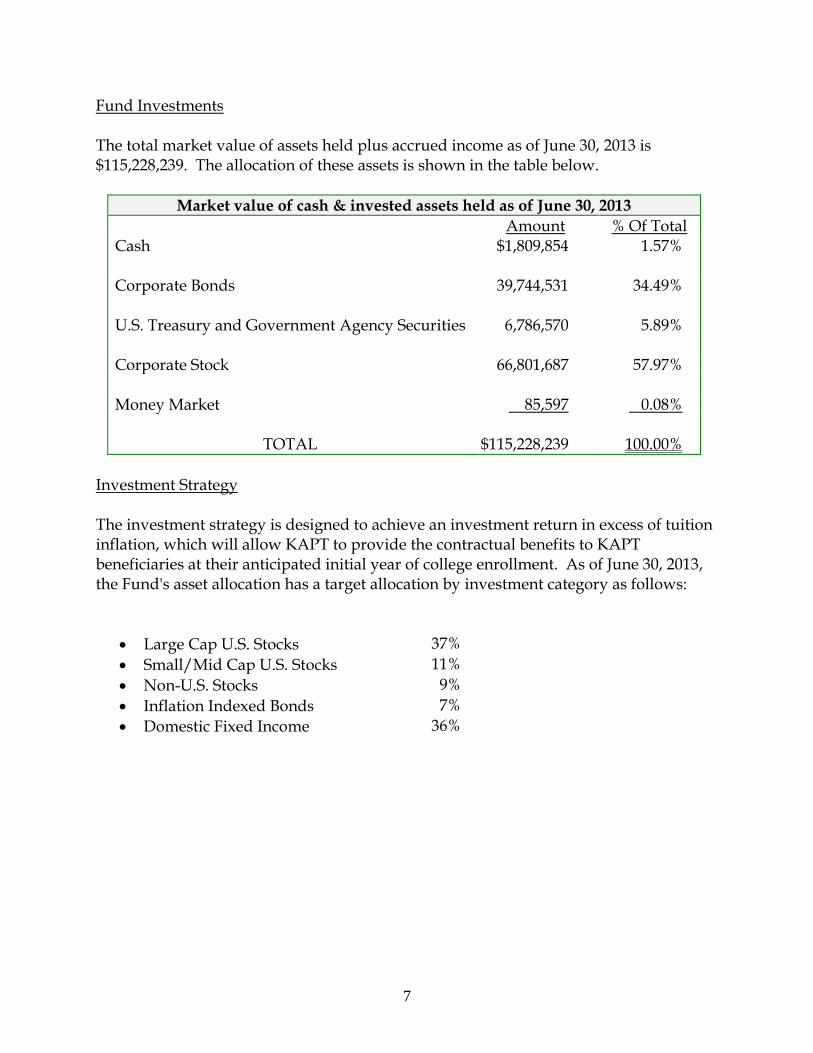
Fund Investments The total market value of assets held plus accrued income as of June 30, 2013 is $115,228,239. The allocation of these assets is shown in the table below.
Market value of cash & invested assets held as of June 30, 2013
Amount % Of Total Cash $1,809,854 1.57% Corporate Bonds 39,744,531 34.49% U.S. Treasury and Government Agency Securities 6,786,570 5.89% Corporate Stock 66,801,687 57.97% Money Market 85,597 0.08%
TOTAL $115,228,239 100.00%
Investment Strategy The investment strategy is designed to achieve an investment return in excess of tuition inflation, which will allow KAPT to provide the contractual benefits to KAPT beneficiaries at their anticipated initial year of college enrollment. As of June 30, 2013, the Fund's asset allocation has a target allocation by investment category as follows:
Large Cap U.S. Stocks 37%
Small/Mid Cap U.S. Stocks 11%
Non-U.S. Stocks 9%
Inflation Indexed Bonds 7%
Domestic Fixed Income
36%
8
V. ACTUARIAL METHODS AND ASSUMPTIONS Methods The actuarial method for the determination of the adequacy of the Fund consists of projecting future tuition rates, future expenses based on the average anticipated number of KAPT Contracts in place, and future utilization of KAPT Contracts. Future benefits and expenses are discounted using the assumed investment yield as the interest discount rate. The assumed discount rate is based on the current and anticipated mix of assets of the Fund. For the projection of future benefits, the analysis proceeds as follows: Project future tuition rates for all years under consideration. Future tuition is based
on the assumptions for tuition inflation. These assumptions vary by postsecondary school.
Determine the nominal cost of future use of KAPT contracts based on the
assumptions regarding utilization of contracts and the length of time the average beneficiary will take to complete his college education.
Determine the nominal value of administrative expenses. Determine the present value of future contract usage and future expenses based on
the investment yield assumptions. Perform projections for all of the Program's beneficiaries to determine if the Fund is
adequate in the aggregate and make sufficient provision for overhead expenses.

9
Assumptions Actuarial assumptions used to determine financial soundness of programs are of two general types: economic and demographic. Demographic assumptions determine the expected exposure to financial claims and generally answer the question "How and when will people use their contract?" Economic assumptions are concerned with the expected level of contract usage and answer the question "What is the expected value of contract usage?" The assumptions that we used were those that were approved by the KAPT Program Administrator, after consultation with us. Economic Assumptions Economic assumptions are used to estimate the annual tuition rates at two and four year colleges, increases in Fund expenses, and Fund earnings on assets invested. Because inflation is a major component of the rate of increase in tuition rates and of investment returns, we considered these rates together. We believe that the difference in these rates is more important than the absolute level of the rates. The following paragraphs describe the economic assumptions used in this study. Federal Income Tax We assumed that Fund earnings are exempt from Federal Income Tax. Annual Tuition Rates Tuition increases vary by duration and are shown in the table below. Our assumptions were guided by our observations of historic tuition increases, trends in postsecondary enrollment in Kentucky, and the level of legislative appropriations for postsecondary schools in Kentucky.
Tuition Inflation
All Classes of Contracts All years 6.75%
Fund Earnings Rate Our assumption for investment returns is based on information supplied to us by the Program’s investment advisor, Callan Associates. Callan Associates supplied us with expected asset class returns. The assumption below is gross before expenses and is based on the asset class returns combined with the Program’s target allocation ratios.

10
Investment Returns
Investment Return for all future years 5.94%
Annual Expenses We are projecting future expenses to be as shown in the following table.
Expenses
Investment Expenses Applicable to all assets 0.20% Administrative Expenses Initial Annual Amount $487,060 This amount is allocated on a per- contract basis
Demographic Assumptions The demographic assumptions used in this report are based on our experience with similar types of liabilities. Our choice of assumptions is based on recent experience and our best estimates as to future events. These assumptions are as follows: Contract Cancellations Due To Mortality and Disability We assumed no contract terminations due to death or disability. Non- utilization of KAPT benefits at Projected College Entrance Year We assumed 10.0% of contacts that reach their Projected College Entrance Year (PCEY) will not utilize KAPT funds to pay for college at the planned matriculation date. For this year’s report time period, there were 390 KAPT contracts that were more than two years past the PCEY and not had requested funds to pay for college or cancelled their KAPT account according to program record keeper. For assumptions going forward, the program will use the rate of non-utilization of 10% of all remaining contacts that have not reached their PCEY. Other Contract Cancellations We assumed that contracts would cancel according to the tables given below.
Contract Cancellation Table 1 of 2
36 Monthly 60 Monthly
Type of Payment=> Lump Sum Payments Payments
Year of purchase 1.50% 3.00% 5.00%

11
Year of purchase+1 1.00% 2.00% 4.00% Year of purchase+2 0.75% 1.00% 3.00% Year of purchase+3 0.75% 1.00% 2.00% Year of purchase+4 0.50% 0.75% 1.00% Thereafter 0.50% 0.75% 0.75%
Contract Cancellation Table 2 of 2
84 Monthly Extended Custom
Type of Payment=> Payments Payments Payments
Year of purchase 6.00% 8.00% 8.00% Year of purchase+1 4.00% 7.00% 7.00% Year of purchase+2 3.00% 5.00% 5.00% Year of purchase+3 2.00% 4.00% 4.00% Year of purchase+4 1.00% 3.00% 3.00% Year of purchase+5 1.00% 2.00% 2.00% Year of purchase+6 1.00% 1.00% 1.00% Thereafter 0.75% 0.75% 0.75%
Matriculation Percent 90% of beneficiaries are assumed to matriculate at the matriculation date specified in the application, except for those who are projected to terminate, die, or become disabled. The remaining 10% are assumed to use their contracts 10 years after their planned matriculation dates. Utilization of Benefits We assume that beneficiaries will enroll in college at the date indicated as their anticipated matriculation date. We also assume that beneficiaries will use one year’s worth of benefits over the course of only one academic year. That is, a 4-year contract will use all benefits over four academic years. Within an academic year, contract usage is assumed to be 50% for the fall semester, 50% for the spring semester and none for the summer semester. Dropout Rate All beneficiaries are assumed to use 100% of their contractual benefits once they have enrolled in college.

12
Frequency of Beneficiary Replacement Since all surviving beneficiaries are expected to matriculate and are expected to use their KAPT contracts until completion, the assumption is made that no replacement of beneficiaries will occur.
13
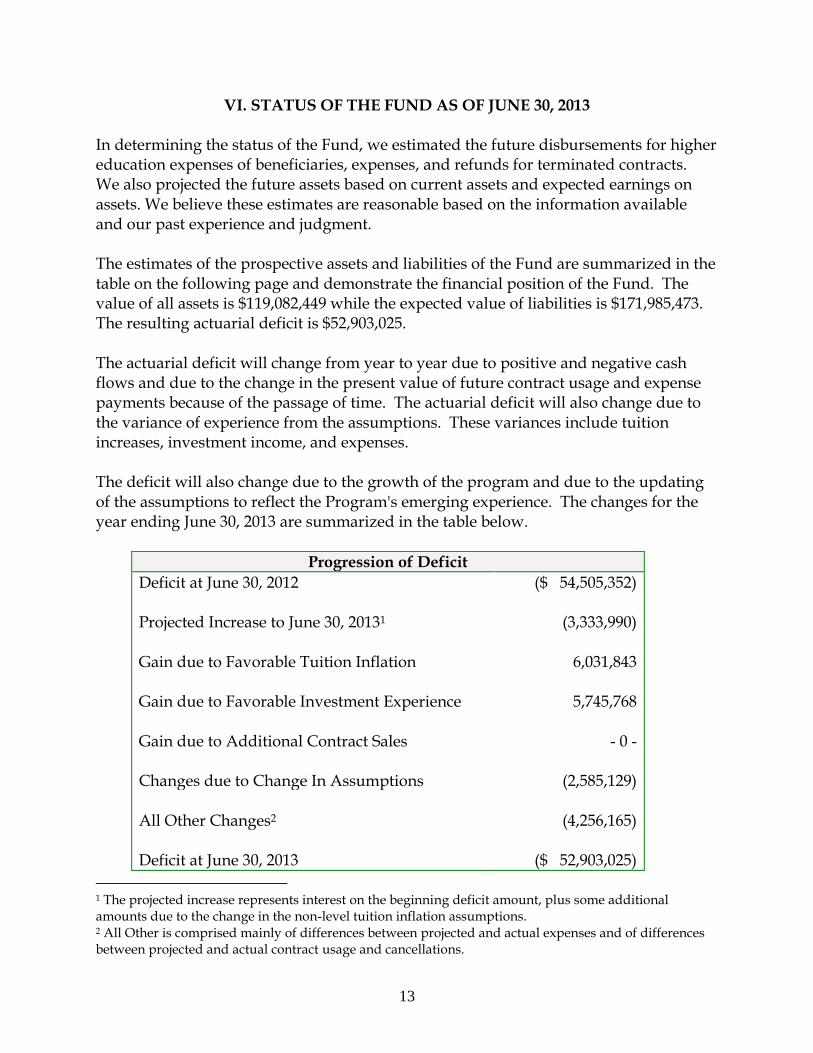
VI. STATUS OF THE FUND AS OF JUNE 30, 2013 In determining the status of the Fund, we estimated the future disbursements for higher education expenses of beneficiaries, expenses, and refunds for terminated contracts. We also projected the future assets based on current assets and expected earnings on assets. We believe these estimates are reasonable based on the information available and our past experience and judgment. The estimates of the prospective assets and liabilities of the Fund are summarized in the table on the following page and demonstrate the financial position of the Fund. The value of all assets is $119,082,449 while the expected value of liabilities is $171,985,473. The resulting actuarial deficit is $52,903,025. The actuarial deficit will change from year to year due to positive and negative cash flows and due to the change in the present value of future contract usage and expense payments because of the passage of time. The actuarial deficit will also change due to the variance of experience from the assumptions. These variances include tuition increases, investment income, and expenses. The deficit will also change due to the growth of the program and due to the updating of the assumptions to reflect the Program's emerging experience. The changes for the year ending June 30, 2013 are summarized in the table below.
Progression of Deficit
Deficit at June 30, 2012 ($ 54,505,352) Projected Increase to June 30, 20131 (3,333,990) Gain due to Favorable Tuition Inflation 6,031,843 Gain due to Favorable Investment Experience 5,745,768 Gain due to Additional Contract Sales - 0 - Changes due to Change In Assumptions (2,585,129) All Other Changes2 (4,256,165) Deficit at June 30, 2013 ($ 52,903,025)
1 The projected increase represents interest on the beginning deficit amount, plus some additional amounts due to the change in the non-level tuition inflation assumptions. 2 All Other is comprised mainly of differences between projected and actual expenses and of differences between projected and actual contract usage and cancellations.
14
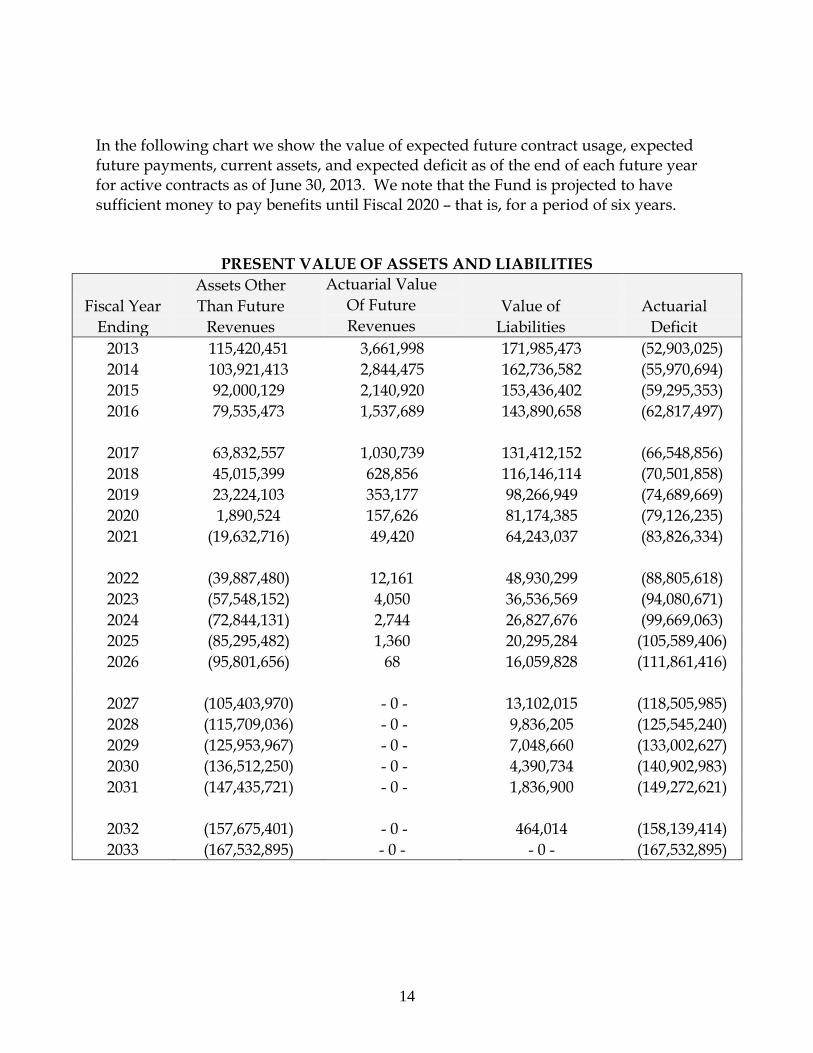
In the following chart we show the value of expected future contract usage, expected future payments, current assets, and expected deficit as of the end of each future year for active contracts as of June 30, 2013. We note that the Fund is projected to have sufficient money to pay benefits until Fiscal 2020 – that is, for a period of six years.
PRESENT VALUE OF ASSETS AND LIABILITIES
Assets Other Actuarial Value
Fiscal Year Than Future Of Future Value of Actuarial
Ending Revenues Revenues Liabilities Deficit
2013 115,420,451 3,661,998 171,985,473 (52,903,025)
2014 103,921,413 2,844,475 162,736,582 (55,970,694)
2015 92,000,129 2,140,920 153,436,402 (59,295,353)
2016 79,535,473 1,537,689 143,890,658 (62,817,497)
2017 63,832,557 1,030,739 131,412,152 (66,548,856)
2018 45,015,399 628,856 116,146,114 (70,501,858)
2019 23,224,103 353,177 98,266,949 (74,689,669)
2020 1,890,524 157,626 81,174,385 (79,126,235)
2021 (19,632,716) 49,420 64,243,037 (83,826,334)
2022 (39,887,480) 12,161 48,930,299 (88,805,618)
2023 (57,548,152) 4,050 36,536,569 (94,080,671)
2024 (72,844,131) 2,744 26,827,676 (99,669,063)
2025 (85,295,482) 1,360 20,295,284 (105,589,406)
2026 (95,801,656) 68 16,059,828 (111,861,416)
2027 (105,403,970) - 0 - 13,102,015 (118,505,985)
2028 (115,709,036) - 0 - 9,836,205 (125,545,240)
2029 (125,953,967) - 0 - 7,048,660 (133,002,627)
2030 (136,512,250) - 0 - 4,390,734 (140,902,983)
2031 (147,435,721) - 0 - 1,836,900 (149,272,621)
2032 (157,675,401) - 0 - 464,014 (158,139,414)
2033 (167,532,895) - 0 - - 0 - (167,532,895)

15
VII. EFFECT OF FUTURE CONTRACT SALES
We have considered the effect of future contract sales on the existing Fund deficit. Our analysis assumes that contract sales resume for the 2013/14 enrollment period with contract payments beginning in February 2013. We examined three different levels of contract sales: 1,000 contracts each year; 2,000 contracts each year and 3,000 contracts each year. For each of these sales levels, we examined three different premium surcharge levels – 5.0%, 7.5% and 10.0%. For each of these 9 scenarios, we projected future contract prices for each future projected enrollment period. We projected financial results for each future enrollment period according to the projected number of contracts and the amount of premium surcharge. The number of future consecutive enrollment periods required to generate sufficient surplus to cure the existing deficit is shown in the table below.
Enrollment Periods Required to Cure Deficit
Contracts Sold 5% Premium 7.5% Premium 10% Premium
1,000 14+3 14+ 14+ 2,000 14+ 14+ 14+ 3,000 14+ 14+ 14+
We have also determined the amount of premium needed at each level of sales to cure the deficit in 10 enrollment periods.
Premiums Required to Cure Deficit Over 10 Enrollments
1,000 Contracts 2,000 Contracts 3,000 Contracts
39% 28% 22%
It should be noted that the expected investment return, 5.94%, is well below expected tuition inflation, 6.75%. This leaves little margin for error even with the above premiums. Should the realized investment returns be lower or the actual tuition inflation be higher than expected, the new contract sales could increase the deficit.
3 Number of enrollment periods indicated as 14+ do not generate sufficient projected margins to offset the current
deficit as projected into the future. We did not project enrollment periods more than 14 years out since this is
beyond the time when all existing contracts will have expired or matured.
16
VIII. SENSITIVITY TESTING
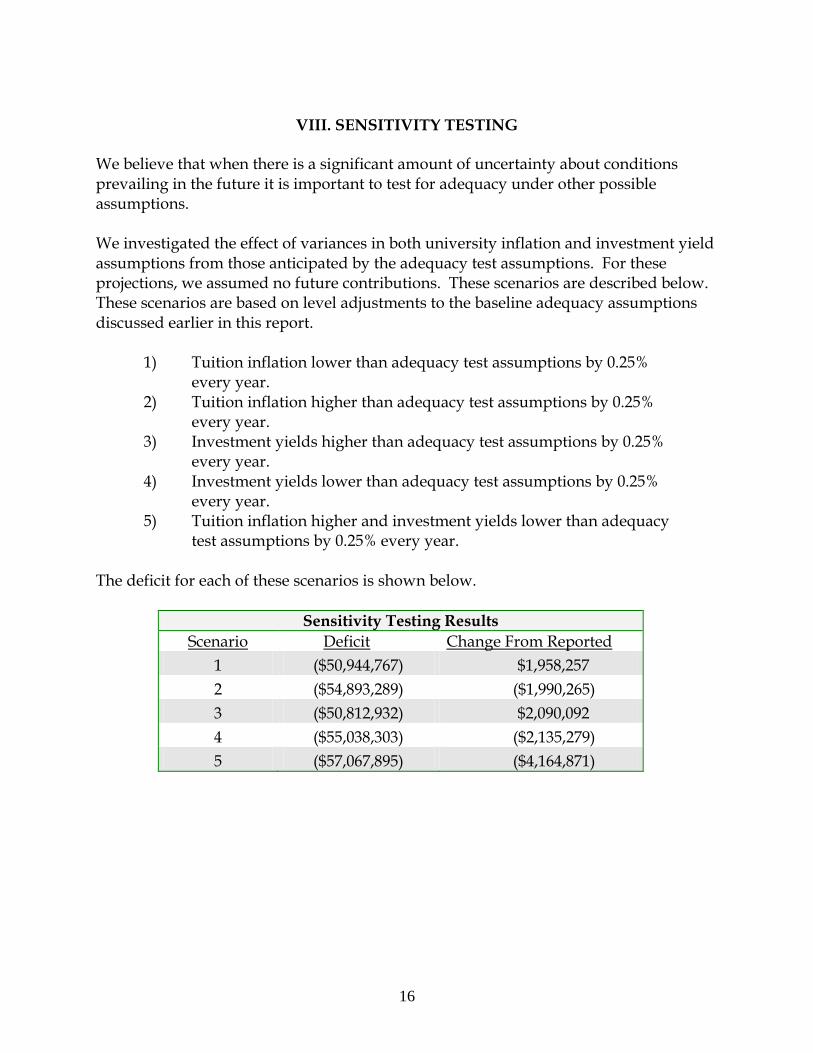
We believe that when there is a significant amount of uncertainty about conditions prevailing in the future it is important to test for adequacy under other possible assumptions. We investigated the effect of variances in both university inflation and investment yield assumptions from those anticipated by the adequacy test assumptions. For these projections, we assumed no future contributions. These scenarios are described below. These scenarios are based on level adjustments to the baseline adequacy assumptions discussed earlier in this report.
1) Tuition inflation lower than adequacy test assumptions by 0.25% every year.
2) Tuition inflation higher than adequacy test assumptions by 0.25% every year.
3) Investment yields higher than adequacy test assumptions by 0.25% every year.
4) Investment yields lower than adequacy test assumptions by 0.25% every year.
5) Tuition inflation higher and investment yields lower than adequacy test assumptions by 0.25% every year.
The deficit for each of these scenarios is shown below.
Sensitivity Testing Results
Scenario Deficit Change From Reported
1 ($50,944,767) $1,958,257
2 ($54,893,289) ($1,990,265)
3 ($50,812,932) $2,090,092
4 ($55,038,303) ($2,135,279)
5 ($57,067,895) ($4,164,871)

17
IX. MONTE CARLO ANALYSIS We have retained the same model for stochastic projections as we used last year. We have updated the beginning values to reflect 2013 actual results, but otherwise have left the same structure and parameters in place. As in prior years, we ran 10,000 scenarios with varying tuition inflation and investment returns. The results are summarized in the table below.
Proportion with positive Actuarial Reserve 5.2% 25% of results are better than: ($37,726,981) 50% of results are better than: ($61,001,904) 75% of results are better than: ($87,146,733) Largest Actuarial Reserve $254,361,584 Smallest Actuarial Reserve ($270,348,311) Mean Actuarial Reserve ($62,756,132)
The most important measures from the table immediately above are the Proportion with positive Actuarial Reserve and the 50% Results. The Proportion with positive Actuarial Reserve probability of 5.2% indicates that there is better than a 5 in 100 likelihood that the Program will have a surplus.

18
The 50% Results measure is a “best-estimate” measure of results. If our assumptions are neither conservative (that is they understate results) nor aggressive (that is they overstate results) then the 50% Results measure should be close to our projected result of ($52,903,025). The table above indicates that our assumptions are somewhat aggressive – mainly due to the historical tuition inflation averages being higher than our current assumption. Historic tuition is expected to be higher than our current assumption regarding tuition inflation because we are projecting a lower-growth scenario for both investment returns and inflation. The Program’s Investment Advisor has told us that their long-term average expectation for CPI is now 2.75%. Our tuition inflation assumption is consistent with this CPI. Historical CPI (and corresponding historical tuition increases) are higher, on average, than 2.75%. The Smallest Actuarial Reserve indicates what happens if economic events continue adversely for the lifetime of the current contracts –high tuition increases, coupled with negative returns in the equity market until the end of the projection horizon. On the other hand, the Largest Actuarial Reserve indicates what happens if economic conditions are favorable for the remaining lifetime of the current contracts.
19
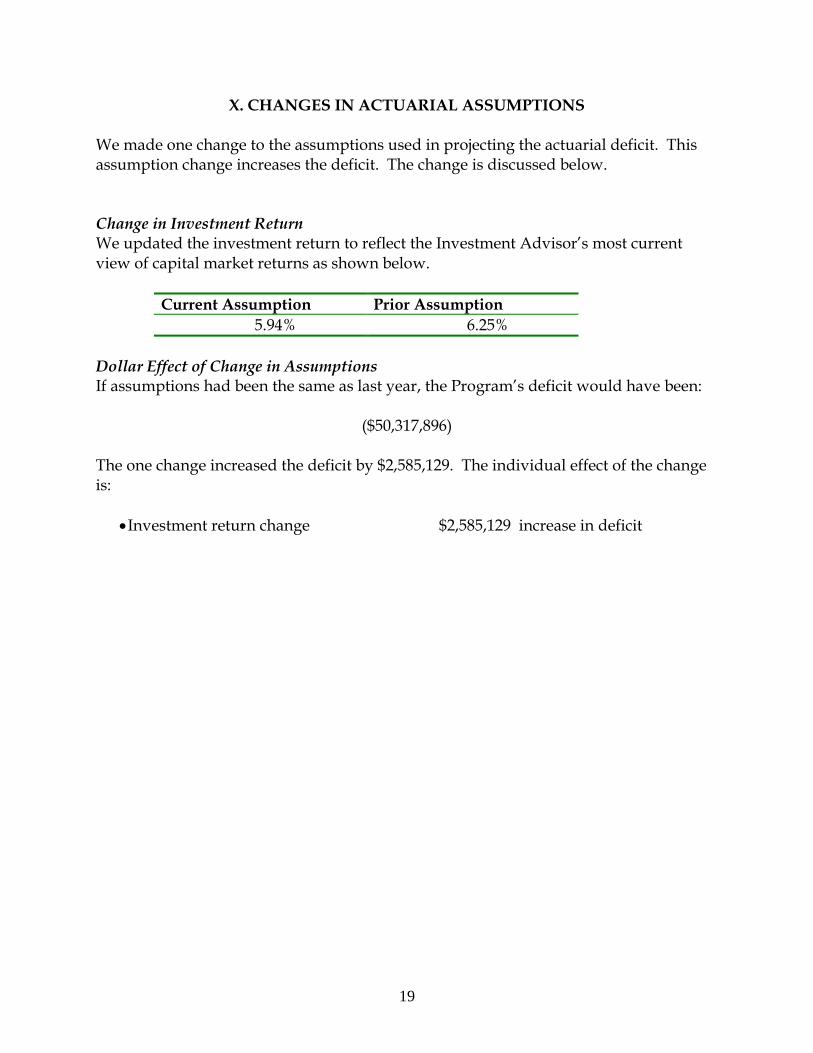
X. CHANGES IN ACTUARIAL ASSUMPTIONS We made one change to the assumptions used in projecting the actuarial deficit. This assumption change increases the deficit. The change is discussed below. Change in Investment Return We updated the investment return to reflect the Investment Advisor’s most current view of capital market returns as shown below.
Current Assumption Prior Assumption
5.94% 6.25%
Dollar Effect of Change in Assumptions If assumptions had been the same as last year, the Program’s deficit would have been:
($50,317,896) The one change increased the deficit by $2,585,129. The individual effect of the change is:
Investment return change $2,585,129 increase in deficit
20
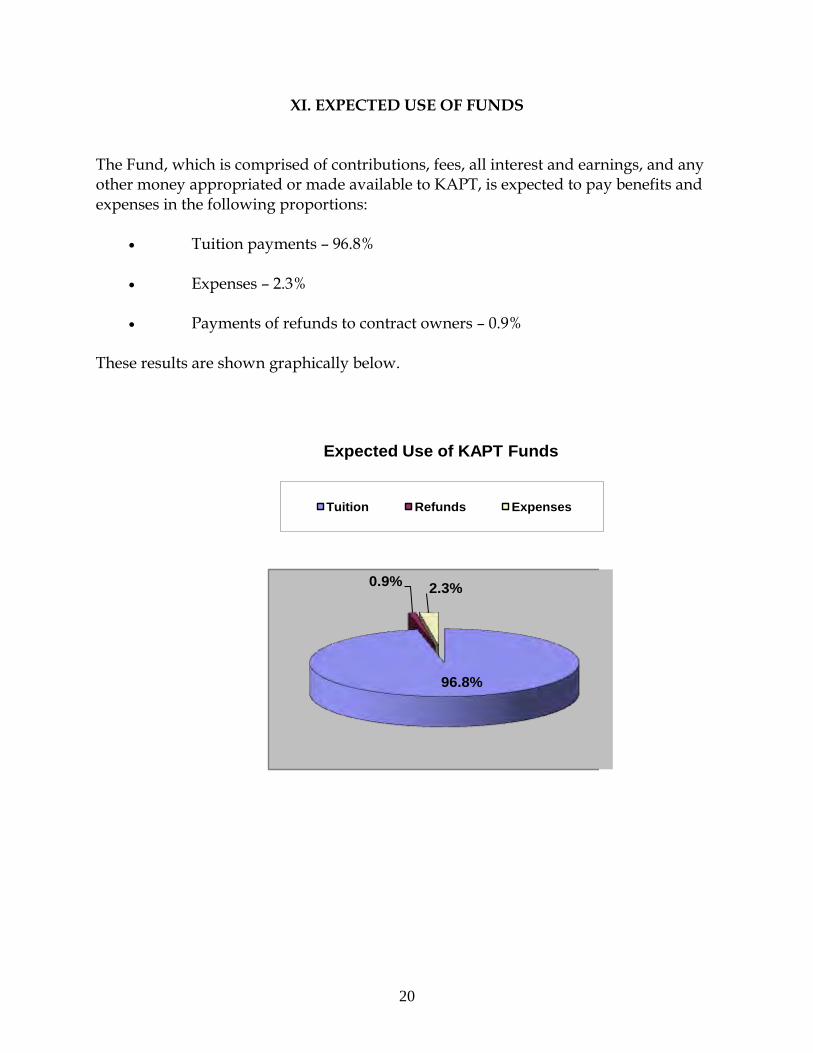
XI. EXPECTED USE OF FUNDS The Fund, which is comprised of contributions, fees, all interest and earnings, and any other money appropriated or made available to KAPT, is expected to pay benefits and expenses in the following proportions: Tuition payments – 96.8% Expenses – 2.3% Payments of refunds to contract owners – 0.9% These results are shown graphically below.
96.8%
0.9%2.3%
Expected Use of KAPT Funds
Tuition Refunds Expenses


![Callan Book 1 [Stage 1]](https://static.fdocuments.us/doc/165x107/544744d2b1af9f800a8b4c46/callan-book-1-stage-1-558445bb7681f.jpg)


![Callan Book 2 [Stage 3]](https://static.fdocuments.us/doc/165x107/55cf8f7c550346703b9ce040/callan-book-2-stage-3-564765e022b75.jpg)


