September 2013 Greater Boston Real Estate Market Trends Report
Upload
unit-realty-groupCategory
view
181download
0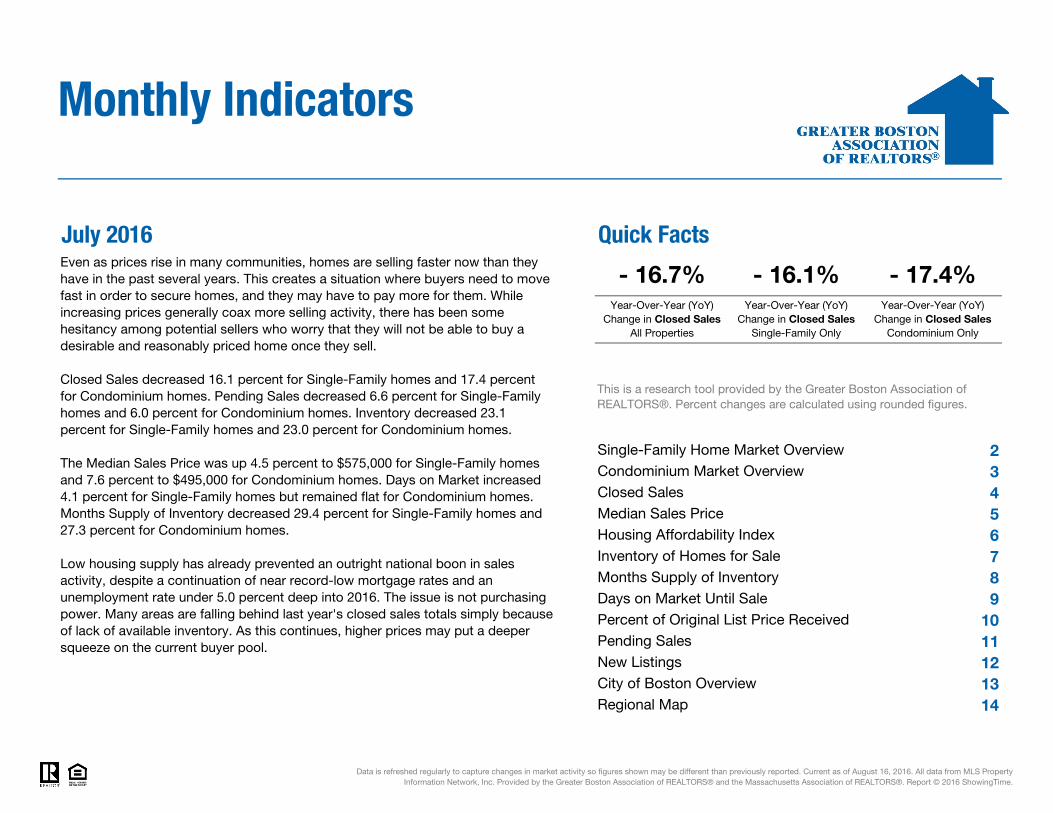
July 2016 Quick Facts
23456789
1011121314
Monthly Indicators
Even as prices rise in many communities, homes are selling faster now than they have in the past several years. This creates a situation where buyers need to move fast in order to secure homes, and they may have to pay more for them. While increasing prices generally coax more selling activity, there has been some hesitancy among potential sellers who worry that they will not be able to buy a desirable and reasonably priced home once they sell.
Closed Sales decreased 16.1 percent for Single-Family homes and 17.4 percent for Condominium homes. Pending Sales decreased 6.6 percent for Single-Family homes and 6.0 percent for Condominium homes. Inventory decreased 23.1 percent for Single-Family homes and 23.0 percent for Condominium homes.
The Median Sales Price was up 4.5 percent to $575,000 for Single-Family homes and 7.6 percent to $495,000 for Condominium homes. Days on Market increased 4.1 percent for Single-Family homes but remained flat for Condominium homes. Months Supply of Inventory decreased 29.4 percent for Single-Family homes and 27.3 percent for Condominium homes.
Low housing supply has already prevented an outright national boon in sales activity, despite a continuation of near record-low mortgage rates and an unemployment rate under 5.0 percent deep into 2016. The issue is not purchasing power. Many areas are falling behind last year's closed sales totals simply because of lack of available inventory. As this continues, higher prices may put a deeper squeeze on the current buyer pool.
Data is refreshed regularly to capture changes in market activity so figures shown may be different than previously reported. Current as of August 16, 2016. All data from MLS Property Information Network, Inc. Provided by the Greater Boston Association of REALTORS® and the Massachusetts Association of REALTORS®. Report © 2016 ShowingTime.
Single-Family Home Market Overview
- 16.7% - 16.1% - 17.4%
This is a research tool provided by the Greater Boston Association of REALTORS®. Percent changes are calculated using rounded figures.
Condominium Market Overview
Year-Over-Year (YoY) Change in Closed Sales
All Properties
Year-Over-Year (YoY) Change in Closed Sales
Single-Family Only
Year-Over-Year (YoY) Change in Closed Sales
Condominium Only
Closed Sales
Pending SalesNew ListingsCity of Boston OverviewRegional Map
Median Sales PriceHousing Affordability IndexInventory of Homes for SaleMonths Supply of InventoryDays on Market Until SalePercent of Original List Price Received
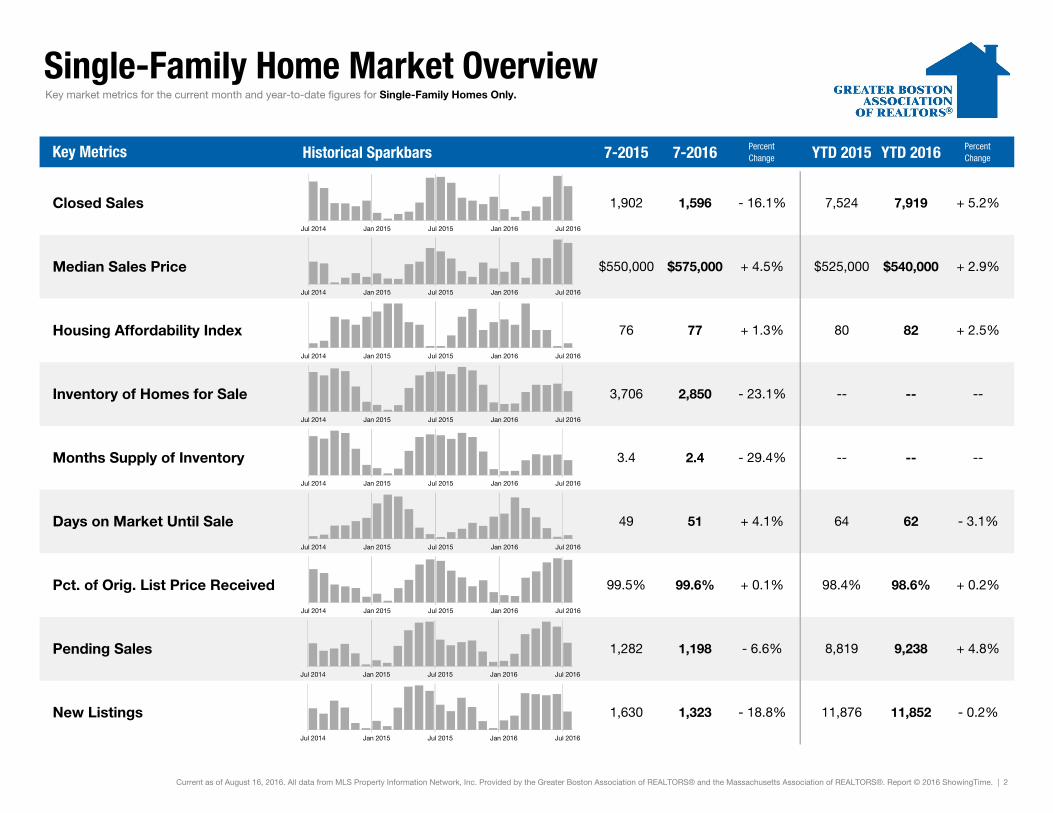
Single-Family Home Market Overview
Historical Sparkbars 7-2015 7-2016 PercentChange YTD 2015 YTD 2016 Percent
Change
Key market metrics for the current month and year-to-date figures for Single-Family Homes Only.
Closed Sales 1,902 1,596 - 16.1%
Key Metrics
7,919 + 5.2%
Median Sales Price $550,000 $575,000 + 4.5% $525,000 $540,000 + 2.9%
7,524
+ 2.5%
Inventory of Homes for Sale 3,706 2,850 - 23.1% -- -- --
Housing Affordability Index 76 77 + 1.3% 80 82
--
Days on Market Until Sale 49 51 + 4.1% 64 62 - 3.1%
Months Supply of Inventory 3.4 2.4 - 29.4% -- --
Current as of August 16, 2016. All data from MLS Property Information Network, Inc. Provided by the Greater Boston Association of REALTORS® and the Massachusetts Association of REALTORS®. Report © 2016 ShowingTime. | 2
+ 0.2%
Pending Sales 1,282 1,198 - 6.6% 8,819 9,238 + 4.8%
Pct. of Orig. List Price Received 99.5% 99.6% + 0.1% 98.4% 98.6%
New Listings - 0.2%1,630 1,323 - 18.8% 11,876 11,852
Jul 2014 Jan 2015 Jul 2015 Jan 2016 Jul 2016
Jul 2014 Jan 2015 Jul 2015 Jan 2016 Jul 2016
Jul 2014 Jan 2015 Jul 2015 Jan 2016 Jul 2016
Jul 2014 Jan 2015 Jul 2015 Jan 2016 Jul 2016
Jul 2014 Jan 2015 Jul 2015 Jan 2016 Jul 2016
Jul 2014 Jan 2015 Jul 2015 Jan 2016 Jul 2016
Jul 2014 Jan 2015 Jul 2015 Jan 2016 Jul 2016
Jul 2014 Jan 2015 Jul 2015 Jan 2016 Jul 2016
Jul 2014 Jan 2015 Jul 2015 Jan 2016 Jul 2016
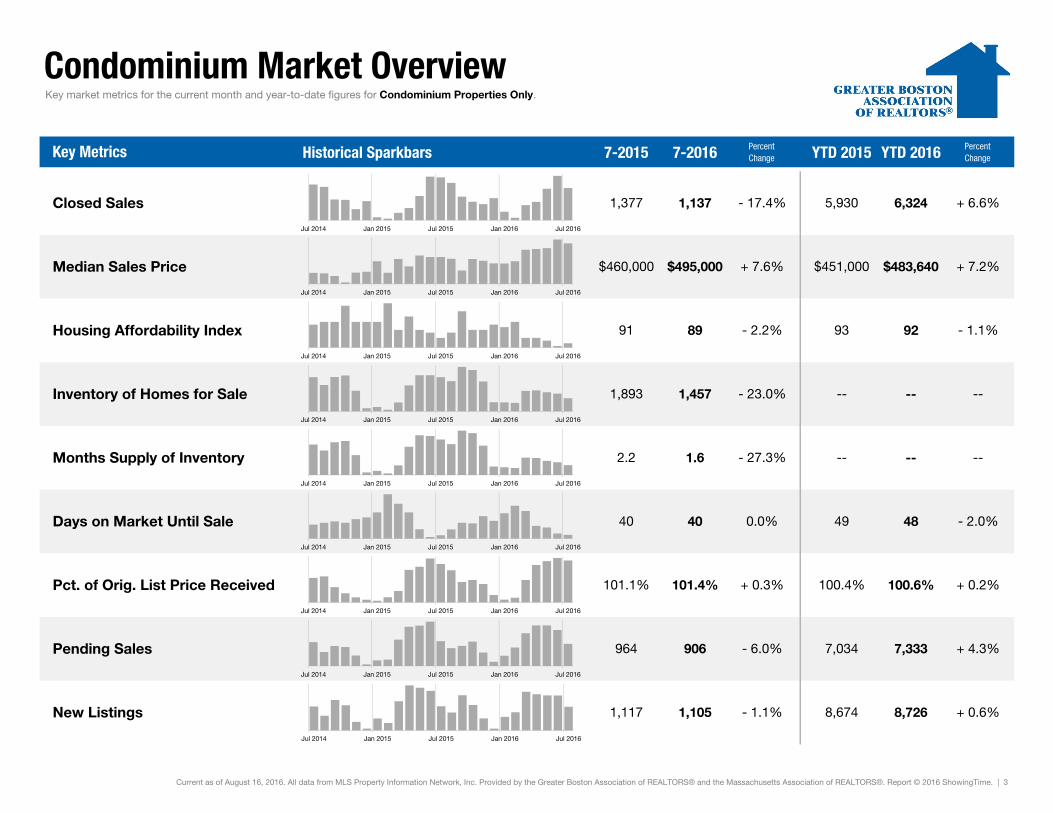
Condominium Market Overview
Historical Sparkbars 7-2015 7-2016 PercentChange YTD 2015 YTD 2016 Percent
Change
Current as of August 16, 2016. All data from MLS Property Information Network, Inc. Provided by the Greater Boston Association of REALTORS® and the Massachusetts Association of REALTORS®. Report © 2016 ShowingTime. | 3
+ 4.3%Pending Sales 964 906 - 6.0% 7,034 7,333
New Listings 1,117 1,105 - 1.1% 8,674 8,726
100.6% + 0.2%
480.0% 49
+ 0.6%
Pct. of Orig. List Price Received 101.1% 101.4% + 0.3% 100.4%
- 2.0%
- 23.0% -- --
Months Supply of Inventory 2.2 1.6 - 27.3% --
--
-- --
+ 7.6% $451,000 $483,640 + 7.2%
89 - 2.2% 93 92 - 1.1%
- 17.4%
Key Metrics
6,324 + 6.6%5,930
Key market metrics for the current month and year-to-date figures for Condominium Properties Only.
Closed Sales 1,377 1,137
Median Sales Price $460,000 $495,000
Inventory of Homes for Sale 1,893 1,457
Days on Market Until Sale 40 40
Housing Affordability Index 91
Jul 2014 Jan 2015 Jul 2015 Jan 2016 Jul 2016
Jul 2014 Jan 2015 Jul 2015 Jan 2016 Jul 2016
Jul 2014 Jan 2015 Jul 2015 Jan 2016 Jul 2016
Jul 2014 Jan 2015 Jul 2015 Jan 2016 Jul 2016
Jul 2014 Jan 2015 Jul 2015 Jan 2016 Jul 2016
Jul 2014 Jan 2015 Jul 2015 Jan 2016 Jul 2016
Jul 2014 Jan 2015 Jul 2015 Jan 2016 Jul 2016
Jul 2014 Jan 2015 Jul 2015 Jan 2016 Jul 2016
Jul 2014 Jan 2015 Jul 2015 Jan 2016 Jul 2016
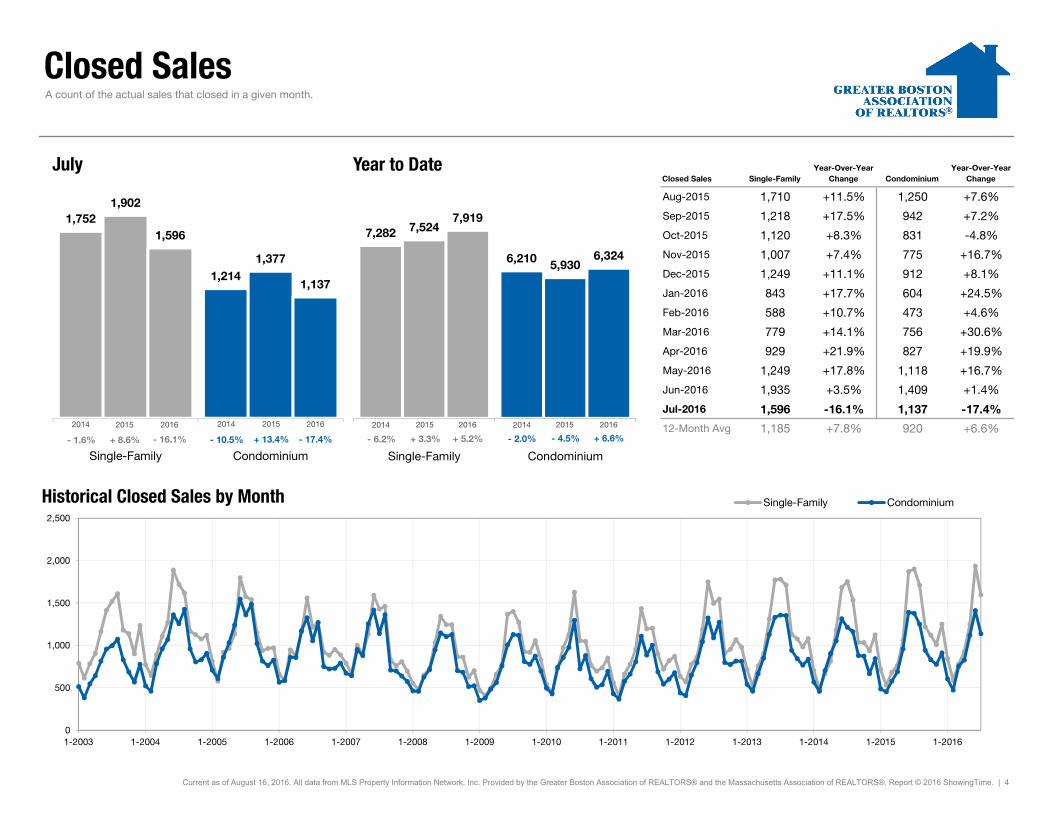
Closed Sales
Closed Sales Single-FamilyYear-Over-Year
Change CondominiumYear-Over-Year
Change
Aug-2015 1,710 +11.5% 1,250 +7.6%
Sep-2015 1,218 +17.5% 942 +7.2%
Oct-2015 1,120 +8.3% 831 -4.8%
Nov-2015 1,007 +7.4% 775 +16.7%
Dec-2015 1,249 +11.1% 912 +8.1%
Jan-2016 843 +17.7% 604 +24.5%
Feb-2016 588 +10.7% 473 +4.6%
Mar-2016 779 +14.1% 756 +30.6%
Apr-2016 929 +21.9% 827 +19.9%
May-2016 1,249 +17.8% 1,118 +16.7%
Jun-2016 1,935 +3.5% 1,409 +1.4%
Jul-2016 1,596 -16.1% 1,137 -17.4%
12-Month Avg 1,185 +7.8% 920 +6.6%
Historical Closed Sales by Month
Current as of August 16, 2016. All data from MLS Property Information Network, Inc. Provided by the Greater Boston Association of REALTORS® and the Massachusetts Association of REALTORS®. Report © 2016 ShowingTime. | 4
A count of the actual sales that closed in a given month.
1,752
1,214
1,902
1,377
1,596
1,137
Single-Family Condominium
July
0
500
1,000
1,500
2,000
2,500
1-2003 1-2004 1-2005 1-2006 1-2007 1-2008 1-2009 1-2010 1-2011 1-2012 1-2013 1-2014 1-2015 1-2016
Single-Family Condominium
7,282
6,210
7,524
5,930
7,919
6,324
Single-Family Condominium
Year to Date
2014 2015 2016
- 17.4%+ 13.4%- 16.1%+ 8.6% - 4.5%+ 5.2%+ 3.3% + 6.6%
2014 2015 2016 2014 2015 2016 2014 2015 2016
- 1.6% - 6.2% - 2.0%- 10.5%
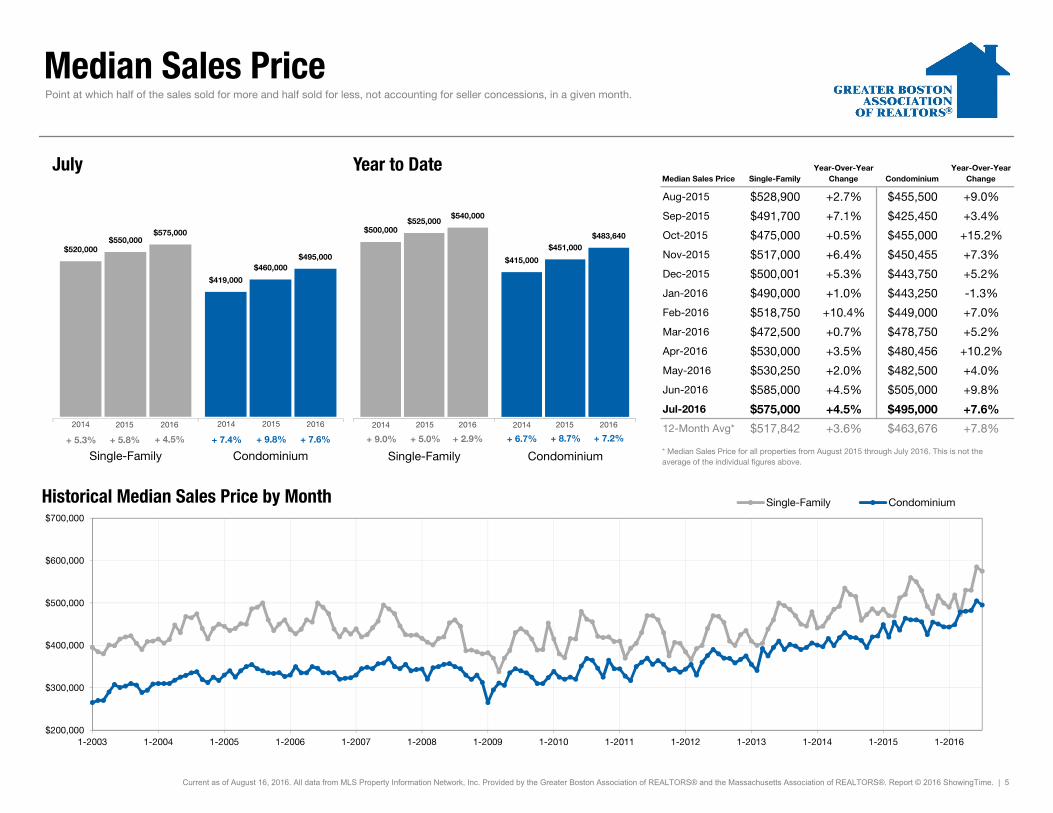
Median Sales Price
Median Sales Price Single-FamilyYear-Over-Year
Change CondominiumYear-Over-Year
Change
Aug-2015 $528,900 +2.7% $455,500 +9.0%
Sep-2015 $491,700 +7.1% $425,450 +3.4%
Oct-2015 $475,000 +0.5% $455,000 +15.2%
Nov-2015 $517,000 +6.4% $450,455 +7.3%
Dec-2015 $500,001 +5.3% $443,750 +5.2%
Jan-2016 $490,000 +1.0% $443,250 -1.3%
Feb-2016 $518,750 +10.4% $449,000 +7.0%
Mar-2016 $472,500 +0.7% $478,750 +5.2%
Apr-2016 $530,000 +3.5% $480,456 +10.2%
May-2016 $530,250 +2.0% $482,500 +4.0%
Jun-2016 $585,000 +4.5% $505,000 +9.8%
Jul-2016 $575,000 +4.5% $495,000 +7.6%
12-Month Avg* $517,842 +3.6% $463,676 +7.8%
Historical Median Sales Price by Month
Point at which half of the sales sold for more and half sold for less, not accounting for seller concessions, in a given month.
* Median Sales Price for all properties from August 2015 through July 2016. This is not the average of the individual figures above.
Current as of August 16, 2016. All data from MLS Property Information Network, Inc. Provided by the Greater Boston Association of REALTORS® and the Massachusetts Association of REALTORS®. Report © 2016 ShowingTime. | 5
$520,000
$419,000
$550,000
$460,000
$575,000
$495,000
Single-Family Condominium
July
$200,000
$300,000
$400,000
$500,000
$600,000
$700,000
1-2003 1-2004 1-2005 1-2006 1-2007 1-2008 1-2009 1-2010 1-2011 1-2012 1-2013 1-2014 1-2015 1-2016
Single-Family Condominium
$500,000
$415,000
$525,000
$451,000
$540,000
$483,640
Single-Family Condominium
Year to Date
2014 2015 2016
+ 7.6%+ 9.8%+ 4.5%+ 5.8% + 8.7%+ 2.9%+ 5.0% + 7.2%
2014 2015 2016 2014 2015 2016 2014 2015 2016
+ 5.3% + 9.0% + 6.7%+ 7.4%
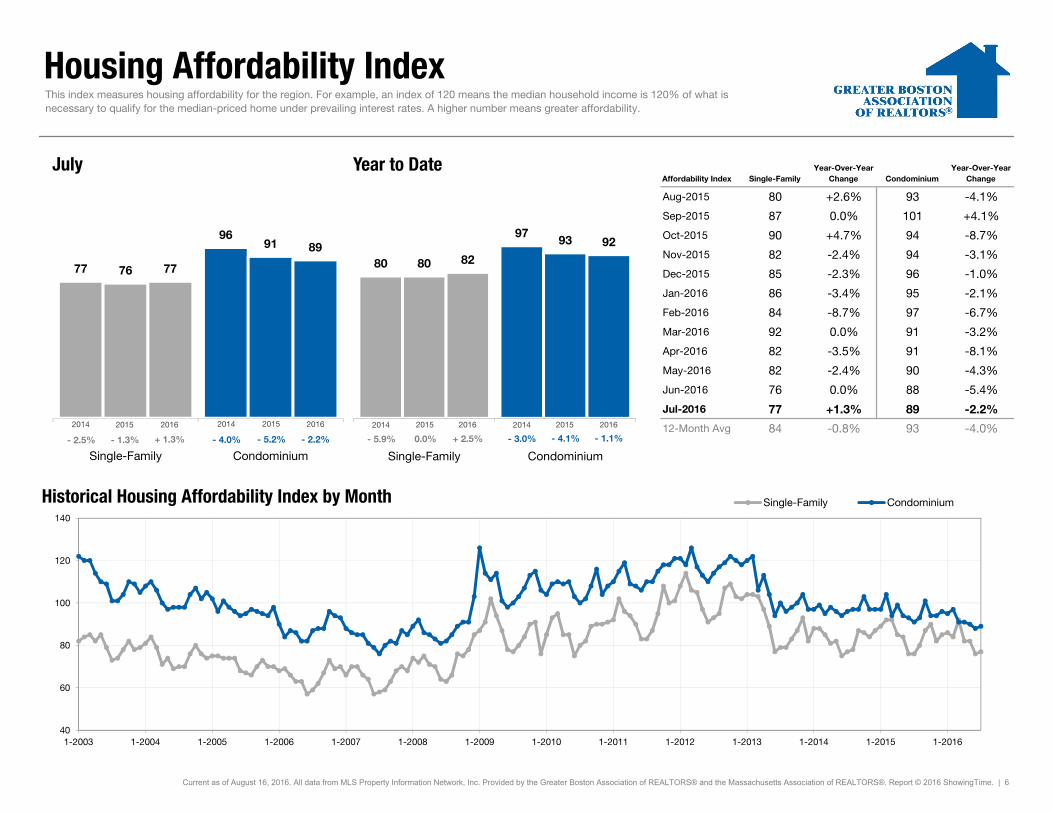
Housing Affordability Index
Affordability Index Single-FamilyYear-Over-Year
Change CondominiumYear-Over-Year
Change
Aug-2015 80 +2.6% 93 -4.1%
Sep-2015 87 0.0% 101 +4.1%
Oct-2015 90 +4.7% 94 -8.7%
Nov-2015 82 -2.4% 94 -3.1%
Dec-2015 85 -2.3% 96 -1.0%
Jan-2016 86 -3.4% 95 -2.1%
Feb-2016 84 -8.7% 97 -6.7%
Mar-2016 92 0.0% 91 -3.2%
Apr-2016 82 -3.5% 91 -8.1%
May-2016 82 -2.4% 90 -4.3%
Jun-2016 76 0.0% 88 -5.4%
Jul-2016 77 +1.3% 89 -2.2%
12-Month Avg 84 -0.8% 93 -4.0%
Historical Housing Affordability Index by Month
This index measures housing affordability for the region. For example, an index of 120 means the median household income is 120% of what is necessary to qualify for the median-priced home under prevailing interest rates. A higher number means greater affordability.
Current as of August 16, 2016. All data from MLS Property Information Network, Inc. Provided by the Greater Boston Association of REALTORS® and the Massachusetts Association of REALTORS®. Report © 2016 ShowingTime. | 6
77
96
76
91
77
89
Single-Family Condominium
July
40
60
80
100
120
140
1-2003 1-2004 1-2005 1-2006 1-2007 1-2008 1-2009 1-2010 1-2011 1-2012 1-2013 1-2014 1-2015 1-2016
Single-Family Condominium
80
97
80
93
8292
Single-Family Condominium
Year to Date
2014 2015 2016
- 2.2%- 5.2%+ 1.3%- 1.3% - 4.1%+ 2.5%0.0% - 1.1%
2014 2015 2016 2014 2015 2016 2014 2015 2016
- 2.5% - 5.9% - 3.0%- 4.0%
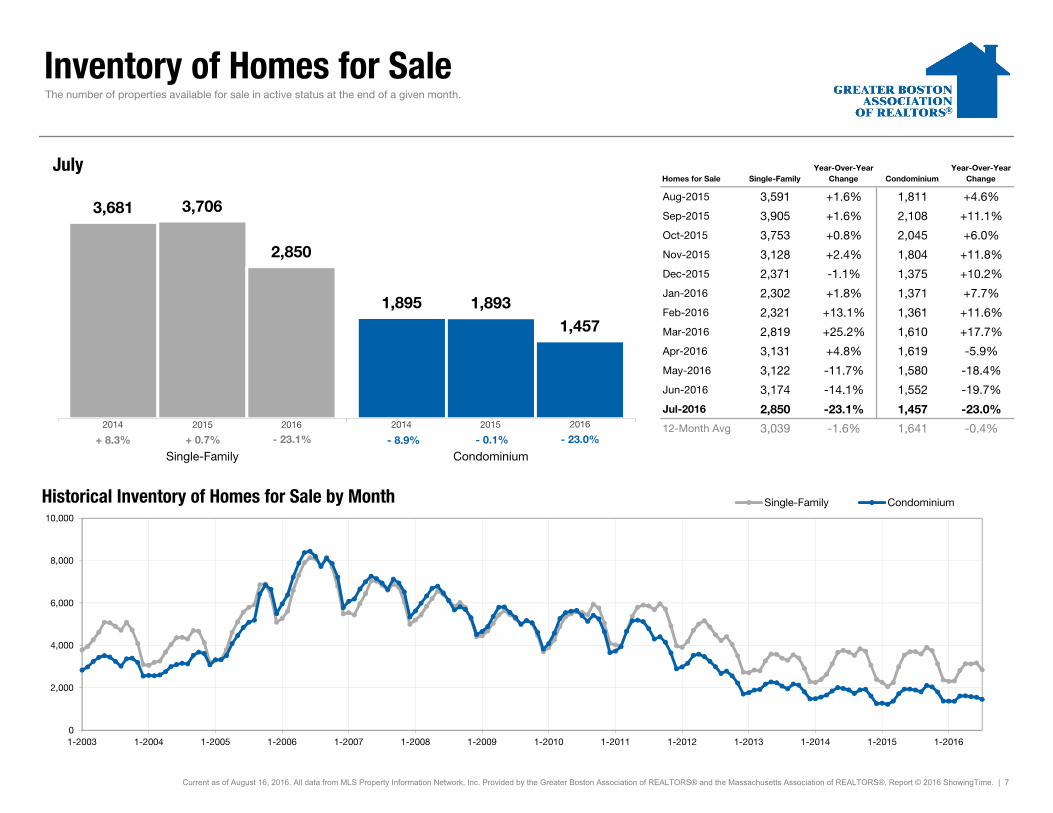
Inventory of Homes for Sale
Homes for Sale Single-FamilyYear-Over-Year
Change CondominiumYear-Over-Year
Change
Aug-2015 3,591 +1.6% 1,811 +4.6%
Sep-2015 3,905 +1.6% 2,108 +11.1%
Oct-2015 3,753 +0.8% 2,045 +6.0%
Nov-2015 3,128 +2.4% 1,804 +11.8%
Dec-2015 2,371 -1.1% 1,375 +10.2%
Jan-2016 2,302 +1.8% 1,371 +7.7%
Feb-2016 2,321 +13.1% 1,361 +11.6%
Mar-2016 2,819 +25.2% 1,610 +17.7%
Apr-2016 3,131 +4.8% 1,619 -5.9%
May-2016 3,122 -11.7% 1,580 -18.4%
Jun-2016 3,174 -14.1% 1,552 -19.7%
Jul-2016 2,850 -23.1% 1,457 -23.0%
12-Month Avg 3,039 -1.6% 1,641 -0.4%
Historical Inventory of Homes for Sale by Month
The number of properties available for sale in active status at the end of a given month.
Current as of August 16, 2016. All data from MLS Property Information Network, Inc. Provided by the Greater Boston Association of REALTORS® and the Massachusetts Association of REALTORS®. Report © 2016 ShowingTime. | 7
3,681
1,895
3,706
1,893
2,850
1,457
Single-Family Condominium
July
0
2,000
4,000
6,000
8,000
10,000
1-2003 1-2004 1-2005 1-2006 1-2007 1-2008 1-2009 1-2010 1-2011 1-2012 1-2013 1-2014 1-2015 1-2016
Single-Family Condominium
2014 2015 2016
- 23.0%- 0.1%- 23.1%+ 0.7%2014 2015 2016
+ 8.3% - 8.9%
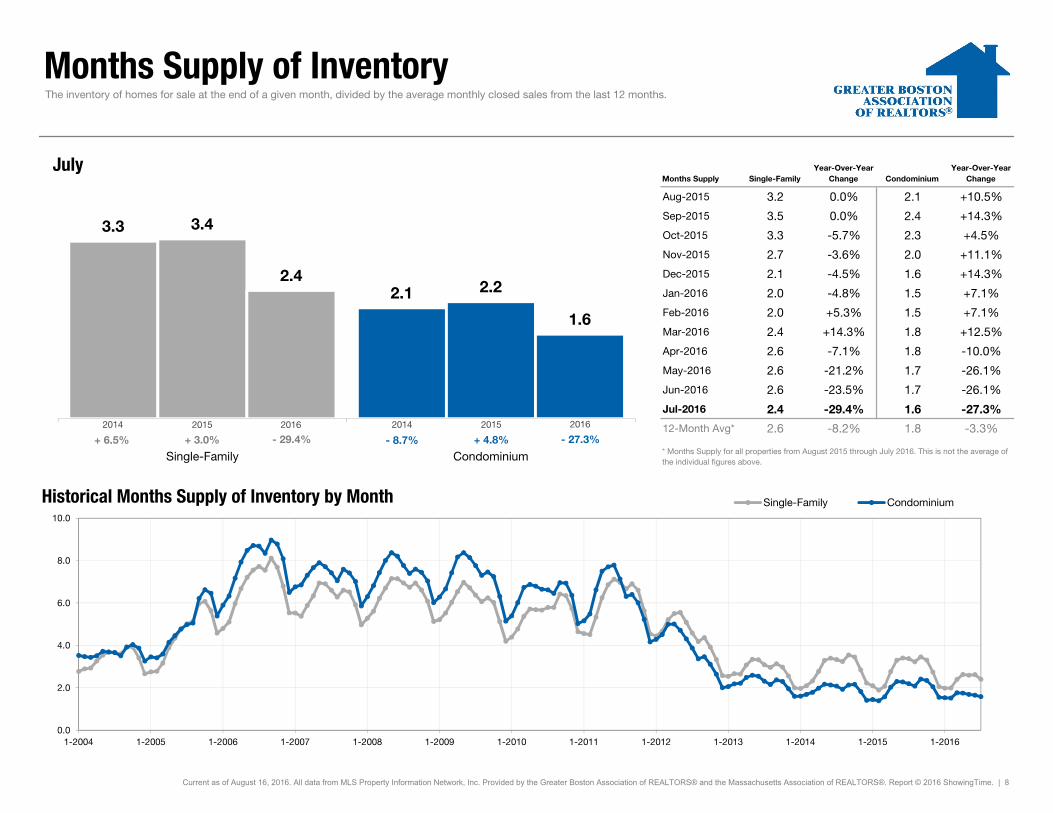
Months Supply of Inventory
Months Supply Single-FamilyYear-Over-Year
Change CondominiumYear-Over-Year
Change
Aug-2015 3.2 0.0% 2.1 +10.5%
Sep-2015 3.5 0.0% 2.4 +14.3%
Oct-2015 3.3 -5.7% 2.3 +4.5%
Nov-2015 2.7 -3.6% 2.0 +11.1%
Dec-2015 2.1 -4.5% 1.6 +14.3%
Jan-2016 2.0 -4.8% 1.5 +7.1%
Feb-2016 2.0 +5.3% 1.5 +7.1%
Mar-2016 2.4 +14.3% 1.8 +12.5%
Apr-2016 2.6 -7.1% 1.8 -10.0%
May-2016 2.6 -21.2% 1.7 -26.1%
Jun-2016 2.6 -23.5% 1.7 -26.1%
Jul-2016 2.4 -29.4% 1.6 -27.3%
12-Month Avg* 2.6 -8.2% 1.8 -3.3%
Historical Months Supply of Inventory by Month
The inventory of homes for sale at the end of a given month, divided by the average monthly closed sales from the last 12 months.
* Months Supply for all properties from August 2015 through July 2016. This is not the average of the individual figures above.
Current as of August 16, 2016. All data from MLS Property Information Network, Inc. Provided by the Greater Boston Association of REALTORS® and the Massachusetts Association of REALTORS®. Report © 2016 ShowingTime. | 8
3.3
2.1
3.4
2.22.4
1.6
Single-Family Condominium
July
0.0
2.0
4.0
6.0
8.0
10.0
1-2004 1-2005 1-2006 1-2007 1-2008 1-2009 1-2010 1-2011 1-2012 1-2013 1-2014 1-2015 1-2016
Single-Family Condominium
2014 2015 2016
- 27.3%+ 4.8%- 29.4%+ 3.0%2014 2015 2016
+ 6.5% - 8.7%
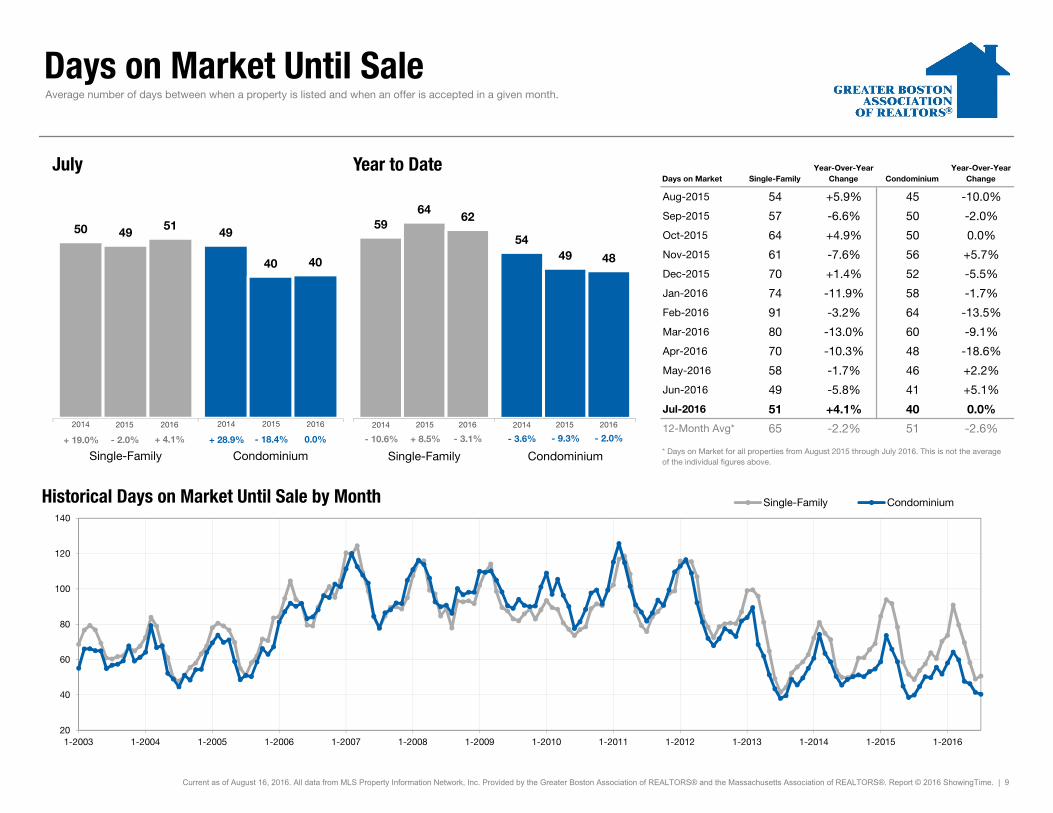
Days on Market Until Sale
Days on Market Single-FamilyYear-Over-Year
Change CondominiumYear-Over-Year
Change
Aug-2015 54 +5.9% 45 -10.0%
Sep-2015 57 -6.6% 50 -2.0%
Oct-2015 64 +4.9% 50 0.0%
Nov-2015 61 -7.6% 56 +5.7%
Dec-2015 70 +1.4% 52 -5.5%
Jan-2016 74 -11.9% 58 -1.7%
Feb-2016 91 -3.2% 64 -13.5%
Mar-2016 80 -13.0% 60 -9.1%
Apr-2016 70 -10.3% 48 -18.6%
May-2016 58 -1.7% 46 +2.2%
Jun-2016 49 -5.8% 41 +5.1%
Jul-2016 51 +4.1% 40 0.0%
12-Month Avg* 65 -2.2% 51 -2.6%
Historical Days on Market Until Sale by Month
Average number of days between when a property is listed and when an offer is accepted in a given month.
* Days on Market for all properties from August 2015 through July 2016. This is not the average of the individual figures above.
Current as of August 16, 2016. All data from MLS Property Information Network, Inc. Provided by the Greater Boston Association of REALTORS® and the Massachusetts Association of REALTORS®. Report © 2016 ShowingTime. | 9
50 4949
40
51
40
Single-Family Condominium
July
20
40
60
80
100
120
140
1-2003 1-2004 1-2005 1-2006 1-2007 1-2008 1-2009 1-2010 1-2011 1-2012 1-2013 1-2014 1-2015 1-2016
Single-Family Condominium
5954
64
49
62
48
Single-Family Condominium
Year to Date
2014 2015 2016
0.0%- 18.4%+ 4.1%- 2.0% - 9.3%- 3.1%+ 8.5% - 2.0%
2014 2015 2016 2014 2015 2016 2014 2015 2016
+ 19.0% - 10.6% - 3.6%+ 28.9%
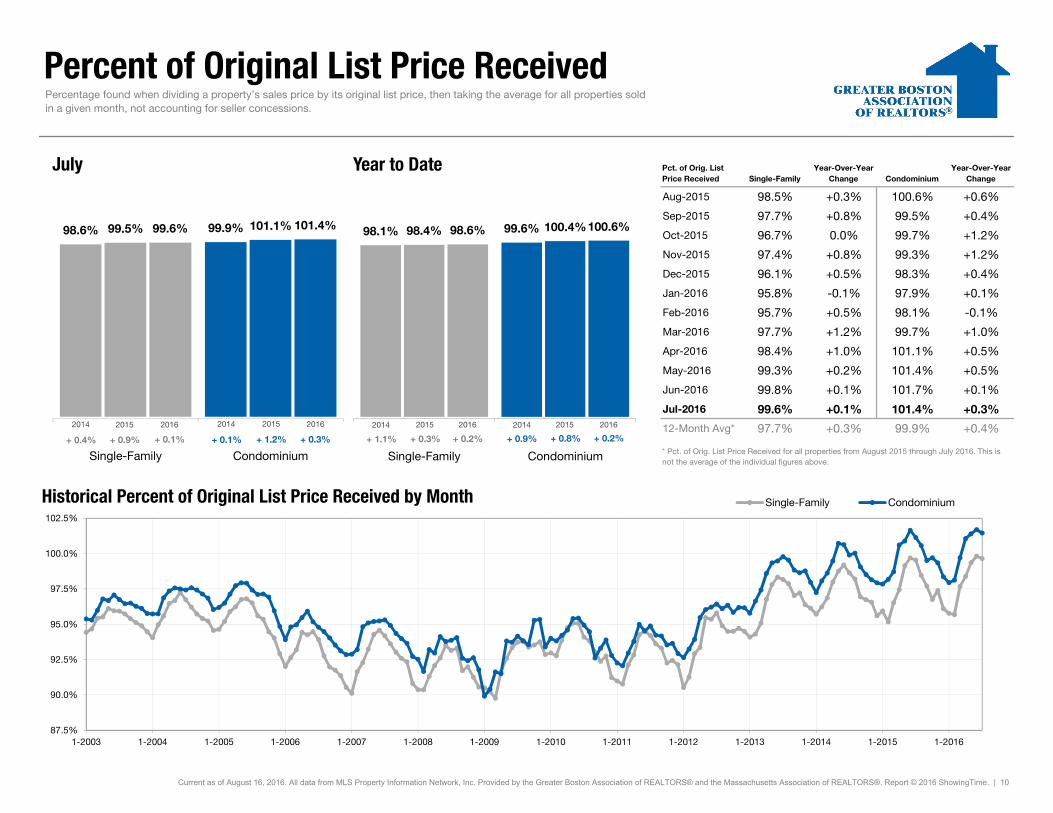
Percent of Original List Price Received
Pct. of Orig. List Price Received Single-Family
Year-Over-YearChange Condominium
Year-Over-YearChange
Aug-2015 98.5% +0.3% 100.6% +0.6%
Sep-2015 97.7% +0.8% 99.5% +0.4%
Oct-2015 96.7% 0.0% 99.7% +1.2%
Nov-2015 97.4% +0.8% 99.3% +1.2%
Dec-2015 96.1% +0.5% 98.3% +0.4%
Jan-2016 95.8% -0.1% 97.9% +0.1%
Feb-2016 95.7% +0.5% 98.1% -0.1%
Mar-2016 97.7% +1.2% 99.7% +1.0%
Apr-2016 98.4% +1.0% 101.1% +0.5%
May-2016 99.3% +0.2% 101.4% +0.5%
Jun-2016 99.8% +0.1% 101.7% +0.1%
Jul-2016 99.6% +0.1% 101.4% +0.3%
12-Month Avg* 97.7% +0.3% 99.9% +0.4%
Historical Percent of Original List Price Received by Month
Percentage found when dividing a property’s sales price by its original list price, then taking the average for all properties soldin a given month, not accounting for seller concessions.
* Pct. of Orig. List Price Received for all properties from August 2015 through July 2016. This is not the average of the individual figures above.
Current as of August 16, 2016. All data from MLS Property Information Network, Inc. Provided by the Greater Boston Association of REALTORS® and the Massachusetts Association of REALTORS®. Report © 2016 ShowingTime. | 10
98.6% 99.9%99.5% 101.1%99.6% 101.4%
Single-Family Condominium
July
87.5%
90.0%
92.5%
95.0%
97.5%
100.0%
102.5%
1-2003 1-2004 1-2005 1-2006 1-2007 1-2008 1-2009 1-2010 1-2011 1-2012 1-2013 1-2014 1-2015 1-2016
Single-Family Condominium
98.1% 99.6%98.4% 100.4%98.6% 100.6%
Single-Family Condominium
Year to Date
2014 2015 2016
+ 0.3%+ 1.2%+ 0.1%+ 0.9% + 0.8%+ 0.2%+ 0.3% + 0.2%
2014 2015 2016 2014 2015 2016 2014 2015 2016
+ 0.4% + 1.1% + 0.9%+ 0.1%
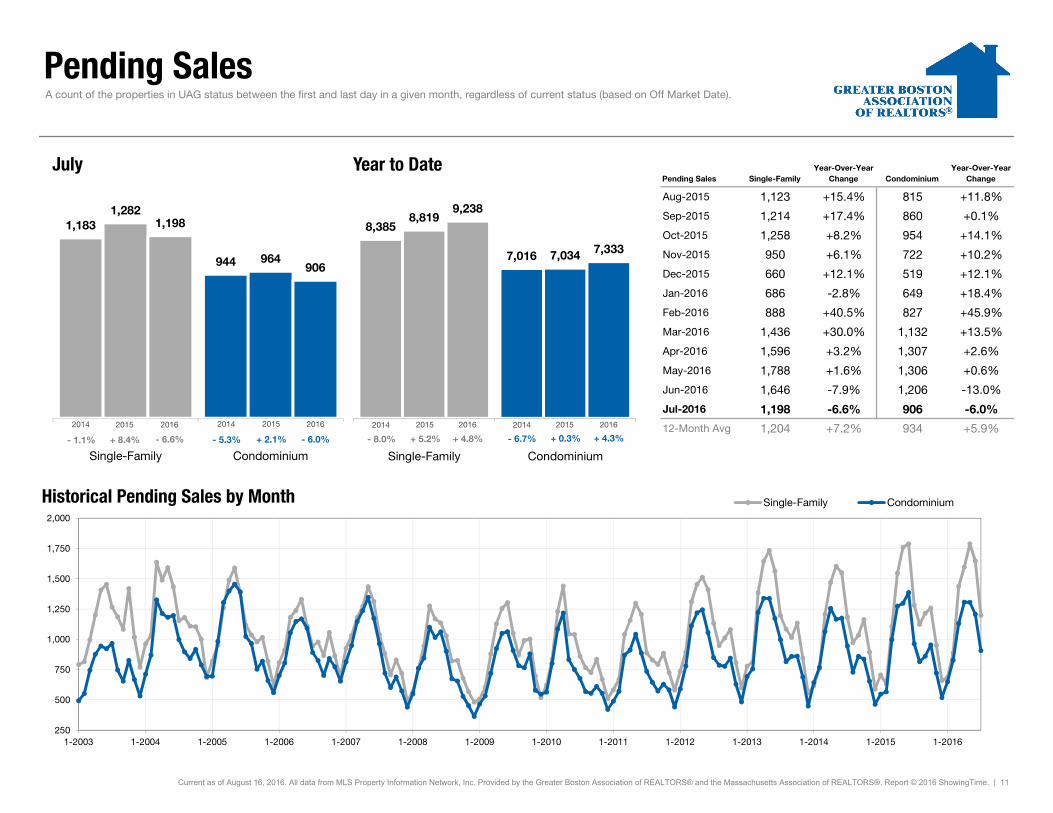
Pending Sales
Pending Sales Single-FamilyYear-Over-Year
Change CondominiumYear-Over-Year
Change
Aug-2015 1,123 +15.4% 815 +11.8%
Sep-2015 1,214 +17.4% 860 +0.1%
Oct-2015 1,258 +8.2% 954 +14.1%
Nov-2015 950 +6.1% 722 +10.2%
Dec-2015 660 +12.1% 519 +12.1%
Jan-2016 686 -2.8% 649 +18.4%
Feb-2016 888 +40.5% 827 +45.9%
Mar-2016 1,436 +30.0% 1,132 +13.5%
Apr-2016 1,596 +3.2% 1,307 +2.6%
May-2016 1,788 +1.6% 1,306 +0.6%
Jun-2016 1,646 -7.9% 1,206 -13.0%
Jul-2016 1,198 -6.6% 906 -6.0%
12-Month Avg 1,204 +7.2% 934 +5.9%
Historical Pending Sales by Month
A count of the properties in UAG status between the first and last day in a given month, regardless of current status (based on Off Market Date).
Current as of August 16, 2016. All data from MLS Property Information Network, Inc. Provided by the Greater Boston Association of REALTORS® and the Massachusetts Association of REALTORS®. Report © 2016 ShowingTime. | 11
1,183
944
1,282
964
1,198
906
Single-Family Condominium
July
250
500
750
1,000
1,250
1,500
1,750
2,000
1-2003 1-2004 1-2005 1-2006 1-2007 1-2008 1-2009 1-2010 1-2011 1-2012 1-2013 1-2014 1-2015 1-2016
Single-Family Condominium
8,385
7,016
8,819
7,034
9,238
7,333
Single-Family Condominium
Year to Date
2014 2015 2016
- 6.0%+ 2.1%- 6.6%+ 8.4% + 0.3%+ 4.8%+ 5.2% + 4.3%
2014 2015 2016 2014 2015 2016 2014 2015 2016
- 1.1% - 8.0% - 6.7%- 5.3%

New Listings
New Listings Single-FamilyYear-Over-Year
Change CondominiumYear-Over-Year
Change
Aug-2015 1,331 +11.8% 936 +18.3%
Sep-2015 1,954 +8.3% 1,439 +12.7%
Oct-2015 1,523 +3.0% 1,153 +3.5%
Nov-2015 875 +17.8% 762 +26.4%
Dec-2015 554 +10.6% 462 +15.8%
Jan-2016 903 +7.4% 805 +13.5%
Feb-2016 1,127 +76.9% 938 +50.6%
Mar-2016 2,171 +45.3% 1,542 +22.0%
Apr-2016 2,125 -14.0% 1,469 -15.2%
May-2016 2,074 -18.1% 1,435 -13.7%
Jun-2016 2,129 -6.2% 1,432 -8.6%
Jul-2016 1,323 -18.8% 1,105 -1.1%
12-Month Avg 1,507 +2.8% 1,123 +4.8%
Historical New Listings by Month
A count of the properties that have been newly listed on the market in a given month.
Current as of August 16, 2016. All data from MLS Property Information Network, Inc. Provided by the Greater Boston Association of REALTORS® and the Massachusetts Association of REALTORS®. Report © 2016 ShowingTime. | 12
1,442
1,078
1,630
1,117
1,323
1,105
Single-Family Condominium
July
0
1,000
2,000
3,000
4,000
1-2003 1-2004 1-2005 1-2006 1-2007 1-2008 1-2009 1-2010 1-2011 1-2012 1-2013 1-2014 1-2015 1-2016
Single-Family Condominium
11,656
8,593
11,876
8,674
11,852
8,726
Single-Family Condominium
Year to Date
2014 2015 2016
- 1.1%+ 3.6%- 18.8%+ 13.0% + 0.9%- 0.2%+ 1.9% + 0.6%
2014 2015 2016 2014 2015 2016 2014 2015 2016
+ 3.7% - 0.3% - 6.4%+ 1.1%
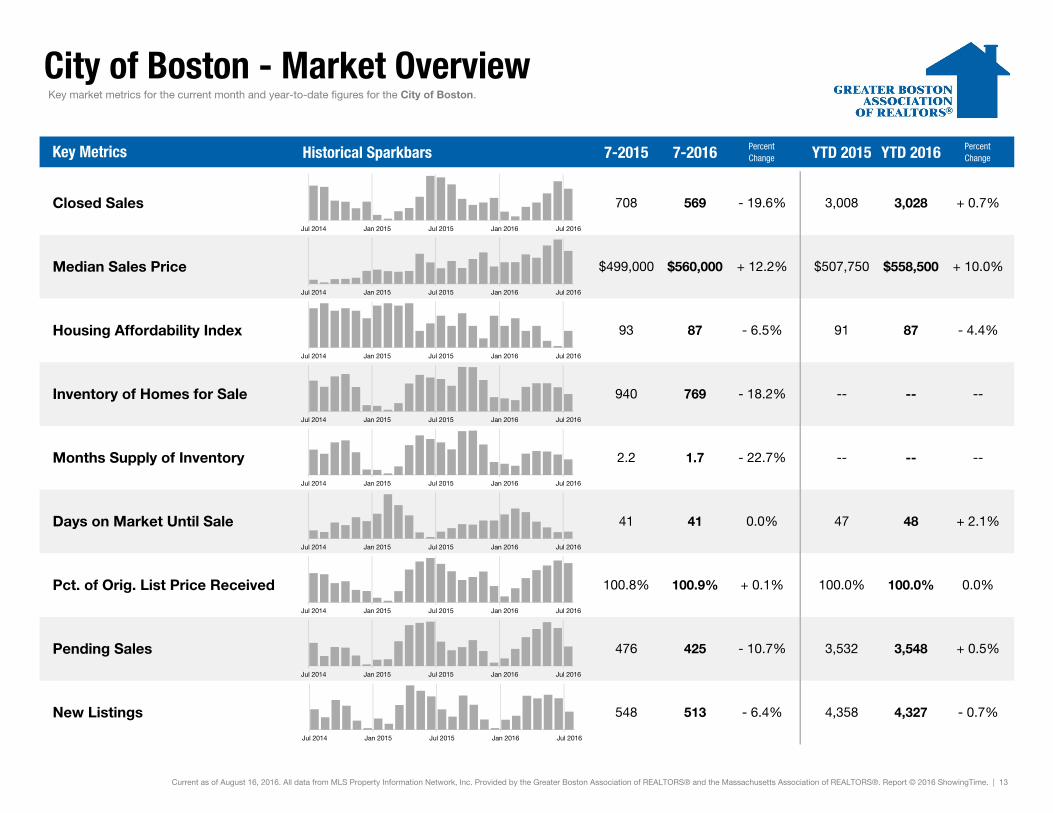
City of Boston - Market Overview
Historical Sparkbars 7-2015 7-2016 PercentChange YTD 2015 YTD 2016 Percent
Change
Current as of August 16, 2016. All data from MLS Property Information Network, Inc. Provided by the Greater Boston Association of REALTORS® and the Massachusetts Association of REALTORS®. Report © 2016 ShowingTime. | 13
+ 0.5%
4,327 - 0.7%
3,548
New Listings 548 513 - 6.4% 4,358
Pending Sales 476 425 - 10.7% 3,532
+ 2.1%
Pct. of Orig. List Price Received 100.8% 100.9% + 0.1% 100.0% 100.0% 0.0%
Days on Market Until Sale 41 41 0.0% 47 48
-- --
Inventory of Homes for Sale 940 769 - 18.2% --
Months Supply of Inventory 2.2 1.7 - 22.7% --
87 - 4.4%
----
Housing Affordability Index 93 87 - 6.5% 91
3,028 + 0.7%
Median Sales Price $499,000 $560,000 + 12.2% $507,750 $558,500 + 10.0%
3,008
Key market metrics for the current month and year-to-date figures for the City of Boston.
Closed Sales 708 569 - 19.6%
Key Metrics
Jul 2014 Jan 2015 Jul 2015 Jan 2016 Jul 2016
Jul 2014 Jan 2015 Jul 2015 Jan 2016 Jul 2016
Jul 2014 Jan 2015 Jul 2015 Jan 2016 Jul 2016
Jul 2014 Jan 2015 Jul 2015 Jan 2016 Jul 2016
Jul 2014 Jan 2015 Jul 2015 Jan 2016 Jul 2016
Jul 2014 Jan 2015 Jul 2015 Jan 2016 Jul 2016
Jul 2014 Jan 2015 Jul 2015 Jan 2016 Jul 2016
Jul 2014 Jan 2015 Jul 2015 Jan 2016 Jul 2016
Jul 2014 Jan 2015 Jul 2015 Jan 2016 Jul 2016
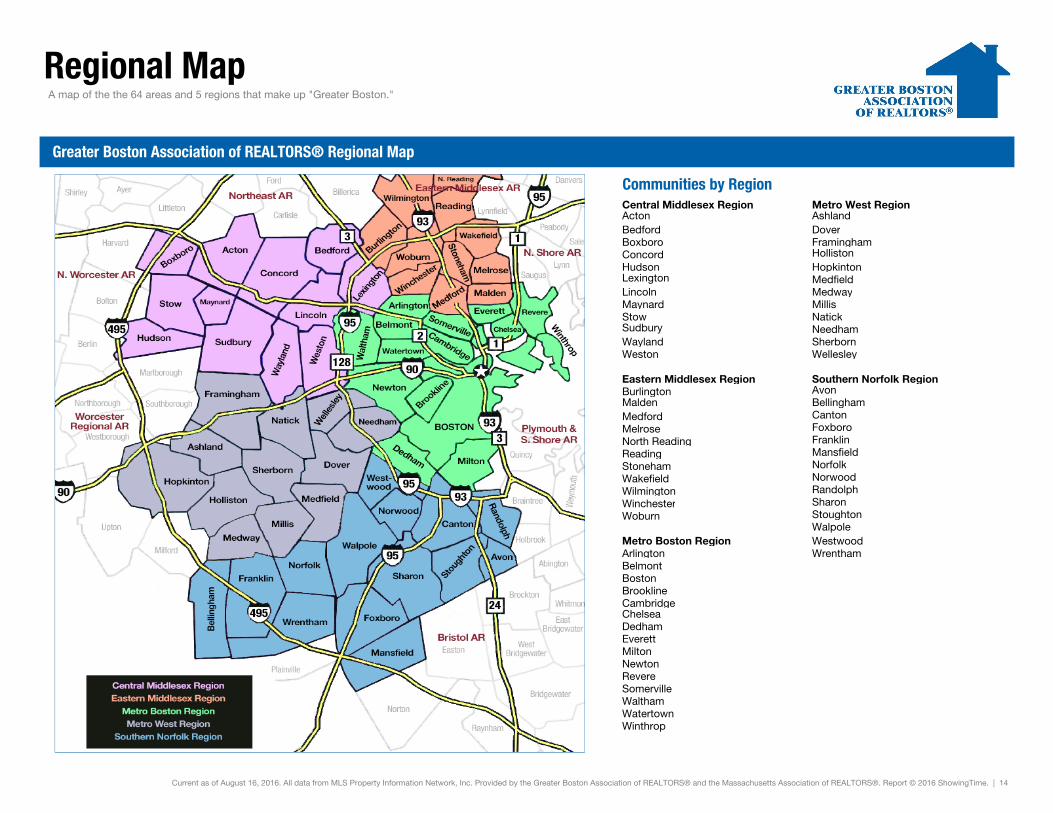
Regional Map
Central Middlesex Region Metro West RegionActon AshlandBedford DoverBoxboro FraminghamConcord HollistonHudson HopkintonLexington MedfieldLincoln MedwayMaynard MillisStow NatickSudbury NeedhamWayland SherbornWeston Wellesley
Eastern Middlesex Region Southern Norfolk RegionBurlington AvonMalden BellinghamMedford CantonMelrose FoxboroNorth Reading FranklinReading MansfieldStoneham NorfolkWakefield NorwoodWilmington RandolphWinchester SharonWoburn Stoughton
WalpoleMetro Boston Region WestwoodArlington WrenthamBelmontBostonBrooklineCambridgeChelseaDedhamEverettMiltonNewtonRevereSomervilleWalthamWatertownWinthrop
Current as of August 16, 2016. All data from MLS Property Information Network, Inc. Provided by the Greater Boston Association of REALTORS® and the Massachusetts Association of REALTORS®. Report © 2016 ShowingTime. | 14
A map of the the 64 areas and 5 regions that make up "Greater Boston."
Greater Boston Association of REALTORS® Regional Map
Communities by Region