February 2015 Greater Boston Real Estate Market Trends Report
Upload
unit-realty-groupCategory
view
333download
0
April 2016 Quick Facts
23456789
1011121314
City of Boston OverviewRegional Map
Median Sales PriceHousing Affordability IndexInventory of Homes for SaleMonths Supply of InventoryDays on Market Until SalePercent of Original List Price Received
Monthly Indicators
The housing market is being predictable, and that's a good thing. At the beginning of the year, it was anticipated that the prevailing trends of the past year would continue into and through 2016, and that has largely been the case. The number of homes for sale has generally remained lower compared to a year ago, and prices have been steadily rising in desirable communities where homes show well.
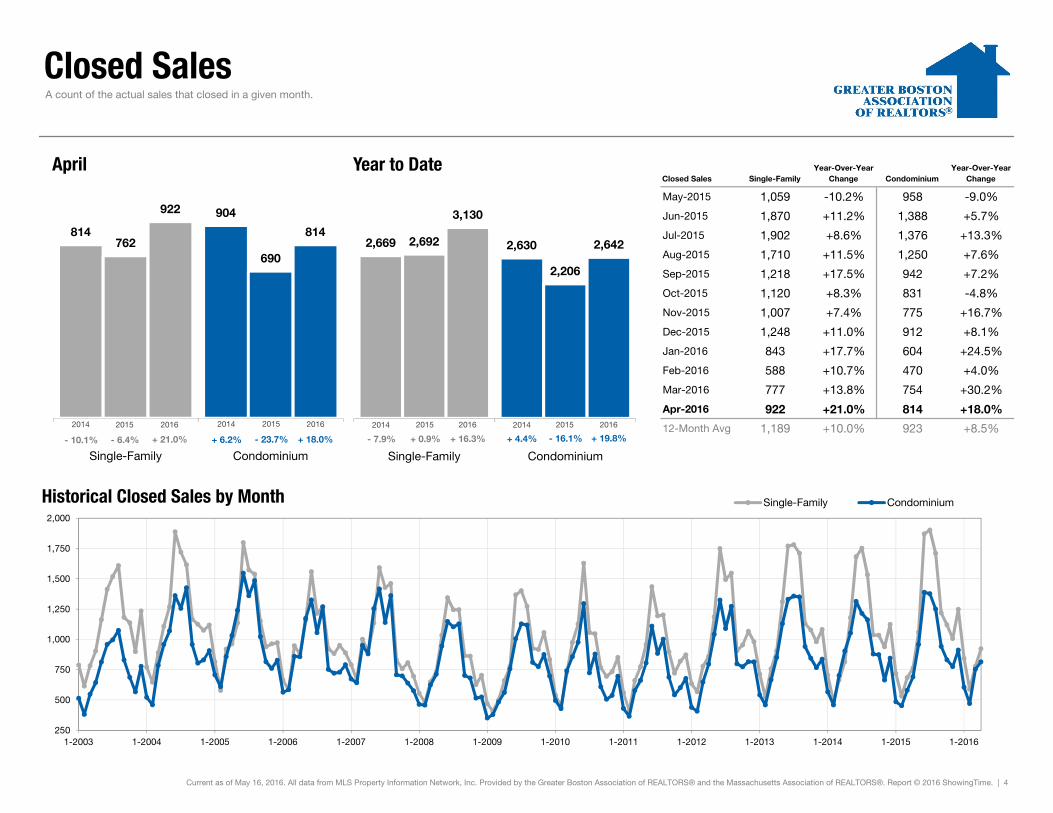
Closed Sales increased 21.0 percent for Single-Family homes and 18.0 percent for Condominium homes. Pending Sales increased 8.7 percent for Single-Family homes and 6.7 percent for Condominium homes. Inventory decreased 3.2 percent for Single-Family homes and 15.8 percent for Condominium homes.
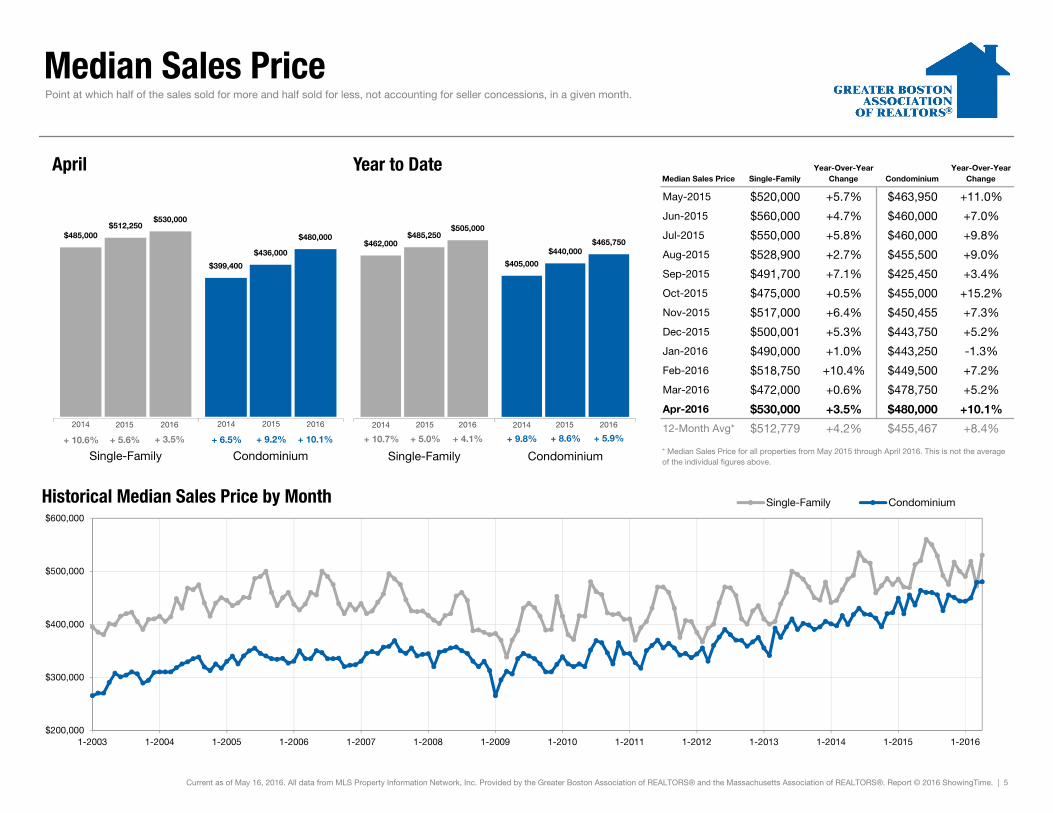
The Median Sales Price was up 3.5 percent to $530,000 for Single-Family homes and 10.1 percent to $480,000 for Condominium homes. Days on Market decreased 10.3 percent for Single-Family homes and 22.0 percent for Condominium homes. Months Supply of Inventory decreased 14.3 percent for Single-Family homes and 20.0 percent for Condominium homes.
There have been no striking changes to curtail what should be a decent run of home sales over the next several months. Mortgage rates have remained stubbornly and wonderfully low, the unemployment rate has remained at or near 5.0 percent for eight straight months and wages have increased for a great many people. New construction has been slow, and that may be a damper on sales, but the general outlook remains strong.
Data is refreshed regularly to capture changes in market activity so figures shown may be different than previously reported. Current as of May 16, 2016. All data from MLS Property Information Network, Inc. Provided by the Greater Boston Association of REALTORS® and the Massachusetts Association of REALTORS®. Report © 2016 ShowingTime.
Single-Family Home Market Overview
+ 19.6% + 21.0% + 18.0%
This is a research tool provided by the Greater Boston Association of REALTORS®. Percent changes are calculated using rounded figures.
Condominium Market Overview
Year-Over-Year (YoY) Change in Closed Sales
All Properties
Year-Over-Year (YoY) Change in Closed Sales
Single-Family Only
Year-Over-Year (YoY) Change in Closed Sales
Condominium Only
Closed Sales
Pending SalesNew Listings

Single-Family Home Market Overview
Historical Sparkbars 4-2015 4-2016 PercentChange YTD 2015 YTD 2016 Percent
Change
+ 16.4%2,472 2,131 - 13.8% 5,443 6,337
Current as of May 16, 2016. All data from MLS Property Information Network, Inc. Provided by the Greater Boston Association of REALTORS® and the Massachusetts Association of REALTORS®. Report © 2016 ShowingTime. | 2
+ 0.6%
Pending Sales 1,547 1,681 + 8.7% 3,992 4,743 + 18.8%
Pct. of Orig. List Price Received 97.4% 98.4% + 1.0% 96.4% 97.0%
New Listings
--
Days on Market Until Sale 78 70 - 10.3% 86 77 - 10.5%
Months Supply of Inventory 2.8 2.4 - 14.3% -- --
- 3.4%
Inventory of Homes for Sale 2,988 2,891 - 3.2% -- -- --
Housing Affordability Index 85 82 - 3.5% 89 86
3,130 + 16.3%
Median Sales Price $512,250 $530,000 + 3.5% $485,250 $505,000 + 4.1%
2,692
Key market metrics for the current month and year-to-date figures for Single-Family Homes Only.
Closed Sales 762 922 + 21.0%
Key Metrics
Apr 2014 Oct 2014 Apr 2015 Oct 2015 Apr 2016
Apr 2014 Oct 2014 Apr 2015 Oct 2015 Apr 2016
Apr 2014 Oct 2014 Apr 2015 Oct 2015 Apr 2016
Apr 2014 Oct 2014 Apr 2015 Oct 2015 Apr 2016
Apr 2014 Oct 2014 Apr 2015 Oct 2015 Apr 2016
Apr 2014 Oct 2014 Apr 2015 Oct 2015 Apr 2016
Apr 2014 Oct 2014 Apr 2015 Oct 2015 Apr 2016
Apr 2014 Oct 2014 Apr 2015 Oct 2015 Apr 2016
Apr 2014 Oct 2014 Apr 2015 Oct 2015 Apr 2016

Condominium Market Overview
Historical Sparkbars 4-2015 4-2016 PercentChange YTD 2015 YTD 2016 Percent
Change
Key market metrics for the current month and year-to-date figures for Condominium Properties Only.
Closed Sales 690 814
Median Sales Price $436,000 $480,000
Inventory of Homes for Sale 1,719 1,448
Days on Market Until Sale 59 46
Housing Affordability Index 99
+ 18.0%
Key Metrics
2,642 + 19.8%2,206
90 - 9.1% 99 93 - 6.1%
+ 10.1% $440,000 $465,750 + 5.9%
--
-- --
- 15.8% -- --
Months Supply of Inventory 2.0 1.6 - 20.0% --
- 22.0% 64
+ 9.8%
Pct. of Orig. List Price Received 100.6% 101.1% + 0.5% 99.0%
- 12.5%
99.4% + 0.4%
56
Current as of May 16, 2016. All data from MLS Property Information Network, Inc. Provided by the Greater Boston Association of REALTORS® and the Massachusetts Association of REALTORS®. Report © 2016 ShowingTime. | 3
+ 18.1%Pending Sales 1,274 1,359 + 6.7% 3,387 3,999
New Listings 1,732 1,473 - 15.0% 4,329 4,754
Apr 2014 Oct 2014 Apr 2015 Oct 2015 Apr 2016
Apr 2014 Oct 2014 Apr 2015 Oct 2015 Apr 2016
Apr 2014 Oct 2014 Apr 2015 Oct 2015 Apr 2016
Apr 2014 Oct 2014 Apr 2015 Oct 2015 Apr 2016
Apr 2014 Oct 2014 Apr 2015 Oct 2015 Apr 2016
Apr 2014 Oct 2014 Apr 2015 Oct 2015 Apr 2016
Apr 2014 Oct 2014 Apr 2015 Oct 2015 Apr 2016
Apr 2014 Oct 2014 Apr 2015 Oct 2015 Apr 2016
Apr 2014 Oct 2014 Apr 2015 Oct 2015 Apr 2016
Closed Sales
Closed Sales Single-FamilyYear-Over-Year
Change CondominiumYear-Over-Year
Change
May-2015 1,059 -10.2% 958 -9.0%
Jun-2015 1,870 +11.2% 1,388 +5.7%
Jul-2015 1,902 +8.6% 1,376 +13.3%
Aug-2015 1,710 +11.5% 1,250 +7.6%
Sep-2015 1,218 +17.5% 942 +7.2%
Oct-2015 1,120 +8.3% 831 -4.8%
Nov-2015 1,007 +7.4% 775 +16.7%
Dec-2015 1,248 +11.0% 912 +8.1%
Jan-2016 843 +17.7% 604 +24.5%
Feb-2016 588 +10.7% 470 +4.0%
Mar-2016 777 +13.8% 754 +30.2%
Apr-2016 922 +21.0% 814 +18.0%
12-Month Avg 1,189 +10.0% 923 +8.5%
Historical Closed Sales by Month
Current as of May 16, 2016. All data from MLS Property Information Network, Inc. Provided by the Greater Boston Association of REALTORS® and the Massachusetts Association of REALTORS®. Report © 2016 ShowingTime. | 4
A count of the actual sales that closed in a given month.
814
904
762690
922
814
Single-Family Condominium
April
250
500
750
1,000
1,250
1,500
1,750
2,000
1-2003 1-2004 1-2005 1-2006 1-2007 1-2008 1-2009 1-2010 1-2011 1-2012 1-2013 1-2014 1-2015 1-2016
Single-Family Condominium
2,669 2,6302,692
2,206
3,130
2,642
Single-Family Condominium
Year to Date
2014 2015 2016
+ 18.0%- 23.7%+ 21.0%- 6.4% - 16.1%+ 16.3%+ 0.9% + 19.8%
2014 2015 2016 2014 2015 2016 2014 2015 2016
- 10.1% - 7.9% + 4.4%+ 6.2%
Median Sales Price
Median Sales Price Single-FamilyYear-Over-Year
Change CondominiumYear-Over-Year
Change
May-2015 $520,000 +5.7% $463,950 +11.0%
Jun-2015 $560,000 +4.7% $460,000 +7.0%
Jul-2015 $550,000 +5.8% $460,000 +9.8%
Aug-2015 $528,900 +2.7% $455,500 +9.0%
Sep-2015 $491,700 +7.1% $425,450 +3.4%
Oct-2015 $475,000 +0.5% $455,000 +15.2%
Nov-2015 $517,000 +6.4% $450,455 +7.3%
Dec-2015 $500,001 +5.3% $443,750 +5.2%
Jan-2016 $490,000 +1.0% $443,250 -1.3%
Feb-2016 $518,750 +10.4% $449,500 +7.2%
Mar-2016 $472,000 +0.6% $478,750 +5.2%
Apr-2016 $530,000 +3.5% $480,000 +10.1%
12-Month Avg* $512,779 +4.2% $455,467 +8.4%
Historical Median Sales Price by Month
* Median Sales Price for all properties from May 2015 through April 2016. This is not the average of the individual figures above.
Current as of May 16, 2016. All data from MLS Property Information Network, Inc. Provided by the Greater Boston Association of REALTORS® and the Massachusetts Association of REALTORS®. Report © 2016 ShowingTime. | 5
Point at which half of the sales sold for more and half sold for less, not accounting for seller concessions, in a given month.
$485,000
$399,400
$512,250
$436,000
$530,000
$480,000
Single-Family Condominium
April
$200,000
$300,000
$400,000
$500,000
$600,000
1-2003 1-2004 1-2005 1-2006 1-2007 1-2008 1-2009 1-2010 1-2011 1-2012 1-2013 1-2014 1-2015 1-2016
Single-Family Condominium
$462,000
$405,000
$485,250
$440,000
$505,000
$465,750
Single-Family Condominium
Year to Date
2014 2015 2016
+ 10.1%+ 9.2%+ 3.5%+ 5.6% + 8.6%+ 4.1%+ 5.0% + 5.9%
2014 2015 2016 2014 2015 2016 2014 2015 2016
+ 10.6% + 10.7% + 9.8%+ 6.5%
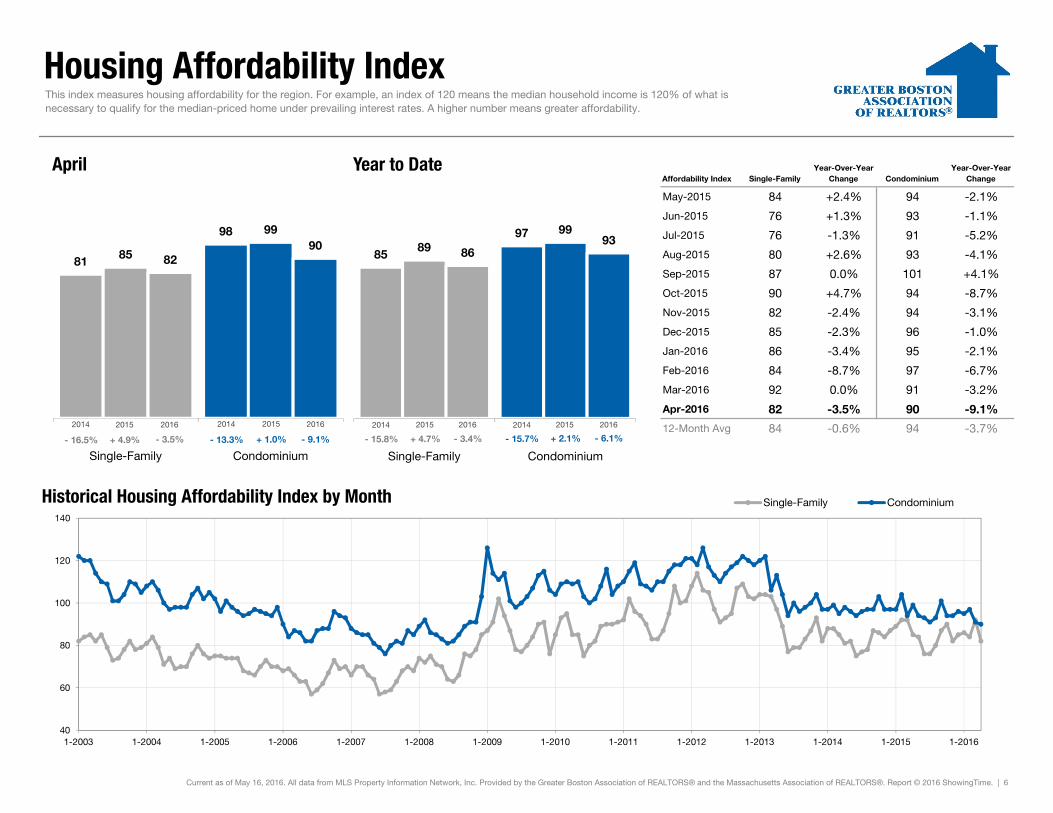
Housing Affordability Index
Affordability Index Single-FamilyYear-Over-Year
Change CondominiumYear-Over-Year
Change
May-2015 84 +2.4% 94 -2.1%
Jun-2015 76 +1.3% 93 -1.1%
Jul-2015 76 -1.3% 91 -5.2%
Aug-2015 80 +2.6% 93 -4.1%
Sep-2015 87 0.0% 101 +4.1%
Oct-2015 90 +4.7% 94 -8.7%
Nov-2015 82 -2.4% 94 -3.1%
Dec-2015 85 -2.3% 96 -1.0%
Jan-2016 86 -3.4% 95 -2.1%
Feb-2016 84 -8.7% 97 -6.7%
Mar-2016 92 0.0% 91 -3.2%
Apr-2016 82 -3.5% 90 -9.1%
12-Month Avg 84 -0.6% 94 -3.7%
Historical Housing Affordability Index by Month
Current as of May 16, 2016. All data from MLS Property Information Network, Inc. Provided by the Greater Boston Association of REALTORS® and the Massachusetts Association of REALTORS®. Report © 2016 ShowingTime. | 6
This index measures housing affordability for the region. For example, an index of 120 means the median household income is 120% of what is necessary to qualify for the median-priced home under prevailing interest rates. A higher number means greater affordability.
81
98
85
99
8290
Single-Family Condominium
April
40
60
80
100
120
140
1-2003 1-2004 1-2005 1-2006 1-2007 1-2008 1-2009 1-2010 1-2011 1-2012 1-2013 1-2014 1-2015 1-2016
Single-Family Condominium
85
9789
99
8693
Single-Family Condominium
Year to Date
2014 2015 2016
- 9.1%+ 1.0%- 3.5%+ 4.9% + 2.1%- 3.4%+ 4.7% - 6.1%
2014 2015 2016 2014 2015 2016 2014 2015 2016
- 16.5% - 15.8% - 15.7%- 13.3%
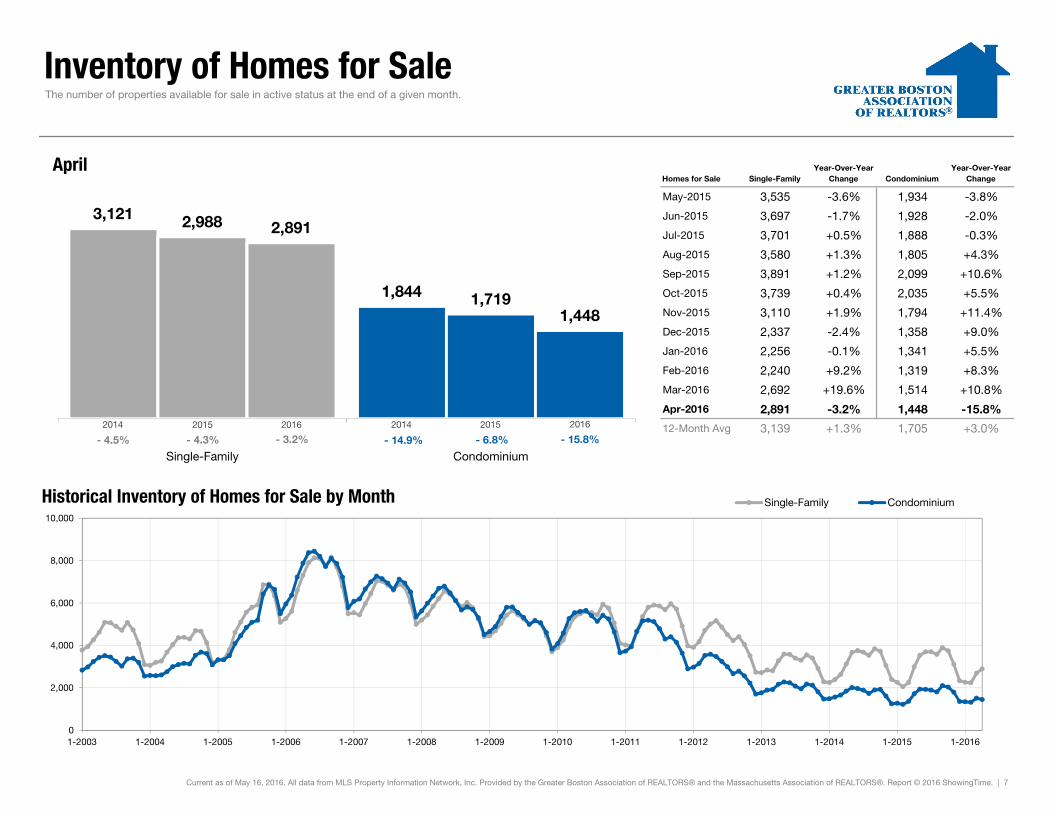
Inventory of Homes for Sale
Homes for Sale Single-FamilyYear-Over-Year
Change CondominiumYear-Over-Year
Change
May-2015 3,535 -3.6% 1,934 -3.8%
Jun-2015 3,697 -1.7% 1,928 -2.0%
Jul-2015 3,701 +0.5% 1,888 -0.3%
Aug-2015 3,580 +1.3% 1,805 +4.3%
Sep-2015 3,891 +1.2% 2,099 +10.6%
Oct-2015 3,739 +0.4% 2,035 +5.5%
Nov-2015 3,110 +1.9% 1,794 +11.4%
Dec-2015 2,337 -2.4% 1,358 +9.0%
Jan-2016 2,256 -0.1% 1,341 +5.5%
Feb-2016 2,240 +9.2% 1,319 +8.3%
Mar-2016 2,692 +19.6% 1,514 +10.8%
Apr-2016 2,891 -3.2% 1,448 -15.8%
12-Month Avg 3,139 +1.3% 1,705 +3.0%
Historical Inventory of Homes for Sale by Month
Current as of May 16, 2016. All data from MLS Property Information Network, Inc. Provided by the Greater Boston Association of REALTORS® and the Massachusetts Association of REALTORS®. Report © 2016 ShowingTime. | 7
The number of properties available for sale in active status at the end of a given month.
3,121
1,844
2,988
1,719
2,891
1,448
Single-Family Condominium
April
0
2,000
4,000
6,000
8,000
10,000
1-2003 1-2004 1-2005 1-2006 1-2007 1-2008 1-2009 1-2010 1-2011 1-2012 1-2013 1-2014 1-2015 1-2016
Single-Family Condominium
2014 2015 2016
- 15.8%- 6.8%- 3.2%- 4.3%2014 2015 2016
- 4.5% - 14.9%
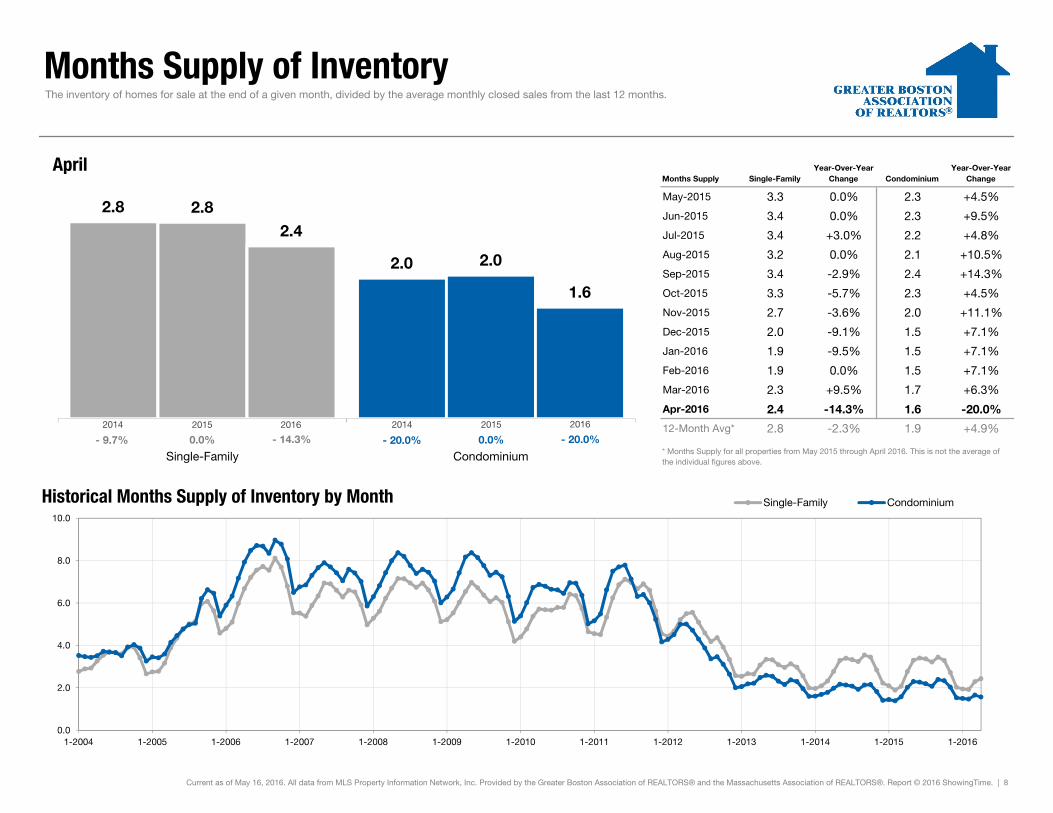
Months Supply of Inventory
Months Supply Single-FamilyYear-Over-Year
Change CondominiumYear-Over-Year
Change
May-2015 3.3 0.0% 2.3 +4.5%
Jun-2015 3.4 0.0% 2.3 +9.5%
Jul-2015 3.4 +3.0% 2.2 +4.8%
Aug-2015 3.2 0.0% 2.1 +10.5%
Sep-2015 3.4 -2.9% 2.4 +14.3%
Oct-2015 3.3 -5.7% 2.3 +4.5%
Nov-2015 2.7 -3.6% 2.0 +11.1%
Dec-2015 2.0 -9.1% 1.5 +7.1%
Jan-2016 1.9 -9.5% 1.5 +7.1%
Feb-2016 1.9 0.0% 1.5 +7.1%
Mar-2016 2.3 +9.5% 1.7 +6.3%
Apr-2016 2.4 -14.3% 1.6 -20.0%
12-Month Avg* 2.8 -2.3% 1.9 +4.9%
Historical Months Supply of Inventory by Month
* Months Supply for all properties from May 2015 through April 2016. This is not the average of the individual figures above.
Current as of May 16, 2016. All data from MLS Property Information Network, Inc. Provided by the Greater Boston Association of REALTORS® and the Massachusetts Association of REALTORS®. Report © 2016 ShowingTime. | 8
The inventory of homes for sale at the end of a given month, divided by the average monthly closed sales from the last 12 months.
2.8
2.0
2.8
2.0
2.4
1.6
Single-Family Condominium
April
0.0
2.0
4.0
6.0
8.0
10.0
1-2004 1-2005 1-2006 1-2007 1-2008 1-2009 1-2010 1-2011 1-2012 1-2013 1-2014 1-2015 1-2016
Single-Family Condominium
2014 2015 2016
- 20.0%0.0%- 14.3%0.0%2014 2015 2016
- 9.7% - 20.0%
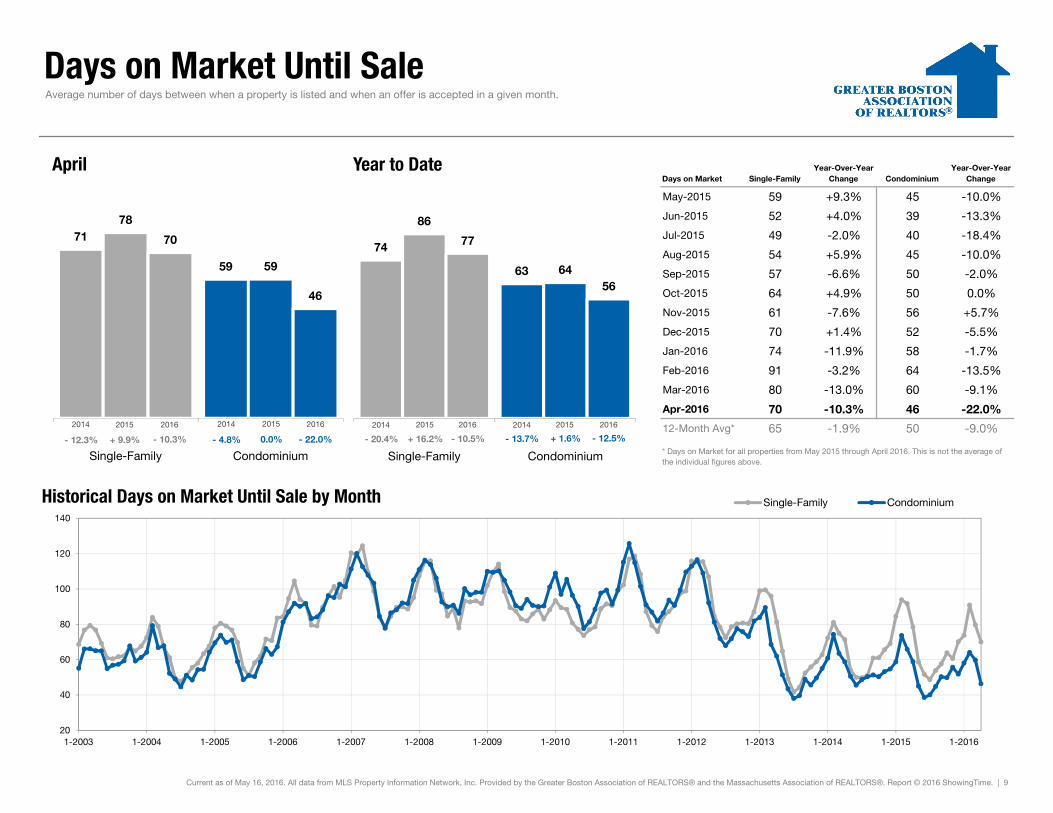
Days on Market Until Sale
Days on Market Single-FamilyYear-Over-Year
Change CondominiumYear-Over-Year
Change
May-2015 59 +9.3% 45 -10.0%
Jun-2015 52 +4.0% 39 -13.3%
Jul-2015 49 -2.0% 40 -18.4%
Aug-2015 54 +5.9% 45 -10.0%
Sep-2015 57 -6.6% 50 -2.0%
Oct-2015 64 +4.9% 50 0.0%
Nov-2015 61 -7.6% 56 +5.7%
Dec-2015 70 +1.4% 52 -5.5%
Jan-2016 74 -11.9% 58 -1.7%
Feb-2016 91 -3.2% 64 -13.5%
Mar-2016 80 -13.0% 60 -9.1%
Apr-2016 70 -10.3% 46 -22.0%
12-Month Avg* 65 -1.9% 50 -9.0%
Historical Days on Market Until Sale by Month
* Days on Market for all properties from May 2015 through April 2016. This is not the average of the individual figures above.
Current as of May 16, 2016. All data from MLS Property Information Network, Inc. Provided by the Greater Boston Association of REALTORS® and the Massachusetts Association of REALTORS®. Report © 2016 ShowingTime. | 9
Average number of days between when a property is listed and when an offer is accepted in a given month.
71
59
78
59
70
46
Single-Family Condominium
April
20
40
60
80
100
120
140
1-2003 1-2004 1-2005 1-2006 1-2007 1-2008 1-2009 1-2010 1-2011 1-2012 1-2013 1-2014 1-2015 1-2016
Single-Family Condominium
74
63
86
64
77
56
Single-Family Condominium
Year to Date
2014 2015 2016
- 22.0%0.0%- 10.3%+ 9.9% + 1.6%- 10.5%+ 16.2% - 12.5%
2014 2015 2016 2014 2015 2016 2014 2015 2016
- 12.3% - 20.4% - 13.7%- 4.8%
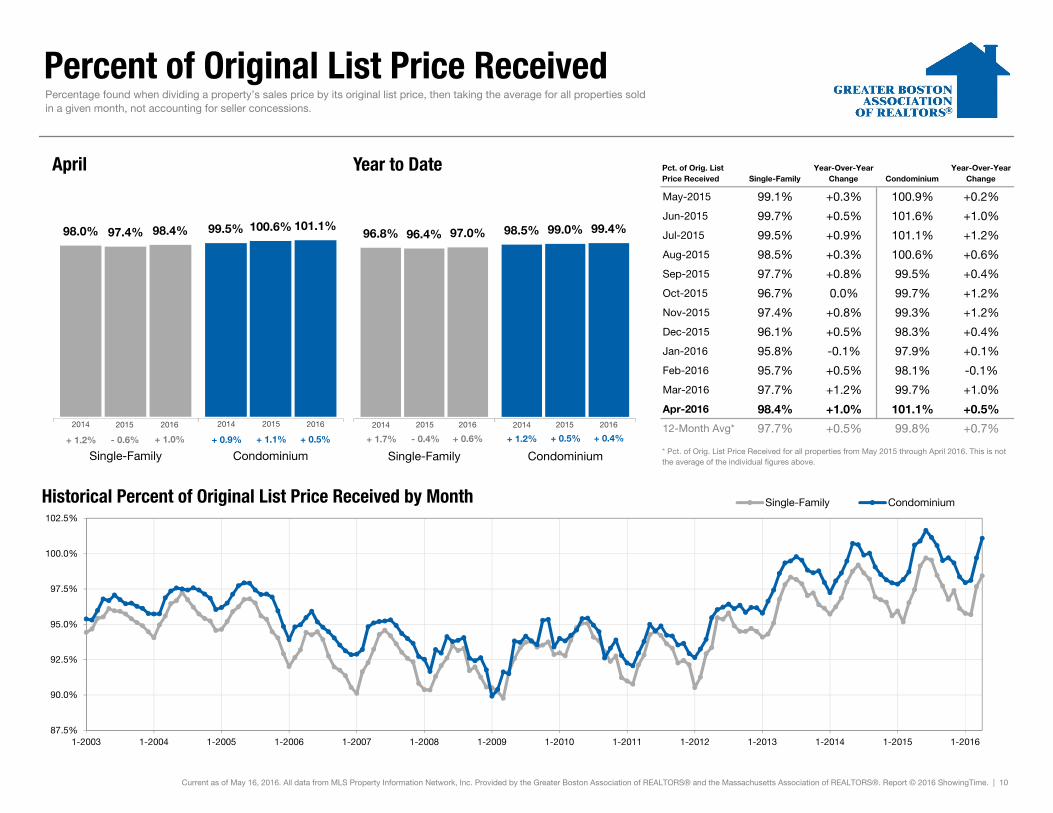
Percent of Original List Price Received
Pct. of Orig. List Price Received Single-Family
Year-Over-YearChange Condominium
Year-Over-YearChange
May-2015 99.1% +0.3% 100.9% +0.2%
Jun-2015 99.7% +0.5% 101.6% +1.0%
Jul-2015 99.5% +0.9% 101.1% +1.2%
Aug-2015 98.5% +0.3% 100.6% +0.6%
Sep-2015 97.7% +0.8% 99.5% +0.4%
Oct-2015 96.7% 0.0% 99.7% +1.2%
Nov-2015 97.4% +0.8% 99.3% +1.2%
Dec-2015 96.1% +0.5% 98.3% +0.4%
Jan-2016 95.8% -0.1% 97.9% +0.1%
Feb-2016 95.7% +0.5% 98.1% -0.1%
Mar-2016 97.7% +1.2% 99.7% +1.0%
Apr-2016 98.4% +1.0% 101.1% +0.5%
12-Month Avg* 97.7% +0.5% 99.8% +0.7%
Historical Percent of Original List Price Received by Month
* Pct. of Orig. List Price Received for all properties from May 2015 through April 2016. This is not the average of the individual figures above.
Current as of May 16, 2016. All data from MLS Property Information Network, Inc. Provided by the Greater Boston Association of REALTORS® and the Massachusetts Association of REALTORS®. Report © 2016 ShowingTime. | 10
Percentage found when dividing a property’s sales price by its original list price, then taking the average for all properties soldin a given month, not accounting for seller concessions.
98.0% 99.5%97.4% 100.6%98.4% 101.1%
Single-Family Condominium
April
87.5%
90.0%
92.5%
95.0%
97.5%
100.0%
102.5%
1-2003 1-2004 1-2005 1-2006 1-2007 1-2008 1-2009 1-2010 1-2011 1-2012 1-2013 1-2014 1-2015 1-2016
Single-Family Condominium
96.8% 98.5%96.4% 99.0%97.0% 99.4%
Single-Family Condominium
Year to Date
2014 2015 2016
+ 0.5%+ 1.1%+ 1.0%- 0.6% + 0.5%+ 0.6%- 0.4% + 0.4%
2014 2015 2016 2014 2015 2016 2014 2015 2016
+ 1.2% + 1.7% + 1.2%+ 0.9%
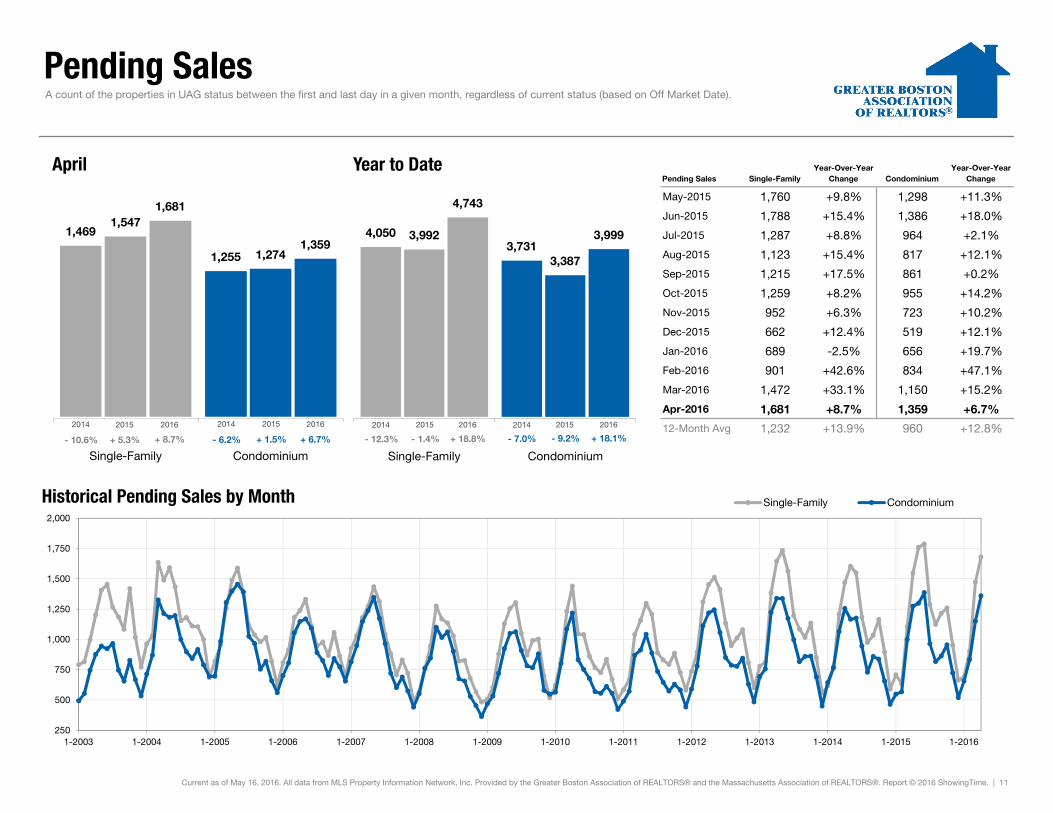
Pending Sales
Pending Sales Single-FamilyYear-Over-Year
Change CondominiumYear-Over-Year
Change
May-2015 1,760 +9.8% 1,298 +11.3%
Jun-2015 1,788 +15.4% 1,386 +18.0%
Jul-2015 1,287 +8.8% 964 +2.1%
Aug-2015 1,123 +15.4% 817 +12.1%
Sep-2015 1,215 +17.5% 861 +0.2%
Oct-2015 1,259 +8.2% 955 +14.2%
Nov-2015 952 +6.3% 723 +10.2%
Dec-2015 662 +12.4% 519 +12.1%
Jan-2016 689 -2.5% 656 +19.7%
Feb-2016 901 +42.6% 834 +47.1%
Mar-2016 1,472 +33.1% 1,150 +15.2%
Apr-2016 1,681 +8.7% 1,359 +6.7%
12-Month Avg 1,232 +13.9% 960 +12.8%
Historical Pending Sales by Month
A count of the properties in UAG status between the first and last day in a given month, regardless of current status (based on Off Market Date).
Current as of May 16, 2016. All data from MLS Property Information Network, Inc. Provided by the Greater Boston Association of REALTORS® and the Massachusetts Association of REALTORS®. Report © 2016 ShowingTime. | 11
1,469
1,255
1,547
1,274
1,681
1,359
Single-Family Condominium
April
250
500
750
1,000
1,250
1,500
1,750
2,000
1-2003 1-2004 1-2005 1-2006 1-2007 1-2008 1-2009 1-2010 1-2011 1-2012 1-2013 1-2014 1-2015 1-2016
Single-Family Condominium
4,0503,731
3,992
3,387
4,743
3,999
Single-Family Condominium
Year to Date
2014 2015 2016
+ 6.7%+ 1.5%+ 8.7%+ 5.3% - 9.2%+ 18.8%- 1.4% + 18.1%
2014 2015 2016 2014 2015 2016 2014 2015 2016
- 10.6% - 12.3% - 7.0%- 6.2%

New Listings
New Listings Single-FamilyYear-Over-Year
Change CondominiumYear-Over-Year
Change
May-2015 2,532 +5.0% 1,662 +9.9%
Jun-2015 2,271 +13.2% 1,567 +16.2%
Jul-2015 1,629 +12.9% 1,117 +3.6%
Aug-2015 1,331 +11.8% 936 +18.3%
Sep-2015 1,955 +8.3% 1,439 +12.7%
Oct-2015 1,525 +3.1% 1,155 +3.7%
Nov-2015 875 +17.8% 763 +26.5%
Dec-2015 555 +10.8% 462 +15.8%
Jan-2016 903 +7.5% 807 +13.8%
Feb-2016 1,124 +76.5% 939 +50.5%
Mar-2016 2,179 +45.9% 1,535 +21.4%
Apr-2016 2,131 -13.8% 1,473 -15.0%
12-Month Avg 1,584 +11.7% 1,155 +11.3%
Historical New Listings by Month
Current as of May 16, 2016. All data from MLS Property Information Network, Inc. Provided by the Greater Boston Association of REALTORS® and the Massachusetts Association of REALTORS®. Report © 2016 ShowingTime. | 12
A count of the properties that have been newly listed on the market in a given month.
2,187
1,587
2,472
1,732
2,131
1,473
Single-Family Condominium
April
0
1,000
2,000
3,000
4,000
1-2003 1-2004 1-2005 1-2006 1-2007 1-2008 1-2009 1-2010 1-2011 1-2012 1-2013 1-2014 1-2015 1-2016
Single-Family Condominium
5,795
4,654
5,443
4,329
6,337
4,754
Single-Family Condominium
Year to Date
2014 2015 2016
- 15.0%+ 9.1%- 13.8%+ 13.0% - 7.0%+ 16.4%- 6.1% + 9.8%
2014 2015 2016 2014 2015 2016 2014 2015 2016
- 7.5% - 5.8% - 9.4%- 9.4%

City of Boston - Market Overview
Historical Sparkbars 4-2015 4-2016 PercentChange YTD 2015 YTD 2016 Percent
Change
Key market metrics for the current month and year-to-date figures for the City of Boston.
Closed Sales 338 394 + 16.6%
Key Metrics
1,273 + 15.8%
Median Sales Price $489,500 $531,000 + 8.5% $489,000 $530,000 + 8.4%
1,099
Housing Affordability Index 98 90 - 8.2% 98 90 - 8.2%
----
Months Supply of Inventory 2.1 1.7 - 19.0% --
Inventory of Homes for Sale 887 790 - 10.9% --
62 55
-- --
- 1.4% 1,711
- 11.3%
Pct. of Orig. List Price Received 100.2% 100.1% - 0.1% 98.0% 98.7% + 0.7%
Days on Market Until Sale 55 47 - 14.5%
Current as of May 16, 2016. All data from MLS Property Information Network, Inc. Provided by the Greater Boston Association of REALTORS® and the Massachusetts Association of REALTORS®. Report © 2016 ShowingTime. | 13
+ 10.0%
2,316 + 4.2%
1,882
New Listings 922 719 - 22.0% 2,222
Pending Sales 645 636
Apr 2014 Oct 2014 Apr 2015 Oct 2015 Apr 2016
Apr 2014 Oct 2014 Apr 2015 Oct 2015 Apr 2016
Apr 2014 Oct 2014 Apr 2015 Oct 2015 Apr 2016
Apr 2014 Oct 2014 Apr 2015 Oct 2015 Apr 2016
Apr 2014 Oct 2014 Apr 2015 Oct 2015 Apr 2016
Apr 2014 Oct 2014 Apr 2015 Oct 2015 Apr 2016
Apr 2014 Oct 2014 Apr 2015 Oct 2015 Apr 2016
Apr 2014 Oct 2014 Apr 2015 Oct 2015 Apr 2016
Apr 2014 Oct 2014 Apr 2015 Oct 2015 Apr 2016
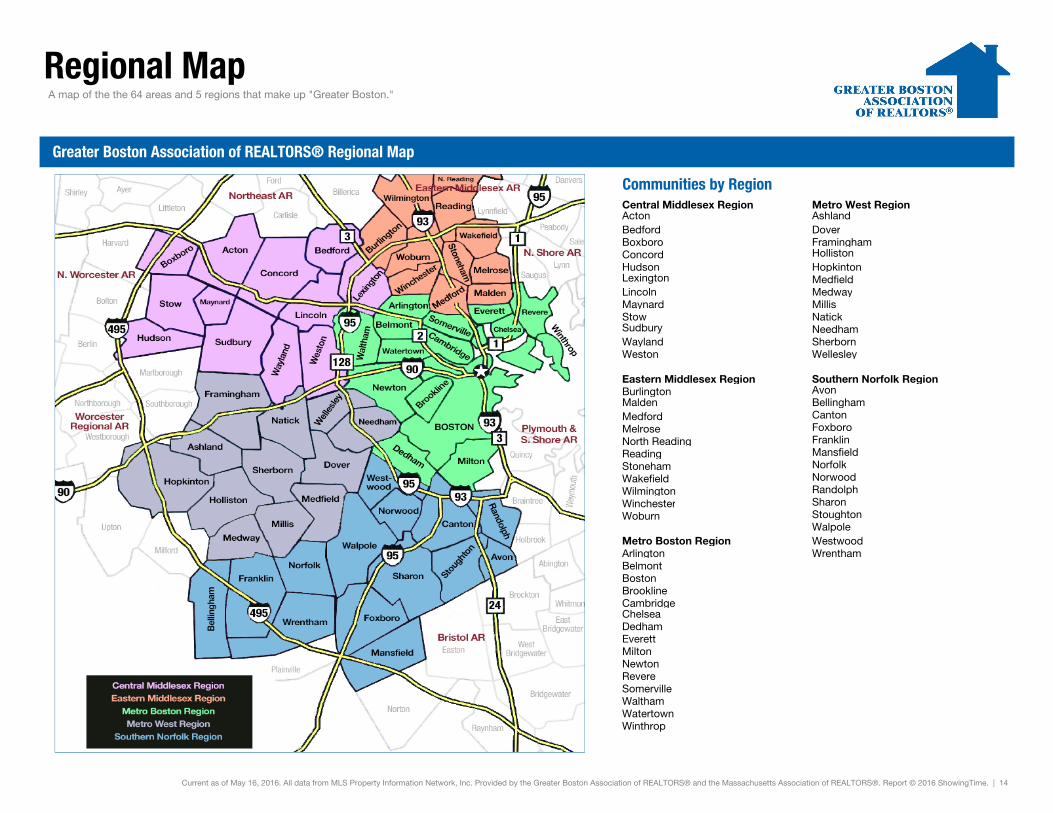
Regional Map
Central Middlesex Region Metro West RegionActon AshlandBedford DoverBoxboro FraminghamConcord HollistonHudson HopkintonLexington MedfieldLincoln MedwayMaynard MillisStow NatickSudbury NeedhamWayland SherbornWeston Wellesley
Eastern Middlesex Region Southern Norfolk RegionBurlington AvonMalden BellinghamMedford CantonMelrose FoxboroNorth Reading FranklinReading MansfieldStoneham NorfolkWakefield NorwoodWilmington RandolphWinchester SharonWoburn Stoughton
WalpoleMetro Boston Region WestwoodArlington WrenthamBelmontBostonBrooklineCambridgeChelseaDedhamEverettMiltonNewtonRevereSomervilleWalthamWatertownWinthrop
A map of the the 64 areas and 5 regions that make up "Greater Boston."
Greater Boston Association of REALTORS® Regional Map
Communities by Region
Current as of May 16, 2016. All data from MLS Property Information Network, Inc. Provided by the Greater Boston Association of REALTORS® and the Massachusetts Association of REALTORS®. Report © 2016 ShowingTime. | 14


![The Greater Boston Housing Report Card 2019 Supply, …...The Greater Boston Housing Report Card 2019 | 13 [DEMOGRAPHICS] Racial diversity is increasing across most of Greater Boston](https://static.fdocuments.us/doc/165x107/5f063b8a7e708231d416f5d6/the-greater-boston-housing-report-card-2019-supply-the-greater-boston-housing.jpg)