Jul 16, 2015 Textiles & Apparel Himatsingka Seide LtdJul...
13
1 Textiles & Apparel Jul 16, 2015 Himatsingka Seide Ltd India Research - Stock Broking BUY Bloomberg Code: HSS IN Recommendation (Rs.) CMP (as on Jul 15, 2015) 119 Target Price 145 Upside (%) 22 Stock Information Mkt Cap (Rs.mn/US$ mn) 11672 / 183 52-wk High/Low (Rs.) 127 / 74 3M Avg. daily volume (mn) 0.3 Beta (x) 1.0 Sensex/Nifty 28198 / 8523 O/S Shares(mn) 98.5 Face Value (Rs.) 5.0 Shareholding Pattern (%) Promoters 57.1 FIIs 0.3 DIIs 14.9 Others 27.8 Stock Performance (%) 1M 3M 6M 12M Absolute 53 39 32 52 Relative to Sensex 44 41 32 36 Source: Bloomberg Relative Performance* Source: Bloomberg; *Index 100 Analyst Contact Prasanth Victor 040 - 3321 6271 [email protected] International business to drive the revenue growth; Margins to Improve Himatsingka Siede (HSS) on the retail and distribution front, carrying some of the most prestigious brands continuing to explore ways to strengthen its brand portfolio in international market. Currently, US subsidiaries are in a sweet spot and are leading the group’s revenue with a contribution of 87% consolidated revenue. In the next two years, we are expecting the US revenue will ramp up from Rs.16909 Mn in FY15 to Rs.20500 Mn in FY17E. Focusing on increasing asset utilization: In FY15, capacity utilization for the Bed Linen, Drapery and Upholstery stood at 86% and 53% respectively. HSS domestic manufacturing arm is likely to improve its capacity utilization. We believe there would be a steady ramp up in capacity utilization in both Drapery and Upholstery division (~60% in FY17E vs 53% in FY15) and Bed linen division (~90% in FY17E Vs ~86% in FY15) leading to huge performance without incremental capex. Restructuring initiatives in North America Division: HSS is looking at organizational restructuring, positioning a larger brand portfolio, providing allied product development and design capabilities. So we expect these initiatives will in the long run give the group a more brand focused and more efficient distribution platform to drive. Valuation and Outlook At CMP of Rs. 119, HSS is currently trading at 8.6x P/E of FY17E earnings, On back of lower raw material prices, favorable product mix, improving cost efficiency and economies of scale; we initiate coverage on HSS with a “BUY” rating with a target price of Rs. 145, based on a 10.5x P/E FY17E, representing an upside potential of 22.3%. Key Risks y Volatility in the raw material prices. y Forex Risk. For private circulation only. For important information about Karvy’s rating system and other disclosures refer to the end of this material. Karvy Stock Broking Research is also available on Bloomberg, KRVY<GO>, Thomson Publishers & Reuters Exhibit 1: Valuation Summary (Rs. Mn) YE Mar (Rs. Mn) FY13 FY14 FY15 FY16E FY17E Net Sales 16894 20282 19406 21352 23548 EBITDA 1668 2048 2215 2542 2897 EBITDA Margin (%) 9.3 9.9 11.1 11.5 11.9 Adj. Net Profit 573 633 954 1076 1364 EPS (Rs.) 5.8 6.4 9.7 10.9 13.9 RoE (%) 9.0 8.5 11.9 12.3 13.4 PE (x) 5.0 8.9 12.2 10.9 8.6 Source: Company, Karvy Research; *Represents multiples for FY13, FY14 & FY15 are based on historic market price 80 115 150 185 220 Jun-14 Jul-14 Aug-14 Sep-14 Oct-14 Nov-14 Dec-14 Jan-15 Feb-15 Mar-15 Apr-15 May-15 Jun-15 Jul-15 HSS Sensex
Transcript of Jul 16, 2015 Textiles & Apparel Himatsingka Seide LtdJul...

1
Jul 16, 2015Himatsingka Seide LtdTextiles & Apparel Jul 16, 2015
Himatsingka Seide LtdIndia Research - Stock Broking BUYBloomberg Code: HSS IN
Recommendation (Rs.)
CMP (as on Jul 15, 2015) 119Target Price 145Upside (%) 22
Stock InformationMkt Cap (Rs.mn/US$ mn) 11672 / 18352-wk High/Low (Rs.) 127 / 743M Avg. daily volume (mn) 0.3Beta (x) 1.0Sensex/Nifty 28198 / 8523O/S Shares(mn) 98.5Face Value (Rs.) 5.0
Shareholding Pattern (%) Promoters 57.1FIIs 0.3DIIs 14.9Others 27.8
Stock Performance (%) 1M 3M 6M 12M
Absolute 53 39 32 52Relative to Sensex 44 41 32 36Source: Bloomberg
Relative Performance*
Source: Bloomberg; *Index 100
Analyst ContactPrasanth Victor040 - 3321 [email protected]
International business to drive the revenue growth; Margins to ImproveHimatsingka Siede (HSS) on the retail and distribution front, carrying some of the most prestigious brands continuing to explore ways to strengthen its brand portfolio in international market. Currently, US subsidiaries are in a sweet spot and are leading the group’s revenue with a contribution of 87% consolidated revenue. In the next two years, we are expecting the US revenue will ramp up from Rs.16909 Mn in FY15 to Rs.20500 Mn in FY17E.
Focusing on increasing asset utilization: In FY15, capacity utilization for the Bed Linen, Drapery and Upholstery stood at 86% and 53% respectively. HSS domestic manufacturing arm is likely to improve its capacity utilization. We believe there would be a steady ramp up in capacity utilization in both Drapery and Upholstery division (~60% in FY17E vs 53% in FY15) and Bed linen division (~90% in FY17E Vs ~86% in FY15) leading to huge performance without incremental capex.
Restructuring initiatives in North America Division: HSS is looking at organizational restructuring, positioning a larger brand portfolio, providing allied product development and design capabilities. So we expect these initiatives will in the long run give the group a more brand focused and more efficient distribution platform to drive.
Valuation and Outlook At CMP of Rs. 119, HSS is currently trading at 8.6x P/E of FY17E earnings, On back of lower raw material prices, favorable product mix, improving cost efficiency and economies of scale; we initiate coverage on HSS with a “BUY” rating with a target price of Rs. 145, based on a 10.5x P/E FY17E, representing an upside potential of 22.3%.
Key Risksyy Volatility in the raw material prices.yy Forex Risk.
For private circulation only. For important information about Karvy’s rating system and other disclosures refer to the end of this material. Karvy Stock Broking Research is also available on Bloomberg, KRVY<GO>, Thomson Publishers & Reuters
Exhibit 1: Valuation Summary (Rs. Mn)
YE Mar (Rs. Mn) FY13 FY14 FY15 FY16E FY17E
Net Sales 16894 20282 19406 21352 23548EBITDA 1668 2048 2215 2542 2897EBITDA Margin (%) 9.3 9.9 11.1 11.5 11.9Adj. Net Profit 573 633 954 1076 1364EPS (Rs.) 5.8 6.4 9.7 10.9 13.9RoE (%) 9.0 8.5 11.9 12.3 13.4PE (x) 5.0 8.9 12.2 10.9 8.6Source: Company, Karvy Research; *Represents multiples for FY13, FY14 & FY15 are based on historic market price
80
115
150
185
220
Jun-
14Ju
l-14
Aug
-14
Sep
-14
Oct
-14
Nov
-14
Dec
-14
Jan-
15
Feb-
15M
ar-1
5
Apr
-15
May
-15
Jun-
15Ju
l-15
HSS Sensex

2
Jul 16, 2015Himatsingka Seide Ltd
Company BackgroundHimatsingka Seide is a vertically integrated home textiles group that manufactures, retails and distributes bedding, bath, drapery, upholstery and lifestyle accessory products. The group is seamlessly integrated from manufacturing in India with an installed capacity of 25 MMPA (Million Meters Per Annum), to retail and distribution networks across North America, Europe and Asia carrying some of the most prestigious brands in the home textile space and cater to private label programs of major retailers across these geographies.
HSS has an extremely strong presence in the North American market operates a strong portfolio of brands that caters to the North American markets. The portfolio of license brands includes Calvin Klein Home, Barbara Barry, Peacock Alley, Bellora, Esprit, Waverly and Atmosphere.
Exhibit 2: Shareholding Pattern (%)
Source: Company, Karvy Research
Exhibit 3: Revenue Segmentation - Geography wise (%)
Source: Company, Karvy Research
Balance sheet (Rs. Mn)
FY15 FY16E FY17E
Total Assets 19305 19667 20363Net Fixed assets 4650 4107 3602Current assets 7487 8294 9316Other assets 7169 7266 7444Total Liabilities 19305 19667 20363Networth 8049 8773 10205Debt 6681 5768 4793Other Liabilities 4448 4938 5238Deferred Tax 128 188 127
Balance Sheet Ratios
RoE (%) 11.9 12.3 13.4RoCE (%) 12.0 13.0 14.8Net Debt/Equity 0.8 0.6 0.5Equity/Total Assets 0.4 0.5 0.5P/BV (x) 1.5 1.3 1.1Source: Company, Karvy Research
Cash Flow (Rs. Mn)
FY15E FY16E FY17E
PBT 915 1117 1426 Depreciation 446 622 685 Interest (net) 851 800 784 Tax 67 42 61 Changes in WC (200) (200) (915)Others 2 3 2 CF from Operations 1948 2300 1920 Capex (668) (200) (215)Investment 21 (2) (3)CF from Investing (648) (202) (218)Change in Equity 0 0 0 Change in Debt (244) (882) (505)Dividends (178) (230) (229)Interest Paid (854) (802) (787)CF from Financing (1277) (1915) (1521)Change in Cash 23 183 181 Source: Company, Karvy Research
Company Financial Snapshot (Y/E Mar)
Profit & Loss (Rs. Mn)
FY15 FY16E FY17E
Net sales 19406 21352 23548 Optg. Exp (Adj for OI) 17261 18887 20736 EBITDA 2215 2542 2897 Depreciation 446 622 685 Interest 854 802 787 Other Income 70 78 86 PBT 915 1117 1426 Tax (31) 42 61 Adj. PAT 954 1076 1364 Profit & Loss Ratios
EBITDA margin (%) 11.1 11.5 11.9Net margin (%) 4.9 5.0 5.8P/E (x) 12.2 10.9 8.6EV/EBITDA (x) 9.2 7.7 6.5Dividend yield (%) 1.7 2.1 2.5Source: Company, Karvy Research
Promoter57.1%
FIIs0.3%
DIIs14.9%
Others27.8%
North America
87%
Europe8%
India2%
Others3%
3
Jul 16, 2015Himatsingka Seide Ltd
Strong Brand Portfolio & Robust Retail Distribution NetworkOn the retail and distribution front, HSS has a rich portfolio of brands that address various tiers of the market and a strong presence in the private label market. Himatsingka continues to explore ways to strengthen its brand portfolio further and drive global presence by enhancing points of sale serviced via its branded and private label products. Its branded portfolio consists of 13 brands, including Calvin Klein Home (second largest selling brand in the United States), Barbara Barry, Peacock Alley, Bellora, Esprit, Waverly and Atmosphere. The group also has a strong presence in India and Europe through its Atmosphere and Bellora brands respectively. While in North America, the group is focused on servicing major retailers, in Europe and India/Asia, the group operates exclusive stores for its brands and also reaches the end consumer through high end Multi Brand Outlets and Department stores. Globally, the group has substantial reach in the home textile market and its products are present in over 7000 points of sale.
Robust manufacturing capacityHSS operates two manufacturing facilities in India with epitomize cutting edge technology, best-in-class manufacturing processes and embrace the highest standards of quality control. Its vertically integrated manufacturing facility is equipped with the latest warping, sizing, weaving, continuous processing, yarn dyeing and sewing facilities. The bed-linen manufacturing plant has 23 mn metres per annum processing capacity and Drapery and upholstery manufacturing plant has 2.2 mn metres per annum processing capacity. In FY15, capacity utilization for the Bed Linen and Drapery and Upholstery stood at 86% and 53% respectively; and at this point, management exploring the various options on expanding this manufacturing capacity, with the demand picking up from US and UK (95% of HSS consolidated revenue). We expect HSS is likely to improve its capacity utilization and continue to keep sweating the manufacturing facilities till it achieves optimum capacity utilization.
Exhibit 5: Bed Linen- Revenues & Capacity Utilization
Source: Company, Karvy Research
Exhibit 6: Drapery & Upholstery - Revenues & Capacity Utilization
Source: Company, Karvy Research
1200
1286 13
06
138654 53
0
61
0
20
40
60
80
1100
1200
1300
1400
FY14 FY15 FY16E FY17ERevenue (Rs Mn) Capacity utilization (%) (RHS)
8381
7915
8818
9779
8986
88
91
82
84
86
88
90
92
0
2000
4000
6000
8000
10000
12000
FY14 FY15 FY16E FY17ERevenue (Rs Mn) Capacity Utilization (%)
Exhibit 4: Brands
Source: Company, Karvy Research
4
Jul 16, 2015Himatsingka Seide Ltd
Exhibit 7:
Source: Company, Karvy Research
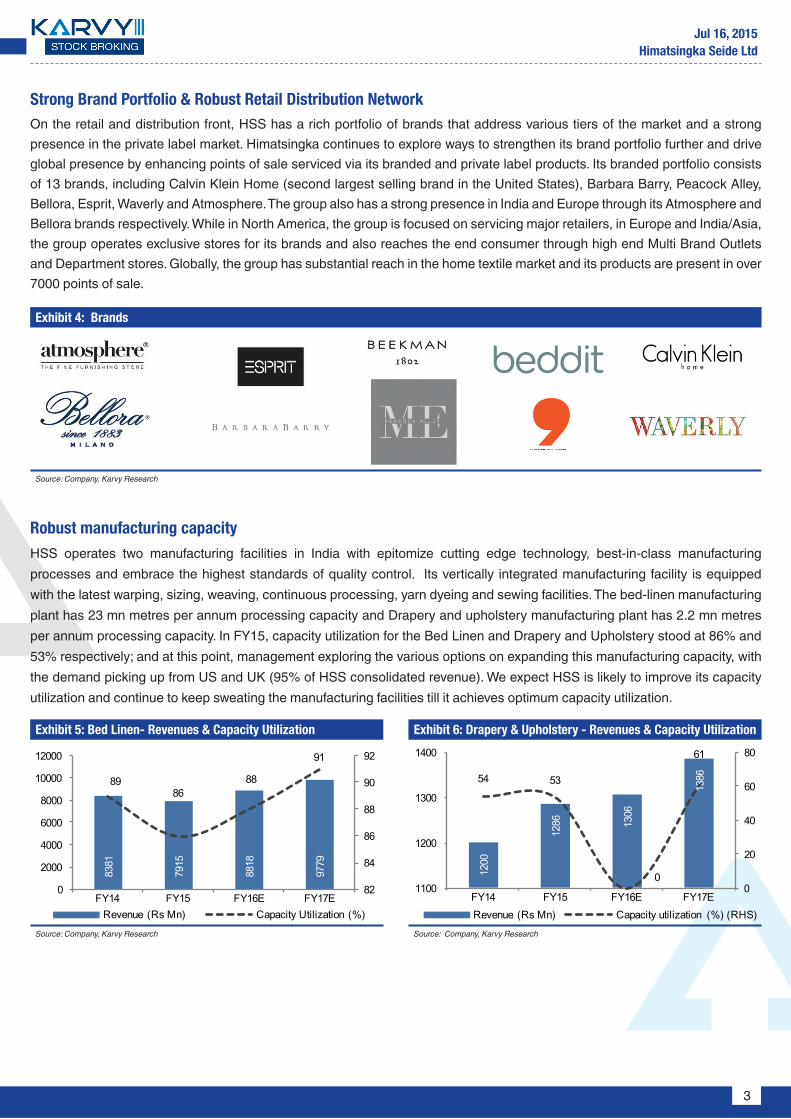
HSS derives 87% of revenue from North America market with strong distribution network. In FY15, HSS consolidated revenues reduced by 4.3% as management focused on various initiatives, which encompass organizational restructuring, positioning a larger brand portfolio, providing allied product development and design capabilities. The group has focused on integrating the supply chain and warehousing capabilities into one zone from two zones.
HSS is also looking at reorienting the brand positioning and price points vis-à-vis existing market conditions. So the group expecting these initiatives on the Retail and Distribution front will impact operating performance of North America through FY16E and we believe it will give the group more brand-focused and more efficient distribution platform to drive revenue growth in North America.
Organizational Restructuring in North America business95
33
1170
2
1429
8
1745
0
1690
9
1782 1627 1461 1612 1375219 370 408 573 440538 362 368 353 315
0%
20%
40%
60%
80%
100%
FY11 FY12 FY13 FY14 FY15
North America Europe Others India
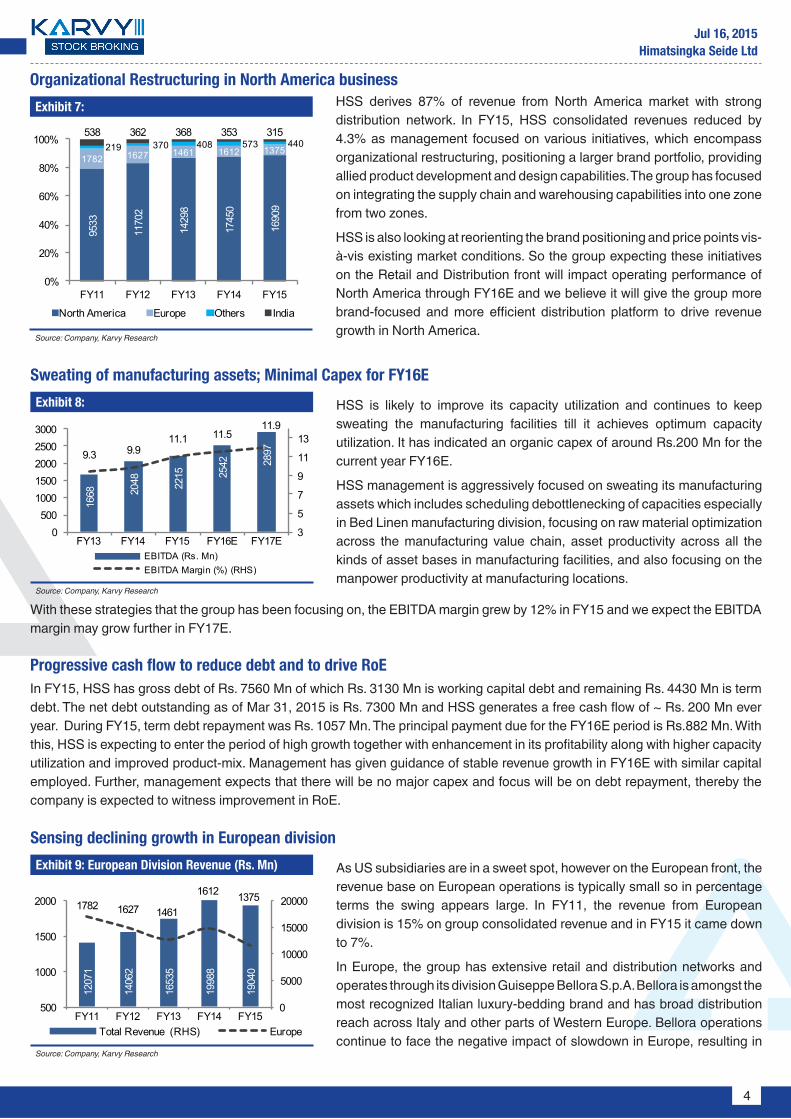
Exhibit 8:
Source: Company, Karvy Research
HSS is likely to improve its capacity utilization and continues to keep sweating the manufacturing facilities till it achieves optimum capacity utilization. It has indicated an organic capex of around Rs.200 Mn for the current year FY16E.
HSS management is aggressively focused on sweating its manufacturing assets which includes scheduling debottlenecking of capacities especially in Bed Linen manufacturing division, focusing on raw material optimization across the manufacturing value chain, asset productivity across all the kinds of asset bases in manufacturing facilities, and also focusing on the manpower productivity at manufacturing locations.
Sweating of manufacturing assets; Minimal Capex for FY16E
With these strategies that the group has been focusing on, the EBITDA margin grew by 12% in FY15 and we expect the EBITDA margin may grow further in FY17E.
Progressive cash flow to reduce debt and to drive RoEIn FY15, HSS has gross debt of Rs. 7560 Mn of which Rs. 3130 Mn is working capital debt and remaining Rs. 4430 Mn is term debt. The net debt outstanding as of Mar 31, 2015 is Rs. 7300 Mn and HSS generates a free cash flow of ~ Rs. 200 Mn ever year. During FY15, term debt repayment was Rs. 1057 Mn. The principal payment due for the FY16E period is Rs.882 Mn. With this, HSS is expecting to enter the period of high growth together with enhancement in its profitability along with higher capacity utilization and improved product-mix. Management has given guidance of stable revenue growth in FY16E with similar capital employed. Further, management expects that there will be no major capex and focus will be on debt repayment, thereby the company is expected to witness improvement in RoE.
1668 20
48 2215 25
42 28979.3 9.9
11.1 11.511.9
3
5
7
9
11
13
0500
10001500200025003000
FY13 FY14 FY15 FY16E FY17EEBITDA (Rs. Mn)EBITDA Margin (%) (RHS)
Exhibit 9: European Division Revenue (Rs. Mn)
Source: Company, Karvy Research
As US subsidiaries are in a sweet spot, however on the European front, the revenue base on European operations is typically small so in percentage terms the swing appears large. In FY11, the revenue from European division is 15% on group consolidated revenue and in FY15 it came down to 7%.
In Europe, the group has extensive retail and distribution networks and operates through its division Guiseppe Bellora S.p.A. Bellora is amongst the most recognized Italian luxury-bedding brand and has broad distribution reach across Italy and other parts of Western Europe. Bellora operations continue to face the negative impact of slowdown in Europe, resulting in
Sensing declining growth in European division
1207
1
1406
2
1653
5
1998
8
1904
0
1782 1627 1461
1612 1375
0
5000
10000
15000
20000
500
1000
1500
2000
FY11 FY12 FY13 FY14 FY15Total Revenue (RHS) Europe

5
Jul 16, 2015Himatsingka Seide Ltd
losses for the past couple of years. HSS management has taken strong initiatives and focused on stemming losses and turning profitable for this division, closing the unprofitable stores, maximizing team strength, leveraging the brand by looking royalty streams, as a result we expect Bellora revenue will increase in next two years.
Exhibit 10: Raw Material and Revenue (Rs. Mn)
Source: Company, Karvy Research
Raw material costs account for approximately 65% of the group’s sales. So the slight correction in prices largely affects the EBITDA margin. Stable raw material prices of both silk and cotton along with stable currency movements lead to the expansion of operating profit margins. EBITDA has grown at a CAGR of 24% between FY11-FY15. We expect that currently raw material price to remain stable and it could rally with a volatility of 3% to 5% in FY16E & FY17E. So we are expecting the EBITDA margin will increase to 12% in FY17E.
Stable raw material cost influence impressive Operating Profit Margins
9075
1100
7
1319
2
1251
2
1360
5
1485
8
1428
7
1689
4 2028
2
1940
6
2135
2
2354
8
0
6000
12000
18000
24000
FY12 FY13 FY14 FY15 FY16 FY17Raw Material Revenue
Exhibit 11: Sensitivity of Earnings and Target Prices for % Cost of Raw Material Price Movement
Base
YoY Cost of Raw Materials as % of Revenue
5% 3% 1% (1%) (3%) (5%)
EBITDA Margin (%)
FY16E 11.5 8.4 9.6 10.9 12.2 13.5 14.7
FY17E 11.9 8.8 10.1 11.3 12.6 13.8 15.1
EPS (Rs.)
FY16E 10.9 4.3 6.9 9.6 12.3 14.9 17.6
FY17E 13.9 6.6 9.5 12.4 15.3 18.2 21.0
Target Price (in Rs.) 145 68.5 99.4 129.8 160.1 190.5 219.6
Change in Target Price (%) (52.7) (31.4) (10.5) 10.4 31.3 51.5Source: Company, Karvy Research
6
Jul 16, 2015Himatsingka Seide Ltd
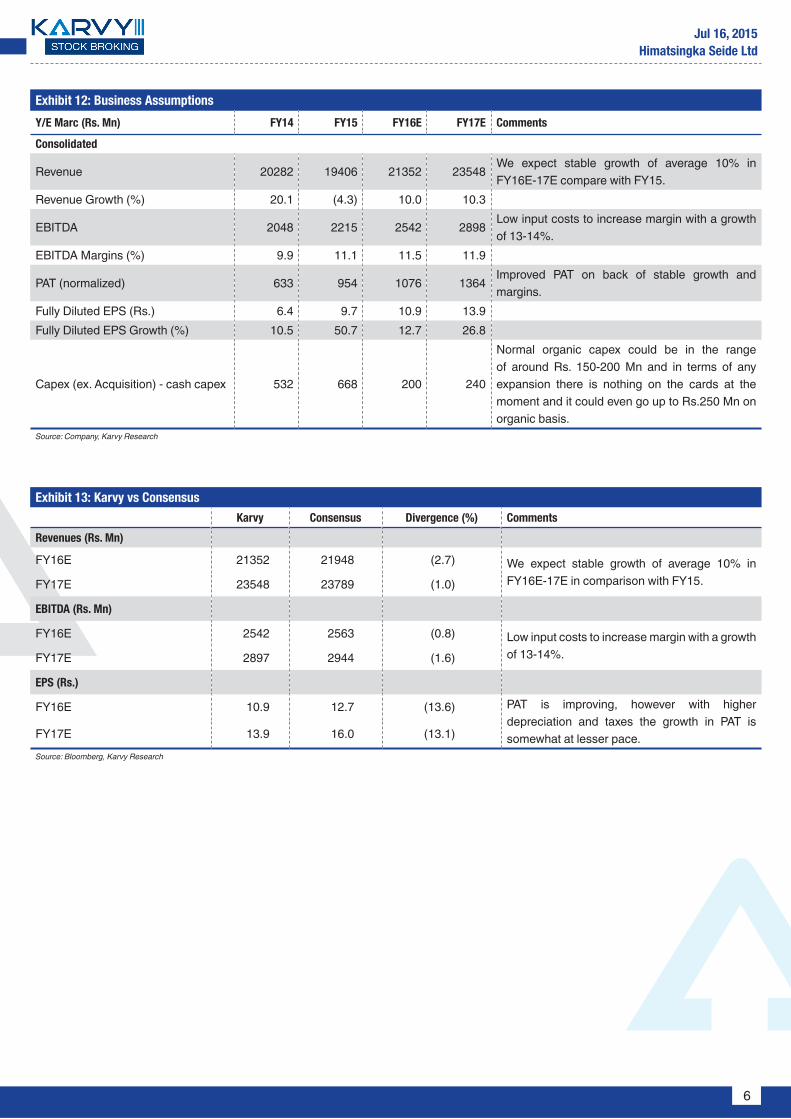
Exhibit 12: Business Assumptions
Y/E Marc (Rs. Mn) FY14 FY15 FY16E FY17E Comments
Consolidated
Revenue 20282 19406 21352 23548We expect stable growth of average 10% in FY16E-17E compare with FY15.
Revenue Growth (%) 20.1 (4.3) 10.0 10.3
EBITDA 2048 2215 2542 2898Low input costs to increase margin with a growth of 13-14%.
EBITDA Margins (%) 9.9 11.1 11.5 11.9
PAT (normalized) 633 954 1076 1364Improved PAT on back of stable growth and margins.
Fully Diluted EPS (Rs.) 6.4 9.7 10.9 13.9Fully Diluted EPS Growth (%) 10.5 50.7 12.7 26.8
Capex (ex. Acquisition) - cash capex 532 668 200 240
Normal organic capex could be in the range of around Rs. 150-200 Mn and in terms of any expansion there is nothing on the cards at the moment and it could even go up to Rs.250 Mn on organic basis.
Source: Company, Karvy Research
Exhibit 13: Karvy vs Consensus
Karvy Consensus Divergence (%) Comments
Revenues (Rs. Mn)
FY16E 21352 21948 (2.7) We expect stable growth of average 10% in FY16E-17E in comparison with FY15.FY17E 23548 23789 (1.0)
EBITDA (Rs. Mn)
FY16E 2542 2563 (0.8) Low input costs to increase margin with a growth of 13-14%.FY17E 2897 2944 (1.6)
EPS (Rs.)
FY16E 10.9 12.7 (13.6) PAT is improving, however with higher depreciation and taxes the growth in PAT is somewhat at lesser pace.FY17E 13.9 16.0 (13.1)
Source: Bloomberg, Karvy Research

7
Jul 16, 2015Himatsingka Seide Ltd
Exhibit 14: Revenue (Rs. Mn) & Revenue Growth (%)
Source: Company, Karvy Research
Exhibit 16: Net Debt / Equity Ratio
Source: Company, Karvy Research
Exhibit 15: PAT & PAT Margin
Source: Company, Karvy Research
Exhibit 17: Asset Turnover (x)
Source: Company, Karvy Research
Revenue has grown at a CAGR of 12.5% between FY10-FY15. As it has been observed that in FY15, HSS faced little softness in the consolidated revenue figures with a reduction of 4.2% compare with FY14 due to restructuring initiatives in North America division. Going forward, we anticipate a more stable situation and we believe HSS to grow at a CAGR of 10.5% between FY15-FY17E.
Net debt to equity ratio has decreased to 0.8x in FY15 as management is focusing on debt repayment, and the principal payment due for the FY16E period is Rs.882 Mn thereby the company is expected to witness further reduction in debt and the Net debt to equity ratio could be at 0.4x in FY17E.
The consolidated profit after tax of the year is at Rs. 954 Mn compared to Rs. 633 Mn in the previous year a growth of 50.7% by reducing the operating expenses through debottlenecking exercises in manufacturing facility. During this same period PAT margin moved from 3.1% to 4.9% in FY14 vs. FY15. We expect PAT to reach Rs. 1364 Mn by FY17E with a PAT margin of 5.8%.
HSS has improved its asset utilization, where the business is operating in full capacities, with expanding brand portfolio and retail space. HSS asset turnover is likely to grow further to 5 to 6x in FY17E from 4.4x in FY15.
331 57
3
633 95
4
1,07
6
1,36
4
2.33.4 3.1
4.9 5.0
5.8
0.0
2.0
4.0
6.0
8.0
0
500
1000
1500
FY12 FY13 FY14 FY15 FY16E FY17E
PAT PAT Margin (%)
1.10.9 0.9
0.8
0.6
0.4
0.2
0.4
0.6
0.8
1.0
1.2
FY12 FY13 FY14 FY15 FY16E FY17ENet Debt/ Equity Ratio
2.83.6
4.6 4.45.1
6.3
0
2
4
6
8
FY12 FY13 FY14 FY15 FY16E FY17EAsset turnover ratio
1428
7
1689
4
2028
2
1940
6
2135
2
2354
815.9 18
.2 20.1
-4.3 10
.0
10.3
-10
0
10
20
30
0
5000
10000
15000
20000
25000
FY12 FY13 FY14 FY15 FY16E FY17EReveue Revenue growth

8
Jul 16, 2015Himatsingka Seide Ltd
Exhibit 19: Company Snapshot (Ratings)
Low High
1 2 3 4 5
Quality of Earnings 3 Domestic Sales 3 Exports 3 Net Debt/Equity 3 Working Capital requirement 3 Quality of Management 3 Depth of Management 3 Promoter 3 Corporate Governance 3 Source: Company, Karvy Research
Exhibit 18: RoE & RoCE (%)
Source: Company, Karvy Research
The company’s RoCE and RoE have improved due to increased EBIT margins moving forward, RoCE & RoE will improve to 14.8% & 13.4% by FY17E as management expecting to focus on debt repayment, thereby the company is expected to witness improvement in RoE & RoCE.
5.82
9.0 8.5
11.9 12.3 13.47.89.4
11.1 12.0 13.014.8
0
5
10
15
20
FY12 FY13 FY14 FY15 FY16E FY17ERoE RoCE
9
Jul 16, 2015Himatsingka Seide Ltd
Valuation & OutlookHimatsingka Seide continues to grow in revenues and profitability across its Manufacturing, Retail and Distribution businesses. The company also plans to tap into the global markets and enhance its current market share by tapping into new segments. HSS, with its focus on cost optimization measures will eventually improve its margins on account of new product pipeline & improving operating performance, which in turn would stabilize the growth in the long term.
We believe HSS is entering a phase of high growth trajectory along with improvement in its profitability. We expect revenues and PAT to grow at 10% & 19% CAGR during FY15E-17E on back of higher RoE and RoCE of 13% & 15% by FY17E. The management plans to focus major on debt repayment over the next two years. Capacity expansion during the period would be minimal, most of which would be maintenance capex.
The Bed Linen and Drapery and Upholstery capacity utilization stood at 86% and 53% is set to increase to ~90% and 60% by FY17E with its robust distribution network, we believe the company to deliver a Asset/ Turnover ratio of ~6x by FY17E from ~4.4x in FY15. We believe with strong fundamentals and improved growth outlook, HSS has a strong edge compared to its peers in the home textiles industry.
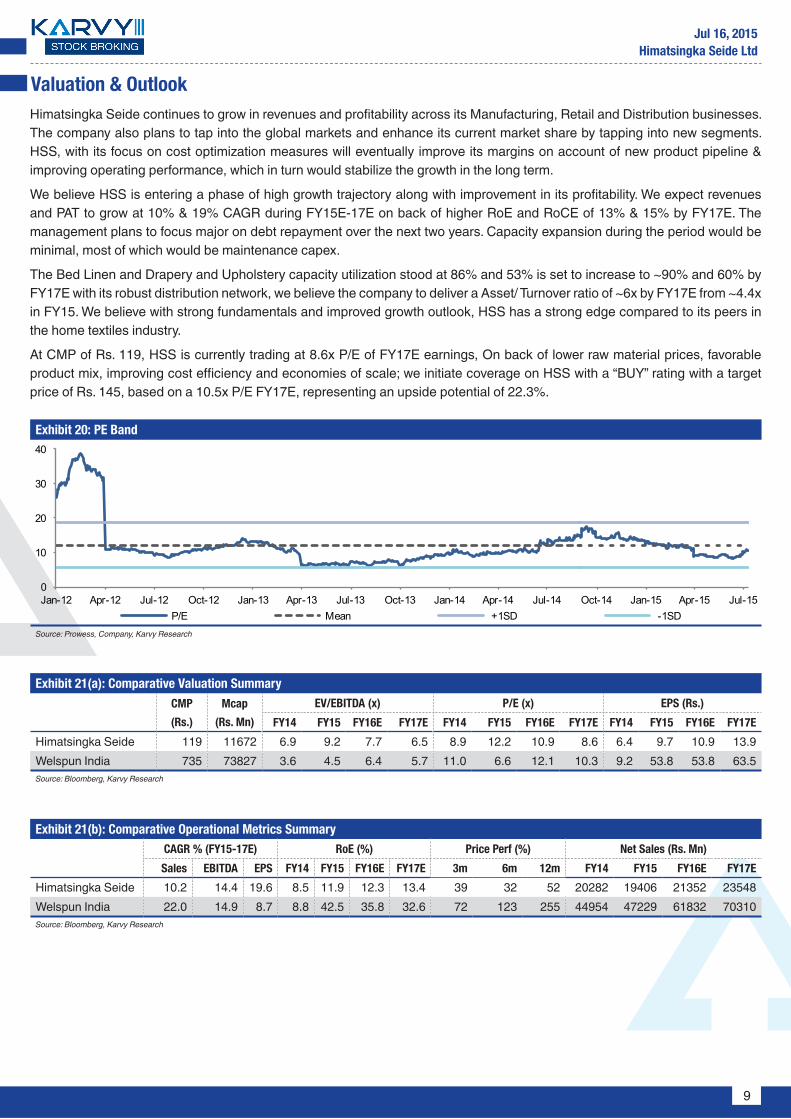
At CMP of Rs. 119, HSS is currently trading at 8.6x P/E of FY17E earnings, On back of lower raw material prices, favorable product mix, improving cost efficiency and economies of scale; we initiate coverage on HSS with a “BUY” rating with a target price of Rs. 145, based on a 10.5x P/E FY17E, representing an upside potential of 22.3%.
Exhibit 20: PE Band
Source: Prowess, Company, Karvy Research
Exhibit 21(a): Comparative Valuation SummaryCMP
(Rs.)
Mcap
(Rs. Mn)
EV/EBITDA (x) P/E (x) EPS (Rs.)
FY14 FY15 FY16E FY17E FY14 FY15 FY16E FY17E FY14 FY15 FY16E FY17E
Himatsingka Seide 119 11672 6.9 9.2 7.7 6.5 8.9 12.2 10.9 8.6 6.4 9.7 10.9 13.9Welspun India 735 73827 3.6 4.5 6.4 5.7 11.0 6.6 12.1 10.3 9.2 53.8 53.8 63.5Source: Bloomberg, Karvy Research
Exhibit 21(b): Comparative Operational Metrics SummaryCAGR % (FY15-17E) RoE (%) Price Perf (%) Net Sales (Rs. Mn)
Sales EBITDA EPS FY14 FY15 FY16E FY17E 3m 6m 12m FY14 FY15 FY16E FY17E
Himatsingka Seide 10.2 14.4 19.6 8.5 11.9 12.3 13.4 39 32 52 20282 19406 21352 23548Welspun India 22.0 14.9 8.7 8.8 42.5 35.8 32.6 72 123 255 44954 47229 61832 70310Source: Bloomberg, Karvy Research
0
10
20
30
40
Jan-12 Apr-12 Jul-12 Oct-12 Jan-13 Apr-13 Jul-13 Oct-13 Jan-14 Apr-14 Jul-14 Oct-14 Jan-15 Apr-15 Jul-15P/E Mean +1SD -1SD

10
Jul 16, 2015Himatsingka Seide Ltd
Key Risksyy Volatility in the raw material prices.yy Forex Risk.
Peer Comparison
Exhibit 22: Revenue (Rs. Mn)
Source: Company, Karvy Research
Exhibit 24: RoE (%)
Source: Company, Karvy Research
Exhibit 23: EPS (Rs.)
Source: Company, Karvy Research
Exhibit 25: Net Profit (Rs. Mn)
Source: Company, Karvy Research
20282 19406 21352 23548
0
20000
40000
60000
80000
FY14 FY15 FY16E FY17EHimatsingka Seide Welspun India
8.511.9 12.3 13.4
0.0
10.0
20.0
30.0
40.0
50.0
FY14 FY15 FY16E FY17EHimatsingka Seide Welspun India
6.4 9.7 10.9 13.9
0.0
20.0
40.0
60.0
80.0
FY14 FY15 FY16E FY17EHimatsingka Seide Welspun India
633954 1076 1364
0
2000
4000
6000
8000
FY14 FY15 FY16E FY17EHimatsingka Seide Welspun India
11
Jul 16, 2015Himatsingka Seide Ltd
Financials
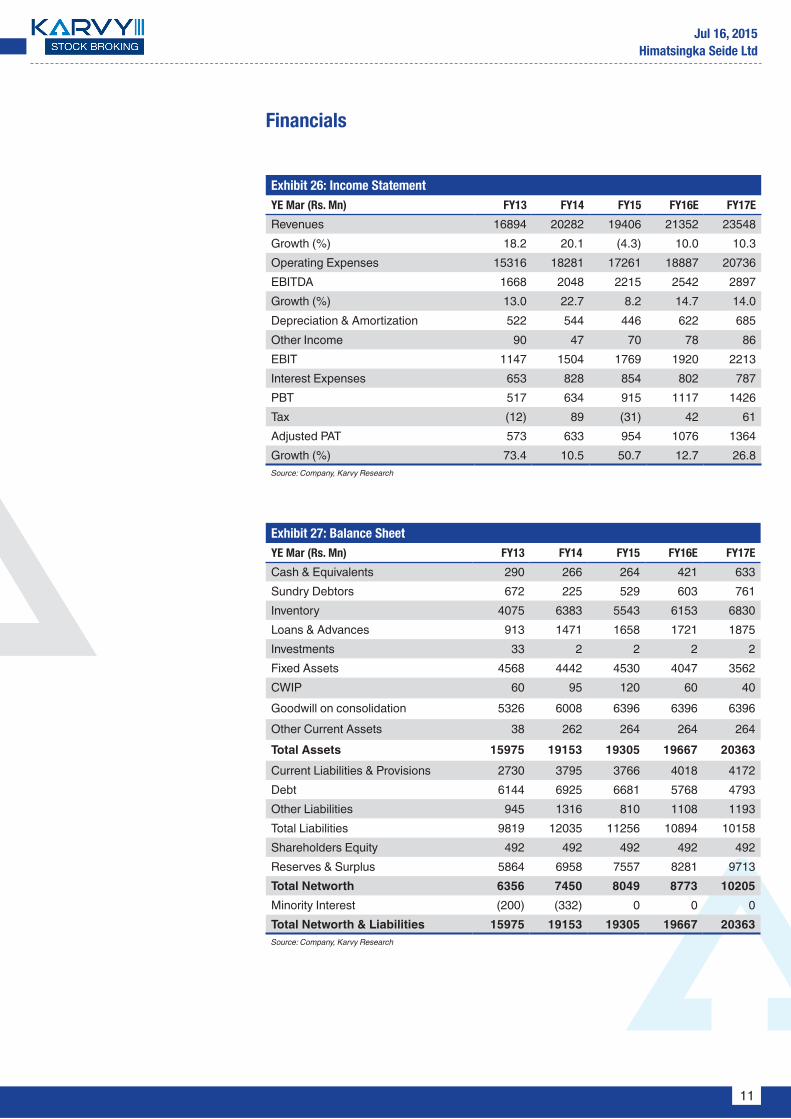
Exhibit 26: Income StatementYE Mar (Rs. Mn) FY13 FY14 FY15 FY16E FY17E
Revenues 16894 20282 19406 21352 23548 Growth (%) 18.2 20.1 (4.3) 10.0 10.3 Operating Expenses 15316 18281 17261 18887 20736 EBITDA 1668 2048 2215 2542 2897 Growth (%) 13.0 22.7 8.2 14.7 14.0 Depreciation & Amortization 522 544 446 622 685 Other Income 90 47 70 78 86 EBIT 1147 1504 1769 1920 2213 Interest Expenses 653 828 854 802 787 PBT 517 634 915 1117 1426 Tax (12) 89 (31) 42 61 Adjusted PAT 573 633 954 1076 1364 Growth (%) 73.4 10.5 50.7 12.7 26.8 Source: Company, Karvy Research
Exhibit 27: Balance SheetYE Mar (Rs. Mn) FY13 FY14 FY15 FY16E FY17E
Cash & Equivalents 290 266 264 421 633Sundry Debtors 672 225 529 603 761Inventory 4075 6383 5543 6153 6830Loans & Advances 913 1471 1658 1721 1875Investments 33 2 2 2 2Fixed Assets 4568 4442 4530 4047 3562CWIP 60 95 120 60 40Goodwill on consolidation 5326 6008 6396 6396 6396Other Current Assets 38 262 264 264 264Total Assets 15975 19153 19305 19667 20363Current Liabilities & Provisions 2730 3795 3766 4018 4172Debt 6144 6925 6681 5768 4793Other Liabilities 945 1316 810 1108 1193Total Liabilities 9819 12035 11256 10894 10158Shareholders Equity 492 492 492 492 492Reserves & Surplus 5864 6958 7557 8281 9713Total Networth 6356 7450 8049 8773 10205Minority Interest (200) (332) 0 0 0 Total Networth & Liabilities 15975 19153 19305 19667 20363Source: Company, Karvy Research
12
Jul 16, 2015Himatsingka Seide Ltd
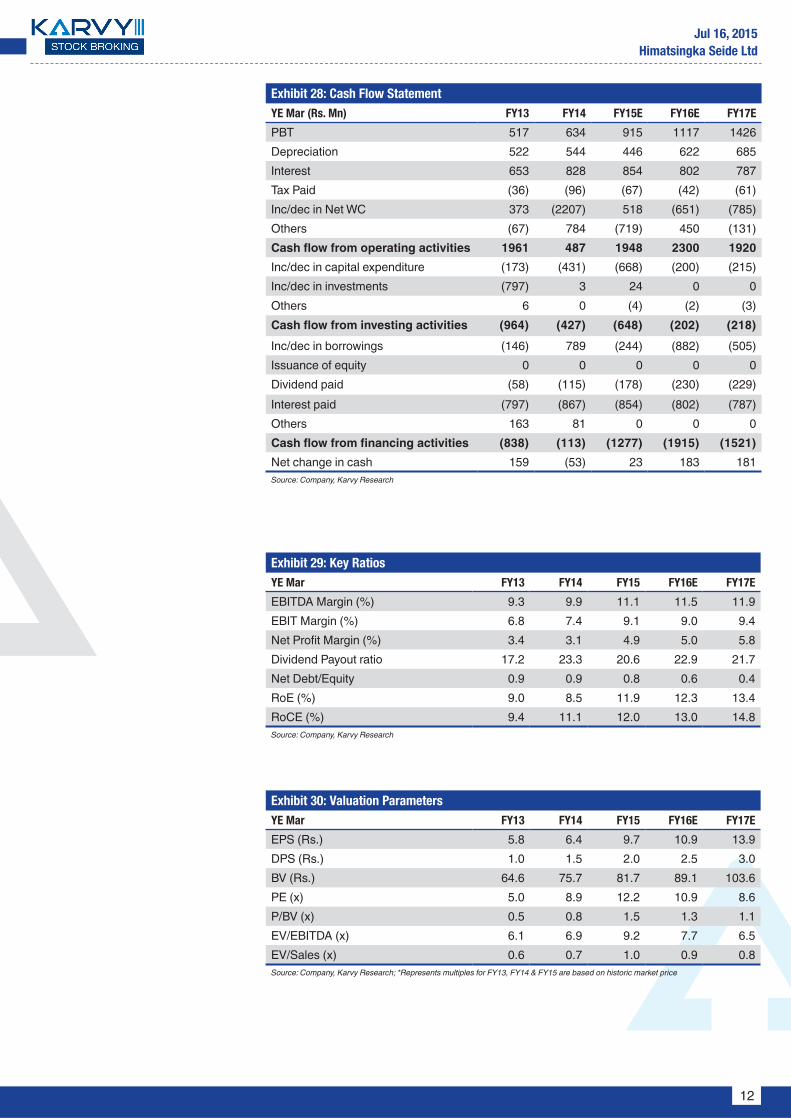
Exhibit 28: Cash Flow StatementYE Mar (Rs. Mn) FY13 FY14 FY15E FY16E FY17E
PBT 517 634 915 1117 1426 Depreciation 522 544 446 622 685 Interest 653 828 854 802 787 Tax Paid (36) (96) (67) (42) (61)Inc/dec in Net WC 373 (2207) 518 (651) (785)Others (67) 784 (719) 450 (131)Cash flow from operating activities 1961 487 1948 2300 1920 Inc/dec in capital expenditure (173) (431) (668) (200) (215)Inc/dec in investments (797) 3 24 0 0 Others 6 0 (4) (2) (3)Cash flow from investing activities (964) (427) (648) (202) (218)Inc/dec in borrowings (146) 789 (244) (882) (505)Issuance of equity 0 0 0 0 0 Dividend paid (58) (115) (178) (230) (229)Interest paid (797) (867) (854) (802) (787)Others 163 81 0 0 0 Cash flow from financing activities (838) (113) (1277) (1915) (1521)Net change in cash 159 (53) 23 183 181 Source: Company, Karvy Research
Exhibit 29: Key RatiosYE Mar FY13 FY14 FY15 FY16E FY17E
EBITDA Margin (%) 9.3 9.9 11.1 11.5 11.9EBIT Margin (%) 6.8 7.4 9.1 9.0 9.4Net Profit Margin (%) 3.4 3.1 4.9 5.0 5.8Dividend Payout ratio 17.2 23.3 20.6 22.9 21.7Net Debt/Equity 0.9 0.9 0.8 0.6 0.4RoE (%) 9.0 8.5 11.9 12.3 13.4RoCE (%) 9.4 11.1 12.0 13.0 14.8Source: Company, Karvy Research
Exhibit 30: Valuation ParametersYE Mar FY13 FY14 FY15 FY16E FY17E
EPS (Rs.) 5.8 6.4 9.7 10.9 13.9DPS (Rs.) 1.0 1.5 2.0 2.5 3.0BV (Rs.) 64.6 75.7 81.7 89.1 103.6PE (x) 5.0 8.9 12.2 10.9 8.6P/BV (x) 0.5 0.8 1.5 1.3 1.1EV/EBITDA (x) 6.1 6.9 9.2 7.7 6.5EV/Sales (x) 0.6 0.7 1.0 0.9 0.8Source: Company, Karvy Research; *Represents multiples for FY13, FY14 & FY15 are based on historic market price

13
Jul 16, 2015Himatsingka Seide Ltd
Stock Ratings Absolute ReturnsBuy : > 15%Hold : 5-15%Sell : <5%
Connect & Discuss More at
1800 425 8283 (Toll Free) [email protected] Live Chat f in YouTube
DisclaimerAnalyst certification: The following analyst(s), Prasanth Victor, who is (are) primarily responsible for this report and whose name(s) is/are mentioned therein, certify (ies) that the views expressed herein accurately reflect his (their) personal view(s) about the subject security (ies) and issuer(s) and that no part of his (their) compensation was, is or will be directly or indirectly related to the specific recommendation(s) or views contained in this research report.Disclaimer: Karvy Stock Broking Limited [KSBL] is a SEBI registered Stock Broker, Depository Participant, Portfolio Manager and also distributes financial products. The subsidiaries and group companies including associates of KSBL provide services as Registrars and Share Transfer Agents, Commodity Broker, Currency and forex broker, merchant banker and underwriter, Investment Advisory services, insurance repository services, financial consultancy and advisory services, realty services, data management, data analytics, market research, solar power, film distribution and production, profiling and related services. Therefore associates of KSBL are likely to have business relations with most of the companies whose securities are traded on the exchange platform. The information and views presented in this report are prepared by Karvy Stock Broking Limited and are subject to change without any notice. This report is based on information obtained from public sources , the respective corporate under coverage and sources believed to be reliable, but no independent verification has been made nor is its accuracy or completeness guaranteed. The report and information contained herein is strictly confidential and meant solely for the selected recipient and may not be altered in any way, transmitted to, copied or distributed, in part or in whole, to any other person or to the media or reproduced in any form, without prior written consent of KSBL. While we would endeavor to update the information herein on a reasonable basis, KSBL is under no obligation to update or keep the information current. Also, there may be regulatory, compliance or other reasons that may prevent KSBL from doing so. The value and return on investment may vary because of changes in interest rates, foreign exchange rates or any other reason. This report and information herein is solely for informational purpose and shall not be used or considered as an offer document or solicitation of offer to buy or sell or subscribe for securities or other financial instruments. Though disseminated to all the customers simultaneously, not all customers may receive this report at the same time. KSBL will not treat recipients as customers by virtue of their receiving this report. Nothing in this report constitutes investment, legal, accounting and tax advice or a representation that any investment or strategy is suitable or appropriate to your specific circumstances. This material is for personal information and we are not responsible for any loss incurred based upon it. The investments discussed or recommended in this report may not be suitable for all investors. Investors must make their own investment decisions based on their specific investment objectives and financial position and using such independent advice, as they believe necessary. While acting upon any information or analysis mentioned in this report, investors may please note that neither KSBL nor any associate companies of KSBL accepts any liability arising from the use of information and views mentioned in this report. Investors are advised to see Risk Disclosure Document to understand the risks associated before investing in the securities markets. Past performance is not necessarily a guide to future performance. Forward-looking statements are not predictions and may be subject to change without notice. Actual results may differ materially from those set forth in projections.
y Associates of KSBL might have managed or co-managed public offering of securities for the subject company or might have been mandated by the subject company for any other assignment in the past twelve months.
y Associates of KSBL might have received compensation from the subject company mentioned in the report during the period preceding twelve months from the date of this report for investment banking or merchant banking or brokerage services from the subject company in the past twelve months or for services rendered as Registrar and Share Transfer Agent, Commodity Broker, Currency and forex broker, merchant banker and underwriter, Investment Advisory services, insurance repository services, consultancy and advisory services, realty services, data processing, profiling and related services or in any other capacity.
y KSBL encourages independence in research report preparation and strives to minimize conflict in preparation of research report. y Compensation of KSBL’s Research Analyst(s) is not based on any specific merchant banking, investment banking or brokerage service transactions. y KSBL generally prohibits its analysts, persons reporting to analysts and their relatives from maintaining a financial interest in the securities or derivatives of
any companies that the analysts cover. y KSBL or its associates collectively or Research Analysts do not own 1% or more of the equity securities of the Company mentioned in the report as of the
last day of the month preceding the publication of the research report. y KSBL or its analysts did not receive any compensation or other benefits from the companies mentioned in the report or third party in connection with
preparation of the research report and have no financial interest in the subject company mentioned in this report. y Accordingly, neither KSBL nor Research Analysts have any material conflict of interest at the time of publication of this report. y It is confirmed that KSBL and Research Analysts, primarily responsible for this report and whose name(s) is/ are mentioned therein of this report have not
received any compensation from the subject company mentioned in the report in the preceding twelve months. y It is confirmed that Prasanth Victor, Research Analyst did not serve as an officer, director or employee of the companies mentioned in the report. y KSBL may have issued other reports that are inconsistent with and reach different conclusion from the information presented in this report. y Neither the Research Analysts nor KSBL have been engaged in market making activity for the companies mentioned in the report. y We submit that no material disciplinary action has been taken on KSBL by any Regulatory Authority impacting Equity Research Analyst activities.
Karvy Stock Broking LimitedPlot No.31, 6th Floor, Karvy Millennium Towers, Financial District, Nanakramguda, Hyderabad, 500 032, India
Tel: 91-40-2331 2454; Fax: 91-40-2331 1968For More updates & Stock Research, visit www.karvyonline.com