JSC FINCA Bank Georgia Pillar 3 Annual Report 2017 · 7.2 Remuneration Tables..... 40 8. Appendix,...
61
JSC FINCA Bank Georgia Pillar 3 Annual Report 2017
Transcript of JSC FINCA Bank Georgia Pillar 3 Annual Report 2017 · 7.2 Remuneration Tables..... 40 8. Appendix,...

JSC FINCA Bank Georgia
Pillar 3 Annual Report 2017

Contents 1. Bank Management’s statement on the accuracy of information provided in the report ................. 3
2. Basic Indicators ..................................................................................................................................... 3
3. Shareholder Structure .......................................................................................................................... 8
4. Shareholders Related Issues .............................................................................................................. 10
4.1 Shareholders Rights........................................................................................................................ 10
4.2 Revenue Received by Shareholder ................................................................................................ 11
5. Corporate Governance ....................................................................................................................... 11
5.1 Supervisory Board .......................................................................................................................... 11
5.2 Committees .................................................................................................................................... 15
5.3 Management Board ....................................................................................................................... 19
6. Risk Management ............................................................................................................................... 21
6.1 Bank’s Strategy ............................................................................................................................... 21
6.2 Risk Management Strategy ............................................................................................................ 22
6.3 Risk Culture ..................................................................................................................................... 22
6.4 Risk Management Structure .......................................................................................................... 23
6.5 General Risks .................................................................................................................................. 27
6.5.1. Credit Risk ......................................................................................................................................... 27
6.5.2 Market Risk ........................................................................................................................................ 31
6.5.2 Liquidity Risk ..................................................................................................................................... 32
6.5.4. Operational Risk ............................................................................................................................... 35
6.6 Stress Testing .................................................................................................................................. 37
7. Information About Remuneration ..................................................................................................... 38
7.1 Remuneration Policy ...................................................................................................................... 38
7.2 Remuneration Tables ..................................................................................................................... 40
8. Appendix, which includes Tables not linked to quantitative information ....................................... 41
9. Appendix, 4Q 2017 Quarterly Reporting Tables ............................................................................... 47

1. Bank Management’s statement on the accuracy of information
provided in the report
The Bank's Board of Directors confirms the accuracy of all the data and information outlined in the given
Pillar 3 report. Report has been prepared in compliance with internal control processes which are agreed
with the Supervisory Board. The Report is based on National Bank of Georgia’s Decree #92/04 about the
Pillar 3 information disclosure requirements for commercial Banks. According to the regulation the audit
of the information published within the framework of the Pillar 3 is not mandatory.
2. Basic Indicators
Total regulatory capital ratio 2017: 15.83% Total regulatory capital ratio
The source of improved ratio is higher profitability and lower risk exposure in 2017. The Bank had strengthened the capital base via increased profitability, issued new subordinated debt in 2017 and decreased foreign currency risk weighted assets.
2016: 11.38%
Total Capital Split by Tier 1 and Tier 2
Return on Average Assets (ROAA) 2017: 0.75% Return on average assets (ROAA)
The source of higher Return on Average Assets is increased profitability in 2017, which is result of improved efficiency - the Bank achieved higher operating revenue through lower operating expenses.
2016: -0.14%

Return on Average Equity (ROAE) 2017: 6.22% Return on Average Equity (ROAE)
The source of higher Return on Average Equity is increased profitability in 2017, which is result of improved efficiency - the Bank achieved higher operating revenue through lower operating expenses.
2016: -1.00%
Opex Ratio 2017: 11.91 % Opex Ratio
The ratio is calculated as operating expenses divided by average loan portfolio. The main reason of improvement is decreased operating expenses and increased loan portfolio.
2016: 15.06%
Deposit Ratio 2017: 74.05 % Deposit Ratio
The ratio is calculated as Clients Deposit divided by Borrowed Funds. The Bank decreased IFI funding by diversification of financing sources via deposits portfolio in 2017.
2016: 71.35%
Deposits and Borrowed Funds Split by Type

Cost of Deposits 2017: 8.22 % Cost of Deposits
The Bank decreased interest expenses on the deposit portfolio by diversification client base and introducing new deposit products.
2016: 9.56%
LLR/ Average Portfolio 2017: 3.95% Loan Loss Reserve/ Average Portfolio
The ratio is calculated based on regulatory provisioning policy. 2016: 4.11%
Average Liquid Ratio 2017: 42.01% Average Liquid Ratio
The Bank further optimized the liquidity management. 2016: 53.66%
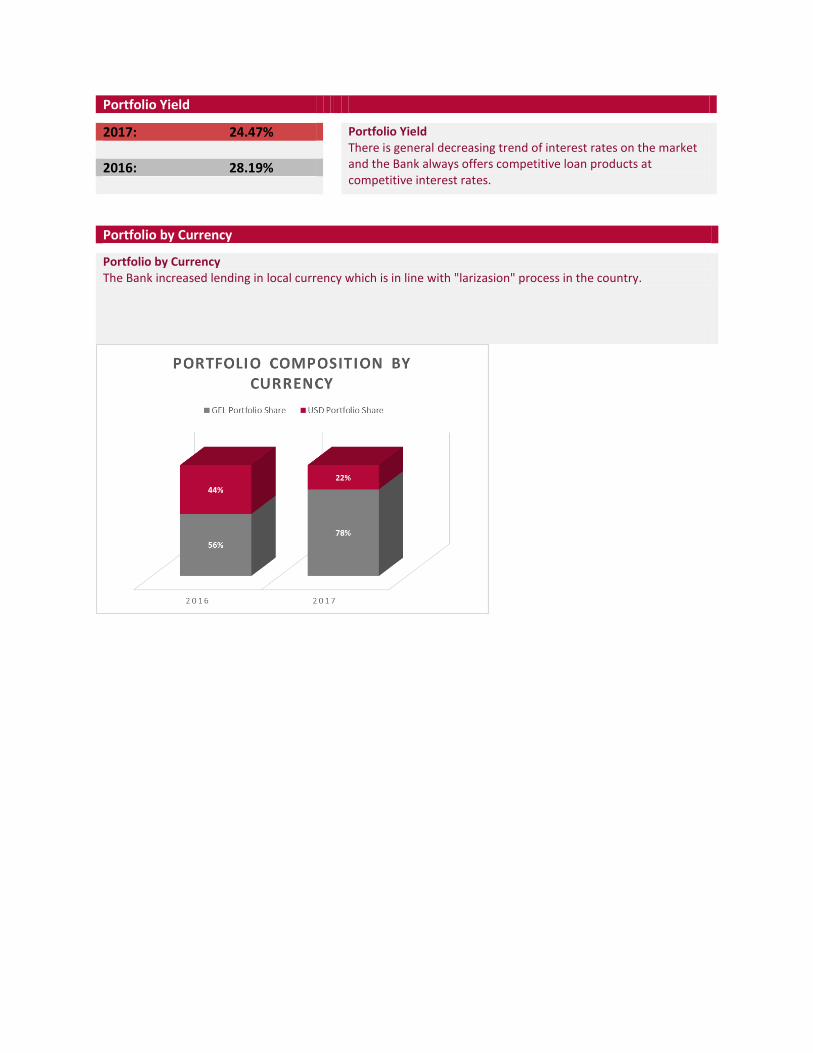
Portfolio Yield 2017: 24.47% Portfolio Yield
There is general decreasing trend of interest rates on the market and the Bank always offers competitive loan products at competitive interest rates.
2016: 28.19%
Portfolio by Currency Portfolio by Currency The Bank increased lending in local currency which is in line with "larizasion" process in the country.

Balance Sheet in Georgian Lari
N Assets GEL FX Total GEL FX Total
1 Cash 5,180,357 7,125,683 12,306,040 5,885,414 7,282,677 13,168,091
2 Due from NBG 9,483,447 19,854,124 29,337,571 10,987,698 19,384,781 30,372,478
3 Due from Banks 265,632 5,322,489 5,588,121 16,383 4,335,686 4,352,070
4 Dealing Securities 0 0 0 0 0 0
5 Investment Securities 18,899,921 0 18,899,921 19,191,492 0 19,191,492
6.1 Loans 174,988,103 49,290,135 224,278,238 115,055,004 90,769,693 205,824,697
6.2 Less: Loan Loss Reserves -5,833,711 -2,814,781 -8,648,492 -4,017,888 -3,568,488 -7,586,376
6 Net Loans 169,154,392 46,475,354 215,629,746 111,037,116 87,201,205 198,238,321
7 Accrued Interest and Dividends Receivable 2,733,130 407,886 3,141,016 2,124,162 807,587 2,931,750
8 Other Real Estate Owned & Repossessed Assets 204,604 0 204,604 169,945 0 169,945
9 Equity Investments 0 0 0 0 0 0
10 Fixed Assets and Intangible Assets 6,227,401 0 6,227,401 7,133,022 0 7,133,022
11 Other Assets 2,178,135 199,430 2,377,565 2,576,745 94,020 2,670,765
12 Total assets 214,327,018 79,384,965 293,711,984 159,121,978 119,105,956 278,227,934
Liabilities
13 Due to Banks 0 620,880 620,880 0 0 0
14 Current (Accounts) Deposits 5,088,290 1,659,432 6,747,722 17,249,097 1,857,568 19,106,665
15 Demand Deposits 7,684,996 9,328,759 17,013,756 23,113,060 8,796,383 31,909,443
16 Time Deposits 38,607,143 33,920,988 72,528,131 17,272,881 30,229,030 47,501,911
17 Own Debt Securities 20,000,000 0 20,000,000 20,000,000 0 20,000,000
18 Borrowings 70,063,229 57,253,057 127,316,286 40,786,515 77,286,560 118,073,075
19 Accrued Interest and Dividends Payable 2,161,980 1,353,834 3,515,814 1,575,822 1,544,057 3,119,879
20 Other Liabilities 3,836,314 246,368 4,082,683 3,756,634 599,123 4,355,757
21 Subordinated Debentures 0 5,702,840 5,702,840 0 0 0
22 Total liabilities 147,441,952 110,086,159 257,528,112 123,754,010 120,312,721 244,066,731
Equity Capital
23 Common Stock 20,213,600 0 20,213,600 20,213,600 0 20,213,600
24 Preferred Stock 0 0 0 0 0 0
25 Less: Repurchased Shares 0 0 0 0 0 0
26 Share Premium 0 0 0 0 0 0
27 General Reserves 0 0 0 0 0 0
28 Retained Earnings 15,970,272 0 15,970,272 13,947,604 0 13,947,604
29 Asset Revaluation Reserves 0 0 0 0 0 0
30 Total Equity Capital 36,183,872 0 36,183,872 34,161,204 0 34,161,204
31 Total liabilities and Equity Capital 183,625,825 110,086,159 293,711,984 157,915,214 120,312,721 278,227,934
Reporting Period Respective period of the previous year

3. Shareholder Structure
FINCA Bank Georgia JSC is 100% owned by FINCA Microfinance Coöperatief U.A. a cooperative registered
in the Netherlands with the trade register of the Chamber of Commerce of Amsterdam under number
53004698 and having its official seat in Amsterdam (the “Cooperative”).
The members of the Cooperative are:
FINCA MICROFINANCE HOLDING COMPANY LLC, a limited liability company registered under the
laws of the State of Delaware, United States of America and having its registered address at 2711
Centerville Road, Suite 400, Wilmington, Delaware 19808, United States of America. FINCA
MICROFINANCE HOLDING COMPANY LLC holds 99 voting rights.
FINCA INTERNATIONAL LLC, a limited liability company registered under the laws of the State of
Maryland, United States of America and having its registered address at 11 East Chase Street,
Baltimore, Maryland 21202, United States of America. FINCA INTERNATIONAL LLC holds 1 voting
right.
The Shareholders of FINCA MICROFINANCE HOLDING COMPANY LLC are as follows:
FINCA International, Inc. – Majority Shareholder
International Finance Corporation (IFC)
KfW
FMO (Nederlandse Financierings Maatschappij voor Ontwikkelingslanden N.V)
Credit Suisse Microfinance Fund Management Company, acting for responsAbility Global
Microfinance Fund
Triodos Investment Management
Triple Jump, acting for ASN-NOVIB FONDS
FINCA International, Inc. is a not-for-profit corporation under the laws of the State of New York and as
such, its Members hold no ownership in FINCA International, Inc. and have no economic rights. As of this
date, the Members of FINCA International, Inc. are as follows:
Rupert Scofield
John Hatch
Robert Hatch
Richard Williamson

Other subsidiaries of the holding company
FINCA Micro-Credit Deposit Organization LLC Specialized Micro Loans (Pvt Sh Co)
FINCA Tanzania Limited FINCA Micro-Credit Company CJSC
FINCA Uganda Limited FINCA Plus LLC
Fundacion Internacional Para La Asistencia Comunitaria de Guatemala
Foundation for International Community Assistance (FINCA Limited)
FINCA Africa IT Service Center Ltd FINCA Afghanistan ( FINCA Afghanistan JSC)
FINCA Zambia Limited FINCA Capital Fund LLC
FINCAServicios - Latinoamerica SA FINCA Universal Credit Organization CJSC
FINCA Zambia Holding Limited FINCA Charity Foundation
Nederlandse Financierings Maatschappij voor Ontwikkelingslanden N.V.
FINCA Azerbaijan LLC
MFSI Guatemala SA Micro-Finance Solutions, Inc (MFSI)
FINCAServices USA LLC FINCA D.R. Congo sarl
FINCA Microfinanzas, SA Banco Para La Assistencia Comunitaria FINCA SA
FINCA Microfinance Bank Limited Fundacion Internacional Para La Asistencia Comunitaria del Ecuador
FINCA Haiti SA Foundation for International Community Assistance
FINCA Microfinance Bank Limited Financiera FINCA Nicaragua, SA
FINCA Haiti FINCA Kosovo S.h.A.
FINCA Honduras
(Sociedad) Financiera FINCA Honduras, SA

4. Shareholders Related Issues
4.1 Shareholders Rights
The General Meeting of Shareholders is the supreme body for the management of the Bank. A General
Meeting of Shareholders is convened either for annual or extraordinary meetings. The annual meeting
shall be held within two months following the closing of the Annual Audited Financial Statement.
The General Meeting of Shareholders is authorized:
a) to amend the Charter of the Bank, including any change in share capital, to amend the commercial
name of the Bank, or to decide on the issue of liquidation of the Bank;
b) to make the decision on the merger or division;
c) to cancel completely or partially the right of the pre-emptive purchase of the shares upon the increase
of the charter capital, sale of the shares by the other shareholders or the issuance of other securities by
the Bank;
d) to accept or reject proposals of the Supervisory Board or the Management Board members
concerning the utilization of profit or to make decisions concerning the utilization of net profit, if the said
bodies fail to make an agreed proposal;
e) to approve the reports by the Officers and the Supervisory Board;
f) to elect and dismiss the members of the Supervisory Board, determine the question of the
remuneration of the members of the Supervisory Board and conclusion of contracts with them;
g) to elect the auditor and special controller;
h) to make decisions on the participation in court proceedings against the Officers and the Supervisory
Board members; to appoint its representative for the above action;
i) to adopt resolutions on the issuance and sale of shares and other securities in accordance with this
Charter and Georgian legislation.

4.2 Revenue Received by Shareholder
Pursuant to the terms of the Intellectual Property License Agreement made by and between FINCA
Microfinance Cooperatief U.A (“FMC”) and FINCA Bank Georgia JSC dated November 18, 2011 the parties
agreed that the Bank shall pay FMC a royalty payment on all future interest income. On August 6, 2013
royalty fee calculation method was determined as the following percentages of operating revenues: 0%,
1.5%, 2% and 3% respectively, if operating revenue is less than USD 500,000, within the range of USD
500,000 and USD 1,000,000, within the range of USD 1,000,000 and USD 2,500,000 and greater than USD
2,500,000. During fiscal year 2017, total royalty fee paid by the Bank amounted GEL 819,981 including
VAT.
According to the Management Service Agreement signed between FINCA Microfinance Coöperatief
U.A.(“FMC”) and FINCA Bank Georgia, MFC provides various centralized management services to the Bank
on which the Bank pays management service fee. During fiscal year 2017, total management service fee
paid by the Bank amounted GEL 2,923,184 including VAT.
5. Corporate Governance
FINCA Bank Georgia’s corporate governing bodies are the General Meeting of Shareholders, the
Supervisory Board and the Management Board, each having its own responsibilities and authorities in
accordance with Georgian law and the Bank’s Charter.
5.1 Supervisory Board
FINCA Bank Georgia‘s Supervisory Board’s primary responsibilities are to manage risk, to ensure the Bank
has a system of internal controls that operates effectively, and to provide oversight of the Bank on behalf
of the Shareholders and independent of the FINCA Bank Georgia Management, including with respect to
carrying out FINCA’s mission, strategy implementation and alignment with the FINCA Network, financial
performance, social performance, and compliance with applicable law and regulations. The Supervisory
Board is also responsible for overseeing and evaluating the operations of FINCA Bank Georgia in
accordance with the Bank’s foundational documents, other applicable documents or standards.
The General Meeting of Shareholders elects a Supervisory Board consisting of3 (three) to 21 (twenty one)
members. Each member of the Supervisory Board shall be elected for the term of four years. The General
Meeting may, at any time remove any members or re-elect the Supervisory Board member before the
expiry of their term. At the same time, any member may resign at any time. The Supervisory Board elects
its Chairman and Deputy Chairman from amongst its members. The meetings of the Supervisory Board
are conducted at least once in 3 (three) months.

The Supervisory Board conducts self-evaluation regarding compliance with Board activities, existing
processes, effectiveness, composition and on fit and proper criteria of the Members on an annual basis.
The results of the evaluation is considered by the Shareholder.
Objectives and the authority of the Supervisory Board are as follows:
a) Supervises the activities of the Officers;
b) Appoints and dismisses the Officers, concludes service agreements determining their
remuneration and working conditions;
c) Determines the rights and obligations of the Officers;
d) Requests reports from the Officers concerning all activities of the Bank;
e) Controls the Bank’s accounting books and entries, the cash, property and other securities,
may assign this task to the experts;
f) Convenes special general meetings of shareholders if it is deemed necessary for the Bank’s
interests;
g) Checks the annual financial report, proposal on profit distribution and the information on
the Bank’s standing and presents its opinion to the General Meeting;
h) Prepares its own report to be presented to the General Meeting;
i) Represents the Bank in legal proceedings against the Officers;
j) Fulfills other responsibilities envisaged by the Georgian legislation.
The following activities shall be performed only with the written consent of the Supervisory Board:
a) Making new investments, founding new enterprises;
b) Purchase and sale of property, mortgage of the Bank’s immovable property and similar
encumbrance;
c) Taking loans or credits by the Bank;
d) Establishment and liquidation of branches, divisions (service centers) and representative
offices;
e) Approving branch, divisions (service centers) and representative offices managers
proposed by the Officers;
f) Making investments, except in the normal course of business;
g) Initiation of new commercial activities;
h) Determination of economic and financial policies and objectives;
i) Definition of principles for general working conditions, employees’ rights, and provision
of pensions for Officers and all other employees;

j) Appointment and dismissal of trade representatives (procurators);
k) Implement the decision of the General Meeting on admission of the Bank’s shares and
other securities to the stock market;
l) Determination of the principles of participation of the managers in the profits and other
related relations as well as definition of pension principles for them and presentation to
the General Meeting of Shareholders for approval;
m) Approval of all kinds of technical assistance agreements, know-how and license
agreements.
Bank policy papers include. risk management policies are reviewed and approved by the Supervisory
Board while ordinary or special meeting as needed.
FINCA Bank Georgia Supervisory Board consists of following members:
Florin Lila, Chairman
Florin Lila joined FINCA in 2012, first as Deputy Regional Director and then as Chief Executive Officer in
FINCA Kosovo. In his current position as Vice President and Regional Director for Eurasia, he is in the
process of being appointed as Chair of the Board of Directors for Armenia, Georgia, Kyrgyzstan and
Tajikistan, and is responsible for the oversight and development of all FINCA subsidiaries in the Eurasia
region. He is also a member of the Management Team (MT) of FINCA Impact Finance.
Florin brings a wealth of banking experience and distinguished academic background. Prior to joining
FINCA, he had 13 years of experience in the banking sector including multiple roles at Executive
Management and Board of Directors level, both in Kosovo and Ghana.
He holds an MA degree in Economics for Business Analysis from Staffordshire University, United Kingdom.
Dane Steven McGuire, Deputy Chairman
Throughout his career, Steve McGuire has focused on managing participation in professional markets both
in developed and emerging markets. He has also gained significant experience in the financial control of
commercial banking units, as well as adherence to banking and regulatory requirements. Before joining
FINCA, he served at Global Head of Central Banks at ABN Amro Bank, NV., culminating a 12-year career
with the bank as its UK Treasurer and Regional Treasurer in Latin America. Prior to this role, he held the
position of UK Treasurer of Credit Lyonnais in the UK for a period of six years, preceded by a decade with
Citibank in Ecuador, Venezuela, London, and Copenhagen, in different country and regional roles, ranging
from credit and corporate relationship management to investment banking. Mr. McGuire also served as
a US Peace Corps Volunteer in Guatemala from 1971 to 1973. He received his M.A. in International Studies
from the Johns Hopkins University School of Advanced International Studies, in Washington, DC, and a
B.A. in Political Science from The Citadel in Charleston, SC.

Volker Renner, Member
Volker Renner has over 20 years of senior management experience in microfinance in four continents.
From 2004 to 2016 he served FINCA International as Vice President for Credit and Savings, Global COO
and Regional Director for FINCA Eurasia. Prior to joining FINCA Volker held positions as CEO of ProCredit
Bank (Ukraine) and advisor to banks in Russia and Ukraine. Volker has served as board chairman, board
member and audit committee member in numerous microfinance institutions and banks.
Olga Tomash, Member
Olga has 20+ years of experience in banking and audit including in international audit firms and
international banks. Olga joined FINCA as the Eurasia Regional Internal Control Manager in 2013 and after
two years moved on to the position of the Regional Banking Services Manager for Eurasia. Before joining
FINCA, Olga had 10 years of managerial experience in banks, first as the head of Internal Audit, then as an
Executive Director. For several years Olga was lecturing “Staff Management” at Eastern Europe ProCredit
Academy in Macedonia and “Risk Management”, “Internal Audit and Controls” at Deloitte Academy in
Kyiv. Olga holds a diploma in Accounting and Audit in Banks from Kyiv State University of Economics and
Trade. She is a Fellow member of ACCA (Association of Certified Chartered Accountants) since 2004.
Paul Russell Clark, External member
Paul Clark joined FINCA as an external Board member in mid-2012. Paul has been a management
consultant for nearly 30 years, starting out in North America through 1991 and then moving to Western,
Central and Southeast Europe. He has been providing advisory services to Georgian companies and
institutions since 2000. His clients in Georgia include small to very large companies in more than 20 sectors
ranging from energy to financial services to production. Other clients in Georgia are IFIs, diplomatic
missions, NGOs and a variety of donor projects. Paul is a graduate from Stanford University (two
engineering degrees) and the University Of Chicago Booth School Of Business (MBA in finance).
FINCA Microfinance Holding Company Board of Directors consists of following members:
1. Richard M. Williamson
2. Michael Barth
3. Monish K. Dutt
4. Johannes Feist
5. Shawn Hassel
6. Robert W. Hatch
7. Rupert W. Scofield
8. David Weisman

5.2 Committees
FINCA Bank Georgia Supervisory Board appoints an Audit Committee, an Asset-Liability Committee
(“ALCO”) and Risk Committee. The Committees are required to report to the Supervisory Board on matters
within their respective scopes of authority (as defined in their Committee Charters) and provide
recommendations to the Supervisory Board.
Audit Committee
The Supervisory Board appoints the members of the Audit Committee for a period of 4 years (From June
1, 2018 Audit Committee will be comprised from Supervisory Board Members). The authority of the Audit
Committee member shall be prolonged until duly replaced. The appointment can be renewed for one or
more additional terms.
The Audit Committee consists of up to 3 (three) members. Regular Meeting of the Audit Committee shall
be held at least once every quarter. Extraordinary meetings shall be held upon the request of the
Supervisory Board or Audit Committee Chairman.
Currently the Members of the Audit Committee are following individuals:
Chikako Kuno, Chairman
Florian Dervishi, Deputy Chairman
Gevorg Ter-Hovhannisyan, Member
Competence of the Audit Committee:
To establish appropriate rules for accounting controls and to oversee their observance and to
conduct inspection of reporting and accounting records through the Bank's Internal Audit
Department;
To supervise the Bank's compliance with applicable law;
To approve the Internal Auditing policies and to organize the operations of the Bank's Internal
Audit Department;
To ensure that the Internal Audit Department is objective and independent from the Bank's
Management Board and its Supervisory Board;
To approve the work plan of the Internal Audit Department for the coming fiscal year;
To review all quarterly reports of the Internal Audit Department and to approve and report audit
findings and recommendations to the Supervisory Board and the Management Board;
To monitor the activities of the Internal Audit Department, comparing its actual performance
against its Work Plan for each quarter and year;
To evaluate the performance of the Officer of the Internal Audit Department and of individual
internal auditors.
ALCO
ALCO governs and monitors Financial Risk, including but not limited to Liquidity Risk, Funding Risk,
Counterparty Credit Risk, Foreign Exchange Risk, and Interest Rate Risk. It also monitors other relevant
risks such as Lending, Credit and Operational risk, and makes recommendations for remediating
exceptions, funding mobilization and asset allocation. ALCO evaluates and recommends capital structure
decisions and manages capital adequacy, in the context of its risk management activities as well as ensures
the compliance with existing covenants from the NBG and IFIs.
ALCO committee meets on a monthly basis. ALCO members are: CEO (Chair), CFO (Secretary), Regional
Director, Hub Representative (prepares agenda and gathers materials for distribution), Capital Markets
Group representative and Treasurer. ALCO meetings can be also attended by other guests periodically
invited for special topics as determined by the Committee Chair.
The Committee shall provide a report to the Supervisory Board (following each meeting held) summarizing
risk issues and key areas discussed recommendations to the board, and decisions taken by the Committee.
Risk& Compliance Committee
Supervisory Board appoints Management Board Level Risk & Compliance Committee for the purpose of
overseeing and approving the company-wide risk management practices. Risks to be considered by the
risk Committee include credit, market, liquidity, operational, compliance and reputational risk of the Bank.
Risk Committee assists the Supervisory Board in overseeing FINCA Bank Georgia’s risk governance
structure, risk management and risk assessment guidelines and policies, risk tolerance, capital and funding
practices.
Primary purposes of the Risk Committee are:
To monitor the risk framework of the Bank, promote effective management of all risk categories,
and foster the establishment and maintenance of an effective risk management culture
throughout the Bank;
Oversee that the executive management has identified and assessed all the risks that the
organization faces and has established a risk management infrastructure capable of addressing
those risks;

Make recommendations to the Board, including recommendation of the Bank’s risk Strategy,
Appetite, risk mitigation actions and on any measures that are required to enhance risk
management system (including trainings, structure, new products features and other relevant
issues);
Oversee the compliance function of the Bank.
Other Committees
Credit Committee
The Credit Committee of FINCA Bank Georgia has the authority to review and make a final decision on
approval or rejections of all proposed loan applications. It is also discussing the necessity of loan
restructuring, level of collateral and any other related issues.
Credit Committee may include following members: CEO, COO, Regional Operations Manager, Service
Center Manager, Credit Manager, Lawyer, and Internal Control Department Manager. Credit Committee
meets daily when required and its exact composition depends on the respective loan size.
HR Committee
HR committee meets quarterly, its composition is as follows: Regional Eurasia HR Director, Head of HR
Department FINCA Bank Georgia, FINCA Bank Georgia Executive Management – CEO, COO, CFO and GC.
HR committee functions are as follows:
Review and approve for recommendation to the Supervisory Board the organizational chart
(annually, or as changes are proposed).
Review and approve for recommendation to the Supervisory Board the Company’s annual plan
and budget relative to all aspects of Human Resources (staffing, recruitment, training and
development, performance incentives, and other aspects).
Review and approve for recommendation to the Board the salary, benefit and incentive
compensation structures for all personnel.
Oversee the succession plan for management positions and make recommendations to the Board
regarding key executives and succession plans.
Monitor staff turnover rates by position, and report on turnover trends in regular reports to the
Supervisory Board, making recommendations for addressing retention issues as appropriate.
Conduct a review of Human Resources policies and procedures, including HR Policies Manual,
Employee Handbook, and any other documentation.

Deliberate and approve any disciplinary actions to be taken against persons employed in any of
the core managerial position.
Review the results of the annual Climate Survey, and provide feedback and recommendations to
management and the Supervisory Board as appropriate.
Oversee talent management and development, including processes for performance
management and career pathing, coaching, mentoring, and training, as well as management’s
efforts to support wider FINCA network objectives.
Disciplinary Committee
Disciplinary committee reviews FINCA Bank Georgia employees’ disciplinary cases should any employee
misconduct notification be submitted to members of disciplinary committee.
Disciplinary committee members are: Executive Management – CEO, COO, CFO, GC Head of HR
Department and Head of Risk Management.
Other functional lines
FINCA Bank Georgia has various functional managers level that provide oversight of certain operations
and procedures, including the technical areas of finance, operations, risk management, internal audit,
legal, governance, human resources, marketing communications, and information services. These
functional managers ensure that critical Supervisory Board and management information is sufficiently
complete, accurate and timely, to enable appropriate decision making, and provide the control
mechanisms to ensure that strategies, directions and instructions from both the Supervisory Board and
Management Board are carried out systematically and effectively.
5.3 Management Board
The Management Board of FINCA Bank Georgia consists of Chief Executive Officer (“CEO”), Chief Financial
Officer (“CFO”), Chief Operating Officer (“COO”) and General Counsel & Corporate Secretary. Each
member is appointed by the Supervisory Board for a 4-year term, but the authority of the members
continues after expiration of the term until the Supervisory Board appoints the new Member(s) of the
Management Board. The Management Board shall be responsible for the management and the execution
of the Bank's activities and Board members shall be eligible for re-election on one or more additional
terms.
Vusal Verdiyev, Chief Executive Officer of FINCA Bank Georgia, has over 10 years of executive leadership
in banking, microfinance, project management. Vusal Verdiyev joined FINCA Georgia from 2008 in COO
role and from 2009 is appointed as CEO. He leads FINCA Bank Georgia management team, provides
strategic leadership in risk management, human resources management, product development,
marketing, project management, operations, finance, information technology. Mr. Verdiyev led
transformation process, development of core banking software and other initiatives. Prior joining FINCA
Georgia, he worked in FINCA Azerbaijan, Citizens Development Corps, Netherlands Management
Cooperation programs and CHF. He holds MBA in Agriculture Economics and Management and ABA
Stonier National Graduate School of Banking, University of Pennsylvania.
Giorgi Mirotadze, Chief Financial Officer of FINCA Bank Georgia, has over 15 years of executive
experience in banking, microfinance and business consulting. He joined FINCA Georgia since year 2007,
where his responsibilities included all aspects of financial management, budgeting, taxation, also active
participation in the banking transformation as well as banking software implementation. Prior to joining
FINCA, he served as Director, Finance and Information Technology at Cascade Bank Georgia. Before he
served as Director, Treasury and Strategic Development at Bank Republic. His previous career includes
senior positions at business consulting companies (CERMA/The Recovery Group funded by World Bank,
and Sibley International/Georgia Accounting Reform Project funded by USAID). He holds an MBA degree
major in Banking and Finance from Hofstra University, Hempstead, New York. He also graduated from
ABA Stonier National Graduate School of Banking, University of Pennsylvania in 2010.
Giorgi Nadareishvili, Chief Commercial Officer of FINCA Bank Georgia, has over 15 years of senior-level
experience managing microfinance banks throughout Georgia, Ukraine and Armenia. He has a solid
background in MSME lending, branch network development, as well as non-credit operations
management.
He joined FINCA Georgia in 2018 as Chief Commercial Officer. Prior to joining FINCA Bank Georgia, Giorgi
worked as Chief Operating Officer of FINCA Armenia. For several years Giorgi worked for TBC Bank
Constanta as a Chief Operations Officer, Chief Executive Officer and finally as a Chief Risk Officer. Before
this role Giorgi worked for TBC Group, Georgia and gained valuable experience managing various
functions ranging from sales, marketing and operations to customer service and back office.
Giorgi has also served for ProCreditBank in Georgia and Ukraine. He held the position of a Central Branch
Manager at ProCreditBank Ukraine, as well as the position of a Chief Regional Officer at ProCreditBank
Georgia for almost 7 years.

Giorgi Nadareishvili holds Master’s degree in Economics from the Ivane Javakhishvili Tbilisi State
University, Georgia. In 2008 he also graduated from the ABA Stonier Graduate School of Banking at the
University of Pennsylvania. Since 2014 he has been a candidate for MBA degree Edinburgh Business School
Herriot Watt University at the executive program.
David Zarandia, General Counsel & Corporate Secretary of FINCA Bank Georgia, has over 8 years
of experience in managerial positions in the field of legal affairs of the financial sector.
David Zarandia joined FINCA Georgia in 2006 and during 11 years he was in charge of ensuring compliance
of FINCA Georgia activities with respective legal requirements. He actively participated in the key
transformation processes of the company – FINCA transformation into microfinance organization in 2007
and transformation from microfinance organization into a commercial bank in 2013.
For several years David led legal support and problem loans management functions. As a bank corporate
secretary, he worked on an implementation of the modern corporate management model. Prior to his
career in FINCA Georgia David’s activity covered legal consulting and litigation in finance, energy, and
medical law fields.
David Zarandia graduated from Ivane Javakhishvili Tbilisi State University, Georgia. He holds a Master’s
Degree in Law (LL.M.) from Köln University (Germany). As of 2006 he is a member of the Georgian Bar
Association.
Conflicts of Interest
None of the members of the Supervisory Board and the Management Board is engaged in any activity that
is, or could be reasonably perceived to be, in conflict with the interests of the FINCA Bank Georgia.

6. Risk Management
6.1 Bank’s Strategy
According to the FINCA Bank Georgia’s business strategy the Bank aims to maintain stable development
trend in middle term. In order to increase the shareholder’s equity and to use opportunities in the existing
economic environment FINCA Bank defined its business strategy in consideration of the following:
• Be a reliable partner and Institution of choice in micro-finance and SME banking
• Ambitious growth in core segments of the bank, primarily in the rural areas
• Superior customer experience for both – internal and external customers
• Growth and diversification of retail deposit portfolio
• Innovative and digital solutions, to serve the customer base more conveniently
• Maintaining concentration on core segment and on social responsibility by diversification,
effectiveness and increase of the competitiveness of the Bank.
• Optimization of the cost structure
When implementing its strategic goals the bank will be governed by its vision and goals and will exercise
social responsibility by achieving a positive impact on the country’s society as a whole, the specific
communities it works in, as well as each individual customer.
FINCA Bank Georgia’s long term viability as a niche bank will be a function of its value proposition in the
local market.
Bank’s Business Strategy is approved by the Supervisory Board. The Supervisory Board oversees
respectively alignment with the Business Strategy.
6.2 Risk Management Strategy
Bank’s Risk Strategy sets risks appetite levels and controls the alignment with approved limit in order to
support Bank’s Management Board in execution of the Bank’s Business Strategy.
Risk appetite is the level of risk that the bank chooses to take in pursuit of its strategic objectives. It also
reflects the bank’s capacity to sustain potential losses at varying levels of probability, based on available
capital resources. The bank’s risk appetite is approved by the Supervisory Board and combines a top-down
view of the bank’s capacity to take risk with a bottom-up view of the risk profile provided by each business
line. In order to control risk exposure Bank defines limits per all relevant types of risk (such as credit,
market, operational and other risks). This annual setting of risk appetite considers the bank’s ability to
support business growth. Performance against risk appetite is measured and reported to the
Management and Supervisory board quarterly.
The bank regularly monitors the level of potential deviation from expected financial performance that it
is prepared to sustain at relevant points on the risk profile. It is established with reference to the strategic
objectives and to the business plans of the bank, including the achievement of annual financial targets.
FINCA Bank’s Risk Strategy targets accomplishment of the following tasks:
Protect Bank’s financial stability and profitability;
Protect Bank’s digital products and infrastructure;
Protect the Bank from the reputational risk;
Take part in new product approval process in order to ensure healthy risk –return decisions;
Bank’s Risk Strategy and appetite is approved by the Supervisory board. The risk management committee
oversees the alignment with the risk strategy and appetite levels. Risk Appetite is reflect in the Bank’s
respective policies, procedures and limits. Bank’s Business units are functioning within those limits.
6.3 Risk Culture
Central to the Bank’s risk management and governance is its risk culture. The risk culture is defined by the
tone being set from the top. Risk culture is incorporated in the Bank's risk strategy, risk appetite
statement, and in a daily processes.
Risk Management Department regularly performs trainings for the functional units. Bank has
implemented risk awareness trainings for different risk directions such as operational risk, credit risk,
information security risk and compliance risk.

Code of Conduct
Our Integrity. FINCA Bank’s Code of Conduct is approved by the Management Board. According to the
code it is the policy of FINCA that all employees conduct their activities according to the highest ethical
and professional standards. In order to reaffirm this policy, the Board of Directors and the Members have
adopted this Code of Conduct, to which FINCA Persons - every employee, Board or Advisory Board
member, consultants and volunteers, and others acting on behalf of FINCA, wherever located, must
adhere. Failure to conduct activity in keeping with this Code of Conduct is grounds for immediate
termination of employment or other relationships with FINCA.
Our Policies - The Code of Conduct describes the ethical standards expected of all those associated with
FINCA and its affiliates. Code of conduct does not describe every possible situation but sets the policy and
ethics standards. Details as to specific requirements and policies are included in the FINCA Personnel
Manual (Employee Handbook), and in other policies established by FINCA.
Compliance with law - No one has the authority to violate any law or governmental regulation or to direct
another employee or any other person to violate any law or regulation on behalf of FINCA.
Public Perception and Fair Dealing - FINCA is conducting its activities fairly with its clients, vendors,
partners and employees and in such a way that, if disclosed to the public, would bring credit on FINCA.
6.4 Risk Management Structure
The Bank has efficient and effective risk management processes in place. To enable this, the Bank has
established a risk management framework, whose main purpose is to protect the Bank from risk and allow
it to achieve its performance objectives.
The Management Board has overall responsibility for the determination of the Bank’s risk management
objectives and policies and, whilst retaining ultimate responsibility for them, it has delegated the authority
for designing and operating processes that ensure the effective implementation of the objectives and
policies to the organizations finance function.
The overall objective of the Management Board is to set polices that seek to reduce risks as far as possible
without unduly affecting the Bank’s competitiveness and flexibility. Through the risk management
framework, the Bank manages above stated risks.
The risk management framework combines tools, actions, resources and systems with the aim to
effectively identify, assess and manage risks.
Management Board level Risk Committee is established to oversee and monitor risk management process,
risk framework, risk appetite and risk policies.
The supervisory board is responsible for the overall risk management of the FINCA Bank Georgia. The
supervisory board approves the Bank’s strategies and policies that are recommended by the management
board. The Management Board is responsible to implement the strategic direction set by the supervisory
board in the shape of policies and procedures and to institute an effective hierarchy to execute these
policies.
The monitoring and implementation of the Bank’s risk management function is split among four principal
risk management bodies: the Management Board, the Risk Committee, the Assets and Liabilities
Management Committee (the ALCO) and Risk Management Department. Head of Risk Management
Department subordinates directly to the CEO and reports to Risk Committee and to the Supervisory board.
Head of Risk Management is responsible for supervising all risk management activities across the Bank’s
business.
Risk Management Committee
Members of the Risk Management Committee
CEO
CCO
CFO
General Counsel & Corporate Secretary
Head of Risk Management and Compliance Department
Risk management committee oversees effectiveness of the risk management framework. As well as
alignment of the existing processes and limits with the risk appetite and strategy of the Bank. Risk
Management Committee assesses risks and takes decision about the mitigation measures.
Accountability for risk management is structured by the three lines of defense principles to achieve
effective governance of Risk Management.
I. First line of defense
FINCA Bank Georgia’s business units bear full responsibility for the risks that arise in their operations.
Businesses are responsible for identification, management and ensure that a risk and control environment
as part of day to day operations is established. First line of defense is primary responsible for any losses
resulted in their business areas.
II. Second line of defense
Risk Management Function – Oversees and controls risk management processes in organization. Risk
Management Department sets risk management framework and establishes risk limits. Risk management
department performs independent monitoring of the risk profile and supports business in developing of
the risk mitigation procedures, tools and policies. Additionally, risk management function makes
recommendations about the mitigation actions of the particular risks. Risk Management and Compliance
Unit reports directly to the CEO and the Supervisory Board.

III. Third line of defense
Internal Audit - an independent review function directly reports to the Audit Committee and Supervisory
Board.
Risk Reporting
Risk Management and Compliance department prepares risk report to the Risk Management Committee
monthly, where the risk trend and the current risk exposures are being discussed.
Comprehensive risks report including all material risk such as credit risk, market risk, liquidity risk,
operational risk and compliance risk is delivered to the Supervisory Board on the quarterly basis.
The risk report presents alignment with the risk appetite limits and KRY’s trend for all material risk types.
The Head of the risk management and compliance department presents the report to the Supervisory
Board. During the Supervisory Board meeting Bank’s risk framework and risk profile is being discussed
accordingly.

Risk Committee
Supervisory Board
Management Board
CEO/CCO/CFO/GC
CEO
Head of Risk Management and
Compliance Department
Head of Operational Risk
Management Unit
Internal Control Team
Operational Risk Specialist
Financial Risk Analyst
Information Security Analyst
Credit Risk AnalystAML and
Compliance Unit
AML Group
Audit CommitteeAsset/Liabilities
Committee
Disciplinary Committee
Assets and Liabilities
Management Group

6.5 General Risks
6.5.1. Credit Risk
The Bank is exposed to credit risk which is the risk that one party to a financial instrument will fail to
discharge an obligation and cause the other party to incur a financial loss.
The main business of the Bank is to provide micro-loans. To avoid significant financial damage caused by
this the Bank uses various methods to identify and manage effectively the credit risks.
Portfolio Yield 2017: 24.47% Portfolio Yield
There is general decreasing trend of interest rates on the market and the Bank always offers competitive loan products at competitive interest rates.
2016: 28.19%
Portfolio by Currency Portfolio by Currency The Bank increased lending in local currency which is in line with "larizasion" process in the country.

The Bank’s credit policy and lending control is determined by the Credit Manual, where all the related
procedures and requirements, along with respective controls are clearly defined, including loan
disbursement, monitoring of delinquent loans, etc.
The Bank focuses principally on micro-credit to low income entrepreneurs with cash flows from income
generating activities (including trade, production, agriculture, and others). The Bank also expanded credit
offering to small and medium enterprises in the service of market demand.
Bank’s practices individual lending methodology in its loan products. Where appropriate, and in the case
of most loans, the Bank obtains personal guarantee and/or collateral. However, a significant portion of
loans is personal lending, where no such facilities can be obtained. All applicants’ credit history is checked
in credit bureau with their consent.
The Credit Committee is the analytical body responsible for analyzing the information in the loan
applications. It is the independent body authorized to make the final decision about financing or rejecting
the loan application and changing in the conditions of loan, including restructuring.
FINCA Bank Georgia’s low risk in its credit portfolio is confirmed by low level of overdue as well as a low
number of customers with payment problems or identified future problems.
Stress tests indicate that FINCA Bank Georgia would have high resilience in an economic downturn. Also
past experience of successfully coping with crisis confirms this.
The total credit risk weighted risk exposure for FINCA Bank Georgia as of December 31, 2017 was GEL
198,137,337.
LLR/ Average Portfolio 2017: 3.95% Loan Loss Reserve/ Average Portfolio
The ratio is calculated based on regulatory provisioning policy. 2016: 4.11%
Credit Risk Control
Credit risk is principally controlled by establishing and enforcing authorization limits and very low
maximum loan limit. Decision making process workflow of credit committee is fully computerized.
Decision making limits are controlled by the MIS automatically based on the predefined access levels.
Regular monitoring ensures that limits are not exceeded.
Loans are monitored by the Bank’s service centers on the monthly basis. External events that can have
negative effect on the loan portfolio is discussed on the risk committee. Risk committee takes decision
about the mitigation actions needed for particular loans.
Loan portfolio risk also monitored regularly by the credit risk function. The credit portfolio and key credit
risk indicators are assessed as well, including: sector, product, region, branch and credit rating of the
client. Results are reported to the risk management committee and to the Supervisory Board.
In order to better assess agro loans and mitigate credit risk the “Technical cards” are used, which help the
business to define loan disbursement limit for particular agro sector and the client.

The high quality of the procedures are ensured also by the sound credit practices which is developed by
FINCA International’s professionals during 30 years.
Internal Control Team which is a part of the Operational Risk unit performs regular checks of credit
analyses quality.
The Bank continues to follow a prudential lending policy. All credit activities strive towards a long-term
customer relationship to achieve solid profitability and avoid credit expansion that may endanger long-
term stability.
Concentration Risk
Refers to an exposure with the potential to produce losses large enough to threaten a financial
institution’s health or ability to maintain its core operations.
Bank assesses various concentration dimensions including industry sector, geographic spread, credit
rating, customer segment and exposure to single counterparties or groups of related counterparties.
Bank applies the HHI (Herfindahl-Hirschman Index) to analyze its concentration risk.
The concentration of portfolio on individual borrower’s level are very limited due to high granularity of
portfolio. Risk assessment shows that overall concentration risk in the Bank is low.
Collateral appraisal
FINCA Bank Georgia has in place formal Procedure for the Collateral Appraisal and Pledge/Mortgage
Registration. The aim of the procedure is to define the types of property acceptable for securing of loan,
methods and procedures of collateral appraisal, collateral registration, agreement drafting, and
procedures of mortgage/pledge registration and annulment of the registration, other terms and
conditions related to the above issues.
Loan collateral represents the tool of credit risk reduction for the Bank and is considered to be an
alternative source of loan repayment in case of non-payment of the loan by the Client.
The loan collateral acceptable for the Bank shall include the following property owned by the owner or a
third person:
a) Real estate
b) Movable property
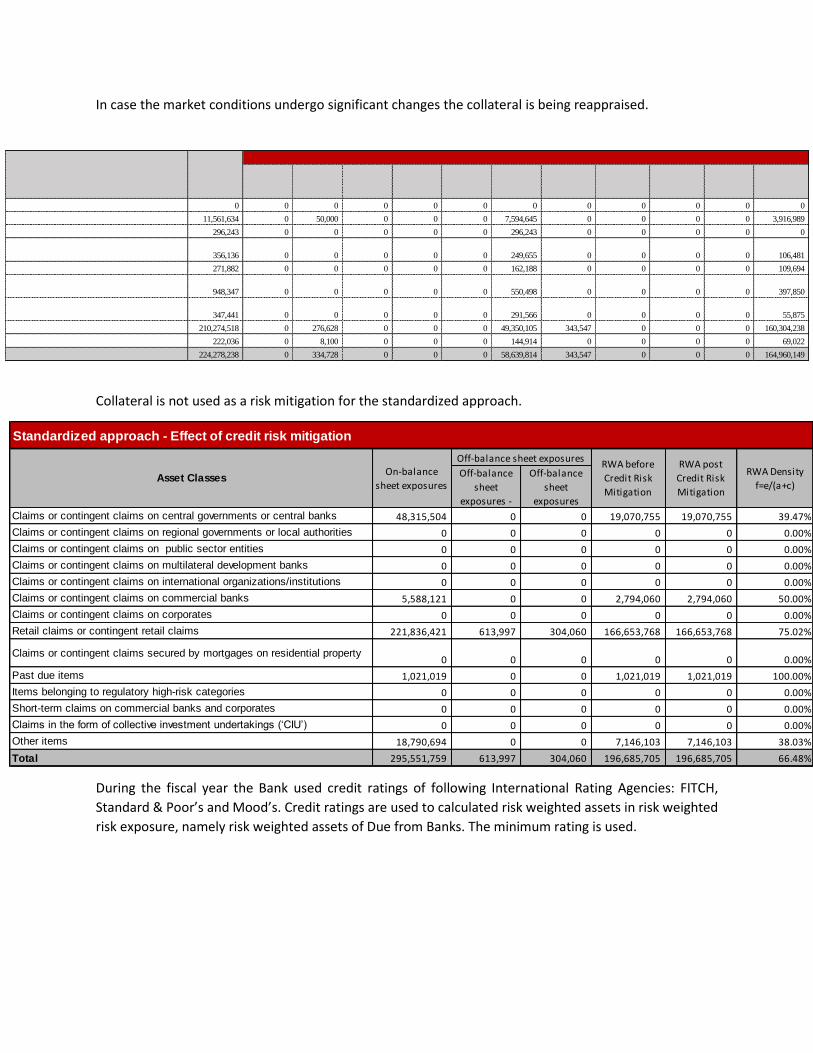
In case the market conditions undergo significant changes the collateral is being reappraised.
Collateral is not used as a risk mitigation for the standardized approach.
During the fiscal year the Bank used credit ratings of following International Rating Agencies: FITCH,
Standard & Poor’s and Mood’s. Credit ratings are used to calculated risk weighted assets in risk weighted
risk exposure, namely risk weighted assets of Due from Banks. The minimum rating is used.
Standardized approach - Effect of credit risk mitigation
Off-balance
sheet
exposures -
Off-balance
sheet
exposures
Claims or contingent claims on central governments or central banks 48,315,504 0 0 19,070,755 19,070,755 39.47%
Claims or contingent claims on regional governments or local authorities 0 0 0 0 0 0.00%
Claims or contingent claims on public sector entities 0 0 0 0 0 0.00%
Claims or contingent claims on multilateral development banks 0 0 0 0 0 0.00%
Claims or contingent claims on international organizations/institutions 0 0 0 0 0 0.00%
Claims or contingent claims on commercial banks 5,588,121 0 0 2,794,060 2,794,060 50.00%
Claims or contingent claims on corporates 0 0 0 0 0 0.00%
Retail claims or contingent retail claims 221,836,421 613,997 304,060 166,653,768 166,653,768 75.02%
Claims or contingent claims secured by mortgages on residential property0 0 0 0 0 0.00%
Past due items 1,021,019 0 0 1,021,019 1,021,019 100.00%
Items belonging to regulatory high-risk categories 0 0 0 0 0 0.00%
Short-term claims on commercial banks and corporates 0 0 0 0 0 0.00%
Claims in the form of collective investment undertakings (‘CIU’) 0 0 0 0 0 0.00%
Other items 18,790,694 0 0 7,146,103 7,146,103 38.03%
Total 295,551,759 613,997 304,060 196,685,705 196,685,705 66.48%
Asset ClassesOn-balance
sheet exposures
Off-balance sheet exposuresRWA before
Credit Risk
Mitigation
RWA post
Credit Risk
Mitigation
RWA Density
f=e/(a+c)
Guaranteed
by Georgian
Government
Deposit
Guarantees
of the Third
party
Share
Stock
Precious
MetalsReal Estate
Transport
Equipment
Supply and
Finished
Products
Equipment Other Unsecured
Interbank Loans 0 0 0 0 0 0 0 0 0 0 0 0
Loans to the Retail or Service Sector 11,561,634 0 50,000 0 0 0 7,594,645 0 0 0 0 3,916,989
Loans to the Energy Sector 296,243 0 0 0 0 0 296,243 0 0 0 0 0
Loans to the Agriculture and Forestry Sector 356,136 0 0 0 0 0 249,655 0 0 0 0 106,481
Loans to the Construction Sector 271,882 0 0 0 0 0 162,188 0 0 0 0 109,694Loans to the Mining and Mineral Processing
Sector 948,347 0 0 0 0 0 550,498 0 0 0 0 397,850Loans to the Transportation or
Communications Sector 347,441 0 0 0 0 0 291,566 0 0 0 0 55,875
Loans to Individuals 210,274,518 0 276,628 0 0 0 49,350,105 343,547 0 0 0 160,304,238
Loans to Other Sectors 222,036 0 8,100 0 0 0 144,914 0 0 0 0 69,022
Total Loans 224,278,238 0 334,728 0 0 0 58,639,814 343,547 0 0 0 164,960,149
Type of Loan Total Loans
By collateral
6.5.2 Market Risk
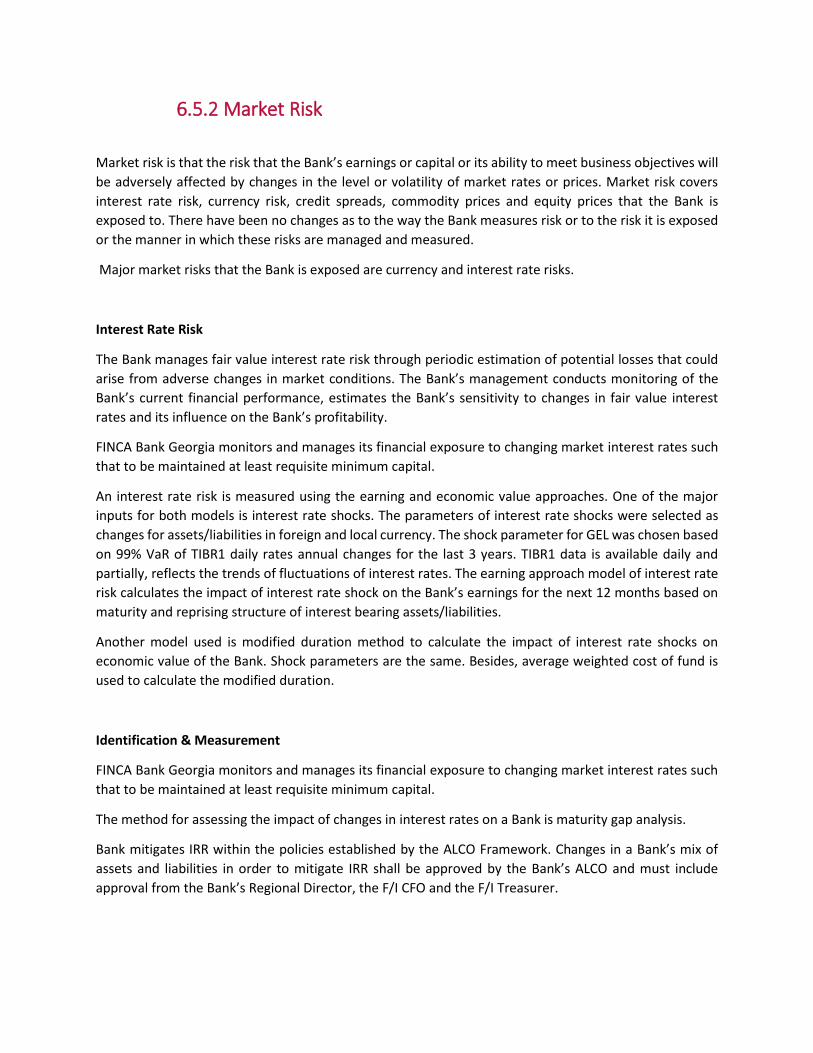
Market risk is that the risk that the Bank’s earnings or capital or its ability to meet business objectives will
be adversely affected by changes in the level or volatility of market rates or prices. Market risk covers
interest rate risk, currency risk, credit spreads, commodity prices and equity prices that the Bank is
exposed to. There have been no changes as to the way the Bank measures risk or to the risk it is exposed
or the manner in which these risks are managed and measured.
Major market risks that the Bank is exposed are currency and interest rate risks.
Interest Rate Risk
The Bank manages fair value interest rate risk through periodic estimation of potential losses that could
arise from adverse changes in market conditions. The Bank’s management conducts monitoring of the
Bank’s current financial performance, estimates the Bank’s sensitivity to changes in fair value interest
rates and its influence on the Bank’s profitability.
FINCA Bank Georgia monitors and manages its financial exposure to changing market interest rates such
that to be maintained at least requisite minimum capital.
An interest rate risk is measured using the earning and economic value approaches. One of the major
inputs for both models is interest rate shocks. The parameters of interest rate shocks were selected as
changes for assets/liabilities in foreign and local currency. The shock parameter for GEL was chosen based
on 99% VaR of TIBR1 daily rates annual changes for the last 3 years. TIBR1 data is available daily and
partially, reflects the trends of fluctuations of interest rates. The earning approach model of interest rate
risk calculates the impact of interest rate shock on the Bank’s earnings for the next 12 months based on
maturity and reprising structure of interest bearing assets/liabilities.
Another model used is modified duration method to calculate the impact of interest rate shocks on
economic value of the Bank. Shock parameters are the same. Besides, average weighted cost of fund is
used to calculate the modified duration.
Identification & Measurement
FINCA Bank Georgia monitors and manages its financial exposure to changing market interest rates such
that to be maintained at least requisite minimum capital.
The method for assessing the impact of changes in interest rates on a Bank is maturity gap analysis.
Bank mitigates IRR within the policies established by the ALCO Framework. Changes in a Bank’s mix of
assets and liabilities in order to mitigate IRR shall be approved by the Bank’s ALCO and must include
approval from the Bank’s Regional Director, the F/I CFO and the F/I Treasurer.

Currency risk
Currency risk is defined as the risk that the value of a financial instrument will fluctuate due to changes in
foreign exchange rates. The Bank is exposed to the effects of fluctuations in the prevailing foreign currency
exchange rates on its financial position and cash flows.
The Bank strives to maintain almost closed open currency position that is monitored on daily basis.
To assess the market risks, the bank has created the models for each specific risk. To measure the currency
risk, the Bank uses 99% VaR model of daily changes of GEL/USD exchange rates for last few years (covering
whole economic cycle). The results are recalculated for 30 days holding period.
Identification and measurement
In management of market risk the Bank takes into account only foreign-exchange risk.
FINCA Bank Georgia measures FX Risk as consolidated overall open foreign currency position according to
“Regulation Setting, Calculating and Maintaining Overall Open Foreign Exchange Position Limit of
Commercial Banks”.
Control & Mitigation
It is the responsibility of Treasury Department to keep the currency position close to zero at all times, and
manage OCP efficiently at low cost. Major changes in the structure of assets and liabilities denominated
in foreign currency and their impact is taken into consideration before trades are executed by Treasury.
FX risk ratios (OCP limits) set by National Bank of Georgia, ALCO as well as Bank’s lenders (whichever is
stricter) should be maintained at all times as required.
6.5.2 Liquidity Risk
Liquidity risk refers to the availability of sufficient funds to meet financial commitments associated with
financial instruments as they actually fall due. The main body in the Bank, dealing with the liquidity
management is ALCO that takes place at least monthly.
Among other issues, for liquidity management purposes, during the meetings, ALCO considers Liquidity
Schedule and forecast and funding schedule. ALCO discussions related to liquidity are resulting in:
identification of future funding need (timing, amount, currency), identification of possible liquidity
sources (direct attraction of funds from international financial institutions, using money market
instruments – interbank deposits, cross currency swaps etc.) and action plan. Besides, ALCO sets internal
limits on no loan liquidity (unrestricted Cash and Cash Equivalents) to manage the liquidity risk.
Current liquidity is managed by the Treasury Department, which deals in the money markets for current
liquidity support and cash flow optimization.

ALCO reports presented on the meeting include detailed forecast of BS, IS and Cash Flow items for the
period of at least upcoming 18 months, resulting in the precise identification of future funding needs.
Based on the current developments (evolving information), projections used in ALCO files are updated at
least monthly. During the meetings, among other issues, ALCO discusses in details following topics:
Liquidity Schedule and forecast
o Bank Cash Flows and liquidity coverage summary
o Consolidated Cash Flows and liquidity coverage
o Saving/ Deposit growth and concentration
Funding Schedule: Upcoming Transactions
o Capital Markets Conditions
o Bank liquidity Summary
o Consolidated Credit Exposure and Funding
o Investor Relations Activities
ALCO discussions related to liquidity are resulting in:
Identification of future funding need (timing, amount, currency)
Identification of possible liquidity sources (direct attraction of funds from IFIs, using
money market instruments – interbank deposits, cross currency swaps…)
Action plan (agreement on communication plan)
IFI funding
In case funds are attracted from IFIs, Bank’s CFO negotiates with each lender the funding conditions
(Bank’s treasury, reporting and financial analysis are involved as supportive functions). After terms
(amount currency, maturity, interest arte…) are agreed on the Bank’s level, ALCO and subsequently
Supervisory Board approval are required for each of the single borrowing. After mentioned approvals are
obtained, Loan agreements with respective lenders are signed and executed.

Role of Treasury
Liquidity management is one of the main functions of Bank’s Treasury Department. Besides ALCO reports,
Treasury uses separate liquidity forecasts (projected cash in/outflow), which are updated at least weekly.
Short term liquidity is generally managed through interbank money market deals, or NBG refinancing
facilities.
Long term liquidity is managed by the decisions of the ALCO.
Average Liquid Ratio 2017: 42.01% Average Liquid Ratio
The Bank further optimized the liquidity management. 2016: 53.66%
Forward looking planning
Financial indicators planning process includes liquidity planning also. It means that 5-year budget is built
such way that bank always plans to meet as regulatory liquidity requirement as internal one.
The Bank also monitors internal liquidity covenants and ensures compliance with them. The Bank manages
existing funds to finance current business operations in order to maintain sufficient level of cash and its
equivalents.

6.5.4. Operational Risk
Operational risk is the risk of loss arising from systems failure, human error, fraud or external events.
When controls fail to perform, operational risks can cause damage to reputation, have legal or regulatory
implications, or lead to financial loss. The Bank cannot expect to eliminate all operational risks, but it
endeavors to manage these risks through a control framework and by monitoring and responding to
potential risks.
The management of the operational risk lies within business units as operational risk is a part of their day
to day activities and is reflected in strategic and operational decision making. Operational Risk Unit helps
business lines to identify and manage operational risk by providing them with relevant tools and
experience.
Risk Management Committee regularly discusses the operational risk profile and development trend of
the Key Risk Indicators. The risk committee also oversees the operational risk management process across
the organization and proposes the Operational Risk policy to the Supervisory Board for approval.
Operational risk losses during the year 2017 are not material and are within risk appetite limits.
Information about historical operational losses
2017 2016 2015
Total amount of losses 96,746 83,448 168,471
Total amount of losses, exceeding GEL 10,000 61,053 32,786 34,204
Number of events with losses exceeding GEL 10,000 2 1 2
Total amount of 5 biggest losses 73,862 61,139 49,445
0
20,000
40,000
60,000
80,000
100,000
2017 2016
OPERATIONAL RISK LOSSES
Operational Risk losses Operational Risk Net losses after recoveries

Identification & Measurement
Risk maps are used to assess the risks of the existing processes and products and to determine the
adequate levels of controls. In this process, various business units, organizational functions or process
flows are mapped by risk type. This exercise reveals areas of weaknesses and helps prioritize subsequent
management actions.
Key Risk Indicators are used as an early warning signals to assess potential operational risk.
Through the Key Risk Indicators, the Bank monitors the factors which increase Operational Risk. The Risk
Indicator's report is quarterly presented to the Bank's Supervisory Board.
The Operational Risk Database is used to analyze risk losses caused by operational risks events and to plan
preventive measures in order to avoid further reoccurrence of the similar events.
To ensure that appropriate responsibility is allocated to the management, reporting and escalation of
operational risk, the Bank operates a ‘three lines of defense’ model.
For the measurement of Operational Risk Basic Indicator Approach is used.
Control and Mitigation
Mitigation of operational risk is achieved through following strategies:
Incident cause analysis – to avoid re-occurrence of the material losses, the procedure is implemented
which implies analyzing the flaws of the system and carrying out correcting activities.
Insurance – Insurance policies are used to transfer the risk of “low frequency, high severity” nature to
third party.
Adequate procedures – The Bank has policies, processes and procedures to control and mitigate material
operational risks.
Accountability and segregation of duties – assessment of the current conflicts of interest, reducing them
to the extent possible for a given staffing model and application of mitigating controls is performed on a
regular basis and before assigning any new function.
Business continuity plans – business continuity plans are used to ensure Bank’s ability to operate on an
on-going basis and limit losses in the event of severe business disruption.
Operational risk limits – limits are set on high risk transactions to minimize risk exposure on particular
products/services (such as cash limits, treasury limits and operational limits).
Operational risks - basic indicator approach
2017 2016 2015
Average of sums of net interest and
net non-interest income during
last three yearsRisk Weighted asset (RWA)
Net interest income 34,772,826 35,194,561 35,150,081
Total Non-Interest Income (673,823) (221,037) 1,364,248
less: income (loss) from selling property 31,954 (1,383) (11,756)
Total income (1+2-3) 34,067,049 34,974,908 36,526,085 35,189,347 65,980,026

6.6 Stress Testing
FINCA Bank uses stress testing to access Bank’s resilience to the external shock factors.
Stress testing is performed on the Bank level where various macro-economic scenarios are used.
Stress Testing is performed on bank’s portfolio based on the parameters provided by the National Bank
of Georgia (NBG). Stress-tests are done on enterprise-level, so covering all aspects of impact of each stress
parameters. Credit risk stress test uses number of parameters such as break down by sectors, salary loans,
national currency depreciation and devaluation of the fixed assets. For these purposes methodology of
loan selection and test description provided by NBG was used. Due to high granularity of FINCA Bank
Georgia’s portfolio, any exposure in portfolio are less than 1% of supervisory capital. Therefore, bank uses
the selection method for stress tests, in particular, loan selection and test description methodology
provided by supervisor.
If as a result of the stress test the category of the loan deteriorates the standard procedure of the
restructuring could be performed. In this case the category of the loan will be adjusted to the category
what was received during the stress tests.
For the rest of the loans (staff and consumer loans) the simplified stress testing method is used as these
kind of loans comprise only 1.1% of the total loan portfolio. In this method the default factor is also
considered. Stress is applied to the bank’s fixed assets (buildings and land) and investments in financial
and non-financial assets.
Bank conducts stress test on open currency position by stressing the Georgian Lari depreciation rate.
Additionally the Interest Risk stress testing is performed taking in to the consideration of the rate increase
on USD and GEL in the one year period.
Results of the stress tests are presented to the Risk Committee and the Management Board.
The stress tests indicate that the Bank would have high resilience in an economic downturn. Also past
experience of successfully coping with crisis confirms this.

7. Information about Remuneration
7.1 Remuneration Policy
FINCA Bank Georgia follows the FINCA Network standards of corporate governance and procedures, as
well as standards of Human Resources (HR) practices and procedures.
The Network’s overall compensation strategy is to offer total compensation that attracts the best
available talent and is competitive with the market.
FINCA Bank has developed a salary structure which includes salary grade ranges for all positions. The
salary structure is developed taking into consideration essential duties and responsibilities, local salary
survey data (if available), and relative worth for each position. The salary structure is reviewed at least
once a year.
Approval of the Subsidiary salary structure is the responsibility of the Subsidiary Supervisory Board (SB).
The budget for annual salary increases for Bank’s staff (excluding MB) is proposed based on criteria
including company performance, market research, and industry and local practices. The final budget is
approved by the Subsidiary MB and SB.
The HR Manager presents recommendations for salary increases / adjustments based on the salary
increase process set forth by the Bank.
FINCA Bank fully complies with Georgian legal requirements related to payroll administration, taxation
and immigration.
Payroll procedures are formally documented and are in compliance with local regulations and procedures.
Salary reviews shall happen once a year, in March, new salaries are processed for payment during March
payroll, if not otherwise waived by Management Board.
FINCA Georgia budget needs are to be taken into consideration when implementing annual salary reviews
along with other factors such as maintenance of market competitiveness, staff rewarding, reinforcing
desired behaviours and results, compensation and benefits practices in place.
HR Manager prepares salary survey report for all positions, total compensation and benefits
market analysis in order to evaluate market competitiveness and submits report to Management
Board by 15th of February each year
Department/Regional Managers complete salary review request form and submits to HR Manager
by 15th of February each year
HR Manager completes its part, compiles data and submits for the review to HR Committee (HR
Committee composition – Management Board and HR Manager).
Salary review requests maybe initiated not only by Structural Heads but by HR Manager and
Management Board based on results of internal and market analysis.
HR Committee reviews salary change proposals.
CEO reporting employees salary changes and reviewed by CEO and HR Manager
FINCA Subsidiaries believe in fostering long-term, client-focused relationships over the achievement of
short-term targets. As such, employee short-term incentive programs are generally not considered to be
consistent with network values. It is preferable that managers use a holistic approach to performance
management to achieve objectives which begins with supporting a positive work environment,
establishing smart goals, training, mentoring, and ongoing coaching and feedback. If a Subsidiary would
like to implement an incentive program, the program must appropriately balance the objectives of
motivating staff to meet performance requirements while supporting alignment with the core values and
the brand attributes of the organization.
All incentive programs and modifications to existing plans is pre-approved by the Global HR before being
presented to the Board for approval. Subsidiary MB incentive programs and modifications is approved by
the Executive Management Committee.
Modifications to the incentive plans is documented and communicated to the employees.
For the time being FINCA Bank is using only fixed salary system for all positions in the Bank.
Remuneration of Risk Management and Compliance Department
Remuneration of Risk Management and Compliance Department is governed by general FINCA Georgia
remuneration policy regulation. Based on market salary surveys, FINCA Georgia ensures that employees
in Risks department are remunerated competitively, based on employees job knowledge and
qualification, in order to ensure objective performance of the function.

7.2 Remuneration Tables
Remuneration awarded during 2017 were as follows:
During 2017 there were no shares under the management’s ownership, thus filling respective tables
showing detailed information on the shares owned by the senior management is not applicable. During
2017 fiscal year deferred and retained remuneration and Special payments were not applicable as well.
Board of Directors Supervisory Board Other material risk takers
Number of employees 3 5 0
Total fixed remuneration (3+5+7) 969,315 96,580 0
Of which cash-based 969,315 96,580 0
Of which: deferred 0 0 0
Of which: shares or other share-linked instruments 0 0 0
Of which deferred 0 0 0
Of which other forms 0 0 0
Of which deferred 0 0 0
Number of employees 0 0 0
Total variable remuneration (11+13+15) 0 0 0
Of which cash-based 0 0 0
Of which: deferred 0 0 0
Of which shares or other share-linked instruments 0 0 0
Of which deferred 0 0 0
Of which other forms 0 0 0
Of which deferred 0 0 0
969,315 96,580 0
Fixed remuneration
Variable
remuneration
Total remuneration

8. Appendix, which includes Tables not linked to quantitative information
BALANCE SHEET UNDER THE REGULATORY AND IFRS SCOPE 9
The following tables provides a reconciliation of the Bank’s balance sheet as at 31 December 2017 under the regulatory and International
Financial Reporting Standards (“IFRS”) scope.
Table 1: Difference between the Bank’s Assets under the regulatory and IFRS scope.
A B C D E
Assets as reported in published IFRS financial statements
Carrying values as reported in published IFRS Financial
Statements
Carrying Values per IFRS under scope of regulatory
consolidation (stand-alone)
Carrying values as reported in published stand-alone financial statements per local
accounting rules (stand-alone) Notes
Cash and cash equivalents 28,032,175 28,032,175 28,032,175 Mandatory reserve with the NBG* 18,221,518 18,221,518 18,221,518
Due from banks 979,602 979,602 979,602
Loans to customers 221,417,607 221,417,607 218,692,750 Note 1
Held to maturity investments 18,976,370 18,976,370 18,976,370
Financial assets at fair value through profit or loss 162,770 162,770 298,520
Property and equipment 3,864,363 3,864,363 3,864,363
Deferred income tax assets - - 440,966 Note 2
Intangible assets 2,363,038 2,363,038 2,363,038
Other assets 1,336,822 1,336,822 1,842,682 Note 3
Total Assets 295,354,265 295,354,265 293,711,984
‘* NBG – The National Bank of Georgia
Column (A) and (B): Break down how the amounts reported in the IFRS based audited financial statements for the year ended 31 December 2017.
Column (C): Due to the fact that the Bank does not have any subsidiaries and there is no issue for consolidation, Amounts presented in Column (C)
and (B).are the same, which shows a break down how the amounts reported in the IFRS based audited financial statements for the year ended 31
December 2017.
Column (D): Break down how the amounts reported in the regulatory Balance Sheet as at 31 December 2017.
Note 1: Based on IFRS Loans and receivables are measured at amortized cost using the effective interest method, less any impairment. Interest
income is recognized by applying the effective interest rate, except for short-term receivables when the recognition of interest would be
immaterial. The difference between regulatory and IFRS loans to customers is due to the following:

Assets classification and provisioning policy based on IFRS and regulatory requirements are different. Based on the IFRS Provisioning policy,
for loans and receivables that are assessed not to be impaired individually are assessed for impairment on a collective basis. To estimate
impairment allowance for collectively assessed pools, the Bank calculates probability of default based on historical experience and loss
given default based on write off and recovery analyses. There are five risk categories in the NBG Provisioning policy. The accounting
program automatically calculates loan loss reserve per each loan based on the overdue days, collateral, restructured status, act. As at 31
December 2017 loan loss reserve based on IFRS and NBG amounted GEL 3,672,120 and GEL 8,648,492, respectively.
Based on the regulations of the NBG accrued interest and penalty on loans to customers overdue more than 30 days should be moved to
Off-balance and excluded from interest income. In IFRS there is no such restriction, thus off-balance interest and penalty in IFRS based
financial statements are included in total exposure of the loans to customers.
Loan disbursement fee is paid by the Client totally at the time of the loan issuance. Based on the IFRS any income generated should be
allocated during the LiveCycle of the loan. Fee deferral is recorded in the NBG based financial statements on annual basis in March, after
issuance of audited report, while in IFRS adjustment is recorded in the respective reporting month. Fee deferral account on loans to
customers by nature is liability and in NBG based financial statements is included in Liabilities side.
Note 2: Deferred tax is recognized on temporary differences between the carrying amounts of assets and liabilities in the financial statements
and the corresponding tax bases used in the computation of taxable profit. Deferred tax liabilities are generally recognized for all taxable
temporary differences. Deferred tax assets are generally recognized for all deductible temporary differences to the extent that it is probable that
taxable profits will be available against which those deductible temporary differences can be utilized.
In the NBG based financial statements deferred tax is calculated based on temporary differences between the carrying amounts of assets and
liabilities in the NBG Balance sheet and the corresponding taxable Balance Sheet, while in IFRS based financial statements temporary differences
are calculated between IFRS Balance sheet and corresponding taxable Balance Sheet.
Note 3: The difference in Other Assets line is due to the Fee Deferral on Borrowed Funds and Debt Securities Issued. By Nature Fee Deferral
account of the Instrument is Asset and in the NBG based financial statements is included in Other Assets line, while in IFRS based financial
statements Fee Deferral is included in each category and amortized based on effective interest method.

Table 2: Table below shows reconciliation of Assets with standardized regulatory reporting format.
Column (1) to (12): Break down how the amounts reported in the regulatory Balance Sheet as at 31 December 2017.
2017 A D 1 2 3 5 6.1 6.2 6 7 8 10 11 12
Reconciliation with standardized regulatory reporting format
Assets as reported in published IFRS
financial statements
Carrying values as
reported in published
stand-alone financial
statements per local
accounting rules (stand-
alone)
Cas
h
Du
e f
rom
NB
G
Du
e f
rom
Ban
ks
Inve
stm
en
t Se
curi
tie
s
Tota
l Lo
ans
Less
: Lo
an L
oss
Res
erve
s
Ne
t Lo
ans
Acc
rue
d In
tere
st a
nd
Div
ide
nd
s R
ece
ivab
le
Oth
er
Re
al E
stat
e O
wn
ed
&
Re
po
sse
sse
d A
sse
ts
Fixe
d A
sse
ts a
nd
Inta
ngi
ble
A
sse
ts
Oth
er
Ass
ets
TOTA
L A
SSET
S
Cash and cash equivalents 28,032,175 12,306,040 10,137,786 5,588,121 228 28,032,175 Mandatory reserve with the NBG* 18,221,518 18,220,183 1,335 18,221,518
Due from banks 979,602 979,602 979,602
Loans to customers 218,692,750 224,278,238 (8,648,492) 215,629,746 3,063,004 218,692,750
Held to maturity investments 18,976,370 18,899,921 76,449 18,976,370 Financial assets at fair value through profit or loss 298,520 298,520 298,520
Property and equipment 3,864,363 3,864,363 3,864,363 Deferred income tax assets
440,966 440,966 440,966
Intangible assets 2,363,038 2,363,038 2,363,038
Other assets 1,842,682 204,604 1,638,078 1,842,682
Total Assets 293,711,984 12,306,040 29,337,571 5,588,121 18,899,921 224,278,238 (8,648,492) 215,629,746 3,141,016 204,604 6,227,401 2,377,564 293,711,984

Table 3: Difference between the Bank’s Liabilities under the regulatory and IFRS scope.
A B C D E
Liabilities (as reported in published IFRS financial statements)
Carrying values as reported in published IFRS Financial
Statements
Carrying Values per IFRS under scope of regulatory
consolidation (stand-alone)
Carrying values as reported in published stand-alone financial statements per local
accounting rules (stand-alone) Notes
Deposits by banks 23,625,199 23,625,199 23,625,199
Deposits by customers 97,929,163 97,929,163 97,929,163
Debt securities issued 20,141,138 20,141,138 20,166,027 Note 4
Borrowed funds 98,652,729 98,652,729 99,172,519 Note 5
Current income tax liabilities 83,650 83,650 - Note 6
Other liabilities 825,548 825,548 4,082,683 Note 7
Subordinated debt 12,552,520 12,552,520 12,552,520
Deferred income tax liabilities 490,280 490,280 - Note 8
Total Liabilities 254,300,227 254,300,227 257,528,111
Column (A) and (B): Break down how the amounts reported in the IFRS based audited financial statements for the year ended 31 December 2017.
Column (C): Due to the fact that the Bank does not have any subsidiaries and there is no issue for consolidation, Amounts presented in Column (C)
and (B).are the same, which shows a break down how the amounts reported in the IFRS based audited financial statements for the year ended 31
December 2017.
Column (D): Break down how the amounts reported in the regulatory Balance Sheet as at 31 December 2017.
Note 4: The difference is immaterial and due to the Fee Deferral of Debt Securities issued. By Nature Fee Deferral account of the Instrument is
Asset and in the NBG based financial statements is included in Other Assets line, while in IFRS based financial statements Fee Deferral is included
in each category. Please see Note 3 as well.
Note 5: The difference is due to the Fee Deferral of Borrowed Funds. By Nature Fee Deferral account of the Instrument is Asset and in the NBG
based financial statements is included in Other Assets line, while in IFRS based financial statements Fee Deferral is included in each category.
Please see Note 3 as well.
Note 6: The current tax payable is based on taxable profit for the year. Taxable profit differs from profit as reported in the statement of profit or
loss and other comprehensive income because of items of income or expense that are taxable or deductible in other years and items that are
never taxable or deductible. The Bank's liability for current tax is calculated using tax rates that have been enacted or substantively enacted by
the end of the reporting period. According to the NBG based financial statements the Bank recognized Deferred Tax Assets, thus income tax
payable is zero. Please see Note 2 as well.

Note 7: The difference is due to the Fee deferral on loans to customers, by nature the account is liability and in NBG based financial statements
is included in Liabilities side, namely in Other Liabilities line. In IFRS Based financial statements Fee Deferral on loans to customers is included in
Loans to Customers Section. Please see Note 1 as well.
Note 8: : Deferred tax is recognized on temporary differences between the carrying amounts of assets and liabilities in the financial statements
and the corresponding tax bases used in the computation of taxable profit. Deferred tax liabilities are generally recognized for all taxable
temporary differences. Deferred tax assets are generally recognized for all deductible temporary differences to the extent that it is probable that
taxable profits will be available against which those deductible temporary differences can be utilized.
In the NBG based financial statements deferred tax is calculated based on temporary differences between the carrying amounts of assets and
liabilities in the NBG Balance sheet and the corresponding taxable Balance Sheet, while in IFRS based financial statements temporary differences
are calculated between IFRS Balance sheet and corresponding taxable Balance Sheet.
Table 4: Table below shows reconciliation of Liabilities with standardized regulatory reporting format.
2017 A D 13 14 15 16 17 18 19 20 21 22
Reconciliation with standardized regulatory reporting format
Liabilities as reported in published IFRS financial
statements
Carrying values as reported in
published stand-alone financial
statements per local accounting rules
(stand-alone)
Du
e t
o B
anks
Cu
rre
nt
(Acc
ou
nts
) D
ep
osi
ts
De
man
d
De
po
sits
Tim
e D
ep
osi
ts
Ow
n D
eb
t
Secu
riti
es
Bo
rro
win
gs
Acc
rue
d In
tere
st
and
Div
ide
nd
s
Pay
able
Oth
er
Liab
iliti
es
Sub
ord
inat
ed
D
eb
en
ture
s
Tota
l Lia
bili
tie
s
Deposits by banks 23,625,199 620,880 22,990,000 14,319 23,625,199
Deposits by customers 97,929,163 6,747,722 17,013,756 72,528,131 1,639,554 97,929,163
Debt securities issued 20,166,027 20,000,000 166,027 20,166,027
Borrowed funds 99,172,519 97,874,986 1,297,533 99,172,519
Current income tax liabilities - - Other liabilities 4,082,683 4,082,683 4,082,683
Subordinated debt 12,552,520 6,451,300 398,380 5,702,840 12,552,520
Deferred income tax liabilities - -
Total Liabilities 257,528,111 620,880 6,747,722 17,013,756 72,528,131 20,000,000 127,316,286 3,515,813 4,082,683 5,702,840 257,528,111

Table 5: Difference between the Bank’s Equity under the regulatory and IFRS scope. Table also shows reconciliation of Equity with
standardized regulatory reporting format.
Column (A) and (B): Break down how the amounts reported in the IFRS based audited financial statements for the year ended 31 December 2017.
Column (C): Due to the fact that the Bank does not have any subsidiaries and there is no issue for consolidation, Amounts presented in Column (C)
and (B).are the same, which shows a break down how the amounts reported in the IFRS based audited financial statements for the year ended 31
December 2017.
Column (D): Break down how the amounts reported in the regulatory Balance Sheet as at 31 December 2017.
Note 10: Retained earnings per NBG and per IFRS is different due to the different accounting principles and procedures. For the details of each
adjustment please refer to the above indicated Notes (Note 1 – Note 8).
2017 A D 13 14 15 16 17 18
Reconciliation with standardized regulatory reporting
format
Equity (as reported in published IFRS financial
statements)
Carrying Values as reported in
published IFRS financial statements
Carrying Values per IFRS under scope of
regulatory consolidation (stand-
alone)
Carrying Values per local accounting rules under
scope of regulatory consolidation (stand-
alone)
Notes Common Stock Retained Earnings Total Equity Capital
Share capital 20,213,600 20,213,600 20,213,600 20,213,600 20,213,600
Retained earnings 20,840,438 20,840,438 15,970,272 Note 9 15,970,272 15,970,272
Total Equity 41,054,038 41,054,038 36,183,872 20,213,600 15,970,272 36,183,872

9. Appendix, 4Q 2017 Quarterly Reporting Tables

Bank: FINCA Bank Georgia JSC
Date: 31-Dec-17
Table 1 Key metrics
N 31-Dec-17 30-Sep-17 30-Jun-17 31-Mar-17 31-Dec-16
Regulatory capital (amounts, GEL)
Based on Basel III framework
1 Common Equity Tier 1 (CET1) 33,820,834 32,840,362 31,480,919 31,492,738 31,066,530
2 Tier 1 33,820,834 32,840,362 31,480,919 31,492,738 31,066,530
3 Total regulatory capital 42,001,341 41,284,796 39,925,335 34,526,606 34,192,397
Risk-weighted assets (amounts, GEL)
4 Risk-weighted assets (RWA) (Based on Basel III framework) 265,267,661 290,666,351 303,248,403 293,892,537 300,501,741
5 Risk-weighted assets (RWA) (Based on Basel I frameworks) 274,468,294 278,825,890 295,697,874 280,829,718 285,370,297
Capital ratios as a percentage of RWA
Based on Basel III framework
6 Common equity Tier 1 ratio ( ≥ 7.0 %) ** 12.75% 11.30% 10.38% 10.72% 10.34%
7 Tier 1 ratio ( ≥ 8.5 %) ** 12.75% 11.30% 10.38% 10.72% 10.34%
8 Total regulatory capital ratio ( ≥ 10.5 %) ** 15.83% 14.20% 13.17% 11.75% 11.38%
Based on Basel I framework
9 Common equity Tier 1 ratio ( ≥ 6.4 %) 11.54% 11.30% 10.61% 11.11% 11.01%
10 Total regulatory capital ratio ( ≥ 9.6 %) 15.67% 15.00% 13.71% 12.48% 12.15%
Income
11 Total Interest Income /Average Annual Assets 19.33% 19.33% 19.30% 19.17% 21.31%
12 Total Interest Expense / Average Annual Assets 7.19% 7.20% 7.13% 7.09% 7.41%
13 Earnings from Operations / Average Annual Assets 3.16% 3.16% 3.18% 3.26% 2.84%
14 Net Interest Margin 12.13% 12.12% 12.17% 12.09% 13.90%
15 Return on Average Assets (ROAA) 0.75% 0.62% 0.08% 0.41% -0.14%
16 Return on Average Equity (ROAE) 6.22% 5.17% 0.63% 3.33% -1.00%
Asset Quality
17 Non Performed Loans / Total Loans 3.74% 3.38% 3.34% 3.27% 3.22%
18 LLR/Total Loans 3.86% 3.72% 3.71% 3.70% 3.69%
19 FX Loans/Total Loans 21.98% 27.01% 30.74% 35.11% 44.10%
20 FX Assets/Total Assets 27.03% 30.22% 32.79% 38.19% 42.81%
21 Loan Growth-YTD 8.97% 7.49% 12.07% 2.66% 16.38%
Liquidity
22 Liquid Assets/Total Assets 15.54% 15.44% 13.90% 16.35% 23.98%
23 FX Liabilities/Total Liabilities 42.75% 41.25% 40.81% 44.48% 49.30%
24 Current & Demand Deposits/Total Assets 8.09% 9.73% 15.29% 18.51% 18.34%
Liquidity Coverage Ratio***
25 Total HQLA 38,507,032
26 Net cash outflow 10,737,894
27 LCR ratio (%) 358.61%
* Significant changes between these two reporting periods is due to changes in NBG's methodology of
calculating Risk Weighted Risk Exposures, in particular excluding Currency induced credit risk (CICR) from
RWRA, which will be reflected in Pillar 2 capital buffer requirements. For the further details see the link of
NBG's official press-release:
https://www.nbg.gov.ge/index.php?m=340&newsid=3248&lng=eng
** These includes Minimum capital requirements (4.5%, 6%, 8%) and Capital Conservation Buffer (2.5%)
according to article 8 of the regulation on Capital Adequacy Requirements for Commercial Banks.
*** LCR calculated according to NBG's methodology which is more focused on local risks than Basel
framework. See the table 14. LCR; Commercial banks are required to comply with the limits by coefficients
calculated according to NBG's methodology. The numbers calculated within Basel framework are given for
illustratory purposes.

Bank: FINCA Bank Georgia JSC
Date: 31-Dec-17
Table 2 Balance Sheet in Lari
N Assets GEL FX Total GEL FX Total
1 Cash 5,180,357 7,125,683 12,306,040 5,885,414 7,282,677 13,168,091
2 Due from NBG 9,483,447 19,854,124 29,337,571 10,987,698 19,384,781 30,372,478
3 Due from Banks 265,632 5,322,489 5,588,121 16,383 4,335,686 4,352,070
4 Dealing Securities 0 0 0 0 0 0
5 Investment Securities 18,899,921 0 18,899,921 19,191,492 0 19,191,492
6.1 Loans 174,988,103 49,290,135 224,278,238 115,055,004 90,769,693 205,824,697
6.2 Less: Loan Loss Reserves -5,833,711 -2,814,781 -8,648,492 -4,017,888 -3,568,488 -7,586,376
6 Net Loans 169,154,392 46,475,354 215,629,746 111,037,116 87,201,205 198,238,321
7 Accrued Interest and Dividends Receivable 2,733,130 407,886 3,141,016 2,124,162 807,587 2,931,750
8 Other Real Estate Owned & Repossessed Assets 204,604 0 204,604 169,945 0 169,945
9 Equity Investments 0 0 0 0 0 0
10 Fixed Assets and Intangible Assets 6,227,401 0 6,227,401 7,133,022 0 7,133,022
11 Other Assets 2,178,135 199,430 2,377,565 2,576,745 94,020 2,670,765
12 Total assets 214,327,018 79,384,965 293,711,984 159,121,978 119,105,956 278,227,934
Liabilities
13 Due to Banks 0 620,880 620,880 0 0 0
14 Current (Accounts) Deposits 5,088,290 1,659,432 6,747,722 17,249,097 1,857,568 19,106,665
15 Demand Deposits 7,684,996 9,328,759 17,013,756 23,113,060 8,796,383 31,909,443
16 Time Deposits 38,607,143 33,920,988 72,528,131 17,272,881 30,229,030 47,501,911
17 Own Debt Securities 20,000,000 0 20,000,000 20,000,000 0 20,000,000
18 Borrowings 70,063,229 57,253,057 127,316,286 40,786,515 77,286,560 118,073,075
19 Accrued Interest and Dividends Payable 2,161,980 1,353,834 3,515,814 1,575,822 1,544,057 3,119,879
20 Other Liabilities 3,836,314 246,368 4,082,683 3,756,634 599,123 4,355,757
21 Subordinated Debentures 0 5,702,840 5,702,840 0 0 0
22 Total liabilities 147,441,952 110,086,159 257,528,112 123,754,010 120,312,721 244,066,731
Equity Capital
23 Common Stock 20,213,600 0 20,213,600 20,213,600 0 20,213,600
24 Preferred Stock 0 0 0 0 0 0
25 Less: Repurchased Shares 0 0 0 0 0 0
26 Share Premium 0 0 0 0 0 0
27 General Reserves 0 0 0 0 0 0
28 Retained Earnings 15,970,272 0 15,970,272 13,947,604 0 13,947,604
29 Asset Revaluation Reserves 0 0 0 0 0 0
30 Total Equity Capital 36,183,872 0 36,183,872 34,161,204 0 34,161,204
31 Total liabilities and Equity Capital 183,625,825 110,086,159 293,711,984 157,915,214 120,312,721 278,227,934
Reporting Period Respective period of the previous year
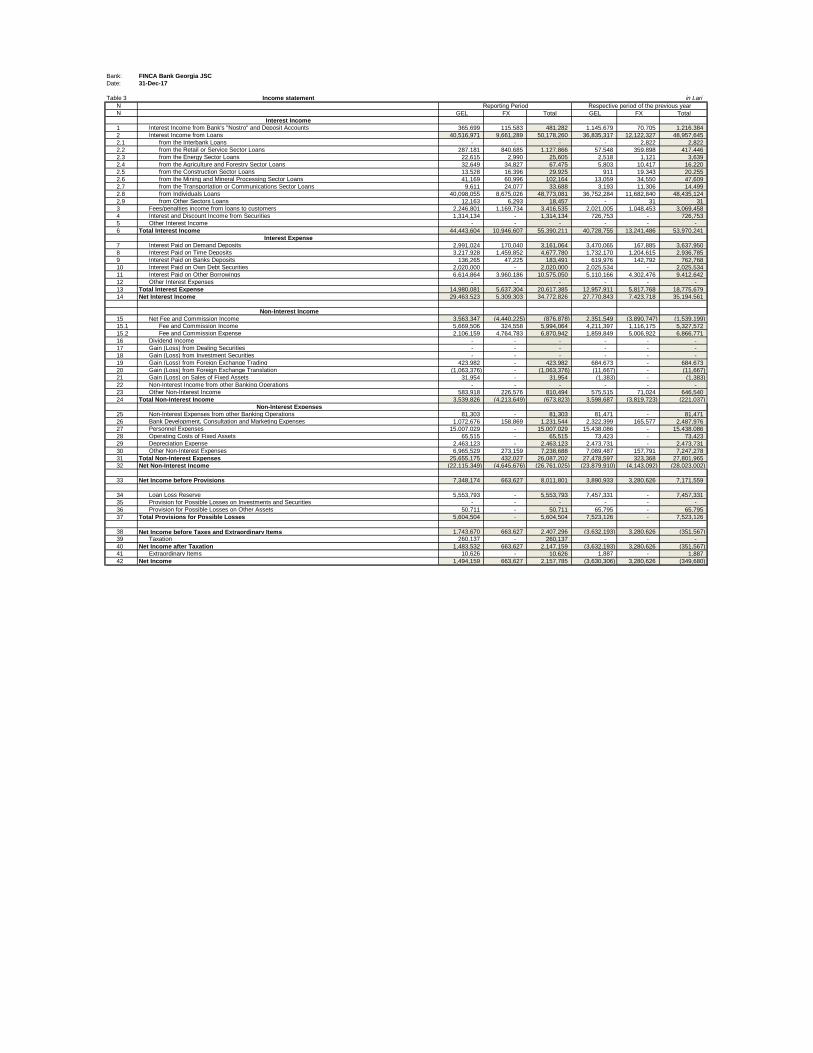
Bank: FINCA Bank Georgia JSC
Date: 31-Dec-17
Table 3 Income statement in Lari
N
N GEL FX Total GEL FX Total
Interest Income
1 Interest Income from Bank's "Nostro" and Deposit Accounts 365,699 115,583 481,282 1,145,679 70,705 1,216,384
2 Interest Income from Loans 40,516,971 9,661,289 50,178,260 36,835,317 12,122,327 48,957,645
2.1 from the Interbank Loans - - - - 2,822 2,822
2.2 from the Retail or Service Sector Loans 287,181 840,685 1,127,866 57,548 359,898 417,446
2.3 from the Energy Sector Loans 22,615 2,990 25,605 2,518 1,121 3,639
2.4 from the Agriculture and Forestry Sector Loans 32,649 34,827 67,475 5,803 10,417 16,220
2.5 from the Construction Sector Loans 13,528 16,396 29,925 911 19,343 20,255
2.6 from the Mining and Mineral Processing Sector Loans 41,169 60,996 102,164 13,059 34,550 47,609
2.7 from the Transportation or Communications Sector Loans 9,611 24,077 33,688 3,193 11,306 14,499
2.8 from Individuals Loans 40,098,055 8,675,026 48,773,081 36,752,284 11,682,840 48,435,124
2.9 from Other Sectors Loans 12,163 6,293 18,457 - 31 31
3 Fees/penalties income from loans to customers 2,246,801 1,169,734 3,416,535 2,021,005 1,048,453 3,069,458
4 Interest and Discount Income from Securities 1,314,134 - 1,314,134 726,753 - 726,753
5 Other Interest Income - - - - - -
6 Total Interest Income 44,443,604 10,946,607 55,390,211 40,728,755 13,241,486 53,970,241
Interest Expense
7 Interest Paid on Demand Deposits 2,991,024 170,040 3,161,064 3,470,065 167,885 3,637,950
8 Interest Paid on Time Deposits 3,217,928 1,459,852 4,677,780 1,732,170 1,204,615 2,936,785
9 Interest Paid on Banks Deposits 136,265 47,225 183,491 619,976 142,792 762,768
10 Interest Paid on Own Debt Securities 2,020,000 - 2,020,000 2,025,534 - 2,025,534
11 Interest Paid on Other Borrowings 6,614,864 3,960,186 10,575,050 5,110,166 4,302,476 9,412,642
12 Other Interest Expenses - - - - - -
13 Total Interest Expense 14,980,081 5,637,304 20,617,385 12,957,911 5,817,768 18,775,679
14 Net Interest Income 29,463,523 5,309,303 34,772,826 27,770,843 7,423,718 35,194,561
Non-Interest Income
15 Net Fee and Commission Income 3,563,347 (4,440,225) (876,878) 2,351,549 (3,890,747) (1,539,199)
15.1 Fee and Commission Income 5,669,506 324,558 5,994,064 4,211,397 1,116,175 5,327,572
15.2 Fee and Commission Expense 2,106,159 4,764,783 6,870,942 1,859,849 5,006,922 6,866,771
16 Dividend Income - - - - - -
17 Gain (Loss) from Dealing Securities - - - - - -
18 Gain (Loss) from Investment Securities - - - - - -
19 Gain (Loss) from Foreign Exchange Trading 423,982 - 423,982 684,673 - 684,673
20 Gain (Loss) from Foreign Exchange Translation (1,063,376) - (1,063,376) (11,667) - (11,667)
21 Gain (Loss) on Sales of Fixed Assets 31,954 - 31,954 (1,383) - (1,383)
22 Non-Interest Income from other Banking Operations - - - - - -
23 Other Non-Interest Income 583,918 226,576 810,494 575,515 71,024 646,540
24 Total Non-Interest Income 3,539,826 (4,213,649) (673,823) 3,598,687 (3,819,723) (221,037)
Non-Interest Expenses
25 Non-Interest Expenses from other Banking Operations 81,303 - 81,303 81,471 - 81,471
26 Bank Development, Consultation and Marketing Expenses 1,072,676 158,869 1,231,544 2,322,399 165,577 2,487,976
27 Personnel Expenses 15,007,029 - 15,007,029 15,438,086 - 15,438,086
28 Operating Costs of Fixed Assets 65,515 - 65,515 73,423 - 73,423
29 Depreciation Expense 2,463,123 - 2,463,123 2,473,731 - 2,473,731
30 Other Non-Interest Expenses 6,965,529 273,159 7,238,688 7,089,487 157,791 7,247,278
31 Total Non-Interest Expenses 25,655,175 432,027 26,087,202 27,478,597 323,368 27,801,965
32 Net Non-Interest Income (22,115,349) (4,645,676) (26,761,025) (23,879,910) (4,143,092) (28,023,002)
33 Net Income before Provisions 7,348,174 663,627 8,011,801 3,890,933 3,280,626 7,171,559
34 Loan Loss Reserve 5,553,793 - 5,553,793 7,457,331 - 7,457,331
35 Provision for Possible Losses on Investments and Securities - - - - - -
36 Provision for Possible Losses on Other Assets 50,711 - 50,711 65,795 - 65,795
37 Total Provisions for Possible Losses 5,604,504 - 5,604,504 7,523,126 - 7,523,126
38 Net Income before Taxes and Extraordinary Items 1,743,670 663,627 2,407,296 (3,632,193) 3,280,626 (351,567)
39 Taxation 260,137 - 260,137 - - -
40 Net Income after Taxation 1,483,532 663,627 2,147,159 (3,632,193) 3,280,626 (351,567)
41 Extraordinary Items 10,626 - 10,626 1,887 - 1,887
42 Net Income 1,494,159 663,627 2,157,785 (3,630,306) 3,280,626 (349,680)
Reporting Period Respective period of the previous year

Bank: FINCA Bank Georgia JSC
Date: 31-Dec-17
Table 4 in Lari
GEL FX Total GEL FX Total
1 Contingent Liabilities and Commitments 551,287 62,710 613,997 317,966 196,386 514,352
1.1 Guarantees Issued 0 0 0 0 0 0
1.2 Letters of credit Issued 0 0 0 0 0 0
1.3 Undrawn loan commitments 551,287 62,710 613,997 317,966 196,386 514,352
1.4 Other Contingent Liabilities 0 0 0 0 0 0
2 Guarantees received as security for liabilities of the bank0 0 0 0 0 0
3 Assets pledged as security for liabilities of the bank 24,214,000 979,602 25,193,602 0 0 0
3.1 Financial assets of the bank 24,214,000 979,602 25,193,602 0 0 0
3.2 Non-financial assets of the bank 0 0 0 0 0 0
4 Guaratees received as security for receivables of the bank 421,514,441 170,506,430 592,020,871 198,558,956 223,256,682 421,815,639
4.1 Surety, joint liability 421,514,441 170,506,430 592,020,871 198,558,956 223,256,682 421,815,639
4.2 Guarantees 0 0 0 0 0 0
5 Assets pledged as security for receivables of the bank 38,791,537 87,696,761 126,488,299 13,970,462 95,368,734 109,339,196
5.1 Cash 343,908 41,493 385,401 20,967 173,389 194,355
5.2 Precious metals and stones 0 0 0 0 0 0
5.3 Real Estate: 38,239,030 87,340,316 125,579,346 13,899,995 94,743,317 108,643,312
5.3.1 Residential Property 30,760,604 65,140,952 95,901,556 10,327,254 71,784,530 82,111,784
5.3.2 Commercial Property 2,470,435 11,658,751 14,129,186 1,494,395 11,656,446 13,150,841
5.3.3 Complex Real Estate 0 0 0 0 0 0
5.3.4 Land Parcel 4,796,943 9,786,549 14,583,492 2,068,346 10,346,779 12,415,125
5.3.5 Other 211,048 754,063 965,111 10,000 955,561 965,561
5.4 Movable Property 208,600 314,952 523,552 49,500 452,028 501,528
5.5 Shares Pledged 0 0 0 0 0 0
5.6 Securities 0 0 0 0 0 0
5.7 Other 0 0 0 0 0 0
6 Derivatives 162,770 0 162,770 0 0 0
6.1 Receivables through FX contracts (except options) 32,110,100 0 32,110,100 0 0 0
6.2 Payables through FX contracts (except options) -31,947,330 0 -31,947,330 0 0 0
6.3 Principal of interest rate contracts (except options) 0 0 0 0 0 0
6.4 Options sold 0 0 0 0 0 0
6.5 Options purchased 0 0 0 0 0 0
6.6 Nominal value of potential receivables through other derivatives 0 0 0 0 0 0
6.7 Nominal value of potential payables through other derivatives 0 0 0 0 0 0
7 Receivables not recognized on-balance 15,684,020 9,533,863 25,217,884 12,106,737 8,312,920 20,419,657
7.1 Principal of receivables derecognized during last 3 month 925,876 300,758 1,226,635 933,299 706,372 1,639,670
7.2 Interest and penalty receivable not recognized on-balance or derecognized during last
3 month 314,760 68,538 383,298 301,312 101,250 402,562
7.3 Principal of receivables derecognized during 5 years month (including last 3 month)12,276,260 8,080,292 20,356,552 9,465,613 6,961,968 16,427,581
7.4 Interest and penalty receivable not recognized on-balance or derecognized during last
5 years (including last 3 month) 3,407,760 1,453,572 4,861,332 2,641,124 1,350,952 3,992,076
8 Non-cancelable operating lease 996,084 2,969,656 3,965,740 157,796 4,350,386 4,508,183
8.1 Through indefinit term agreement 996,084 1,880,932 2,877,016 157,796 2,571,737 2,729,533
8.2 Within one year 653,234 653,234 666,994 666,994
8.3 From 1 to 2 years 435,490 435,490 666,994 666,994
8.4 From 2 to 3 years 0 444,662 444,662
8.5 From 3 to 4 years 0 0
8.6 From 4 to 5 years 0 0
8.7 More than 5 years 0 0
9 Capital expenditure commitment 0 0
N On-balance sheet items per standardized regulatory report Reporting Period Respective period of the previous year

Bank: FINCA Bank Georgia JSC
Date: 31-Dec-17
Table 5 Risk Weighted Assets in Lari
N 31-Dec-17 30-Sep-17
1 Risk Weighted Assets for Credit Risk 198,137,337 239,655,536
1.1 Balance sheet items 196,457,660 194,761,952
1.1.1 Including: amounts below the thresholds for deduction (subject to 250% risk weight) 440,966 580,865
1.2 Off-balance sheet items 228,045 302,930
1.3 Currency induced credit risk* 44,060,641
1.4 Counterparty credit risk 1,451,632 530,014
2 Risk Weighted Assets for Market Risk 1,150,297 1,003,251
3 Risk Weighted Assets for Operational Risk 65,980,026 50,007,563
4 Total Risk Weighted Assets 265,267,661 290,666,351
* CICR is excluded from RWA due to changes in NBG's methodology of calculating Risk Weighted Risk Exposures, in
particular excluding Currency induced credit risk (CICR) from RWRA, which will be reflected in Pillar 2 capital buffer
requirements. For the further details see the link of NBG's official press-release:
https://www.nbg.gov.ge/index.php?m=340&newsid=3248&lng=eng

Bank: FINCA Bank Georgia JSC
Date: 31-Dec-17
Table 6 Information about supervisory board, directorate, beneficiary owners and shareholders
1 Florin Lila (Chairman)
2 Dane Steven McGuire
3 Olga Tomash
4 Volker Renner
5 Paul Russell Clark
1 Vusal Verdiyev, CEO
2 Giorgi Mirotadze, CFO
3 Giorgi Samadashvili, COO
1 FINCA Microfinance Coöperatief U.A. (Netherlands) 100%
1 FINCA Microfinance Holding Company LLC (Delaware, USA) 99 Voting right of FINCA Microfinance Coöperatief U.A.
2 FINCA International, Inc (New York, USA) 62.93% of FINCA Microfinance Holding Company LLC (Delaware, USA)
3 International Finance Corporation (IFC) 14.27% of FINCA Microfinance Holding Company LLC (Delaware, USA)
4 KfW 8.87% of FINCA Microfinance Holding Company LLC (Delaware, USA)
5 FMO (Nederlandse Financierings Maatschappij voor Ontwikkelingslanden N.V) 7.25% of FINCA Microfinance Holding Company LLC (Delaware, USA)
Members of Supervisory Board
Members of Board of Directors
List of bank beneficiaries indicating names of direct or indirect holders of 5% or more of shares
List of Shareholders owning 1% and more of issued capital, indicating Shares

Bank: FINCA Bank Georgia JSC
Date: 31-Dec-17
Table 7
a b c
Not subject to capital
requirements or subject
to deduction from capital
Subject to credit risk
weighting
1 Cash 12,306,040 12,306,040
2 Due from NBG 29,337,571 29,337,571
3 Due from Banks 5,588,121 5,588,121
4 Dealing Securities 0 0
5 Investment Securities 18,899,921 18,899,921
6.1 Loans 224,278,238 224,278,238
6.2 Less: Loan Loss Reserves -8,648,492 -8,648,492
6 Net Loans 215,629,746 215,629,746
7 Accrued Interest and Dividends Receivable 3,141,016 3,141,016
8 Other Real Estate Owned & Repossessed Assets 204,604 204,604
9 Equity Investments 0 0
10 Fixed Assets and Intangible Assets 6,227,401 2,363,038 3,864,363
11 Other Assets 2,377,565 2,377,565
Total exposures subject to credit risk weighting before
adjustments293,711,984 2,363,038 291,348,946
Account name of standardazed supervisory balance
sheet item
Carrying values as reported in
published stand-alone financial
statements per local accounting
rules
Carrying values of items
Linkages between financial statement assets and balance sheet items subject to credit risk weighting

Bank: FINCA Bank Georgia JSC
Date: 31-Dec-17
Table 8 Differences between carrying values per standardized balance sheet used for regulatory reporting purposes and the exposure amounts used for capital adequacy calculation purposesin Lari
1 Total carrying value of balance sheet items subject to credit risk weighting before adjustments 291,348,946
2.1 Nominal values of off-balance sheet items subject to credit risk weighting 613,997
2.2 Nominal values of off-balance sheet items subject to counterparty credit risk weighting 29,032,640
3Total nominal values of on-balance and off-balance sheet items before any adjustments used for credit risk weighting purposes
320,995,582
4 Effect of provisioning rules used for capital adequacy purposes 4,202,814
5.1 Effect of credit conversion factor of off-balance sheet items related to credit risk framework -309,936
5.2 Effect of credit conversion factor of off-balance sheet items related to counterparty credit risk framework (table CCR) -27,581,008
6 Effect of other adjustments 0
7 Total exposures subject to credit risk weighting 297,307,452

Bank: FINCA Bank Georgia JSC
Date: 31-Dec-17
Table 9 Regulatory capital
N in Lari
1 Common Equity Tier 1 capital before regulatory adjustments 36,183,8722 Common shares that comply with the criteria for Common Equity Tier 1 20,213,6003 Stock surplus (share premium) of common share that meets the criteria of Common Equity Tier 1 04 Accumulated other comprehensive income 05 Other disclosed reserves 06 Retained earnings (loss) 15,970,2727 Regulatory Adjustments of Common Equity Tier 1 capital 2,363,038
8 Revaluation reserves on assets 0
9Accumulated unrealized revaluation gains on assets through profit and loss to the extent that they exceed accumulated unrealized revaluation losses through profit and
loss
0
10 Intangible assets 2,363,038
11 Shortfall of the stock of provisions to the provisions based on the Asset Classification 0
12 Investments in own shares 0
13 Reciprocal cross holdings in the capital of commercial banks, insurance entities and other financial institutions 0
14 Cash flow hedge reserve 0
15 Deferred tax assets not subject to the threshold deduction (net of related tax liability) 0
16Significant investments in the common equity tier 1 capital (that are not common shares) of commercial banks, insurance entities and other financial institutions that are
outside the scope of regulatory consolidation
0
17 Holdings of equity and other participations constituting more than 10% of the share capital of other commercial entities 0
18 Significant investments in the common shares of commercial banks, insurance entities and other financial institutions (amount above 10% limit) 0
19Investments in the capital of commercial banks, insurance entities and other financial institutions where the bank does not own more than 10% of the issued share
capital (amount above 10% limit)
0
20 Deferred tax assets arising from temporary differences (amount above 10% threshold, net of related tax liability) 0
21 The amount of significant Investments and Deferred Tax Assets which exceed 15% of common equity tier 1 0
22 Regulatory adjustments applied to Common Equity Tier 1 resulting from shortfall of Tier 1 and Tier 2 capital to deduct investments 0
23 Common Equity Tier 1 33,820,834
24 Additional tier 1 capital before regulatory adjustments 0
25 Instruments that comply with the criteria for Additional tier 1 capital 0
26 Including:instruments classified as equity under the relevant accounting standards 0
27 Including: instruments classified as liabilities under the relevant accounting standards 0
28 Stock surplus (share premium) that meet the criteria for Additional Tier 1 capital 0
29 Regulatory Adjustments of Additional Tier 1 capital 0
30 Investments in own Additional Tier 1 instruments 0
31 Reciprocal cross-holdings in Additional Tier 1 instruments 0
32 Significant investments in the Additional Tier 1 capital (that are not common shares) of commercial banks, insurance entities and other financial institutions0
33Investments in the capital of commercial banks, insurance entities and other financial institutions where the bank does not own more than 10% of the issued share
capital (amount above 10% limit)
0
34 Regulatory adjustments applied to Additional Tier 1 resulting from shortfall of Tier 2 capital to deduct investments 0
35 Additional Tier 1 Capital 0
36 Tier 2 capital before regulatory adjustments 8,180,507
37 Instruments that comply with the criteria for Tier 2 capital 5,702,840
38 Stock surplus (share premium) that meet the criteria for Tier 2 capital 0
39 General reserves, limited to a maximum of 1.25% of the bank’s credit risk-weighted exposures 2,477,667
40 Regulatory Adjustments of Tier 2 Capital 0
41 Investments in own shares that meet the criteria for Tier 2 capital 0
42 Reciprocal cross-holdings in Tier 2 capital 0
43 Significant investments in the Tier 2 capital (that are not common shares) of commercial banks, insurance entities and other financial institutions 0
44Investments in the capital of commercial banks, insurance entities and other financial institutions where the bank does not own more than 10% of the issued share
capital (amount above 10% limit)
0
45 Tier 2 Capital 8,180,507

Bank: FINCA Bank Georgia JSC
Date: 31-Dec-17
Table 10 Reconcilation of balance sheet to regulatory capital in Lari
N On-balance sheet items per standardized regulatory report Carrying values as reported in published stand-alone financial
statements per local accounting ruleslinkage to capital table
1 Cash 12,306,040
2 Due from NBG 29,337,571
3 Due from Banks 5,588,121
4 Dealing Securities 0
5 Investment Securities 18,899,921
6.1 Loans 224,278,238
6.2 Less: Loan Loss Reserves -8,648,492
6.2.1 Special Reserve -2,477,667 table 9 (Capital), N40
6 Net Loans 215,629,746
7 Accrued Interest and Dividends Receivable 3,141,016
8 Other Real Estate Owned & Repossessed Assets 204,604
9 Equity Investments 0
9.1 Of which above 10% equity holdings in financial institutions 0
9.2 Of which significant investments subject to limited recognition 0
9.3 Of which below 10% equity holdings subject to limited recognition 0
10 Fixed Assets and Intangible Assets 6,227,401
10.1 Of which intangible assets -2,363,038 table 9 (Capital), N10
11 Other Assets 2,377,565
12 Total assets 293,711,984
13 Due to Banks 620,880
14 Current (Accounts) Deposits 6,747,722
15 Demand Deposits 17,013,756
16 Time Deposits 72,528,131
17 Own Debt Securities 20,000,000
18 Borrowings 127,316,286
19 Accrued Interest and Dividends Payable 3,515,814
20 Other Liabilities 4,082,683
21 Subordinated Debentures 5,702,840
21.1 Of which tier II capital qualifying instruments 5,702,840 table 9 (Capital), N37
22 Total liabilities 257,528,112
23 Common Stock 20,213,600 table 9 (Capital), N2
24 Preferred Stock 0
25 Less: Repurchased Shares 0
26 Share Premium 0
27 General Reserves 0
28 Retained Earnings 15,970,272 table 9 (Capital), N36
29 Asset Revaluation Reserves 0
30 Total Equity Capital 36,183,872

Bank: FINCA Bank Georgia JSC
Date: 31-Dec-17
Table 11
Credit Risk Weighted Exposures
(On-balance items and off-balance items after credit conversion factor)
a b c d e f g h i j k l m n o p q
On-balance
sheet amount
Off-balance sheet
amount
On-balance
sheet amount
Off-balance sheet
amount
On-balance
sheet amount
Off-balance
sheet amount
On-balance
sheet amount
Off-balance
sheet amount
On-balance
sheet amount
Off-balance
sheet amount
On-balance
sheet amount
Off-balance
sheet amount
On-balance
sheet amount
Off-balance
sheet amount
On-balance
sheet amount
Off-balance
sheet amount
1 Claims or contingent claims on central governments or central banks 28,459,817 - 981,165 - - - - - - - 18,874,522 - - - - - 19,070,755
2 Claims or contingent claims on regional governments or local authorities - - - - - - - - - - - - - - - - -
3 Claims or contingent claims on public sector entities - - - - - - - - - - - - - - - - -
4 Claims or contingent claims on multilateral development banks - - - - - - - - - - - - - - - - -
5 Claims or contingent claims on international organizations/institutions - - - - - - - - - - - - - - - - -
6 Claims or contingent claims on commercial banks - - - - - - 5,588,121 - - - - - - - - - 2,794,060
7 Claims or contingent claims on corporates - - - - - - - - - - - - - - - - -
8 Retail claims or contingent retail claims - - - - - - - - 221,771,879 304,060 - - 64,542 - - - 166,653,768
9 Claims or contingent claims secured by mortgages on residential property - - - - - - - - - - - - - - - - -
10 Past due items - - - - - - - - - - 1,021,019 - - - - - 1,021,019
11 Items belonging to regulatory high-risk categories - - - - - - - - - - - - - - - - -
12 Short-term claims on commercial banks and corporates - - - - - - - - - - - - - - - - -
13 Claims in the form of collective investment undertakings (‘CIU’) - - - - - - - - - - - - - - - - -
14 Other items 12,306,040 - - - - - - - - - 6,043,689 - - - 440,966 - 7,146,103
Total 40,765,857 0 981,165 0 0 0 5,588,121 0 221,771,879 304,060 25,939,230 0 64,542 0 440,966 0 196,685,705
100% 150% 250%Risk Weighted Exposures before
Credit Risk Mitigation
Risk weights
Exposure classes
0% 20% 35% 50% 75%

Bank: FINCA Bank Georgia JSC
Date: 31-Dec-17
Table 13 Standardized approach - Effect of credit risk mitigation
a b c d e f
Off-balance sheet
exposures -
Nominal value
Off-balance sheet
exposures post CCF
1 Claims or contingent claims on central governments or central banks 48,315,504 0 0 19,070,755 19,070,755 39.47%
2 Claims or contingent claims on regional governments or local authorities 0 0 0 0 0 0.00%3 Claims or contingent claims on public sector entities 0 0 0 0 0 0.00%4 Claims or contingent claims on multilateral development banks 0 0 0 0 0 0.00%5 Claims or contingent claims on international organizations/institutions 0 0 0 0 0 0.00%6 Claims or contingent claims on commercial banks 5,588,121 0 0 2,794,060 2,794,060 50.00%7 Claims or contingent claims on corporates 0 0 0 0 0 0.00%8 Retail claims or contingent retail claims 221,836,421 613,997 304,060 166,653,768 166,653,768 75.02%9 Claims or contingent claims secured by mortgages on residential property 0 0 0 0 0 0.00%
10 Past due items 1,021,019 0 0 1,021,019 1,021,019 100.00%11 Items belonging to regulatory high-risk categories 0 0 0 0 0 0.00%12 Short-term claims on commercial banks and corporates 0 0 0 0 0 0.00%13 Claims in the form of collective investment undertakings (‘CIU’) 0 0 0 0 0 0.00%14 Other items 18,790,694 0 0 7,146,103 7,146,103 38.03%
Total 295,551,759 613,997 304,060 196,685,705 196,685,705 66.48%
RWA Density
f=e/(a+c)
Asset Classes
On-balance sheet
exposures
Off-balance sheet exposuresRWA before Credit
Risk Mitigation
RWA post Credit Risk
Mitigation

Bank: FINCA Bank Georgia JSC
Date: 31-Dec-17
Table 14 Liquidity Coverage Ratio
GEL FX Total GEL FX Total GEL FX Total High-quality liquid assets
1 Total HQLA 12,049,550 26,457,482 38,507,032 11,783,918 25,853,624 37,637,542
Cash outflows
2 Retail deposits 18,331,673 37,458,843 55,790,517 2,525,366 5,695,597 8,220,963 469,169 1,470,372 1,939,541 3 Unsecured wholesale funding 100,121,985 71,027,113 171,149,098 2,920,730 4,369,129 7,289,859 512,418 364,039 876,457
4 Secured wholesale funding 22,990,000 - 22,990,000 - - - - - -
5 Outflows related to off-balance sheet obligations and net short position of derivative exposures 93,601 7,311 100,912 18,755 1,464 20,219 4,715 367 5,082
6 Other contractual funding obligations - - - - - - - - -
7 Other contingent funding obligations 5,437,487 1,601,345 7,038,832 986,541 120,979 1,107,520 3,042,738 4,346,204 7,388,942 8 TOTAL CASH OUTFLOWS 146,974,746 110,094,613 257,069,359 6,451,393 10,187,169 16,638,562 4,029,040 6,180,982 10,210,022
Cash inflows
9 Secured lending (eg reverse repos) - - - - - - - - -
10 Inflows from fully performing exposures 165,836,515 46,789,441 212,625,956 4,993,803 906,865 5,900,668 5,259,435 6,229,354 11,488,789
11 Other cash inflows 841,052 203,499 1,044,551 - - - - - -
12 TOTAL CASH INFLOWS 166,677,567 46,992,940 213,670,507 4,993,803 906,865 5,900,668 5,259,435 6,229,354 11,488,789
13 Total HQLA 12,049,550 26,457,482 38,507,032 11,783,918 25,853,624 37,637,542
14 Net cash outflow 1,612,848 9,280,304 10,737,894 1,007,260 1,545,246 2,552,506
15 Liquidity coverage ratio (%) 747.10% 285.09% 358.61% 1169.90% 1673.11% 1474.53%
* Commercial banks are required to comply with the limits by coefficients calculated according to NBG's methodology. The numbers
calculated within Basel framework are given for illustratory purposes.
** Instead of daily average, values are given for the last day of reporting period
Total unweighted value (daily average**)Total weighted values according to NBG's
methodology* (daily average**)
Total weighted values according to Basel
methodology (daily average**)
Total value according to NBG's methodology* (with
limits)
Total value according to Basel methodology (with
limits)

Bank: FINCA Bank Georgia JSC
Date: 31-Dec-17
Table 15 Counterparty credit risk
a b c d e f g h i j k l
Nominal amount Percentage Exposure value 0% 20% 35% 50% 75% 100% 150% 250%Counterparty Credit Risk Weighted
Exposures
1 FX contracts 29,032,640 1,451,632 0 0 0 0 0 1,451,632 0 0 1,451,632
1.1 Maturity less than 1 year 0 2.0% 0 0
1.2 Maturity from 1 year up to 2 years 29,032,640 5.0% 1,451,632 1,451,632 1,451,632
1.3 Maturity from 2 years up to 3 years 0 8.0% 0 0
1.4 Maturity from 3 years up to 4 years 0 11.0% 0 0
1.5 Maturity from 4 years up to 5 years 0 14.0% 0 0
1.6 Maturity over 5 years 0 0
2 Interest rate contracts 0 0 0 0 0 0 0 0 0 0 0
2.1 Maturity less than 1 year 0.5% 0 0
2.2 Maturity from 1 year up to 2 years 1.0% 0 0
2.3 Maturity from 2 years up to 3 years 2.0% 0 0
2.4 Maturity from 3 years up to 4 years 3.0% 0 0
2.5 Maturity from 4 years up to 5 years 4.0% 0 0
2.6 Maturity over 5 years 0
Total 29,032,640 1,451,632 0 0 0 0 0 1,451,632 0 0 1,451,632