J.P. Morgan 2021 Homebuilding Products Conference John ...
18
J.P. Morgan 2021 Homebuilding Products Conference John Sznewajs, Chief Financial Officer May 2021
Transcript of J.P. Morgan 2021 Homebuilding Products Conference John ...

J.P. Morgan 2021 Homebuilding Products Conference
John Sznewajs, Chief Financial Officer
May 2021

2
Safe Harbor Statement
This presentation contains statements that reflect our views about our future performance and constitute “forward-looking statements” under the Private Securities Litigation Reform Act of 1995. Forward-looking statements can be identified by words such as “outlook,” “believe,” “anticipate,” “appear,” “may,” “will,” “should,” “intend,” “plan,” “estimate,” “expect,” “assume,” “seek,” “forecast,” and similar references to future periods. Our views about future performance involve risks and uncertainties that are difficult to predict and, accordingly, our actual results may differ materially from the results discussed in our forward-looking statements. We caution you against relying on any of these forward-looking statements.
Our future performance may be affected by the levels of residential repair and remodel activity, and to a lesser extent, new home construction, our ability to maintain our strong brands and reputation and to develop innovative products, our ability to maintain our competitive position in our industries, our reliance on key customers, the length and severity of the ongoing COVID-19 pandemic, including its impact on domestic and international economic activity, consumer confidence, our production capabilities, our employees and our supply chain, the cost and availability of materials and the imposition of tariffs, our dependence on third-party suppliers, risks associated with our international operations and global strategies, our ability to achieve the anticipated benefits of our strategic initiatives, our ability to successfully execute our acquisition strategy and integrate businesses that we have and may acquire, our ability to attract, develop and retain talented and diverse personnel, risks associated with our reliance on information systems and technology, and our ability to achieve the anticipated benefits from our investments in new technology. These and other factors are discussed in detail in Item 1A "Risk Factors" in our most recent Annual Report on Form 10-K, as well as in our Quarterly Reports on Form 10-Q and in other filings we make with the Securities and Exchange Commission. Any forward-looking statement made by us speaks only as of the date on which it was made. Factors or events that could cause our actual results to differ may emerge from time to time, and it is not possible for us to predict all of them. Unless required by law, we undertake no obligation to update publicly any forward-looking statements as a result of new information, future events or otherwise.

3
Repair and Remodel
New Home Construction
Repair and Remodel
New Home Construction
Repair and Remodel Focused Portfolio
1. Revenue breakdown based on 2020 revenue and company estimates.
2. Excludes net general corporate expense. Plumbing Products excludes rationalization charges of $7 million. Decorative Architectural Products excludes rationalization charges of $4 million. 3
2020 OP Margin: 19.7%2
2020 OP Margin:19.2%2
• Broad product range with design and innovation leadership
• Includes faucets, plumbing fittings and valves, showerheads and handheld showers, bath hardware and accessories and more
• Comprehensive product and service offerings for professional and do-it-yourself painters
• Includes glass shower doors, shower accessories, decorative and outdoor lighting, cabinet, door and window hardware, and functional hardware
• Finish, design and category management expertise in builders’ hardware and lighting
FY2020 SALES1
$4.1B
FY2020 SALES1
$3.1B
Plumbing Products Decorative Architectural Products
Plumbing Products
Decorative Architectural Products
Low ticket and less cyclical, leading brands and innovation, leveraging customer and channel relationships

4
Financial Performance
1. Reflects operating profit and EPS, as adjusted. Amounts exclude discontinued operations for all periods presented. See Appendix for GAAP reconciliations.
Revenue ($B) Operating Profit1 ($B) EPS1 ($)
$5.8
$7.2
2016 2020
$1.0
$1.3
2016 2020
$1.30
$3.12
2016 2020
Delivering consistent top line, income, and EPS growth

5
Market Leading BrandsHigh share position in many categories
®

6
Innovation Leadership
Delta®
VoiceIQ™ TechnologyDelta®
Glass RinserHansgrohe®
Rainfinity™ Technology
Behr Marquee®
Coating with Simple Pour LidLiberty Adjusta-Pull™
Cabinet Hardware Behr® Spray Paint
Hansgrohe®
Aquno™ Select FaucetsBehr® Water Based
Interior Stains
~30%
of revenues from products introduced in last 3 years1
Fuels future growth and customer advocacy
1. Based on company estimates.

71. Segmentation figures based on company estimates and 2020 revenue.
Broad Distribution
7
Good Better Best
CHANNELS1END
MARKETS1 GEOGRAPHIES1
Newconstruction
11%
Repair & remodel
89%
International19%
North America81% Retail
50%
Wholesale/trade36%
E-commerce9%
Specialty dealers/Other
5%
Diversified geographies, products, channels
8
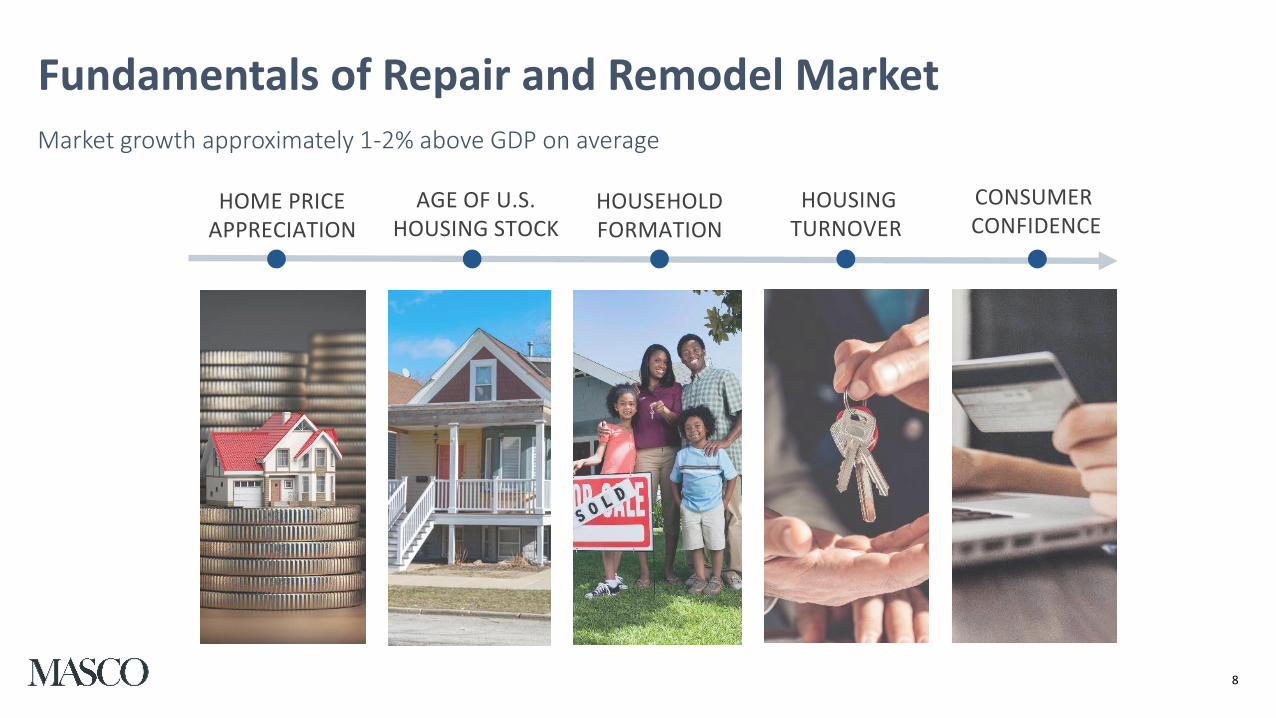
Fundamentals of Repair and Remodel MarketMarket growth approximately 1-2% above GDP on average
HOME PRICE APPRECIATION
AGE OF U.S. HOUSING STOCK
HOUSEHOLD FORMATION
HOUSINGTURNOVER
CONSUMER CONFIDENCE

91. Net of anticipated Hueppe GmbH divestiture.
Full Year 2021 Outlook2021 Adjusted EPS $3.50 – $3.70
9
Business Segment2021 Forecasted
Sales Growth2021 Forecasted Adjusted Operating Profit Margin
Plumbing Products
Organic: ~10-13%
~18.0%Acquisition1: ~3%
FX: ~2%
TOTAL: ~15-18%
Decorative Architectural Products
Organic: ~3-7%
~19.0%Acquisition: ~1.5%
TOTAL: ~4-9%
Total Masco
Organic: ~7-11%
~17.0%Acquisition: ~2.5%
FX: ~1%
TOTAL: ~10-14%

10
Capital Allocation StrategyBalanced Approach to Continue to Drive Shareholder Value
10
Reinvest in the Business
• Capex: 2-2.25% of sales
• Working capital: ~16.0% of sales1
Maintain investment grade credit rating
• Gross debt to EBITDA below 2.5x2
Maintain relevant dividend
• Board intends to increase annual dividend to $0.94 per share beginning 2Q 2021
• Dividend payout ratio of ~30%3
Deploy excess free cash flow to share repurchase or acquisitions
• Consistently in the market for share repurchase, but opportunistic
• New share repurchase authorization of $2.0 billion effective February 10, 2021
• Expect to deploy ~$800 million for share repurchases in 2021
• Select bolt-on acquisitions
4

1111
LONG-TERM OUTLOOK
Average annual sales growth
• Organic: ~3-5%
• Acquisition: ~1-3%
Operating margin
• Expand margins through cost productivity and volume leverage
Capital deployment
• Share buybacks: ~2-4% EPS growth
• Dividends: ~1-2% return on top of EPS growth
Average annual EPS growth
• ~10%
Market leading brands, history of innovation, customer focus
Low ticket, repair and remodel products provide growth and stability
through an economic cycle
Strong free cash flow and value creating capital allocation

12
Q&A
John Sznewajs
12

13
Appendix
13

14
North America
81%
Europe12%
Other2%
China3%United
Kingdom2%
Total Geographic Revenue SplitBusiness Segment
2020 Revenue R&R% vs. NC NA% v. Int’l
Plumbing Products
$4.1B 83% 67%
Decorative Architectural Products
$3.1B 96% 100%
Total Company $7.2B 89% 81%
R&R = % of sales to repair and remodel channels NC = % of sales to new construction channels NA = % of sales within North America Int’l = % of sales outside North America
2020 Segment Mix*
*Based on Company estimates

15
2020 Channel Mix*
*Based on Company estimates
2020 Channel Mix as a Percentage of Sales
Channel Plumbing Products Decorative Architectural
ProductsTotal
Masco
Retail 24% 85% 50%
Wholesale/trade 56% 11% 36%
E-commerce 12% 4% 9%
Specialty dealers/other 8% 0% 5%
16
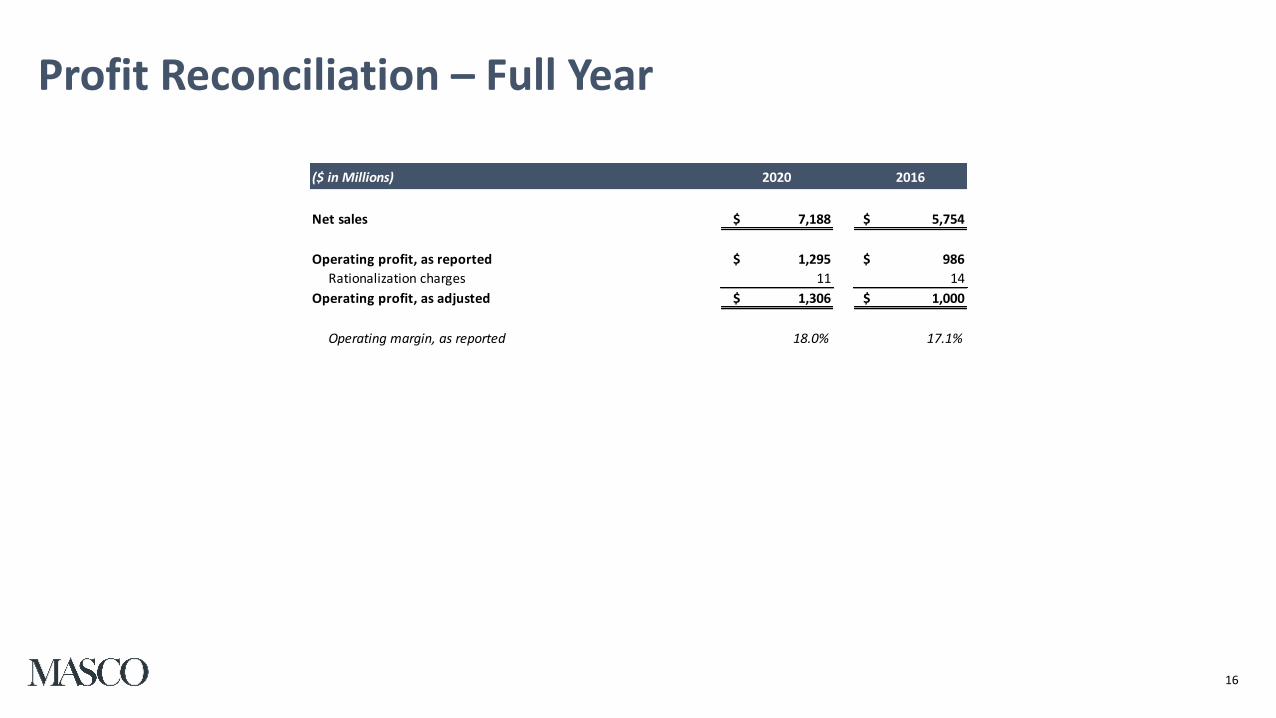
Profit Reconciliation – Full Year
($ in Millions) 2020 2016
Net sales $ 7,188 $ 5,754
Operating profit, as reported $ 1,295 $ 986
Rationalization charges 11 14
Operating profit, as adjusted $ 1,306 $ 1,000
Operating margin, as reported 18.0% 17.1%

17
EPS Reconciliation – Full Year
(in Millions, Except per Common Share Data) 2020 2016
Income from continuing operations before income taxes, as reported $ 1,131 $ 729
Rationalization charges 11 14
Loss from other investments - 3
Pension costs associated with expected terminated plans 23 -
Income related to an escrow settlement (9) -
Currency translation loss on liquidation of dormant entities 9 -
(Gains) from private equity funds, net - (5)
(Gain) from auction rate securities - (3)
(Earnings) from equity investments, net (3) (2)
Loss on debt extinguishment 6 -
Income from continuing operations before income taxes, as adjusted $ 1,168 $ 736
Tax at 25% rate - 2020; 36% rate - 2016 (292) (265)
Less: Net income attributable to noncontrolling interest 52 43
Income from continuing operations, as adjusted $ 824 $ 428
Income from continuing operations per common share, as adjusted $ 3.12 $ 1.30
Average diluted common shares outstanding 264 330

18
EPS Outlook Reconciliation
Low End High End
Income from continuing operations per common share 1.52$ 1.72$
Rationalization charges 0.01 0.01
Pension costs associated with expected terminated plans (1) 1.42 1.42
Loss on extinguishment of debt 0.52 0.52
Allocation to participating securities per share (2) 0.03 0.03
Income from continuing operations per common share, as adjusted 3.50$ 3.70$
2021
(1) Represents costs associated with our qualified defined-benefit domestic pension plans that are expected to be terminated in
2021.
(2) Represents the impact of distributed dividends and undistributed earnings to unvested restricted stock awards as well as an
allocation to redeemable noncontrolling interest in accordance with the two-class method of calculating earnings per share.