Journal of System and Software Stock Trend Prediction...
4
Volume 1 No. 4, JULY 2011 ISSN 2222-9833 ARPN Journal of Systems and Software ©2010-11 AJSS Journal. All rights reserved http://www.scientific-journals.org 154 Stock Trend Prediction Using Regression Analysis – A Data Mining Approach 1 S Abdulsalam Sulaiman Olaniyi, 2 Adewole, Kayode S. , 3 Jimoh, R. G 1 Al-Hikmah University,Ilorin, Nigeria, 2 Kwara State University, Malete, Nigeria, 3 University of Ilorin,Ilorin, Nigeria. 1 [email protected] , 2 [email protected] , 3 [email protected] ABSTRACT Organizations have been collecting data for decades, building massive data warehouses in which to store the data. Even though this data is available, very few of these organizations have been able to realize the actual value stored in it. The question these organizations are asking is how to extract meaningful data and uncover patterns and relationship from their databases. This paper presents a study of regression analysis for use in stock price prediction. Data were obtained from the daily official list of the prices of all shares traded on the stock exchange published by the Nigerian Stock Exchange using banking sector of Nigerian economy with three banks namely:- First Bank of Nigeria Plc, Zenith Bank Plc, and Skye Bank Plc to build a database. A data mining software tool was used to uncover patterns and relationships and also to extract values of variables from the database to predict the future values of other variables through the use of time series data that employed moving average method. The tools were found capable technique to describe the trends of stock market prices and predict the future stock market prices of three banks sampled. Keywords: Data warehouses, regression analysis, stock price, data mining, moving average 1. BACKGROUND TO THE STUDY Across a wide variety of fields, different data are being collected and accumulated at a dramatic pace. The amount of these data generated and stored is growing exponentially, due to the continuing advances in computer technology. This presents tremendous opportunities for those who can unlock the information embedded within this data. However, these challenges has called for an urgent need for a new generation of computational theories and tools to assist humans in extracting useful information (knowledge) from the rapidly growing volumes of digital data. These theories and tools are the subject of the emerging field of knowledge discovery in databases (KDD) [1][2]. Knowledge discovery out of the collected data can be done using a technique called Data Mining. A commonly accepted definition of data mining which is a process of selecting, exploring and modelling large quantities of data to unravel previously unknown patterns for the purpose of business and commercial advantage [3]. In this paper, the serial movement of stock prices over a period of time extracted from the daily official list of Nigerian Stock Exchange, are used in building a database and values of variables were extracted from the database to predict the future values of other variables through the use of time series data that employed moving average method. This research also investigates how to make use of this rich data to predict financial market prices in the banking sector of Nigerian economy using three banks as a case study. We predict stock market prices using information contain in daily and weekly activity summaries (equities) published by Nigerian Stock Exchange. The uncovered patterns and the predicted values from the database assist the stock brokers and investors in making complex decision in stock market activities thereby reducing the risk in stock investment. 2. METHOD USED The data obtained from the daily and weekly activity summaries (equities) published by Nigerian Stock Exchange was used in building a database. A data mining software tool was developed which employed the use of regression analysis through the use of time series data that employed moving average method to predict future stock market prices. 2.1 Regression Analysis Linear regression is one of the most common data mining technique for predicting the future value of variable based on the linear relationship it has with other variables [5][6][7][8]. Basically, it assumes there is a straight line that approximates the data set, and bases the forecast on it. There is only one independent variable and the formula that describes this relationship is the one that defines a straight line: bx a y ------------------------ 1.1 Where, y is the dependent variable x is the independent one. a and b are the line’s coefficients. Moreover, the least square method is employed in finding the regression line. The least squares method is expressed as: bx a y ---------------------- 1.2
Transcript of Journal of System and Software Stock Trend Prediction...

Volume 1 No. 4, JULY 2011 ISSN 2222-9833
ARPN Journal of Systems and Software
©2010-11 AJSS Journal. All rights reserved
http://www.scientific-journals.org
154
Stock Trend Prediction Using Regression Analysis –
A Data Mining Approach
1 S Abdulsalam Sulaiman Olaniyi,
2 Adewole, Kayode S. ,
3 Jimoh, R. G
1 Al-Hikmah University,Ilorin, Nigeria,
2 Kwara State University, Malete, Nigeria, 3 University of Ilorin,Ilorin, Nigeria.
ABSTRACT
Organizations have been collecting data for decades, building massive data warehouses in which to store the data. Even
though this data is available, very few of these organizations have been able to realize the actual value stored in it. The
question these organizations are asking is how to extract meaningful data and uncover patterns and relationship from their
databases. This paper presents a study of regression analysis for use in stock price prediction. Data were obtained from the
daily official list of the prices of all shares traded on the stock exchange published by the Nigerian Stock Exchange using
banking sector of Nigerian economy with three banks namely:- First Bank of Nigeria Plc, Zenith Bank Plc, and Skye Bank
Plc to build a database. A data mining software tool was used to uncover patterns and relationships and also to extract
values of variables from the database to predict the future values of other variables through the use of time series data that
employed moving average method. The tools were found capable technique to describe the trends of stock market prices
and predict the future stock market prices of three banks sampled.
Keywords: Data warehouses, regression analysis, stock price, data mining, moving average
1. BACKGROUND TO THE STUDY
Across a wide variety of fields, different data are
being collected and accumulated at a dramatic pace. The
amount of these data generated and stored is growing
exponentially, due to the continuing advances in computer
technology. This presents tremendous opportunities for
those who can unlock the information embedded within
this data. However, these challenges has called for an
urgent need for a new generation of computational
theories and tools to assist humans in extracting useful
information (knowledge) from the rapidly growing
volumes of digital data. These theories and tools are the
subject of the emerging field of knowledge discovery in
databases (KDD) [1][2]. Knowledge discovery out of the
collected data can be done using a technique called Data
Mining. A commonly accepted definition of data mining
which is a process of selecting, exploring and modelling
large quantities of data to unravel previously unknown
patterns for the purpose of business and commercial
advantage [3]. In this paper, the serial movement of stock
prices over a period of time extracted from the daily
official list of Nigerian Stock Exchange, are used in
building a database and values of variables were extracted
from the database to predict the future values of other
variables through the use of time series data that employed
moving average method.
This research also investigates how to make use
of this rich data to predict financial market prices in the
banking sector of Nigerian economy using three banks as
a case study. We predict stock market prices using
information contain in daily and weekly activity
summaries (equities) published by Nigerian Stock
Exchange. The uncovered patterns and the predicted
values from the database assist the stock brokers and
investors in making complex decision in stock market
activities thereby reducing the risk in stock investment.
2. METHOD USED
The data obtained from the daily and weekly
activity summaries (equities) published by Nigerian Stock
Exchange was used in building a database. A data mining
software tool was developed which employed the use of
regression analysis through the use of time series data that
employed moving average method to predict future stock
market prices.
2.1 Regression Analysis
Linear regression is one of the most common data
mining technique for predicting the future value of
variable based on the linear relationship it has with other
variables [5][6][7][8]. Basically, it assumes there is a
straight line that approximates the data set, and bases the
forecast on it.
There is only one independent variable and the
formula that describes this relationship is the one that
defines a straight line:
bxay ------------------------ 1.1
Where, y is the dependent variable
x is the independent one.
a and b are the line’s coefficients.
Moreover, the least square method is employed in finding
the regression line.
The least squares method is expressed as:
bxay ---------------------- 1.2
Volume 1 No. 4, JULY 2011 ISSN 2222-9833
ARPN Journal of Systems and Software
©2010-11 AJSS Journal. All rights reserved
http://www.scientific-journals.org
155
Where, xbya
b =
22 xxn
yxxyn --------------------- 1.3
In accordance with this paper, each variable denotation is
as follows:
y = current market price
x = percentage earning (P.E) ratio
y Mean occurrence of current market price
x Mean occurrence of percentage earning (P.E.) ratio
n Total number of occurrence of the variables
The above variables were derived from the
relationship between the percentage earning (P.E.) ratio,
current market price and the earning per share (EPS),
described by the formula
Percentage earning (P.E.) ratio = current market price
earning per share ---1.4
The straight line trend in equation 1.1 was obtained for
each of the banks as shown below
First Bank Plc
xy 12.085.35 ------------ 1.5
Skye Bank Plc
xy 64.097.30 -------------1.6
Zenith Bank Plc
xy 16.139.14 -----------------1.7
The method of moving average was used to get the
corresponding value of x using 3-monthly moving average
period.
2.2 Moving Average
Moving average method is a device for reducing
fluctuations and obtaining trend values with a fair degree
of accuracy. This method consists of taking arithmetic
mean of the values for a certain time span and placing it at
the centre of the time span. In this method the average
value of a number of years (months, weeks or days) is
taken as the trend value for the middle point of the period
of moving averages. The process of averaging smoothens
the curve and reduces the fluctuations [1]. A moving
average is plotted as a line on a graph of price changes.
When price fall below the moving average, they have a
tendency to keep on falling. Conversely, when price rise
above the moving average, they tend to keep on rising [4].
For applying the method of moving averages the period of
the moving averages has to be selected first. In this paper,
3-monthly moving average of percentage earning ratio
(P.E) was used for each of the banks. For example, 3-
monthly average can be calculated from the data given by
Janp.e + Febp.e + Marchp.e , Febp.e + Marchp.e + Aprilp.e,
3 3
Marchp.e + Aprilp.e + Mayp.e, ........... 1.8
3
and these total to be written beside the month of February,
March, April and so on.
3. ANALYSIS OF RESULTS
Data mining is a step in the KDD (Knowledge
Discovery in Database) process that consists of applying
data analysis and discovery algorithm that, under
acceptable computational efficiency limitations, produce a
particular enumeration of patterns (or models) over the
data. The data to be mined is first extracted from an
enterprise data warehouse into a data mining database or
data mart. This means that for a data mining tool to work
efficiently and effectively, database must be built. In this
paper, we built a database for the data mining software
tool using the information obtained from the daily activity
summary (equities) published by Nigerian Stock Exchange
spanning through eighteen months. Data obtained were
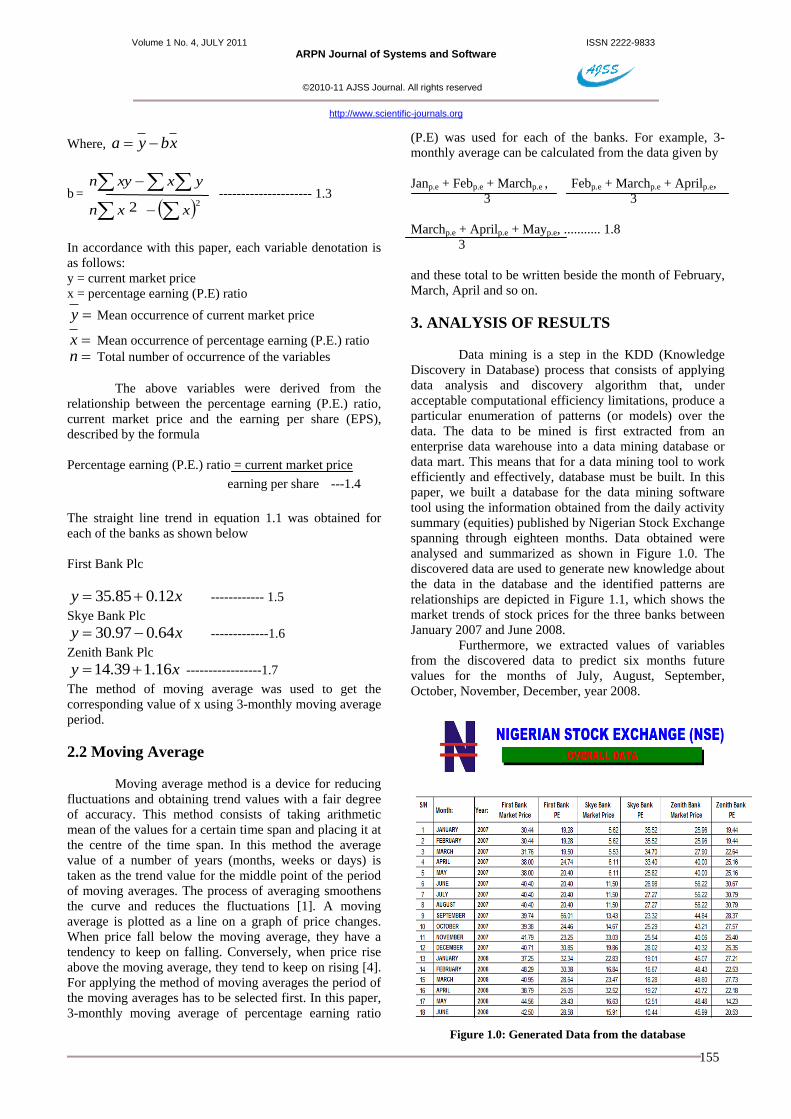
analysed and summarized as shown in Figure 1.0. The
discovered data are used to generate new knowledge about
the data in the database and the identified patterns are
relationships are depicted in Figure 1.1, which shows the
market trends of stock prices for the three banks between
January 2007 and June 2008.
Furthermore, we extracted values of variables
from the discovered data to predict six months future
values for the months of July, August, September,
October, November, December, year 2008.
Figure 1.0: Generated Data from the database
Volume 1 No. 4, JULY 2011 ISSN 2222-9833
ARPN Journal of Systems and Software
©2010-11 AJSS Journal. All rights reserved
http://www.scientific-journals.org
156
Figure 1.1: Identified Patterns and Relationships describing
the generated data
Moreover, our system predicts monthly
movement of stock prices for each of the three banks using
regression analysis. The regression coefficient a and b in
equation 1.2 are then solved using the method of least
squares to generate the linear functions in equations 1.5,
1.6 and 1.7 above. The values of variable x in equation
1.5, 1.6 and 1.7 were determined using 3-monthly moving
average period as shown in equation 1.8. Figure 1.2 shows
the predicted stock market prices for the months of July,
August, September, October, November and December,
year 2008 for the three banks. The PE shown in figure 1.2
columns 5, 7 and 9 are the equivalent values of variable x
obtained using the method of moving average as discussed
earlier. These values were further substituted into the
linear functions in equations 1.5, 1.6 and 1.7 to predict the
new market prices for each of the three banks.
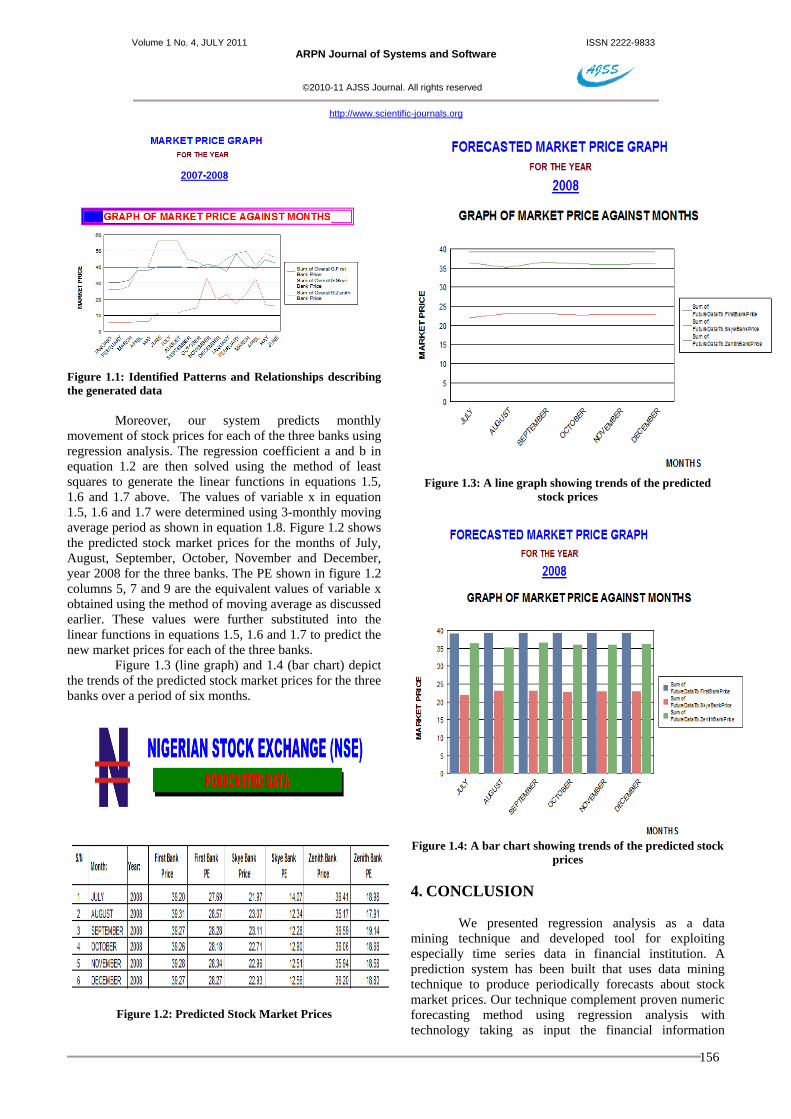
Figure 1.3 (line graph) and 1.4 (bar chart) depict
the trends of the predicted stock market prices for the three
banks over a period of six months.
Figure 1.2: Predicted Stock Market Prices
Figure 1.3: A line graph showing trends of the predicted
stock prices
Figure 1.4: A bar chart showing trends of the predicted stock
prices
4. CONCLUSION
We presented regression analysis as a data
mining technique and developed tool for exploiting
especially time series data in financial institution. A
prediction system has been built that uses data mining
technique to produce periodically forecasts about stock
market prices. Our technique complement proven numeric
forecasting method using regression analysis with
technology taking as input the financial information

Volume 1 No. 4, JULY 2011 ISSN 2222-9833
ARPN Journal of Systems and Software
©2010-11 AJSS Journal. All rights reserved
http://www.scientific-journals.org
157
obtained from the daily activity summary (equities)
published by Nigerian Stock Exchange. In this paper, we
were able to use regression analysis as a data mining
technique to describe the trends of stock market prices and
predict the future stock market prices of three banks as a
case study from banking sector of Nigerian economy.
REFERENCES
[1] Arora, P.N. and Arora, S. (2009). Statistics for
Management. New Delhi: S. Chand & Company
Limited. ISBN: 81-219-2285-2.
[2] Fayyad, U., Piatetsky-Shapiro, G. and Smyth, P.
(1996). From Data Mining to Knowledge in
Databases. Menlo Park, Calif: American
Association for Artificial Intelligence.
[3] Ravindranath, B. (2003). Decision Support
Systems and Data Warehouses. New Delhi: New
Age International Limited. ISBN: 81-224-1454-0.
[4] Kannan, K.S., Sekar, P.S., Sathik, M.M. and
Arumugan, P. (2010). Financial Stock Market
Forecast using Data Mining Techniques. Hong
Kong: Proceedings of International
MultiConference of Engineers and Computer
Scientist 2010 Vol. I. IMECS 2010. ISBN: 978-
988-17012-8-2.
[5] Han, J. and Kamber, M. (2006). Data Mining:
Concepts and Techniques, (2nd ed.). Morgan
Kaufmaun.
[6] Larose, D.T. (2005). Discovering Knowledge in
Data: An Introduction to Data Mining. New
York: John Wiley and Sons, Inc. ISBN: 0-471-
66657-2
[7] Portia, A.C.(n.d). Data Mining and Neural
Networks from a Commercial Perspective.
Australia: University of Technology Sydney,
Australia.
[8] Two Crows Corporation (2005). Introduction to
Data Mining and Knowledge Discovery, (3rd ed.).
Potomac, USA: Two Crows Corporation. ISBN:
1-892095-02-5
[9] Weiss, G.M., and Davison, B.D. (2010). Data
Mining. Handbook of Technology Management,
H. Bidgoli (Ed.), John Wiley and Sons.
[10] Wuthrich, B., Cho, V., Leung, S., Permunetilleke,
D., Sankaran, K., Zhang, J., and Lam, W. (1998).
Daily Stock Market Forecast from Texual Web
Data.
Abdulsalam Sulaiman Olaniyi is a
graduate of University of Ilorin, Ilorin,
where he obtained Bachelor of Science
Degree in Computer Science and Master of
Science Degree in Computer Science
respectively. His areas of specialization include Software
Engineering and Data Mining. He is a member of Nigeria
Computer Society (MNCS). His is presently an Assistant
Lecturer in the Department of Physical Sciences, Al-
Hikmah University, Ilorin, Nigeria. The co-authors,
Adewole, K. S. and Jimoh, R. G. are both Lecturers from
Kwara State University, Malete, Nigeria and University of
Ilorin, Ilorin, Nigeria respectively.