Journal of Geophysical Research - uni-muenchen.de · (Paper 92JB01709) James M. DeGraff and Atilla...
14
Journal of Geophysical Research Volume 98 Number B4 April 10, 1993 JGREA2 98(B4) 6187-6850 (1993) ISSN 0148-0227 Associate Editors (Paper 93JB00647) 6187 Papers on Geomagnetism and Paleomagnetism Marine Geology and Geophysics Inhibition and Geomagnetic Field Reversals (Paper 92JB02574) P. L . McFadden and R. 7. Merrill 6189 A Model of Multidomain Thermoremanent Magnetization Incorporating Temperature-Variable Domain Structure (Paper 92JB02572) V. P. Shcherbakov, E. McClelland, and V. V. Shcherbakova 6201 Rock Magnetism of Remagnetized Paleozoic Carbonates: Low-Temperature Behavior and Susceptibility Characteristics (Paper 92JB01319) Mike Jackson, Pierre Rochette, Gerard Fillion, Subir Banerjee, and Jim Marvin 6217 The Pictou Red Beds' Pennsylvanian Pole: Could Phancrozoic Rocks in the Interior United States Be Remagnetized? (Paper 92JB01848) H. Pan and D. T. A. Symons 6227 Rcmagnetization by Basinal Fluids: Testing the Hypothesis in the Viola Limestone, Southern Oklahoma (Paper 92JB02577) R. Douglas Elmore, David London, Don Bagley, David Fruit, and Guoqiu Gao 6237 Effects of Hydrothermal Alteration on the Magnetization of the Oligocenc Carpenter Ridge Tuff, Bachelor Caldera, San Juan Mountains, Colorado (Paper 93JB00014) Donald S. Sweetkind, Richard L. Reynolds, David A. Sawyer, and Joseph G. Rosenbaum 6255 Induced Magnetization of the Oceanic Lithosphcre and Ocean-Continent Magnetization Contrast Inferred From Magsat Anomalies (Paper 92JB02573) Paul B. Toft and J afar Arkani-Hamed 626Ί The Genesis of Oceanic Crust: Magma Injection, Hydrothermal Circulation, and Crustal Flow (Paper 92JB02650) Jason Phipps Morgan and Y. John Chen 6283 Updated Interpretation of Magnetic Anomalies and Seafloor Spreading Stages in the South China Sea: Implications for the Tertiary Tectonics of Southeast Asia (Paper 92JB02280) Anne Briais, Philippe Patriat, and Paul Tapponnier 6299 Crustal Structure of Endeavour Ridge Segment, Juan de Fuca Ridge, From a Detailed Seismic Refraction Survey (Paper 92JB02860) Connie F. Cudrak and Ron M. Clowes 6329 Geothermal Heat Flux From Hydrothermal Plumes on the Juan de Fuca Ridge (Paper 92JB02273) Karen G. Bemis, Richard P. Von Herzen, and Michael J. Mottl 6351 Structure and Tectonic Setting of the 77Έ and 75°E Grabens, Kerguelen Plateau, South Indian Ocean (Paper 92JB02694) Marc Munschy, Yair Rotstein, Roland Schlich, and Millard F. Coffin 6367 Papers on Chemistry and Physics of Minerals and Rocks Volcanology Effect of Loading Rate on Crack Propagation Under Compressive Stress in a Saturated Porous Material (Paper 92JB02413) C. Atkinson and J. M. Cook 6383 Slip Systems in Calcite Single Crystals Deformed at 300-800°C (Paper 92JB02044) J. H. P. de Bresser and C. J. Spiers 6397 (continued on inside back cover)
-
Upload
phungtuyen -
Category
Documents
-
view
214 -
download
1
Transcript of Journal of Geophysical Research - uni-muenchen.de · (Paper 92JB01709) James M. DeGraff and Atilla...

Journal of Geophysical
Research Volume 98 Number B4 Apri l 10, 1993
JGREA2 98(B4) 6187-6850 (1993) ISSN 0148-0227
Associate Editors (Paper 93JB00647) 6187
Papers on
Geomagnetism and Paleomagnetism Marine Geology and Geophysics
Inhibition and Geomagnetic Field Reversals (Paper 92JB02574) P. L . McFadden and R. 7. Merrill 6189
A Model of Multidomain Thermoremanent Magnetization Incorporating Temperature-Variable Domain Structure (Paper 92JB02572)
V. P. Shcherbakov, E. McClelland, and V. V. Shcherbakova 6201
Rock Magnetism of Remagnetized Paleozoic Carbonates: Low-Temperature Behavior and Susceptibility Characteristics (Paper 92JB01319)
Mike Jackson, Pierre Rochette, Gerard Fillion, Subir Banerjee, and Jim Marvin 6217
The Pictou Red Beds' Pennsylvanian Pole: Could Phancrozoic Rocks in the Interior United States Be Remagnetized? (Paper 92JB01848) H. Pan and D. T. A. Symons 6227
Rcmagnetization by Basinal Fluids: Testing the Hypothesis in the Viola Limestone, Southern Oklahoma (Paper 92JB02577)
R. Douglas Elmore, David London, Don Bagley, David Fruit, and Guoqiu Gao 6237
Effects of Hydrothermal Alteration on the Magnetization of the Oligocenc Carpenter Ridge Tuff, Bachelor Caldera, San Juan Mountains, Colorado (Paper 93JB00014)
Donald S. Sweetkind, Richard L . Reynolds, David A. Sawyer, and Joseph G. Rosenbaum 6255
Induced Magnetization of the Oceanic Lithosphcre and Ocean-Continent Magnetization Contrast Inferred From Magsat Anomalies (Paper 92JB02573) Paul B. Toft and J afar Arkani-Hamed 626Ί
The Genesis of Oceanic Crust: Magma Injection, Hydrothermal Circulation, and Crustal Flow (Paper 92JB02650) Jason Phipps Morgan and Y. John Chen 6283
Updated Interpretation of Magnetic Anomalies and Seafloor Spreading Stages in the South China Sea: Implications for the Tertiary Tectonics of Southeast Asia (Paper 92JB02280)
Anne Briais, Philippe Patriat, and Paul Tapponnier 6299
Crustal Structure of Endeavour Ridge Segment, Juan de Fuca Ridge, From a Detailed Seismic Refraction Survey (Paper 92JB02860) Connie F. Cudrak and Ron M. Clowes 6329
Geothermal Heat Flux From Hydrothermal Plumes on the Juan de Fuca Ridge (Paper 92JB02273) Karen G. Bemis, Richard P. Von Herzen, and Michael J. Mottl 6351
Structure and Tectonic Setting of the 7 7 Έ and 75°E Grabens, Kerguelen Plateau, South Indian Ocean (Paper 92JB02694) Marc Munschy, Yair Rotstein, Roland Schlich, and Millard F. Coffin 6367
Papers on Chemistry and Physics of Minerals and Rocks Volcanology
Effect of Loading Rate on Crack Propagation Under Compressive Stress in a Saturated Porous Material (Paper 92JB02413) C. Atkinson and J. M. Cook 6383
Slip Systems in Calcite Single Crystals Deformed at 300-800°C (Paper 92JB02044) J. H. P. de Bresser and C. J. Spiers 6397
(continued on inside back cover)
{continued from outside hack cover)
Effect of Thermal Regime on Growth Increment and Spacing of Contraction Joints in Basaltic Lava (Paper 92JB01709) James M. DeGraff and Atilla Ay din 6411
Latticc-Boltzmann Studies of immiscible Two-Phase Flow Through Porous Media (Paper 92JB0266Ü) Andrew Κ Gunstensen and Daniel H. Rothman 6431
Deformation of Fine-Grained Aggregates of Olivine Plus Melt at High Temperatures and Pressures (Paper 92JB02697) Mark L Beeman and D. L . Kohlstedt 6443
Calorimetric Study of MgSiO J Garnet and Pyroxene: Heat Capacities, Transition Enthalpies, and Equilibrium Phase Relations in MgSiO 3 at High Pressures and Temperatures (Paper 92JB02862)
Hitoshi Yusa, Masaki Akaogi, and Fiji ho 6453
Radiative Temperature Measurements at Kupaianaha Lava Lake, Kilauca Volcano, Hawaii (Paper 92JB02698)
Luke P. Flynn, Peter J. Mouginis-Mark, Jonathan C. Gradie, and Paul G. Lucey 6461
Frequency Dependent Rheology of Vesicular Rhyolite (Paper 92JB02690) N. S. Bagdassarov and D. B. Dingwell 6417
The La Olivina Pyroxenite Suite and the Isotopic Compositions of Mantle Basalts Parental to the Mid-Cenozoic Arc Volcanism of Northern Mexico (Paper 92JB02334)
Gregory J. Nimz, Kenneth L . Cameron, and Sidney Niemeyer 6489
Papers on Seismology
Seismic Radiation by Magma Injection: An Anomalous Seismic Event Near Tori Shima, Japan (Paper 92JB02867)
Hiroo Kanamori, Göran Ekström, Adam DziewonskL Jeffrey S. Barker, and Stuart A. Sipkin 6511
Seismic Events With Implosional Focal Mechanisms in the Coeur d'Alcne Mining District, Northern Idaho (Paper 92JB02859) Michael C Stickney and Kenneth F. Sprenke 6523
Dynamic Rupture Analysis: Inversion for the Source Process of the 1990 Izu-Oshima, Japan, Earthquake (M = 6.5) (Paper 92JB02451) Eiichi Fukuyama and Takeshi Mikumo 6529
Seismotectonics of the San Andreas Fault System Between Point Arena and Cape Mendocino in Northern California: Implications for the Development and Evolution of a Young Transform (Paper 92JB02866) David A. Castillo and William L Ellsworth 6543
Paleoseismology Along the 1980 Surface Rupture of the Irpinia Fault: Implications for Earthquake Recurrence in the Southern Apennines, Italy (Paper 92JB02277)
Daniela Pantosti, David P. Schwartz, and Gianluca Valensise 6561
Tomographic Inversion of Rg Wave Group Velocities for Regional Near-Surface Velocity Structure (Paper 92JB02872) Argun Η Kocaoglu and Leland T. Long 6579
Ill-Posed and Well-Posed Formulations of the Reflection Travel Time Tomography Problem (Paper 92JB02441) Florence Delprat-Jannaud and Patrick Lailly 6589
Tomographic Image of the Mid-Atlantic Plate Boundary in Southwestern Iceland (Paper 92JB02412) Ingi Th, Bjarnason, William Menke, Olafur G. Flovenz, and David Caress 6607
Structure of Archean Crust and Passive Margin of Southwest Greenland From Seismic Wide-Angle Data (Paper 93JB00016) Karsten Göhl and Scott B. Smithson 6623
Tectonic Deformation in the New Madrid Seismic Zone: Inferences From Map View and Cross-Sectional Boundary Element Models (Paper 92JB02857) Joan Cornberg 6639
Corrections
Correction to "Dynamics of Fault Interaction: Parallel Strike-Slip Faults" (Paper 93JB00679) Ruth A. Harris and Steven M. Day 6665
(continued on facing page)
(continued from inside back cover)
Papers on Geodesy and Gravity Tectonophysics
The Use of the Precise Observations of the Celestial Ephemeris Pole in the Analysis of Geophysical Excitation of Earth Rotation (Paper 92JB02874) Aleksander Brzezinski and Nicole Capitaine 6667
Observation and Analysis of the Tidal Gravity Variations at Asuka Station Located on the Antarctic Ice Sheet (Paper 92JB02865) Kazuo Shibuya and Fumio Ogawa 6677
Edge-Driven Microplate Kinematics (Paper 92JB02749) Hans Schouten, Kim D. Klitgord, and David G. Gallo 6689
Earthquake Slip Vectors and Estimates of Present-Day Plate Motions (Paper 92JB02868) Charles DeMets 6703
Structural, Petrological and Thermal Evolution of a Tertiary Ductile Strike-Slip Shear Zone, Diancang Shan, Yunnan (Paper 92JB02791)
P. H. Leloup, T. Mark Harrison, F. J. Ryerson, Chen Wenji, Li Qi, P. Tapponnier, and R. Lacassin 6715
Analysis o f Scarp Profiles: Evaluation of Errors in Morphologic Dating (Paper 92JB01962) Jean-Philippe Avouac 6745
Act ive Thrusting and Folding Along the Northern Tien Shan and Late Cenozoic Rotation of the Tarim Relative to Dzungaria and Kazakhstan (Paper 92JB01963)
J. P. Avouac, P. Tapponnier, M. Bai, Η. You, and G. Wang 6755
Rise and Ti l t of Metamorphic Rocks in the Lower Plate of a Detachment Fault in the Funeral Mountains, Death Valley, California (Paper 92JB02411) Thomas D. Hoisch and Carol Simpson 6805
Structure of Axisymmetric Mantle Plumes (Paper 92JB01013)
Peter Olson, Gerald Schubert, and Charles Anderson 6829
1992 Referees 6845
Information for Contributors 6849
Journal quality reprints of individual papers in this issue are available in limited quantities. This "separates" program offers single papers for personal use. Small quantities may also be purchased for classroom use or library reserve copies while supplies last. Please order on department stationery and include the class title and number of enrolled students. Use the entire paper number, located on the table of
contents or on the first page of each paper. Payment must accompany each order unless a member deposit account has been established. The first paper in each order costs $3.50 ($2.00 for deposit accounts); each additional paper costs $1.00. Send orders to American Geophysical Union, Separates Sales, 2000 Florida Avenue, N . W . , Washington, DC 20009 USA.

J O U R N A L O F G E O P H Y S I C A L R E S E A R C H , V O L . 98, N O . B4 , P A G E S 6477-6487, A P R I L 10, 1993
Frequency Dependent Rheology of Vesicular Rhyolite
N . S. B A G D A S S A R O V A N D D . B . D I N G W E L L
Bayerisches Geoinstitut, Universität Bayreuth, Bayreuth, Germany
Frequency dependent rheology of magmas may result from the presence of inclusions (bubbles, crystals) in the melt and/or from viscoelastic behavior of the melt itself. With the addition of deformable inclusions to a melt possessing viscoelastic properties one might expect changes in the relaxation spectrum of the shear stresses of the material (e.g., broadening of the relaxation spectrum) resulting from the viscously deformable geometry of the second phase. We have begun to investigate the effect of bubbles on the frequency dependent rheology of rhyolite melt. The present study deals with the rheology of bubble-free and vesicular rhyolite melts containing spherical voids of 10 and 30 vol %. We used a sinusoidal torsion deformation device. Vesicular rhyolite melts were generated by the melting (at 1 bar) of an Armenian obsidian (Dry Fountain, Erevan, Armenia) and Little Glass Mountain obsidian (California). The real and imaginary parts of shear viscosity and shear modulus have been determined in a frequency range of 0.005-10 Hz and temperature range of 600°-900°C. The relaxed shear viscosities of samples obtained at low frequencies and high temperatures compare well with data previously obtained by parallel plate viscometry. The relaxed shear viscosity of vesicular rhyolites decreases progressively with increasing bubble content. The relaxation spectrum for rhyolite melt without bubbles has an asymmetric form and fits an extended exponent relaxation. The presence of deformable bubbles results in an imaginary component of the shear modulus that becomes more symmetrical and extends into the low-frequency/high-temperature range. The internal friction Q " 1 is unaffected in the high-frequency/low-temperature range by the presence of bubbles and depends on the bubble content in the high-temperature/low-frequency range. The present work, in combination with the previous study of Stein and Spera (1992), illustrates that magma viscosity can either increase or decrease with bubble content, depending upon the rate of style of strain during magmatic flow.
INTRODUCTION sions, (1) becomes
The purpose o f this paper is to evaluate the role of vesicles or voids during deformation of molten rhyolite at varying strain rate. Interest in the rheology of multiphase magmas stems from the non-Newtonian rheology of such systems, which can exhibit a strong strain and strain rate dependence. The experimental method which has been used to study the viscoelastic behavior of the vesicular rhyolite is the oscillatory shear. A brief introduction to the theoretical aspects of multiphase rheology and the oscillatory shear method is presented below.
Two-Phase Rheology
Investigation of rheological properties o f magmatic suspensions has begun relatively recently [Stein and Spera, 1992; Bagdassarov and Dingwell, 1992]. These melts with suspended voids possess shear and volume components of viscosity [Prud'homme and Bird, 1978]. I f the melt between the bubbles is an incompressible liquid wi th unrelaxed shear modulus G, then the effective unrelaxed shear modulus (G) of the composite w i th spherical voids is given approximately by
G ~ G [ 1 + (5 /2)ψ + · · · ] (2)
G ~ G [ 1 - (5 /3 )φ ] , (1)
where φ is the volume fraction of cavities [cf. Chen and Acrivos, 1978]. The same relationship is valid for the effective relaxed shear viscosity (rjs) of suspension from the shear viscosity o f the liquid matrix (η5) using the viscous analogy of the elastic case. I f the cavities are rigid inclu-
Copyright 1993 by the American Geophysical Union.
Paper number 92JB02690. 0148-0227/93/92JB-02690$05.00
[cf. Chen and Acrivos, 1978]. The presence of heterogeneities in the liquid may also result in a strain rate dependence of η5. In the case of cavities, the shear viscosity decreases wi th the volume fraction φ, whereas in the case of rigid inclusions, i t increases.
The presence of distinguishable phases (melt and bubbles) affects the rheological properties of a dispersed system in such a way that they depend on the ratio of the time scale (or length scale) at which shearing occurs to the time scale (or length scale) of second phase (in this case, bubble) deformation. Thus the mechanical response of bubbles suspended in the melt depends on the rate of shear strain. A t high strain rates (in comparison with the bubble deformation time) or high frequency the bubbles respond rigidly, whereas at low strain rates they respond as deformable cavities. I n order to determine the mechanical behavior o f vesicles at differing strain rates in magmas the present experimental study of shear deformation of rhyolite has been performed using a forced torsion oscillation apparatus. A n advantage o f this device is the use of pure shear (torsion) deformation. This allows the estimation of shear viscosity in materials at temperatures near the glass transition (melts wi th viscosities 10 9 to 10 1 1 Pa s). Knowing the shear viscosity η3 from torsion measurements and the longitudinal viscosity (η χ/3) from parallel plate viscometry
77,73 (3)
the volume viscosity ην can be calculated [Sura and Panda, 1990].
6477
BAGDASSAROV AND DINGWELL: RHHOLOGY OF RHYOLITH 6478
Principle of Dynamic Rheological Properties Measurements
Useful information about the viscoelastic (or strain rate dependent) behavior of multiphase materials can be obtained by dynamical rheological measurements [i .e. , Barnes et al., 1989; Nguyen and Boger, 1992]. The fluid, in this experimental method, is the subject of small amplitude sinusoidal stress
a(t) = o r 0 exp (ίωή. (4)
I f (4) is substituted into the general differential equation for linear viscoelasticity representing the relationship between the stress σ and the strain ε
/ d d2 d"\ 1 + α ι — + α 2 ~ Γ Τ + * * * a n ~ 7 T \ σ
\ dt 2 dt2 n dtnj
I d d2 d m \ = ^ o + * i ^ + * 2 ^ + - + X m ^ j e (5)
n = m or n = m- 1 [Barnes et al., 1989], then the complex shear modulus G * = G' + iG" can be defined as follows
σ ( / ) = σ * ( ω ) ε ( / ) , (6)
and the complex shear viscosity η * = η' - / η " is
a(t) = η*(ω)έ(ή (7)
[Barnes et al., 1989]. The G ' which is in phase with the strain is a measure of the elastic energy stored per cycle of deformation, whereas the loss modulus G " is associated with the viscous energy dissipated per cycle. The ratio o f G " to G ' gives the tangent of the phase delay φ between the applied stress and strain response. The form of the general equation between stress and strain (and the values o f n and m) is determined by the mechanical complexity of a tested material. In general, when there are some observed relaxation processes in the studied material (m > 1) G'(a>) and G"(a>) depend on the frequency of oscillation. The case when n = m = 1, χ0 = 0 is termed a Maxwell liquid (a viscous material wi th the single relaxation time r, which depends only on the material parameters only). In this case
ιω τ G * = G(oo), (8)
1 + ιωτ
where G(°°) is the shear modulus obtained at ω φ » . The real and imaginary parts of shear modulus can be expressed as a pair of Debye functions (see the appendix). In the oscillation shear experiments we can vary ω keeping the material parameters constant (and thus τ = const). For a Maxwel l l iquid, τ = i7(0)/G(<») (where η(0) is the relaxed viscosity determined at ω Φ 0). As far as η(0) depends on temperature in a form of Arrhenius equation, the relaxation-time τ is also expressible by an Arrhenius equation
τ = r 0 exp (E/RT), (9)
where Τ is the absolute temperature, R is the universal gas constant, Ε is the activation energy [Nowick and Berry, 1972]. Thus it is possible to measure the complex shear modulus G*(CUT) and the complex shear viscosity Ύ]*(ωτ) simply by changing frequency ω and temperature T.
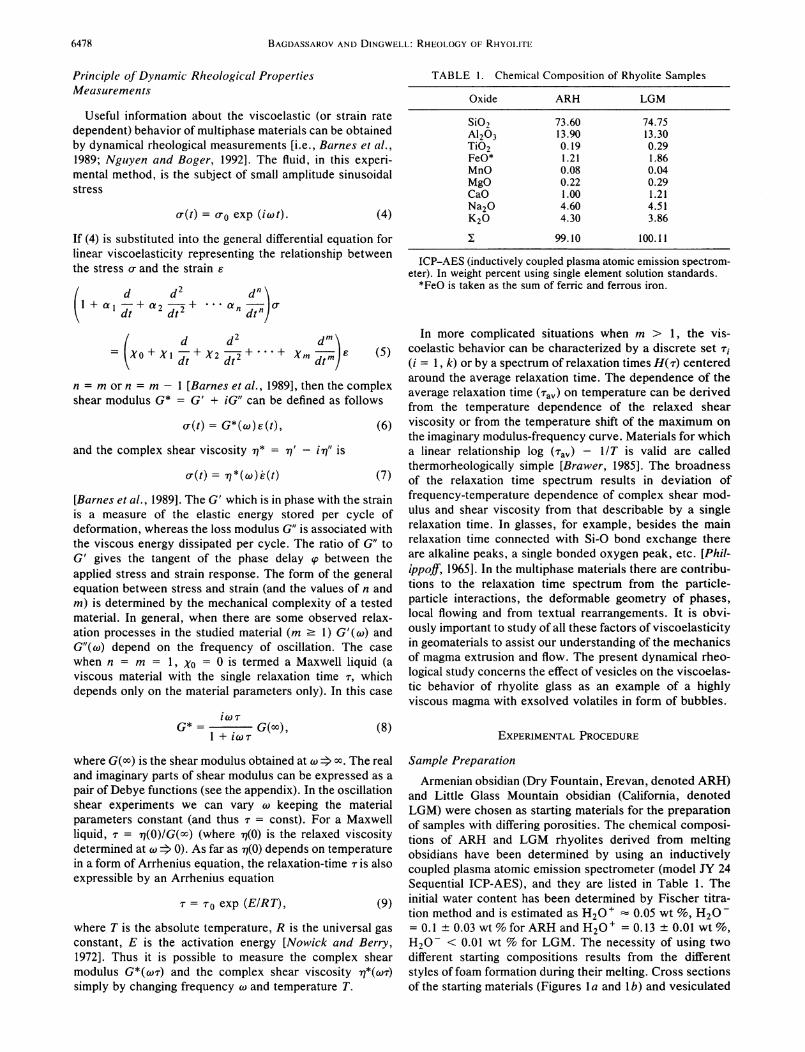
T A B L E 1. Chemical Composition of Rhyolite Samples
Oxide ARH LGM
SiO, 73.60 74.75 Al 2Ch 13.90 13.30 TiO. 0.19 0.29 FeO* 1.21 1.86 MnO 0.08 0.04 MgO 0.22 0.29 CaO 1.00 1.21 Na 2 0 4.60 4.51 K 2 0 4.30 3.86
X 99.10 100.11
ICP-AES (inductively coupled plasma atomic emission spectrometer). In weight percent using single element solution standards.
*FeO is taken as the sum of ferric and ferrous iron.
In more complicated situations when m > 1, the viscoelastic behavior can be characterized by a discrete set τ, (/ = 1, k) or by a spectrum o f relaxation times H(r) centered around the average relaxation time. The dependence o f the average relaxation time ( τ Η ν ) on temperature can be derived from the temperature dependence of the relaxed shear viscosity or from the temperature shift of the maximum on the imaginary modulus-frequency curve. Materials for which a linear relationship log ( r a v ) - I IT is valid are called thermorheologically simple [Brawer, 1985]. The broadness of the relaxation time spectrum results in deviation o f frequency-temperature dependence of complex shear modulus and shear viscosity from that describable by a single relaxation time. In glasses, for example, besides the main relaxation time connected wi th Si-O bond exchange there are alkaline peaks, a single bonded oxygen peak, etc. [Phil-ippoff, 1965]. In the multiphase materials there are contributions to the relaxation time spectrum from the particle-particle interactions, the deformable geometry o f phases, local flowing and from textual rearrangements. I t is obviously important to study of all these factors of viscoelasticity in geomaterials to assist our understanding of the mechanics of magma extrusion and flow. The present dynamical rheological study concerns the effect of vesicles on the viscoelastic behavior of rhyolite glass as an example o f a highly viscous magma wi th exsolved volatiles in form of bubbles.
EXPERIMENTAL PROCEDURE
Sample Preparation
Armenian obsidian (Dry Fountain, Erevan, denoted A R H ) and Li t t le Glass Mountain obsidian (California, denoted L G M ) were chosen as starting materials for the preparation of samples wi th differing porosities. The chemical compositions of A R H and L G M rhyolites derived from melting obsidians have been determined by using an inductively coupled plasma atomic emission spectrometer (model JY 24 Sequential ICP-AES), and they are listed in Table 1. The initial water content has been determined by Fischer titration method and is estimated as H 2 0 + « 0.05 w t % , H 2 0 " = 0.1 ± 0.03 wt % for A R H and H 2 0 + = 0.13 ± 0.01 w t % , H 2 0 ~ < 0.01 wt % for L G M . The necessity o f using two different starting compositions results from the different styles of foam formation during their melting. Cross sections of the starting materials (Figures \a and lb) and vesiculated

BAGDASSAROV AND DINGWELL: RHKOLOGY OF RHYOLITE 6479
J , £ v v V»A tf/^i (b)
· * *
• 4
(c) (d)
Fig. 1. Photos of sample cross section, (a) Armenian obsidian (starting material), (b) Little Glass Mountain obsidian (starting material), (c) ARH 10 vol % bubbles, (d) LGM 30 vol % bubbles.
samples studied in the torsion device (Figures l c and Id) have been analyzed using Tracor Nothern TN-8500® Image Analysis System combined with an optical microscope. The grey image from the videocamera has been processed into a binary image in order to perform statistical analysis. Both starting obsidians are charged with microlites. The A R H obsidian contains less than 3 vol % of randomly oriented pin-shaped microlites 2-3 μιτι in width and 8-10 μπι in length. The L G M obsidian initially contains 5-10 vol % of uniformly distributed microlites regularly oriented along the flow direction. They are ~3 μιτι in width and 30-50 μπι in length. Heating of obsidian samples containing water results in intensive volatile exsolution. During fusion of the obsidians the microlites play a role as centers for the heterogeneous nucleation of bubbles which has been observed experimentally by comparison of the vesiculation rate of obsidian samples. The lifetime of the foam is directly pro
portional to the initial concentration of microlites in obsidian sample. The porosity of quenched samples was determined from an Archimedean buoyancy determination and comparison wi th the density of bubble-free rhyolite. The variation of gas volume per unit rhyolite melt volume with time is described by the superposition of two exponentials, one describing the gas generation and one the release process. The foams wi th 30-70% porosity derived from melting L G M are stable for approximately 12 hours at 1200°C. Foamed samples o f L G M with less than 30% porosity and wi th a uniform distribution of bubbles are, however, difficult to produce. The A R H has a lower water content and fewer microlites, and it is practically impossible to obtain more than 10-15% porosity from this starting material. The A R H samples wi th 10% porosity are stable for —30-50 hours at 1200°C. The size distributions of bubbles in samples used in torsion experiments are shown in Figure 2.

6480 BAGDASSAROV AND DINGWELL: RHEOLOGY OF RHYOLITE
ARH (10% porosity)
(a) LGM (30% porosity)
Fig. 2. Bubble size distribution in samples, (a) Armenian rhyolite with 10 vol % bubbles, (b) Little Glass Mountain rhyolite with 30 vol % bubbles.
The measured average spherical particle size from planar images differs from real size (three-dimensional statistics). The usual way to describe the spatial density distribution function f(R) o f particle sizes from g(R) (the observed planar density distribution function of particle sizes) is by use of an empirical histogram [e.g., Cashman, 1990]. I f a h
b h and w{ are midpoints, upper limits, and width of size bins, then one has to solve the system of equations [Ripley, 1981]
wi9(ai) = a, 2 wjf(aj)/[m(bj - af)1/2], (10)
where (/(a,) are known and f(aj) are unknown. Here m is the first moment of the spatial distribution function and can be estimated as m Ä 7Γ/(2 Σ Ι/r,·), where r, are the measured planar diameters. The system of linear equations can be resolved by the back substitution procedure and the spatial size distribution f u n c t i o n / ( A , ) may be obtained. I f / ( f l / ) for some small bin is negative, the density for this bin and all smaller diameters are set to zero [Ripley, 1981]. This procedure has been applied to the results of our image analysis.
The average size of bubbles in A R H with 10% porosity and in L G M with 30% porosity are 15-25 μιη and 120-200 μπι, respectively. Differing porosity and size distribution functions in samples after heating reflects in part the size and volume fraction of bubble nucleation centers in these two
obsidians. For the preparation of bubble-free samples o f A R H , some chips of an obsidian cobble were melted at 1600°C in a M o S i 2 element box furnace in a 50-cm 3 P t 9 5 A u 5
crucible. The melt was stirred for —200 hours using a Pt 8 0 Rh 2 o viscometry spindle [Webb and Dingwell, 1990]. Cylindrical samples (8 mm in diameter and —30 mm in length) were cored from the crucible using diamond tools and the ends of the cylinders were ground flat. For the preparation of foamed samples, cylinders 8 mm in diameter and 20-25 mm in length have been cored from the obsidian cobble. These samples were next placed in Pt foil tubes (8 mm in diameter, thickness 0.03 mm, length 50 mm) and placed between two alumina rods (A 123, Frial i t -Degussi t®, 8 mm in diameter) in a Kanthal® wire-wound horizontal furnace. The free ends of alumina rods are fixed, such that during heating of the assembly, via thermal elongation o f the rods, a small axial load is exerted on the rods and the sample, and a good mechanical contact is thereby obtained between them. The assemblage was heated to 1100°C, held for 3 hours and cooled down slowly over 12 hours to room temperature. This procedure avoids cracking due to thermal stresses during cooling. Finally, the platinum jacket was carefully removed from the sample. The density of porous samples was determined from Archimedean buoyancy method (in toluol and air) at 22°C and then compared wi th bubble-free rhyolite (for the A R H p 0 = 2.335 g/cm 3 , for the L G M po = 2.337 g/cm 3 , lcr = 0.003 g/cm 3 ) .
Torsion Device
The torsion device used for viscosity measurements has been loaned to the Bayerisches Geoinstitut by H . Berck-hemer. For the detailed description of this apparatus and principle of shear modulus and internal friction measurements the reader is referred to the original articles of Berckhemer and coworkers [Berckhemer et al., 1982; Kampf mann, 1984; Kampfmann and Berckhemer, 1985]. Shear modulus measurements G at small angular deformation are based on the linear relationship between applied torque Τ and the resultant torsion angle a
G = 3277
rrd4a ' ( Π )
where / is the length of the specimen and d is the diameter. A simplified scheme of the torque Τ and the angle deformation a measurement is shown in Figure 3a. The forced oscillation torsion apparatus comprises a high-temperature horizontal Pt-Rh furnace ( / ) wi th an assembly consisting of a cylindrical sample (R) between two torsion alumina bars
Fig. 3a. A simplified scheme of the torsion device.

BAGDASSAROV AND DINGWELL: RHEOLOGY OF RHYOLITE 6481
( A L I and A L 2 ) . The temperature is measured by Pt-Pt^Rhjo (S-type) thermocouple. Forced harmonic oscillations are applied to the alumina rods and the sample by an electromagnetic moving coil system (M) attached to free end of the first alumina rod A L I ) . The opposite end of the other alumina rod (AL2) is rigidly fixed (T). The pair of aluminum wings (SI and S2) is attached perpendicular to the torsion bar. Iron plates at the ends of wings move in the air gaps of two pairs of capacitive pickups. The pickups are placed in an electric bridge, and the electrical signals of angular deformation are measured at two points of the torsion assemblage. One pair of pickups (S2) measures angular deformation of the alumina rod wi th the fixed end (AL2) , and the other one (SI) measures the total angular deformation of the sample plus two rods ( A L I + R + A L 2 ) .
The application of varying frequency harmonic oscillations (0.001-10 Hz) to the moving coil system (M) generates a torque. During each experiment the sinusoidal signals at two points (SI and S2) were measured. Two periods of each signal were stored in a digital form and later fitted to the theoretical sinusoid by a least squares method using a conjugate gradient method for the minimization procedure.
For each frequency, the amplitudes (SI and S2) and the phase delay γ between the two points of the torsion assemblage have been estimated (Figure 3b). Knowing the length between the points of measurement and the ends of the rhyolite sample ( L I ~ 186 mm and L2 ~ 190 mm) and the applied torque Γ, it is possible to estimate the angle of deformation in the alumina rods ( A L I and A L 2 ) . The angle of deformation R and phase delay φ in the sample have been calculated from the simple vector geometry shown in Figure 3b.
Calibration of Torsion Device
The applied torque Τ has been estimated from the amplitude of the electrical signal S2 and the calibration of the torsion assemblage before the dynamic measurements. This calibration consists of the stepwise application of static loads (steps o f torque = 2 x 10 ~ 3 Ν m) at one arm of the coil system (M) and measurement of the amplitude of the S2 signal. The angular deformation at two points (SI and S2) is determined from the linear relationship between the electrical signal and the corresponding geometric displacement of the aluminum wings (previously calibrated statically using the same procedure as for the torque calibration).
The precision of this method of shear modulus measurement has been checked using a single rod of alumina. The results of measurements (Figure 4) show that (within the
Shear Modulus of AL203 Mean Value G = 161 GPa
# 1
Fig. 4. The deviation of shear modulus measurements A1 2 0 3 from the mean value as a function of frequency at different temperatures.
error of phase delay measurement δφ = 10" 3 rad) the behavior of the alumina rods is purely elastic and the shear modulus (G = 161 ± 3 GPa) is independent o f frequency (10-0.001 Hz) and temperature (22°-1000°C). The torque applied during dynamic experiment is ~10~~3 Ν m; the measured amplitude of the twist deformation between SI and S2 is ~ 1 0 ~ 5 rad.
The thermal gradient of the furnace has been measured in the temperature steps of 100°C. On the basis of the measured temperature distribution along the alumina rods the relationship d2
A\2Q^(T°C) ** d2
AU0^22°C) x (1 + 2.5 x 10~ 5 T C ) f o r the mean diameter dAUOy at any temperature has been derived. The accuracy of shear modulus measurements in rhyolite is estimated as —8%, stemming both from uncertainties in length and diameter of the rhyolite sample at high temperatures and from uncertainties in the torque and the torsion displacement.
In order to analyze the deformation of bubbles after experiment, the cross sections of samples have been studied with the help of reflection light microscope. N o change in sphericity or preferable orientation of bubbles has been observed. The maximum strain of sample did not exceed 10~ 3 rad, and the twist deformation used in experiments was reversible. Thus it would be difficult to observe the result of viscous deformation of bubbles (10-100 μπ\ in size) in these samples after experiment.
EXPERIMENTAL RESULTS
Shear Viscosity
The torsion measurements have been carried out in the frequency range 10-0.005 H z (with steps of 0.3 log Hz) and temperature range 600°-900°C (with steps of 25°C). The measurements yield values of the absolute value of complex shear modulus G*M and phase shift φ(ώ) (between applied torque and resultant angle deformation) for each temperature. From these data set the real (G ' ) and imaginary (G") components of shear modulus have been calculated
Amplitude of signal in phase with S 2 ( and the applied stress)
Fig. 3b. The principle of torsion deformation measurement.
G'M = GM* cos [ψΜΙ
G"M = GM* sin [φMl (12)

6482 BAGDASSAROV AND DINGWELL: RHEOLOGY OF RHYOLITE
Armenian Rhyolite ( 0% porosity) 13 . _ . —
12 -
6 I ' • • 1
0.01 0.1 1 10 100
ω, rad/sec _ » _ 9 0 8 » C _ * _ 8 8 3 ° C _ * _ 8 5 8 ° C _ B _ 8 3 4 ° C 8 1 0 ° C 7 8 2 ° C
Fig. 5a. The results of viscosity measurements from the forced torsion oscillation method. Real part of shear viscosity as a function of ω.
The frequency dependent real and imaginary parts of shear viscosity can be calculated from G' and G" using the expressions
η'(ω) = G"((o)Io) Ύ]{ω)" = G'(ω)Ι ω, (13)
where ω = lirf and / is an oscillation frequency in hertz. The experimental data for the real and imaginary compo
nents of shear viscosity are illustrated in Figures 5a and 5b. With decreasing frequency the real component of the shear viscosity increases and reaches the relaxed value η(0) (Figure 5a). These values for viscosity are plotted as a function of I IT in Figure 6.
The value of the relaxed shear viscosity for the rhyolite samples with 0, 10, and 30 vol % porosity has been also measured using parallel plate viscometry methods described previously [Bagdassarov and Dingwell, 1992] and micropen-etration method [Dingwell et al., 1992] using a commercial dilatometer (Model T M A 402®, Netzsch Geratebau, Selb, Germany). The Arrhenius temperature dependence of the relaxed shear viscosity is independent of porosity. The activation energy is 416 ± 14 kJ/mol. The presence of deformable bubbles affects only the effective shear viscosity, not the activation energy of viscous flow. Measurements of the relaxed shear viscosity derived from torsion and from parallel plate/micropenetration methods are within the mutual experimental uncertainties.
Armenian Rhyolite ( 0% porosity) 12 ι ,
8 I : 1 1 1 1 0.001 0.01 0.1 1 10 100
_ e _ 9 1 4 C ^ _ 8 8 8 C _ * _ 8 6 0 C _Q_ 8 3 5 C _ ^ _ 8 1 0 C 7 8 7 C
Armenian Rhyolite ( 10% porosity) 11.5 ι .
7.5 -
7 I 1 ί 1 1 0.01 0.1 1 10 100
_ ^ _ 9 1 2 C _ * _ 8 8 8 C _ A _ 8 6 2 C _ e - 8 3 6 C _ 0 _ 8 O 9 C _ a _ 7 8 4 C
Little Glass Mountain ( 30% porosity) 11 . ,
10.5 -
7 -
6.5 I 1 1 1 1 0.01 0.1 1 10 100
_ ^ W C _ * _ 8 8 3 ° C _+_%5&C _ B _ 8 3 4 ° C ^ _ 8 1 0 " C 7 8 2 ° C
Fig. 5b. Same as Figure 5a, except imaginary part of shear viscosity as a function of ω.

BAGDASSAROV AND DINGWELL: RHEOLOGY OF RHYOLITE 6483
Shear Modulus
The data for G' and G" at different frequencies and temperatures have been reduced to a master curve via the dimensionless variable ωτ, where τ is the relaxation time given by an Arrhenius equation (9). In this expression, τ 0 ~ T; (0) /G(^) is the Maxwell relaxation time or effective characteristic time of viscoelastic behavior [Dingwell and Webb, 1989]. G ( ° c ) is taken from torsion experiments at high frequencies and low temperatures; η(0) is relaxed viscosity measured at high temperature and slow strain rate (Figure 6). For Armenian rhyolite without bubbles G O ) is 25.8 ± 2.1 GPa, for the sample with 10% porosity G ( » ) = 13.1 ± 1 GPa, and for the sample of L G M with 30% of porosity, G(oo) = 11.8 ± 0.9 GPa.
The real and imaginary shear moduli measured at different frequencies and temperatures are plotted in Figure 7. For all three samples the behavior of the complex shear modulus differs significantly from a Debye relaxation function. With increasing bubble content the form of the imaginary component of the shear modulus becomes more symmetrical. The asymmetrical character of imaginary component extending to the high-frequency/low-temperature range indicates non-Debye relaxation of shear stress. The relative amplitude of ξ = G"(ö>) m a x /G (oo) obtained in experiments is much less than 0.5 as it should be for a Debye relaxation function. For a β exponent relaxation function (see the appendix),
G ( r ) ~ G ( 0 ) e x p [ - ( f / T ) * ] (14)
ξ = 0.28 when β = 0.5 and 0.22 when β = 0.4. In the case of 0% porosity ξ - 0.28, for 10% ξ = 0.26, for 30% porosity ξ = 0.25. Theoretically, the shift of the G"(wr) maximum from ω τ = 1 for β - 0.5 should be -0 .3 l o g 1 0 units. In the case of rhyolite melt wi th 0% porosity the measured shift is ~ -0 .4 log io units, 10% porosity - -0.15 log JO units, 30% porosity ~ -0.05 l o g 1 0 units. The relaxation process in rhyolite melt without bubbles can be effectively described by the β exponent relaxation wi th β ~ 0.5.
Internal Friction
Viscoelastic behavior of materials is often expressed as the internal friction or the inverse of the mechanical quality factor β - 1 (ω)
Armenian Rhyolite (0% porosity)
/ ••• Jym
N \ α
- 3 - 2 -1 0 1 2 3 4 5 Armenian Rhyolite (10% porosity)
-
Λ 2
- 3 - 2 -1 0 1 2 3 4 5 Little Glass Mountain (30% porosity)
10
as CL. Ο d
5 Δ
1
/ i s '
0 - 3 - 2 -1 0 1 2 3 4 5
Log ω χ a Real part (exp.) φ Imaginary part (exp.)
^ Real part (Debye func.) 2 Imaginary part (Debye func.)
Fig. 7. Complex shear modulus as a function of ωτ. {a) ARH 0% porosity, (b) ARH 10 vol % bubbles, (c) LGM 30 vol % bubbles.
SHEAR AND LONGITUDINAL VISCOSITIES Activation Energy Ε = 416 kJ/mol
12
A ^
***
• ^
A A ^
+
^ A —
0.84 0.86 0.88 0.9 0.92 0.94 0.96 xlOOO 1A\K
B A R H 0% porosity, dil. φ A R H 0 % porosity, tors. A A R H 10% porosity, dil.
x A R H 10% porosity, tors. + L G M 30% porosity, dil. A L G M 30% porosity, tors.
Fig. 6. Relaxed shear viscosity as a function of temperature.
ρ _ , ( ω ) = G"{ü))IG'(a>) = tan [φ(ω)] (15)
[cf. Nowick and Berry, 1972]. The present experimental results for β - 1 measurements in rhyolite samples as a function of ωτ are presented in Figure 8. In the frequency-temperature range ωτ > 1 the dependence of ζ>~\ωτ) ~ 1 / ( ω τ ) 0 · 5 . The relaxation behavior of the shear modulus can be described by a stretched exponential function. The phenomenon is a well-known observational fact from the viscoelastic behavior of melts near the glass transition [cf. Hopkins and Kurkjian, 1965; Sinning and Haessner, 1987]. The broad spectrum of relaxation rates in the range ωτ > 1 is attributed to microscopic structural heterogeneities. In silicate melts near the glass transition, different possible structural environments can exist that result in different relaxation rates for local structural rearrangements [Jackie, 1987]. In the sample wi th 0% porosity in the frequency-temperature range ωτ < 1 the dependence of β - 1 on normalized fre-

6484 BAGDASSAROV AND DINGWELL: RHEOLOGY OF RHYOLITE
Armenian Rhyolite (0% porosity)
a
m Qe'x 1 - Q i c . ~ ^ Armenian Rhyolite (10% porosity)
2 — Qcalc (ωτ)°·
ι
Ο ο·1
0.01
0.001
b
-
-
2—Qä w (ωτ)»-8
Little Glass Mountain (30% porosity) (ωτ)°
c
(ωτ)° (ωτ)°
Fig. 8. Internal friction as a function of ωτ. (a) ARH 0% porosity, (b) ARH 10 vol % porosity, (c) 30 vol % porosity.
relaxation functions more stretched in the lower frequency range. The difference in asymptotic slopes ( - 1 and -0 .5 ) of log ( β 1 ) versus log (ωτ) in two extreme cases (ωτ +<» and ω τ φ - » ) demonstrates the contribution of anelastic behavior of the bubble-free melt at ωτ > 1. For the bubble-bearing melt the anelastic contribution is significant at ωτ < 1 that results in less difference of the asymptotic slopes. The broader size distribution of heterogeneities presented in the melt the closer is the slope of log ( β - 1 ) versus log (ωτ) to -0 .5 at ωτ< 1.
Relaxation Spectrum
The experimental data for the complex shear moduli have been used for the calculation of a relaxation time distribution. The relaxation spectrum Η [log (τ)] is the contribution to the shear modulus G* which is associated wi th the structural relaxation processes having characteristic times lying between log (τ) and log (τ) + d [log (τ)] [Nowick and Berry, 1972]. To calculate Η (τ) from the experimental data of shear storage ( G ' ) or of shear loss (G") modulus a first approximation can be used [cf. Philippoff, 1965]
Η(τ) 0"(ω),
d In [ G ' ( o 0 ]
(17)
d In (ω)
The results of relaxation spectrum approximations are shown in Figure 9. The quality of data does not permit a more precise deconvolution of the relaxation spectrum or estimation of a characteristic time of bubble deformation during shear. The consistent feature of our spectra is that the asymmetrical form extended intQ the range of short relaxation times. The theoretical stress relaxation spectrum for β exponent low has an asymmetrical form [Hopkins and Kurkjian, 1965]. For β - 0.5 the analytical expression for the spectrum is
Η(τ)~[(τ/τ0)]1ί2 exp [ - τ / ( 4 τ 0 ) 1 (18)
The maximum of this function is shifted by 0.3 log into the faster relaxation range (τ < r 0 ) . Thus the form and the position of relaxation spectra maximum obtained from experiments on rhyolite without bubbles correspond to expression (18).
The relaxation spectra of bubble-bearing samples are asymmetrical and shifted in the range of slower relaxation times relative to that of the bubble-free sample.
quency (ωτ) is —l/ωτ, i.e., that for a Maxwell liquid wi th a single relaxation time. Thus the relaxation function at these temperatures and frequencies is close to the Debye function. For the samples containing bubbles in the range of ωτ < 1, the internal friction varies as
β _ 1 ( ω τ ) ~ \/(ωτ)η, (16)
where η = 0.8 for the 10% porosity, η = 0.65 for the 30% porosity. This means that in the range ωτ < 1 the relaxation is non-Debye for vesicular rhyolite presumably because of presence of deformable inclusions. Thus, in general, the presence of these macroscopic heterogeneities makes the
DISCUSSION
Non-Debye Relaxation in Bubble-Bearing Melt
The asymmetric form of the imaginary part of the shear modulus, wi th the maximum <0.5 G(<») shifted to the low frequency, indicates an essentially non-Debye relaxation of shear stresses in all three samples (see the appendix). The non-Debye relaxation of silicate melts at ωτ > 1 has already been noted experimentally [cf. Hopkins and Kurkjian, 1965] and at the present moment is a subject of great interest [ i .e . , Angell, 1991; Moynihan et al., 1991].
The non-Debye relaxation could result, in principle, from one of several factors all of which stem from the nonexpo-

BAGDASSAROV AND DINGWELL: RHEOLOGY OF RHYOLITE 6485
Armenian Rhyolite (0% porosity)
-3 - 2 - 1 0 1
Armenian Rhyolite (10% porosity)
- 2 - 1 0 1
Little Glass Mountain (30% porosity)
W ( t ) = j G " ( c o ) / / ( T ) = 1 . 1 7 6 G W '°f Η (T) = 0 . 5 ^ e x p ( - - i - ) π d log( ω ) V πτ„ 4χ ο
Fig. 9. Relaxation spectrum, (a) ARH 0 % porosity, (b) ARH 10 vol % porosity, (c) LGM 30 vol % porosity.
nential and/or the nonlinear character of structural relaxation in glasses [Moynihan et al., 1991]. First, for the normalization of the dimensionless variable ωτ we have used an Arrhenius relationship (9) (i.e., a linear relationship between log (r) and I IT). In reality, this linear relationship may be valid only for the limited temperature range of investigation. For some glasses at low Τ this is clearly the case [Hopkins and Kurkjian, 1965]. Using the Arrhenius relationship instead of non-Arrhenius dependence of viscosity could thus result in underestimation of relaxation times at lower temperatures. This would, in turn, extend the relaxation function in the range of ωτ > 1. However, measurements of the viscosity-temperature relationship of L G M and A R H in the temperature range of the present experiments indicate a strictly Arrhenian viscosity-temperature relation
ship (expected for ' 's trong' 1 liquids or those with self-reinforcing tetrahedral network structures whose configura-tional entropy is resistant to change wi th increasing temperature [Angell, 1991]). Thus a non-Arrhenian viscosity-temperature relationship does not in our case appear to be the source of the obtained stretched relaxation function.
A n alternative explanation for the noticeable deviation of the complex shear modulus from the Debye relaxation function is the existence of a distribution of relaxation times at high frequencies and low temperatures (ωτ > 1). Each relaxation time contribution to the relaxation time spectrum could then relate to an individual relaxation process with its own activation energy. In fact, many relaxation processes in disordered systems are characterized by a distribution of activation energies [Dattagupta, 1987]. Thus the procedure of using the dimensionless variable ωτ based on a single activation energy is a simplification.
In a inhomogeneous material a distribution of relaxation times arises from the presence of defects (random walkers) which wander through the liquid in Brownian motion [Jackie, 1986]. In general, the presence of small scale particles (with size a) suspended in a viscous liquid (η5) results in the characteristic relaxation time related to the reorientation and translational motion of a particle of neutral buoyancy
kT (19)
where kT is the thermal energy scaling factor [Landau and Lifshitz, 1987]. Actually, r i n (19) is the time over which the particle of a size a can move over the distance comparable to its size. This relationship can be applied to the relaxation of structural perturbation in a molecular system [Angell, 1991]. Local structural heterogeneities in silicate melts can play the role of short time elements contributing to the stress relaxation spectrum at relaxation time (19). A certain size distribution of structural defects contributes to the relaxation at high frequencies and low temperatures in proportion to concentration [Angell, 1991]. The freezing of micro-sized inhomogeneities occurs at temperatures slightly below the glass transition (ωτ = 1) of the matrix and that makes the relaxation function different from the Debye type (see the appendix).
The results obtained on shear modulus, internal friction, and relaxation spectrum reveal the significant deviation of viscoelastic behavior of bubble-free and vesicular rhyolite glasses from the Debye type of relaxation. The difference in relaxation spectra between the sample without bubbles and the porous samples can be explained by a simple shift factor in the dimensionless variable ω τ 0 (or a decrease of effective viscosity). Thus the measured effective relaxation time r 0
decreases with increasing bubble content, reflecting the decrease of the effective viscosity and shear modulus due to the presence of deformable cavities.
Volume Viscosity of Bubble-Bearing Melt
The difference of shear viscosity values (η5) obtained from torsion and longitudinal viscosity (τ)λ /3) dilatometric studies (Figure 6) relates to the volume viscosity of porous samples. For the rhyolite wi th 0 vol % porosity this difference is within the uncertainties of measurements. I f the longitudinal viscosity is equal to the shear viscosity, i t means that for a homogeneous melt, volume viscosity is infinite (3).

6486 BAGDASSAROV AND DINGWELL: RHEOLOGY OF RHYOLITE
With increasing bubble content the difference between shear and longitudinal viscosities increases, but still this difference is comparable with the experimental uncertainties. Nevertheless, qualitatively we can state that the volume viscosity of bubble-bearing melt decreases with the porosity and has the same temperature dependence as the shear viscosity. This is consistent wi th theoretical dependence of volume viscosity from porosity
4η,(\-φ) Vv~z τ (20)
3 φ
[Prud'homme and Bird, 1978].
Volcanological Application
Our relaxed viscosity measurements show a decrease of viscosity wi th increase in bubble content. Recent experiments at high strain rates and higher total strains [Stein and Spera, 1992] have revealed an increase of shear viscosity with bubble content. The behavior of bubbles in a shear flow is complicated because bubbles can accommodate viscous stresses through deformation [Bentley and Leal, 1986]. There are two different time scales in a shear flow of bubble-bearing melt. The first is given by rs = the so-called structural relaxation time of the melt. The second time scale characterizes the response of vesicles to the viscous stresses [Bentley and Leal, 1986]. This is characteristic time rb of the viscous deformation of bubbles (i.e., time scale of the departure of an inclusion from sphericity with radius R) is
rB~T)sRla (21)
[Schowalter et al., 1968], where σ is the interfacial surface tension which is poorly constrained for the temperatures under consideration here.
In the case of a high-temperature melt (η5 ~ 10 5 Pa s), TS
~ 10" 5 s and rb ~ 10-100 s for R 10-100 μπ\ and σ - 0.1 N/m [Khitarov et al., 1979]. I f the shear flow time scale ε~χ
is greater than rb, the bubbles w i l l respond rigidly to the viscous stresses deforming their shape. The viscosity of a vesicle suspension in magma should increase wi th the bubble volume increase. The viscoelastic response of the bubble-bearing melt in this range is shear viscosities is due to the elastic behavior of bubbles since the surface tension of melt tends to keep their spherical form. In relatively slow shear flow (ε < r b
] ) the viscosity of bubble suspension wi l l depend also on total strain of shear flow since at large deformations the bubbles in the melt begin to burst and change their size, leading to a time dependent viscosity in shear flow. Since the viscous stresses in melt relax instantaneously in comparison wi th bubble deformation (rb » TS), even the presence of deformable bubbles leads to the shear viscosity increase [Stein and Spera, 1992].
In the case under consideration here, TS ~ 1-10 2 s and rb
~ 1 0 3 - 1 0 4 s i f the surface tension is σ ~ 1 N / m . (There are no experimental data on the surface tension in glasses at low temperatures. This value can be roughly estimated from the comparison with the surface energy of solids.) A t the lowest strain rate (10~ 3 s~ [) that was used in our experiments the regime of viscous bubble deformation may be achieved. The relaxation time scale of viscous stresses in the melt and the bubble deformation time scale are closer to each other than in the case of a high-temperature melt (rb > TS). The relaxation of viscous stresses in the melts investigated in this
study is much slower than at high temperatures. As a result of these facts, the viscous deformation of cavities contributes to the effective viscosity of suspension, and this effect is progressive with bubble content increase. At the lowest strain rate they behave during the shear flow as practically immobile deformable cavities (embedded in a surrounding liquid). The dependence of β - 1 (ωτ) tends to be ~ 1 / ( ω τ ) Μ
(η < 1) over the wide range ωτ. Implicitly, this means a broader interval of ωτ where anelastic properties of melts are expected. Thus magmas having crystals, vesicles, or other heterogeneities varying in size should possess a broader stress relaxation spectrum than homogeneous melts. Flowing magma wil l reveal the rate dependent rheology and may respond to the different type of deformation with a different rheology.
The flow process of magma can on the basis of the above be distinguished into two types. First, when the strain rate of a volcanic process is greater than τζλ (e.g., volcanic explosions, flow in a magma conduit caused by gas release, etc.), the viscosity of vesicular magmatic melts wi l l increase wi th bubble content. Secondly, in slow geological processes (flowing and simultaneous cooling on the surface, slow extrusion, growth of domes, etc.), the viscosity w i l l decrease with the volume fraction of vesicles.
The contrasting rheology of vesicular melt in this study to that observed by Stein and Spera [1992] underlines the importance of comprehensive rheology investigation of dispersed systems relevant to magmatic processes. Only by accessing a complete enough set of experimental conditions of strain, strain rate, and porosity can the rheology of vesicular (and other disperse) systems be understood in its entirety.
CONCLUSIONS
The present study of shear viscosity of rhyolite melts with differing degrees of porosity has shown the following:
1. The torsion forced oscillation is useful for shear viscosity measurements o f bubble-bearing melts. Many other methods (parallel plate, fiber elongation, etc.) involve the measurements of a combination of shear and volume viscosity, and the interpretation of obtained results is always thereby complex [Bagdassarov and Dingwell, 1992]. Combination of the torsion method with compression permits evaluation of the volume viscosity of the bubble-bearing melts.
2. The relaxed shear viscosity of bubble-bearing rhyolite melt decreases wi th volume fraction of bubbles. The activation energy of viscous flow in rhyolite melt and in vesicular melt remains unchanged (—416 ± 14 kJ/mol).
3. The internal friction Q _ 1 plotted on a double-log plot versus the dimensionless variable ctrrhas different slopes above and below the glass transition. Below the glass transition the slope Q~l versus ωτ in a double-log scale is -—0 .5 and is independent of porosity. Above the glass transition the slope depends on the bubble content and equals - 1 for 0% porosity, -0.8 for 10% porosity, and -0.65 for 30% porosity.
4. The relaxation spectrum of shear stresses exhibits an asymmetrical distribution. The shift of the main relaxation time τ 0 , around which the distribution of relaxation times is centered, wi th respect to the Maxwell relaxation time is proportional to the volume fraction of bubbles.
5. The present work in combination with previous study of Stein and Spera [1992] illustrates that the magma viscosity can either increase or decrease wi th the bubble content depending upon the conditions (strain rate, type of deformation) of deformation during the magmatic flow.

BAGDASSAROV AND DINGWELL: RHEOLOGY OF RHYOLITE 6487
APPENDIX
The Debye relaxation of a single internal variable ξ comes from the first-order kinetic equation
άξ/ώ= - ( 1 / τ ο ) ( £ - ? ) , ( A l )
where f is the equilibrium value of ξ, τ is the proportionality constant called relaxation time [i .e. , Nowick and Berry, 1972]. The solution of this equation is
ξ = ? 0 [ 1 - exp ( - / / r 0 ) ] , (A2)
which is called the Debye relaxation or single relaxation time behavior.
I f the internal variable ξ oscillates with time as ~ elb}t, then it depends on frequency ω as follows:
ξ(ω) = ξ'(ω) + /Πω), (A3)
where ξ (ω) ~ C{ + C 2 ( w r ) 2 / [ 1 + ( ω τ 0 ) 2 ] and ξ1 (ω) ~ C2
ωτ 0 / [ 1 -I- ( ω τ 0 ) 2 ] , Cx and C 2 are constants, ξ is called a Debye dynamic relaxation function; ξ is called a Debye peak [Nowick and Berry, 1972] or a pair of Debye functions.
I f the relaxation rate of a property ξ is not linear, for instance, in the expression ( A l ) instead of time independent parameter τ 0 , we put (r0t)l~ß (where β < 1) the functional form of relaxation wi l l be as follows:
f W ~ e x p ( - [ f / T 0 ] * ) , (A4)
which is called stretched exponent relaxation function. The case of β = 1 corresponds to single relaxation time behavior (A2). The physical meaning of ß-relaxation is not obvious, except it is helpful to fit the experimental data. It seems to be useful for the effective description of the relaxation behavior of materials with the spectrum of relaxation-times. In this case the parameter β is a relative measure for the broadness of relaxation spectrum of the measured property ξ [Brawer, 1985].
Acknowledgments. This work was supported by the Visiting Program of the Bayerisches Geoinstitut and by the Alexander von Humboldt Foundation. The authors are grateful to J. Fink (Arizona State University, Tempe) for the sample of Little Glass Mountain obsidian, to A. Dorfman (Vernadsky Institute, Moscow) for the sample of Armenian obsidian (Erevan, Dry Fountain). The authors thank H. Berckhemer for discussion, K. Klasinski for development of electronic equipment and software of the torsion device, S. Webb for instruction in its use and comments on the manuscript, R. Knoche for micropenetration measurements, D. Krausse for micro-probe analysis, G. Gollner and A.-M. Dietel for chemical analysis, H. Schulze for preparation of the samples, and G. Hermannsdörfer for technical assistance.
REFERENCES
Angell, C. Α., Relaxation in liquids, polymers and plastic crystals— strong/fragile patterns and problems, J. Non Cryst. Solids, 131-133, 13-31, 1991.
Bagdassarov, N. S., and D. B. Dingwell, Rheological investigation of vesicular rhyolite, / . Volcanol. Geotherm. Res., 50(2), 307-322, 1992.
Barnes, Η. Α., J. F . Hutton, and K. Walters, An Introduction to Rheology, pp. 46-51, Elsevier, New York, 1989.
Bentley, B. J . , and L . G. Leal, An experimental investigation of drop deformation and breakup in steady, two-dimensional flows, J. Fluid Mech., 167, 241-283, 1986.
Berckhemer, H. , W. Kampfmann, and E . Aulbach, Anelasticity of mantle rocks near partial melting, in High-Pressure Researches in Geoscience, edited by W. Schreyer, pp. 113-132, E . Schweizer-bart'sche, Stuttgart, Germany, 1982.
Brawer, S., Relaxation in Viscous Liquids and Glasses, 220 pp., American Ceramic Society, Columbus, Ohio, 1985.
Cashman, Κ. V., Textural constraints on the kinetics of crystallization of igneous rocks, in Modern Methods of Igneous Petrology: Understanding Magmatic Processes, edited by J. Nicholls and J. K. Rüssel, Rev. Mineral., 24, 259-314, 1990.
Chen, H.-S., and A. Acrivos, The effective elastic moduli of composite materials containing spherical inclusions at non-dilute concentrations, Int. J. Solids Structure, 14, 349-364, 1978.
Dattagupta, S., Relaxation Phenomena in Condensed Matter Physics, pp. 298-300, Academic, San Diego, Calif., 1987.
Dingwell, D. Β., and S. L . Webb, Structural relaxation in silicate melts and non-Newtonian melt rheology in geological processes, Phys. Chem. Miner., 16, 508-516, 1989.
Dingwell, D. B., R. Knoche, S. L . Webb, and M. Pichavant, The effect of B ? 0 3 on the viscosity of haplogranitic liquids, Am. Mineral., 17, 457-461, 1992.
Hopkins, I. L . , and C. R. Kurkjian, Relaxation spectra and relaxation processes in solid polymers and glasses, in Physical Acoustics: Principles and Methods, vol. 2, Part B, edited by W. P. Mason, pp. 91-164, Academic, 1965.
Jackie, J . , Models of the glass transition, Rep. Prog. Phys., 49, 171-231, 1986.
Jackie, J . , Theory of glass transitions. New thoughts about old facts, Philos. Mag. B, 56(2), 113-127, 1987.
Kampfmann, W., Laborexperimente zum elastischen und anelastischen Verhalten hochtemperierter magmatischer Gesteine im Frequenzbereich seismischer Wellen, Ber. Inst. Meterol. Geophys. Univ. Frankfurt Main, 47, 138 pp., 1984.
Kampfmann, W., and H. Berckhemer, High temperature experiments on the elastic and anelastic behavior of magmatic rocks, Phys. Earth Planet. Inter., 40, 223-247, 1985.
Khitarov, Ν. I . , Ε. B. Lebedev, A. M. Dorfman, and N. S. Bagdassarov, Effects of temperature, pressure and volatiles on the surface tension of molten basalt, Geochem. Int., 16, 78-86, 1979.
Landau, L . D., and Ε. M. Lifshitz, Fluid Mechanics, Course of Theoretical Physics, vol. 6, Hydrodynamics, 2d ed., 730 pp., Pergamon, New York, 1987.
Moynihan, C. T., S. N. Criston, and S. M. Opalka, Linear and non-linear structural relaxation, J. Non Cryst. Solids, 131-133, 420-434, 1991.
Nguyen, Q. D., and D. V. Boger, Measuring the flow properties of yield stress fluids, Anmu Rev. Fluid Mech., 24, 47-88, 1992,
Nowick, A. S., and B. S. Berry, Anelastic Relaxation in Crystalline Solids, 678 pp., Academic, San Diego, Calif., 1972.
Philippoff, W., Relaxation in polymer solutions, liquids, and gels, in Physical Acoustics: Principles and Methods, vol. 2, part B, edited by W. P. Mason, pp. 1-90, Academic, San Diego, Calif., 1965.
Prud'homme, R. K. , and R. B. Bird, The dilatational properties of suspensions of gas bubbles in incompressible Newtonian and non-Newtonian fluids, J. Non Newtonian Fluid Mech., 3, 261-279, 1978.
Ripley, B. D., Spatial Statistics, pp. 208-212, John Wiley, New York, 1981.
Schowalter, W. R., C. E . Chaffey, and H. Brenner, Rheological behavior of a dilute emulsion, J. Colloid Interface Sei., 26, 152-160, 1968.
Sinning, H.-R., and F . Haessner, Determination of the glass transition temperature of metallic glasses by low-frequency internal friction measurements, J. Non Cryst. Solids, 93 , 53-66, 1987.
Stein, D. J . , and F . J. Spera, Rheology and microstructure of magmatic emulsions: Theory and experiments, J. Volcanol. Geotherm. Res., 49(3/4), 157-174, 1992.
Sura, V. M., and P. C. Panda, Viscosity of porous glasses, J. Am. Ceram. Soc, 73(9), 2697-2701, 1990.
Webb, S. L . , and D. B. Dingwell, Non-Newtonian rheology of igneous melts at high stresses and strain rates: Experimental results for rhyolite, andesite, basalt and nephelinite, / . Geophys. Res., 95, 15,695-15,701, 1990.
N. S. Bagdassarov and D. B. Dingwell, Bayerisches Geoinstitut, Universität Bayreuth, Postfach 101251, W-8580, Bayreuth, Germany.
(Received January 31, 1992; revised October 28, 1992;
accepted November 12, 1992.)