JOURNAL OF CONDENSED MATTER NUCLEAR SCIENCElenr-canr.org/acrobat/BiberianJPjcondensedi.pdf ·...
76
JOURNAL OF CONDENSED MATTER NUCLEAR SCIENCE Experiments and Methods in Cold Fusion VOLUME 10, January 2013 Proceedings of the ICCF 16 Conference, February 6–11, 2011, Chennai, India
Transcript of JOURNAL OF CONDENSED MATTER NUCLEAR SCIENCElenr-canr.org/acrobat/BiberianJPjcondensedi.pdf ·...

JOURNAL OF CONDENSEDMATTER NUCLEAR SCIENCE
Experiments and Methods in Cold Fusion
VOLUME 10, January 2013
Proceedings of the ICCF 16 Conference,February 6–11, 2011, Chennai, India
JOURNAL OF CONDENSED MATTER NUCLEAR SCIENCE
Experiments and Methods in Cold Fusion
Editor-in-ChiefJean-Paul BiberianMarseille, France
Editorial Board
Peter HagelsteinMIT, USA
Xing Zhong LiTsinghua University, China
Edmund StormsKivaLabs, LLC, USA
George MileyFusion Studies Laboratory,University of Illinois, USA
Michael McKubreSRI International, USA
Akito TakahashiOsaka University, Japan
JOURNAL OF CONDENSED MATTER NUCLEAR SCIENCE
Volume 10, January 2013
© 2013 ISCMNS. All rights reserved. ISSN 2227-3123
This journal and the individual contributions contained in it are protected under copyright by ISCMNS and the followingterms and conditions apply.
Electronic usage or storage of data
JCMNS is an open-access scientific journal and no special permissions or fees are required to download for personalnon-commercial use or for teaching purposes in an educational institution.
All other uses including printing, copying, distribution require the written consent of ISCMNS.
Permission of the ISCMNS and payment of a fee are required for photocopying, including multiple or systematiccopying, copying for advertising or promotional purposes, resale, and all forms of document delivery.
Permissions may be sought directly from ISCMNS, E-mail: [email protected]. For further details you mayalso visit our web site: http:/www.iscmns.org/CMNS/
Members of ISCMNS may reproduce the table of contents or prepare lists of articles for internal circulation within theirinstitutions.
Orders, claims, author inquiries and journal inquiries
Please contact the Editor in Chief, [email protected] or [email protected]
J. Condensed Matter Nucl. Sci. 10 (2013) 1–71
JOURNAL OF CONDENSED MATTER NUCLEAR SCIENCE
Volume 10 2013
©2013 ISCMNS. All rights reserved. ISSN 2227-3123
CONTENTS
PREFACE
RESEARCH ARTICLES
Characteristics and Energetics of Craters in LENR Experimental Materials 1David J. Nagel
From the Naught Orbit to the 4He Excited State 15A. Meulenberg
Protocol for a Silicate-based LENR Using Electrodes of Various Metals 30Brian P. Roarty and Carol J. Walker
An Introduction to the Pico-chemistry Working Hypothesis 40Jacques Dufour
Effect of Forced Oxidation on Hydrogen Isotope Absorption/Adsorption Characteristicsof Pd–Ni–Zr Oxide Compounds
46
Yuki Miyoshi, Hideyuki Sakoh, Akira Taniike, Akira Kitamura, Akito Takahashi, Reiko Setoand Yushi Fujita
Recent Advances in Deuterium Permeation Transmutation Experiments 63Y. Iwamura, T. Itoh, N. Yamazaki, H. Yonemura, K. Fukutani and D. Sekiba
PREFACE
This is the tenth volume of the Journal of Condensed Matter Nuclear Science. This volume of JCMNS contains thesecond and final set of six papers presented at the ICCF 16 conference held in Chennai during February 2011; thesepapers too have been duly peer reviewed before being accepted for publication in this volume. The printed volume ofthe ICCF 16 conference proceedings comprises 28 papers of major importance and is currently under preparation andwill be sent to all persons who were registered participants of the Chennai conference.
Mahadeva SrinivasanChairman, Organizing Committee for ICCF 16
January 2013
J. Condensed Matter Nucl. Sci. 10 (2013) 1–14
Research Article
Characteristics and Energetics of Cratersin LENR Experimental Materials
David J. Nagel !The George Washington University, Washington DC, USA
Abstract
Small craters have been observed frequently in the surfaces of cathodes from electrochemical LENR experiments. They are generally1–100 µm in size. The craters vary widely in shape and areal distribution. Two methods were used to determine the energies neededto produce such craters. The resulting energies range from nJ to mJ, depending on the crater size. If craters are caused by LENR, thenmany nearly simultaneous MeV-level energy releases would have to occur in a very small volume. There are numerous open basicquestions regarding the formation and characteristics of craters in LENR cathodes. It remains to be seen if craters will be helpfulin understanding the origin and nature of LENR. But already, the existence and features of craters seriously challenge theories thatseek to understand LENR.© 2013 ISCMNS. All rights reserved. ISSN 2227-3123
Keywords: Cathode materials, Craters, Low-energy nuclear reactions, LENR, Transmutations
1. Introduction
The mechanisms and dynamics for the production of energy by Low-energy Nuclear Reactions (LENR) are still notunderstood. Hence, it seems reasonable to examine all available information from LENR experiments. Small cratersare commonly observed in solid cathode materials after electrochemical loading of deuterons into Pd. However, whilesuch craters have frequently been reported, they have not been analyzed significantly. The purpose of this paper is toprovide the beginning of such an analysis.
Section 2 presents examples of craters found after LENR experiments. Both their sizes and their areal densities canbe obtained from published scanning electron micrographs. Craters larger than those from LENR experiments can beproduced in solids by many mechanisms. The scaling of crater sizes with the energies that produced them is discussedin Section 3. That scaling permits estimates of the energies required to produce craters in LENR materials. Thoseestimates compare favorably with simple computations of crater production energies. Crater energies and densities areused to address the question of what fraction of measured excess energies might be due to events that result in craters.The question of whether or not crater formation might limit the lifetime of electrochemical LENR generators is also
!E-mail: [email protected]
© 2013 ISCMNS. All rights reserved. ISSN 2227-3123

2 David J. Nagel / Journal of Condensed Matter Nuclear Science 10 (2013) 1–14
confronted. Section 4 summarizes what remain as open questions about LENR craters. It is noted that crater formationrequires high power, albeit very local releases of energies. The implications of high power production by LENR arenoted in Section 4.
2. Crater Characteristics
This section exhibits and discusses a few examples of craters seen after electrochemical LENR experiments. Thereseems to be no data published on any craters that might be formed during gas loading experiments.
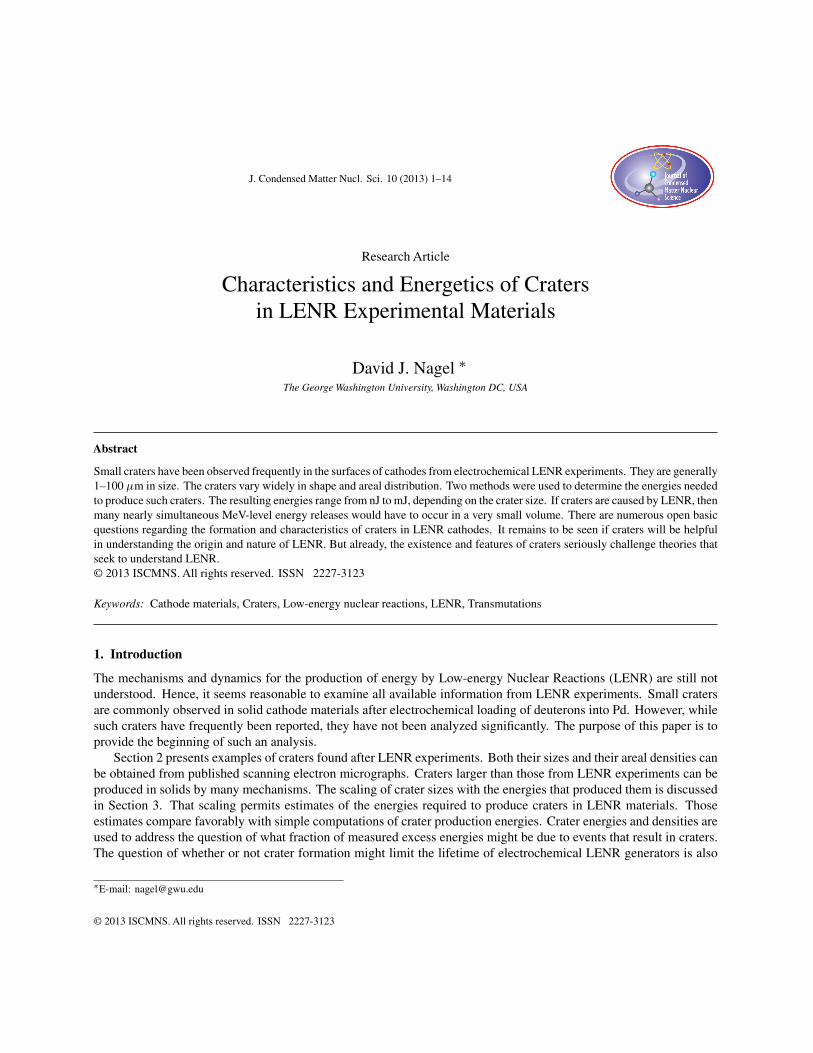
Figure 1 shows the first reported instance of a crater from an LENR experiment, which was presented at ICCF-2 in1991 [1]. It also contains an image from an experiment reported at ICCF-12 in 2005 [2]. The latter is accompaniedby an X-ray analysis of the areas on or near some of the craters. It is seen that the concentrations of three elements,Pd, Pt and Ag, vary widely with location on the cathode. The observation of markedly different chemical compositionsfrom craters and their surroundings has been reported several times. Figure 2 contains another example of such anobservation from an experiment in which Pd and D were co-deposited [3]. The encircled elements in Fig. 2 cannotbe deposited as elements, so the authors attributed their appearance to transmutations. However, they could have beenimpurities deposited in electrochemically permissible complexes.
The images in the first two figures show some of the wide variability in the morphology of craters. Their featuresvary from jagged to smooth. Sometimes they are in and below the original surface plane of the cathode, and occasionallythey appear in a raised (blistered) region. The crater diameters in the first two figures range from less than 10 to about100 µm. Their diameters are similar to the thickness of a human hair.
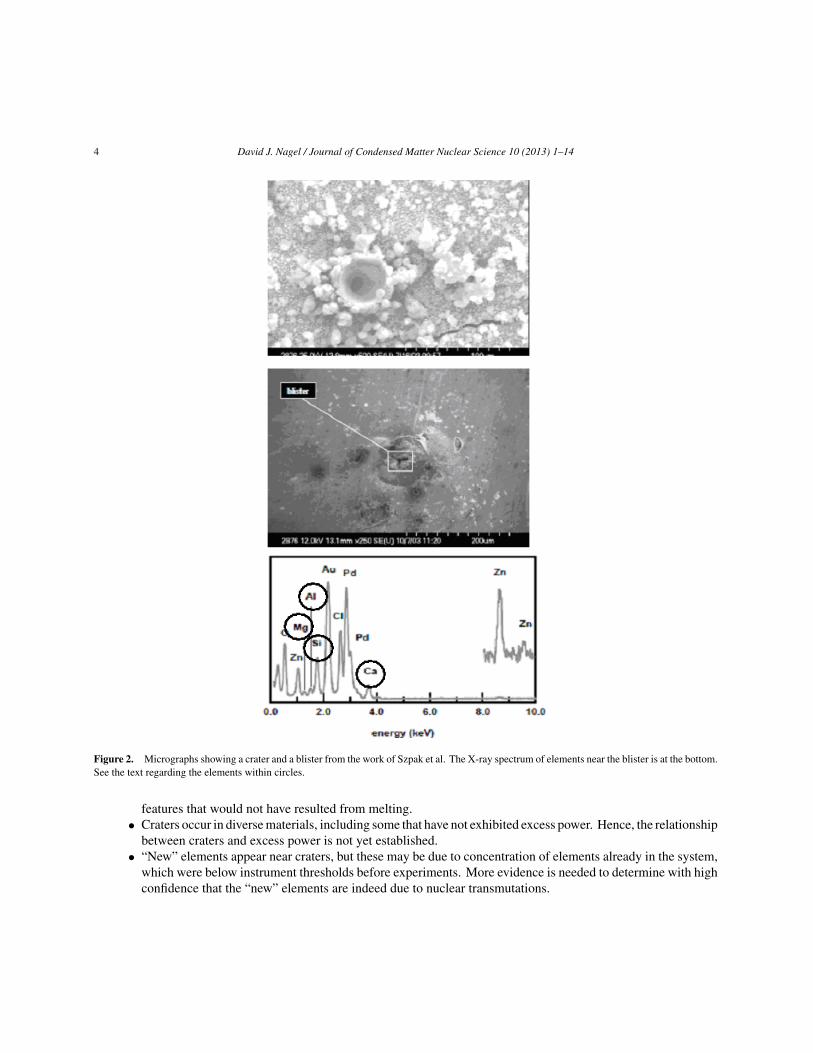
Figure 3 shows another example of craters, this one with very different characteristics. The formation seen byOhmori and his colleagues has a remarkably intricate structure [4,5]. It appears as if multiple energy releases producedthe observed shape. Further, the shapes make it seem that the releases must have been directed, or possibly sequenced, tomake the almost-floral structure. The formation extends well above the cathode surface. The complex structure showsno evidence of melting. It is important that the material in Fig. 3 is gold, rather than the Pd used in most electrochemicalLENR experiments.
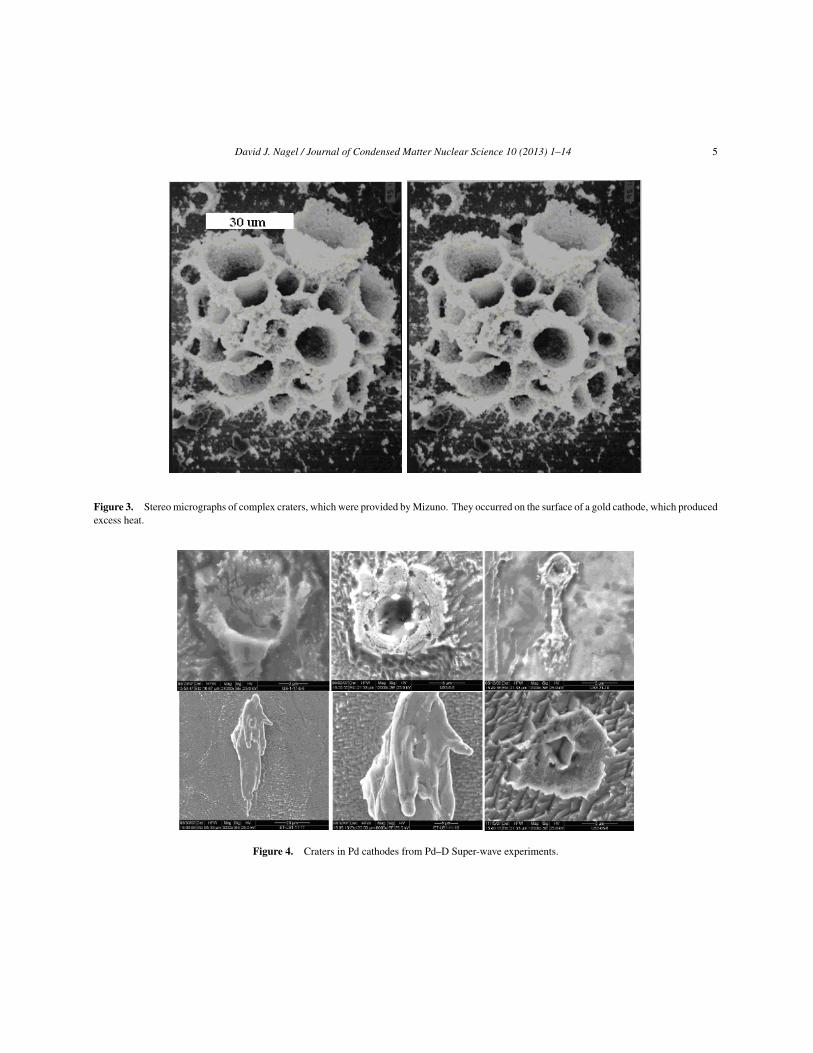
Craters seen in cathodes in Super-wave LENR experiments are shown in Fig. 4 [6]. All of these craters are relativelysmall, with structures on the order of 10 µm. They obviously exhibit a variety of morphologies. Some show evidence ofmelting and flow, while others have jagged structures, such as are seen in Figs. 1 and 3. The lower right hand micrographin Fig. 4 is a crater in which the bottom seems to be influenced by the underlying crystal structure. This could happentwo ways. The first, seeming unlikely, is the fracture along low index crystal planes and ejection of a crystallite. It isalso possible that the flat interior crater walls formed from recrystallization of molten material. But, that process alsoseems unlikely because of the very short cooling times of the cathode materials immersed in the electrolyte.
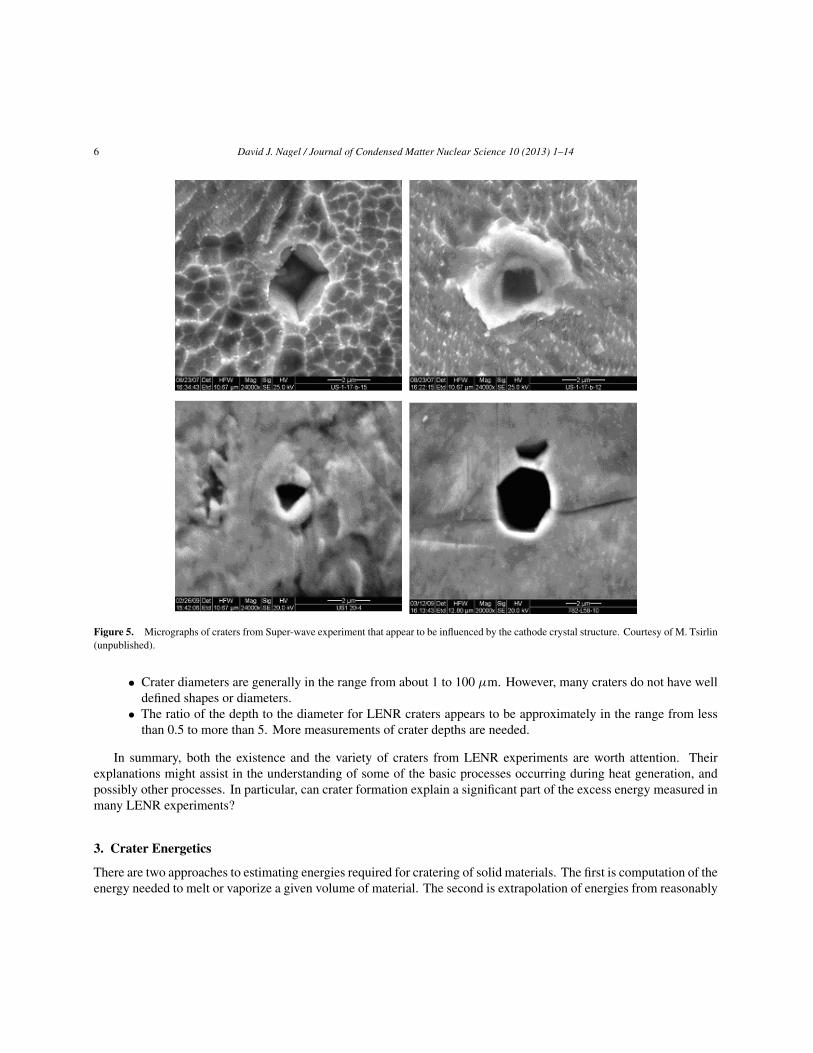
Tsirlin has unpublished images of craters from Super-wave experiments [7]. The morphology of these cratersapparently depends on the underlying crystal structure of the cathode. They are shown in Fig. 5. The craters, likethose in Fig. 4, are relatively small, all about 2 µm wide. The top two craters exhibit four-fold symmetry, possiblydue to (1 0 0) crystal orientations. The bottom two images seem to reflect three-fold symmetry, maybe due to (1 1 1)orientation, and even approximate six-fold symmetry.
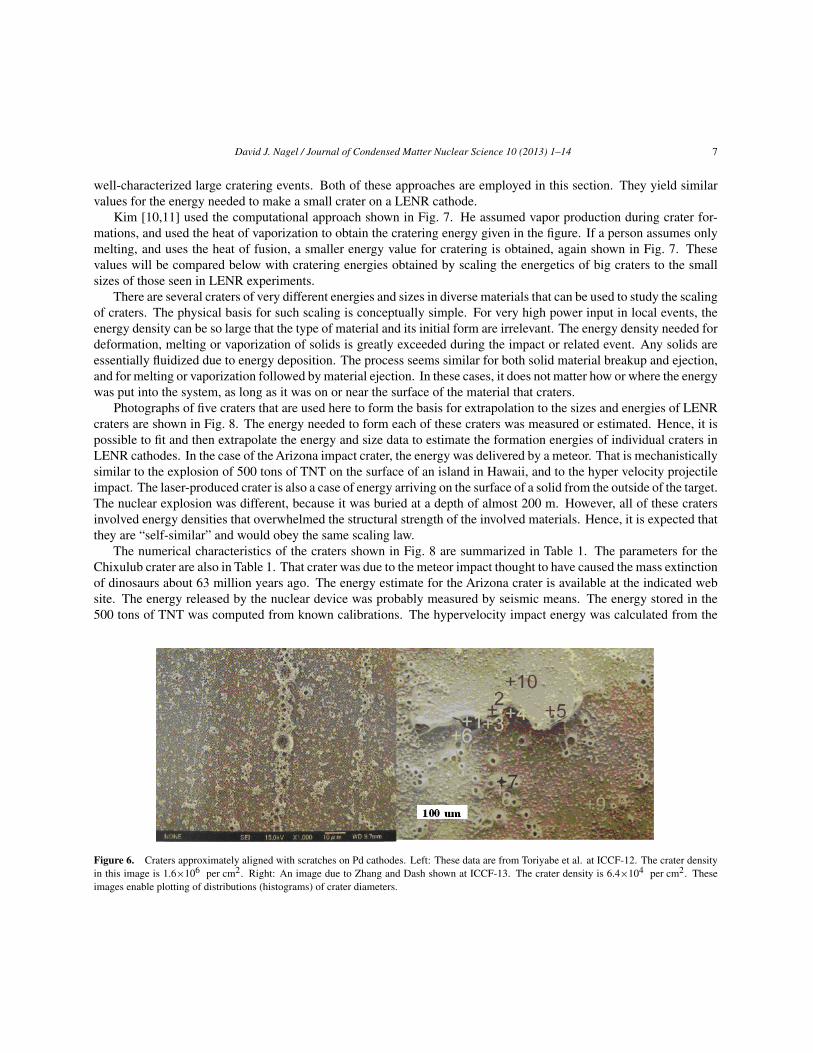
The last examples of craters from LENR experiments are in Fig. 6 [8,9]. These images have two valuable features.First, there are enough craters to permit estimates of the areal density of the craters. The values are in the caption ofFig. 6. Second, there is remarkable alignment of many craters with scratches on the surface of the cathodes. Presumably,the scratches existed before electrolysis. The alignment of craters with scratches suggests some experiments, whichare discussed in Section 4.
Many more examples of craters from electrolytical LENR experiments could be given. However, those shown abovespan the range of sizes and morphologies seen in about two dozen papers that have presented or discussed micrographs

David J. Nagel / Journal of Condensed Matter Nuclear Science 10 (2013) 1–14 3
Figure 1. Micrographs reported by Numata et al. (top) and by Zhang, Dash and Wang (center). The concentrations at the two circles are given inthe corresponding two lines of the table.
of craters. A summary of observations follows:
• Craters often appear to be due to high power, but very local, energy releases. The high powers are inferredbecause slower, that is, lower power releases would not produce temperatures high enough to cause the observedeffects.
• Part or all of many craters show evidence of melting, i.e., smooth surfaces. But, many craters have sharp
4 David J. Nagel / Journal of Condensed Matter Nuclear Science 10 (2013) 1–14
Figure 2. Micrographs showing a crater and a blister from the work of Szpak et al. The X-ray spectrum of elements near the blister is at the bottom.See the text regarding the elements within circles.
features that would not have resulted from melting.• Craters occur in diverse materials, including some that have not exhibited excess power. Hence, the relationship
between craters and excess power is not yet established.• “New” elements appear near craters, but these may be due to concentration of elements already in the system,
which were below instrument thresholds before experiments. More evidence is needed to determine with highconfidence that the “new” elements are indeed due to nuclear transmutations.
David J. Nagel / Journal of Condensed Matter Nuclear Science 10 (2013) 1–14 5
Figure 3. Stereo micrographs of complex craters, which were provided by Mizuno. They occurred on the surface of a gold cathode, which producedexcess heat.
Figure 4. Craters in Pd cathodes from Pd–D Super-wave experiments.
6 David J. Nagel / Journal of Condensed Matter Nuclear Science 10 (2013) 1–14
Figure 5. Micrographs of craters from Super-wave experiment that appear to be influenced by the cathode crystal structure. Courtesy of M. Tsirlin(unpublished).
• Crater diameters are generally in the range from about 1 to 100 µm. However, many craters do not have welldefined shapes or diameters.
• The ratio of the depth to the diameter for LENR craters appears to be approximately in the range from lessthan 0.5 to more than 5. More measurements of crater depths are needed.
In summary, both the existence and the variety of craters from LENR experiments are worth attention. Theirexplanations might assist in the understanding of some of the basic processes occurring during heat generation, andpossibly other processes. In particular, can crater formation explain a significant part of the excess energy measured inmany LENR experiments?
3. Crater Energetics
There are two approaches to estimating energies required for cratering of solid materials. The first is computation of theenergy needed to melt or vaporize a given volume of material. The second is extrapolation of energies from reasonably
David J. Nagel / Journal of Condensed Matter Nuclear Science 10 (2013) 1–14 7
well-characterized large cratering events. Both of these approaches are employed in this section. They yield similarvalues for the energy needed to make a small crater on a LENR cathode.
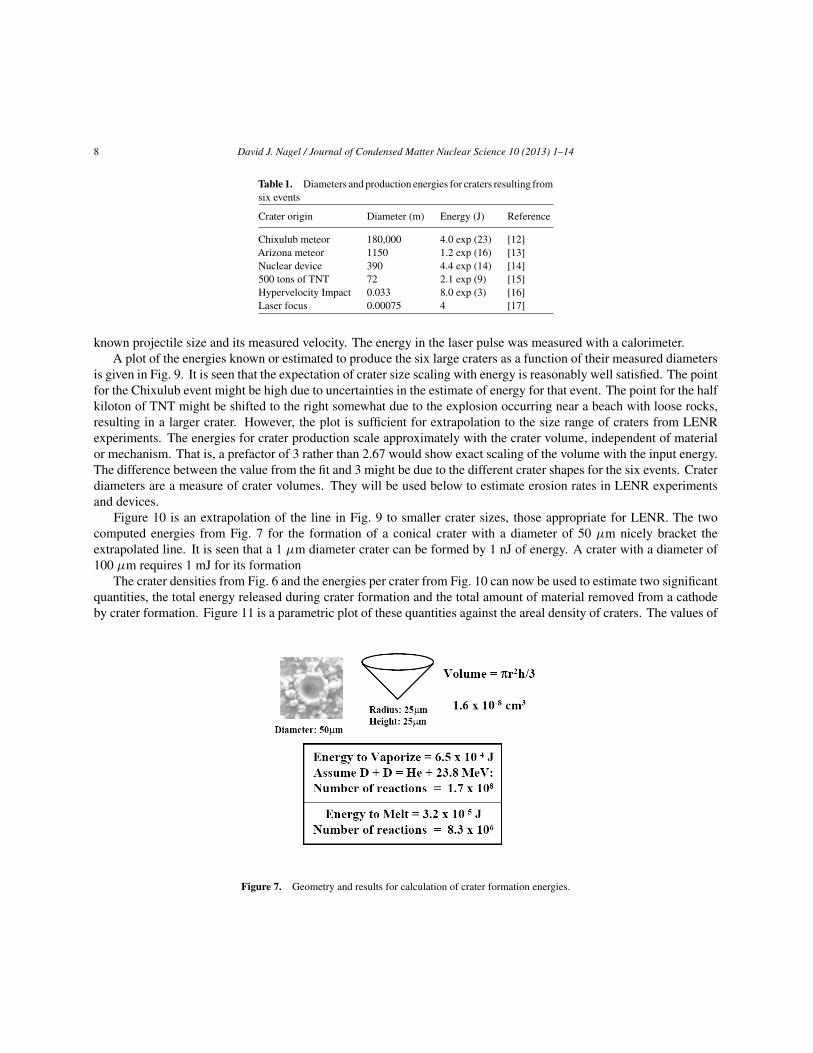
Kim [10,11] used the computational approach shown in Fig. 7. He assumed vapor production during crater for-mations, and used the heat of vaporization to obtain the cratering energy given in the figure. If a person assumes onlymelting, and uses the heat of fusion, a smaller energy value for cratering is obtained, again shown in Fig. 7. Thesevalues will be compared below with cratering energies obtained by scaling the energetics of big craters to the smallsizes of those seen in LENR experiments.
There are several craters of very different energies and sizes in diverse materials that can be used to study the scalingof craters. The physical basis for such scaling is conceptually simple. For very high power input in local events, theenergy density can be so large that the type of material and its initial form are irrelevant. The energy density needed fordeformation, melting or vaporization of solids is greatly exceeded during the impact or related event. Any solids areessentially fluidized due to energy deposition. The process seems similar for both solid material breakup and ejection,and for melting or vaporization followed by material ejection. In these cases, it does not matter how or where the energywas put into the system, as long as it was on or near the surface of the material that craters.
Photographs of five craters that are used here to form the basis for extrapolation to the sizes and energies of LENRcraters are shown in Fig. 8. The energy needed to form each of these craters was measured or estimated. Hence, it ispossible to fit and then extrapolate the energy and size data to estimate the formation energies of individual craters inLENR cathodes. In the case of the Arizona impact crater, the energy was delivered by a meteor. That is mechanisticallysimilar to the explosion of 500 tons of TNT on the surface of an island in Hawaii, and to the hyper velocity projectileimpact. The laser-produced crater is also a case of energy arriving on the surface of a solid from the outside of the target.The nuclear explosion was different, because it was buried at a depth of almost 200 m. However, all of these cratersinvolved energy densities that overwhelmed the structural strength of the involved materials. Hence, it is expected thatthey are “self-similar” and would obey the same scaling law.
The numerical characteristics of the craters shown in Fig. 8 are summarized in Table 1. The parameters for theChixulub crater are also in Table 1. That crater was due to the meteor impact thought to have caused the mass extinctionof dinosaurs about 63 million years ago. The energy estimate for the Arizona crater is available at the indicated website. The energy released by the nuclear device was probably measured by seismic means. The energy stored in the500 tons of TNT was computed from known calibrations. The hypervelocity impact energy was calculated from the
Figure 6. Craters approximately aligned with scratches on Pd cathodes. Left: These data are from Toriyabe et al. at ICCF-12. The crater densityin this image is 1.6"106 per cm2. Right: An image due to Zhang and Dash shown at ICCF-13. The crater density is 6.4"104 per cm2. Theseimages enable plotting of distributions (histograms) of crater diameters.
8 David J. Nagel / Journal of Condensed Matter Nuclear Science 10 (2013) 1–14
Table 1. Diameters and production energies for craters resulting fromsix events
Crater origin Diameter (m) Energy (J) Reference
Chixulub meteor 180,000 4.0 exp (23) [12]Arizona meteor 1150 1.2 exp (16) [13]Nuclear device 390 4.4 exp (14) [14]500 tons of TNT 72 2.1 exp (9) [15]Hypervelocity Impact 0.033 8.0 exp (3) [16]Laser focus 0.00075 4 [17]
known projectile size and its measured velocity. The energy in the laser pulse was measured with a calorimeter.A plot of the energies known or estimated to produce the six large craters as a function of their measured diameters
is given in Fig. 9. It is seen that the expectation of crater size scaling with energy is reasonably well satisfied. The pointfor the Chixulub event might be high due to uncertainties in the estimate of energy for that event. The point for the halfkiloton of TNT might be shifted to the right somewhat due to the explosion occurring near a beach with loose rocks,resulting in a larger crater. However, the plot is sufficient for extrapolation to the size range of craters from LENRexperiments. The energies for crater production scale approximately with the crater volume, independent of materialor mechanism. That is, a prefactor of 3 rather than 2.67 would show exact scaling of the volume with the input energy.The difference between the value from the fit and 3 might be due to the different crater shapes for the six events. Craterdiameters are a measure of crater volumes. They will be used below to estimate erosion rates in LENR experimentsand devices.
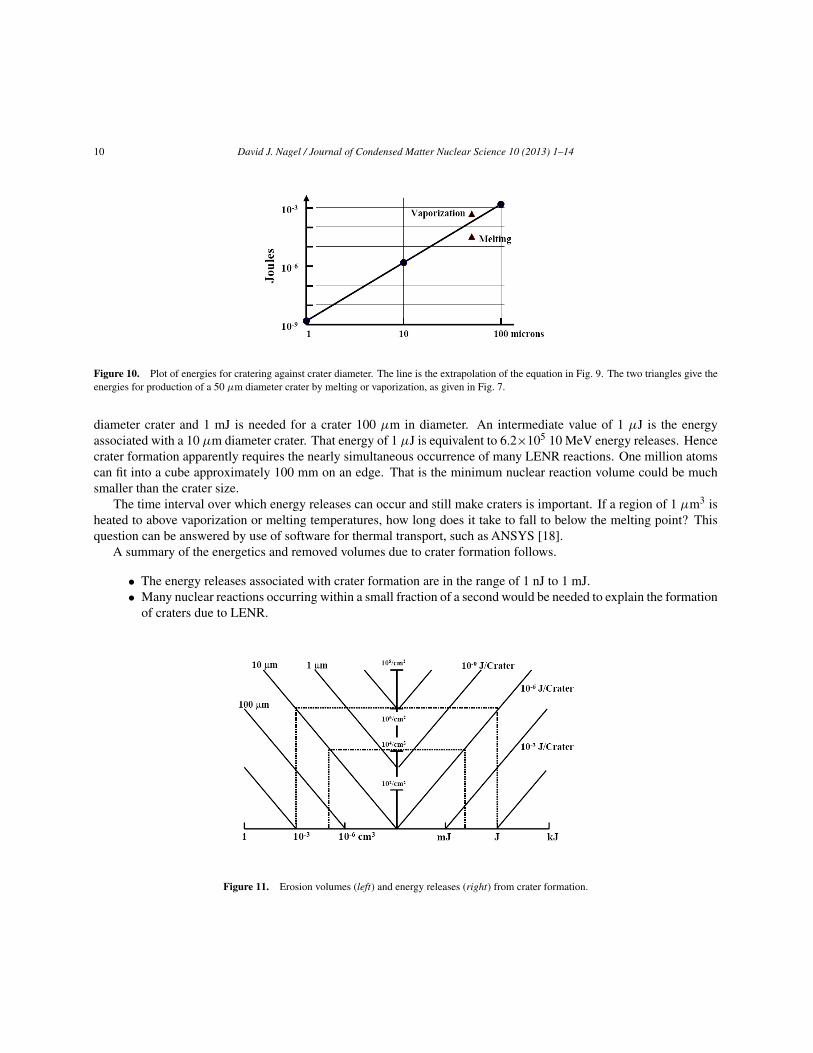
Figure 10 is an extrapolation of the line in Fig. 9 to smaller crater sizes, those appropriate for LENR. The twocomputed energies from Fig. 7 for the formation of a conical crater with a diameter of 50 µm nicely bracket theextrapolated line. It is seen that a 1 µm diameter crater can be formed by 1 nJ of energy. A crater with a diameter of100 µm requires 1 mJ for its formation
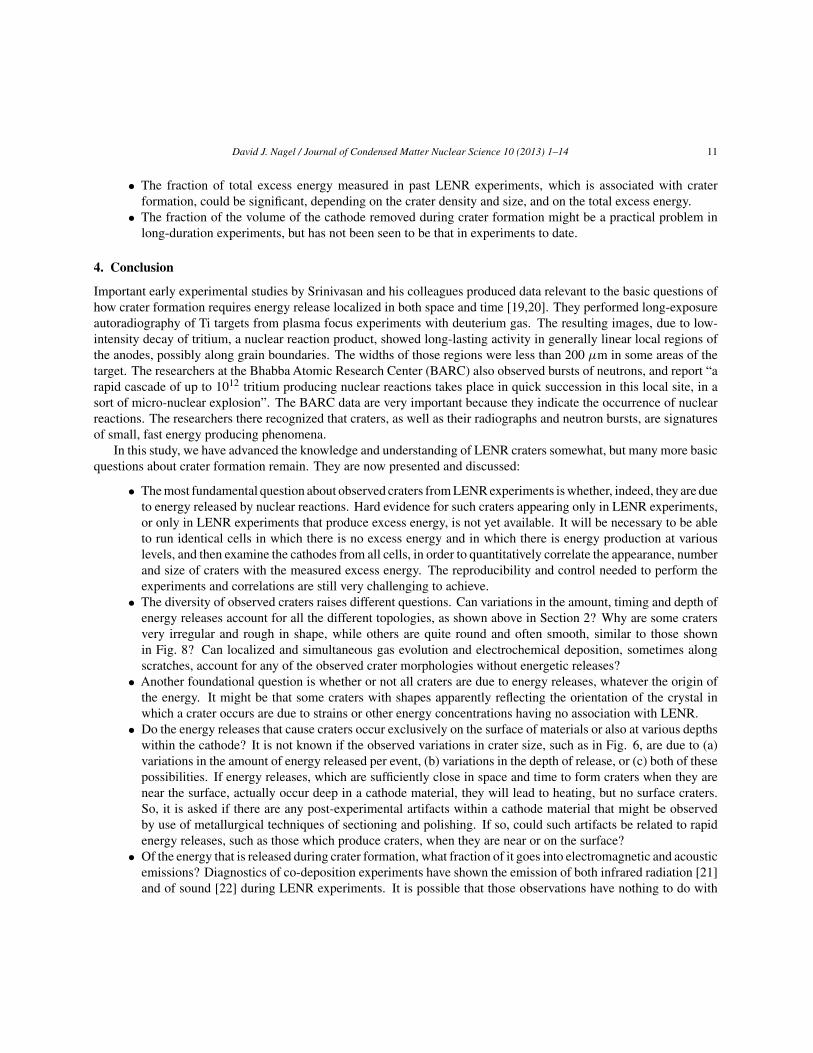
The crater densities from Fig. 6 and the energies per crater from Fig. 10 can now be used to estimate two significantquantities, the total energy released during crater formation and the total amount of material removed from a cathodeby crater formation. Figure 11 is a parametric plot of these quantities against the areal density of craters. The values of
Figure 7. Geometry and results for calculation of crater formation energies.

David J. Nagel / Journal of Condensed Matter Nuclear Science 10 (2013) 1–14 9
Figure 8. Craters of widely different size scales: From the left, a meteor impact crater about 1.15 km across in Arizona, a crater 390 m in diameterfrom a nuclear device test in Nevada, the crater about 72 m across from a TNT explosion in Hawaii, an Al hyper-velocity impact target with a 33 mmdiameter crater, and a crater 0.75 mm across at the focus of a high powered laser.
crater density, energy per crater and crater volume, which are relevant to craters from LENR experiments, are spannedin that figure.
Many combinations of parameter can be examined readily by use of Fig. 11. For example, if 1 mJ were releasedfor each crater, and the crater density were 106/cm2, the areal energy would be 1 kJ/cm2, or 10 kJ for a cathode with atotal area of 10 cm2. For these parameters in an experiment running for 24 h, the average power released by crateringevents would be about one quarter of a watt. Hence, the average power generated during cratering events is not large,but it could be a significant fraction of the excess power production in some electrochemical experiments.
The volume of material removed by cratering can also be estimated from Fig. 11. The conical shape shown in Fig. 7is assumed. For the same 106/cm2crater density and an intermediate crater diameter of 10 µm, the total material erodedfrom the 10 cm2 cathode would be 0.01 cm3. That is a small fraction of the volume of a normal rod-shaped cathodewith 10 cm2 surface area. However, long-term operation could lead to removal of a significant fraction of the cathode,and the ejection of a volume approaching 1 cm3 into the electrolyte. Hence, it can only be said now that erosion due tocrater formation might be a practical limitation on the operational duration of electrochemical LENR cells designed toproduce energy.
Returning to the energetics of crater formation, one of the most fundamental issues in crater formation by LENRis the number of nuclear reactions needed to produce a crater. We found that 1 nJ is enough energy to produce a 1 µm
Figure 9. Log-Log plot of the data in Table 1. It is noted that the vertical axis spans 30 orders of magnitude, while the horizontal axis ranges over12 orders of magnitude. The bar in the lower left-hand corner gives the sizes for craters in LENR cathodes. The straight line was obtained by a leastsquares fit using EXCEL.
10 David J. Nagel / Journal of Condensed Matter Nuclear Science 10 (2013) 1–14
Figure 10. Plot of energies for cratering against crater diameter. The line is the extrapolation of the equation in Fig. 9. The two triangles give theenergies for production of a 50 µm diameter crater by melting or vaporization, as given in Fig. 7.
diameter crater and 1 mJ is needed for a crater 100 µm in diameter. An intermediate value of 1 µJ is the energyassociated with a 10 µm diameter crater. That energy of 1 µJ is equivalent to 6.2"105 10 MeV energy releases. Hencecrater formation apparently requires the nearly simultaneous occurrence of many LENR reactions. One million atomscan fit into a cube approximately 100 mm on an edge. That is the minimum nuclear reaction volume could be muchsmaller than the crater size.
The time interval over which energy releases can occur and still make craters is important. If a region of 1 µm3 isheated to above vaporization or melting temperatures, how long does it take to fall to below the melting point? Thisquestion can be answered by use of software for thermal transport, such as ANSYS [18].
A summary of the energetics and removed volumes due to crater formation follows.
• The energy releases associated with crater formation are in the range of 1 nJ to 1 mJ.• Many nuclear reactions occurring within a small fraction of a second would be needed to explain the formation
of craters due to LENR.
Figure 11. Erosion volumes (left) and energy releases (right) from crater formation.
David J. Nagel / Journal of Condensed Matter Nuclear Science 10 (2013) 1–14 11
• The fraction of total excess energy measured in past LENR experiments, which is associated with craterformation, could be significant, depending on the crater density and size, and on the total excess energy.
• The fraction of the volume of the cathode removed during crater formation might be a practical problem inlong-duration experiments, but has not been seen to be that in experiments to date.
4. Conclusion
Important early experimental studies by Srinivasan and his colleagues produced data relevant to the basic questions ofhow crater formation requires energy release localized in both space and time [19,20]. They performed long-exposureautoradiography of Ti targets from plasma focus experiments with deuterium gas. The resulting images, due to low-intensity decay of tritium, a nuclear reaction product, showed long-lasting activity in generally linear local regions ofthe anodes, possibly along grain boundaries. The widths of those regions were less than 200 µm in some areas of thetarget. The researchers at the Bhabba Atomic Research Center (BARC) also observed bursts of neutrons, and report “arapid cascade of up to 1012 tritium producing nuclear reactions takes place in quick succession in this local site, in asort of micro-nuclear explosion”. The BARC data are very important because they indicate the occurrence of nuclearreactions. The researchers there recognized that craters, as well as their radiographs and neutron bursts, are signaturesof small, fast energy producing phenomena.
In this study, we have advanced the knowledge and understanding of LENR craters somewhat, but many more basicquestions about crater formation remain. They are now presented and discussed:
• The most fundamental question about observed craters from LENR experiments is whether, indeed, they are dueto energy released by nuclear reactions. Hard evidence for such craters appearing only in LENR experiments,or only in LENR experiments that produce excess energy, is not yet available. It will be necessary to be ableto run identical cells in which there is no excess energy and in which there is energy production at variouslevels, and then examine the cathodes from all cells, in order to quantitatively correlate the appearance, numberand size of craters with the measured excess energy. The reproducibility and control needed to perform theexperiments and correlations are still very challenging to achieve.
• The diversity of observed craters raises different questions. Can variations in the amount, timing and depth ofenergy releases account for all the different topologies, as shown above in Section 2? Why are some cratersvery irregular and rough in shape, while others are quite round and often smooth, similar to those shownin Fig. 8? Can localized and simultaneous gas evolution and electrochemical deposition, sometimes alongscratches, account for any of the observed crater morphologies without energetic releases?
• Another foundational question is whether or not all craters are due to energy releases, whatever the origin ofthe energy. It might be that some craters with shapes apparently reflecting the orientation of the crystal inwhich a crater occurs are due to strains or other energy concentrations having no association with LENR.
• Do the energy releases that cause craters occur exclusively on the surface of materials or also at various depthswithin the cathode? It is not known if the observed variations in crater size, such as in Fig. 6, are due to (a)variations in the amount of energy released per event, (b) variations in the depth of release, or (c) both of thesepossibilities. If energy releases, which are sufficiently close in space and time to form craters when they arenear the surface, actually occur deep in a cathode material, they will lead to heating, but no surface craters.So, it is asked if there are any post-experimental artifacts within a cathode material that might be observedby use of metallurgical techniques of sectioning and polishing. If so, could such artifacts be related to rapidenergy releases, such as those which produce craters, when they are near or on the surface?
• Of the energy that is released during crater formation, what fraction of it goes into electromagnetic and acousticemissions? Diagnostics of co-deposition experiments have shown the emission of both infrared radiation [21]and of sound [22] during LENR experiments. It is possible that those observations have nothing to do with
12 David J. Nagel / Journal of Condensed Matter Nuclear Science 10 (2013) 1–14
crater formation. But, it is also possible that the emissions occurred during crater formation. If the latter is thecase, might infrared or acoustic time radiations be diagnostically useful? Could the time history of events becorrelated with observed areal densities of craters on cathode materials? Might infrared or acoustic spectralinformation shed light on the mechanisms and dynamics of rapid energy releases? Could the amplitudes ofsonic pulses indicate the relative size of energy releases and associated crater sizes, or even energy releaseswithout crater formation?
• Because a large number of nuclear reactions in nearby locations and short times appear to be needed for craterformation, there is the question of whether they happen coincidentally by accident, or else is there some kindof a sequence in which reactions quickly lead to other reactions? The appearance of craters during some,but maybe not all energy release events, might constitute evidence of something resembling a chain reactionin LENR experiments. Experiments at modestly elevated temperatures have shown that higher temperaturesfavor production of excess energy. The temperatures that occur during the earliest times of a crater formingevent might be very high, far in excess of vaporization temperatures. Otherwise, they would not lead to theobserved effects shown in Section 2.
• There follow questions about the purposeful production of craters. For example, since surface scratches lead tocraters forming in lines along the scratches, as in Fig. 6, would scoring the surface of LENR cathodes prior toexperiments lead to more crater production. Might the production of excess energy, or the emission of infraredradiation, or the occurrence of shorts bursts of sound, correlate with the density of scratches in cm/cm2? Wouldthe frequency of crater production in space and time relate to the shape and size of the surface structures? If theenergy releases due to crater formation constitute a significant fraction of the excess energy, could the willfulintroduction of surface morphology improve the reproducibility or output of LENR experiments? Would itmatter if the surface scratches intersected each other? If so, would the angle between scratches be a significantparameter?
• Many LENR experiments are driven much harder and with unusual time profiles compared to more usualelectrochemical experiments. McKubre wondered if the appearance of craters might correlate with the inputpower to electrochemical experiments. Violante similarly asked if craters might correlate with the protocolused to load a cathode or the use of applied voltage modulations in an experiment.
Finally, we speculate on the potential relationship between small craters on cathode surfaces and a singular eventdescribed in a paper by Fleishchmann and Pons in 1989 [23]. They were conducting an electrolytic LENR experiment inwhich the cathode was a cube of Pd 1 cm on a side. During the night, the experiment suffered a thermal runaway, whichlead to the following statement in their paper: “WARNING! IGNTION! We have to report here that under the conditionsof the last experiment, even using D2O alone, a substantial portion of the cathode fused (melting point 1554oC), part ofit vaporized, and the cell and contents and a part of the fume cupboard housing the experiment were destroyed.” Thereare two remarkable aspects of the event. First, it was not documented in detail after the occurrence. And, reportedly, itcaused Fleischmann and Pons subsequently to use much smaller cathode volumes, generally in cylindrical geometries.Apparently, they were concerned about safety and the danger of large high-power events.
The point is that both the small craters on cathode surfaces and the extraordinary event observed by Fleishmann andPons have in common the achievement of very high LENR power densities. Could it be that the conditions, which occurwith significant frequency on cathode surfaces in some LENR experiments, also happened in a much larger volumewithin the big cubic cathode? Might large-scale and high-power releases be produced willfully, maybe on demand?Could their power levels be controlled? If so, what are the implications? Could they be used beneficially in practicalLENR power devices? Might they be used to augment existing weapons, or even enable new weapons? Historically,new sources of energy were commonly used for military purposes.
There are certainly many basic scientific and practical questions about craters and high-power releases due to
David J. Nagel / Journal of Condensed Matter Nuclear Science 10 (2013) 1–14 13
LENR, whatever their size. Clearly, what is already known experimentally, and the many open questions, both serveto challenge theoreticians to provide needed understanding of the diverse phenomena related to craters and high-powerreleases in LENR materials.
Acknowledgments
Tadahiko Mizuno sent the 3D micrograph shown in Fig. 4. Mark Tsirlin provided the micrographs in Fig. 5, and gavepermission to publish them. Chia-Pin Chang kindly did the fit to the crater data in Fig. 9 to obtain the equation inthat figure. Michael Bell graciously provided the target from the hypervelocity experiment. Mahadeva Srinivasan senthelpful emails about his early work at BARC. Yeong E. Kim, Michael C.H. McKubre and Vittorio Violanti provideduseful comments on the manuscript. All their generous assistance is recalled with pleasure. The referee of this paperalso contributed to its improvement.
References
[1] H. Numata et al., Neutron emission and surface observation during long-term evolution of deuterium on Pd in 0.1 M LiOD inT. Bressani et al. (Editors), The Science of Cold Fusion, Proc. of ICCF-2, Societa Italiana di Fisica (1991) pp. 71–80.
[2] W.-S. Zhang, J. Dash and Q. Wang, Seebeck envelope calorimetry with a Pd/D2O + H2SO4 electrolytic cell in A. Takahashiet al.. (Editors), Condensed Matter Nuclear Science, Proc. of ICCF-12, World Scientific, Singapore (2006) pp. 86–96.
[3] S. Szpak et al., Evidence of nuclear reactions in the Pd lattice, Naturwissen (2005) 1–4.[4] T. Ohmori et al., Low temperature nuclear transmutation forming iron on/in gold electrode during light water electrolysis, J.
Hydrogen Energy 22 (1997) 459.[5] T. Ohmori et al., Transmutation in the electrolysis of light-water - excess energy and iron production in a gold electrode, Fusion
Technol. 3 (1997) 210.[6] I. Dardik et al., Ultrasonically-excited electrolysis experiments at energetics technologies, in David J. Nagel and Michael E.
Melich (Editors), Proc. of the 14th Int. Conf. on Condensed Matter Nuclear Science (2010) pp, 106–122.[7] M. Tsirlin (Private communication).[8] Y. Toriyabe et al., Elemental analysis of palladium electrodes after Pd/Pd light water critical electrolysis, in A. Takahashi et al.
(Editors), Condensed Matter Nuclear Science, Proc. of ICCF-12, World Scientific, Singapore (2006) pp. 253–263.[9] W.-S. Zhang and J. Dash, Excess heat reproducibility and evidence of anomalous elements after electrolysis in Pd/D2O and
H2SO4 electrolytic cells in Y. Bazhutov (Editor), Proc. of the 13th Int. Conf. on Condensed Matter Nuclear Science (2008)pp. 202–216.
[10] Y. E. Kim, Theory of Bose–Einstein condensation mechanism for deuteron-induced nuclear reactions in micro/nano-saclemetal grains and particles, Naturwissenschaften, Published online 14 May 2009, DOI 10.1007/s00114-009-0537-6.
[11] Y. E. Kim, Cryogenic ignition of deuteron fusion in metals: an alternate approach to clean fusion energy, to be published inthe Proceedings of ICCF-17.
[12] http://en.wikipedia.org/wiki/Chicxulub_crater.[13] http://en.wikipedia.org/wiki/Meteor_Crater.[14] http://en.wikipedia.org/wiki/Sedan_%28nuclear_test%29.[15] http://www.history.navy.mil/photos/events/ev-1960s/ev-1965/op-sa-ht.htm.[16] A. Williams, Naval Research Laboratory (Private communication).[17] D. J. Nagel, Naval Research Laboratory (Unpublished).[18] http://www.ansys.com/Products/Simulation+Technology/Multiphysics.[19] M. Srinivasan, Neutron emission in bursts and hot spots: signature of micro-nuclear explosions? J. Condensed Matter Nucl.
Sci. 4 (2011) 168 [http://www.iscmns.org/CMNS/JCMNS-Vol4.pdf].[20] M. Srinivasan, Hot spots, chain events and micro-nuclear explosions, Proc. of the 15th International Conference on Con-
densed Matter Nuclear Science (ICCF-15 ), V. Violante and F. Sarto (Editors), Italian National Agency for New Tech-nologies, Energy and the Environment, ISBN 978-88-8286-256-5 (2010), p. 240, [http://iccf15.frascati.enea.it/docs/ICCF15-PROCEEDINGS.pdf].
14 David J. Nagel / Journal of Condensed Matter Nuclear Science 10 (2013) 1–14
[21] P.A. Mosier-Boss and S. Szpak, The Pd/nH System: Transport processes and development of thermal instabilities, NuovoCimento Societa Italiana di Fisica A, 112 (1999) 577–587.
[22] S. Szpak et al., Precursors and the fusion reactions in polarized Pd/D–D2O system: Effect of an external electric field,11th Int.Conf. on Condensed Matter Nuclear Science, Marseilles, France (2004), http://lenr-canr.org/acrobat/SzpakSprecursorsa.pdf.
[23] M. Fleischmann and S. Pons, Electrochemically induced nuclear fusion of deuterium, J. Electroanalytical Chem. 261 (1989)301–308
J. Condensed Matter Nucl. Sci. 10 (2013) 15–29
Research Article
From the Naught Orbit to the 4He Excited State
A. Meulenberg !
National Advanced IPv6 Centre, Universiti Sains Malaysia, 11800 Penang, Malaysia
Abstract
An electron pair (lochon) in a deep hydrogen ‘naught’ orbit (n = 0) has similarities to muonic hydrogen in that it has a smallorbital radius that allows the protons in molecular hydrogen to be very much closer together than is possible in a normal molecule.There are also significant differences between lochon- and muon-catalyzed fusion (e.g., one leads to ‘cold’ fusion and the other the‘hot’ fusion). However, since muon-catalyzed fusion is an accepted phenomenon and Lattice-assisted Nuclear Reaction (LANR)or Low-energy Nuclear Reaction ( LENR) is not, we will examine the similarities and differences in various mechanisms with thefusion of deuterons in mind. We start with the assumption that both solutions of the Klein–Gordon equation are actually real andthe one that has here-to-for been rejected correctly identifies a single deep orbit below the n = 1 ground state. (It is generallyaccepted that, at least for spinless bosons such as the lochon, this solution of the Klein–Gordon equation holds.) We then comparethe creation model and characteristics of these two naught orbits with those of the muonic orbits (both atomic and molecular). Thesimilarities lead both naught-orbit and muonic-orbit molecules to fusion. The differences lead the non-relativistic (but >100 MeVexcess energy) muon-induced fusion of deuterons to the fragmentation of excited helium nuclei and the relativistic (but <10 eVexcess energy) lochon-induced D–D fusion to an excited helium 4He* state that is below these fragmentation levels. The reason forthis different response to the respective “tight” orbits is described along with some of the consequences, e.g., electron capture. Inaddition, internal conversion, a known physical process involving nucleon interaction with atomic electrons, is compared with theExtended Lochon Model to provide a means of de-exciting 4He* without production of energetic particles or radiation.© 2013 ISCMNS. All rights reserved. ISSN 2227-3123
Keywords: Electron-capture, Internal-conversion, LENR, Lochon, Muon-catalysis, Naught-orbit
1. Introduction
Loaded palladium deuteride, PdDx (with x = "1), has a high number of deuterons located in close proximity to oneanother. Under certain circumstances, these deuterons are cyclically brought still closer together and some of them fuse.Many models have been proposed to identify these circumstances. None has had more than a small group of adherents,and, all of the earlier models had weaknesses identified in a 1994 review [1]. Nevertheless, with experimental evidenceproving that at least some of the fusion processes proceed from lattice site to the 4He ground state with release of more
!E-mail: [email protected]; Tel.: 604-01255 92369, 604-653 4632
© 2013 ISCMNS. All rights reserved. ISSN 2227-3123
16 A. Meulenberg / Journal of Condensed Matter Nuclear Science 10 (2013) 15–29
heat than can be accounted for by accepted pathways, it is clear that conventional atomic and nuclear physics must beextended beyond their present realms.
Assuming the reality of measured end products (heat and 4He), we have developed a model over the last decadethat provides a pathway to these products as well as to the other observed effects and byproducts of this system [2–6].The individual steps along this path have not yet been validated. However, none of them violates known experimentalor theoretical physics. In fact, recent experimental and theoretical work within the mainstream of astrophysics [7,8]and physics [9] supports some hypotheses of the model.
An assumption of our Lochon Modela is that the n = 1, hydrogen-ground-state energy level is briefly and periodicallyoccupied by a pair of zero-angular momentum,l = 0, s-orbit electrons that can lose sufficient energy in doing workto move deeply into a deepening Coulomb potential well so that their orbital radius (wave function) is confined moreclosely about the nucleus. The pairing of electrons, shared in the hydrogen 1s orbital and the Pd 4d orbitals, dependson the local Fermi level and therefore on the local electric fields. This pair of s electrons, the lochon, will form from,and respond to, the local phonon field and cyclically (at 1013 to 1014 Hz) move deep into the nuclear-Coulomb potentialwell, accelerating to high kinetic energies in the process. This modeled action of s electrons is not new; lattice-inducedpair formation is standard physics and happens continually in the solid state as a result of phonon or polariton action.
Normally, in the lattice-atom oscillation, the kinetic energy of bound electrons increases to a point and then returnsto the initial condition (maintaining constant total energy). If the electrons are in an excited atomic state and are ableto radiate energy away as one or more photons or phonons, then the total electron energy drops to a lower level. Then = 1 level is the lowest such radiation-accessible level, because electrons in that level do not have sufficient angularmomentum to form a photon. However, under the proper nuclear conditions, while the electrons are close to theirnucleus, they can be captured by the nucleus. Or, if they can do work that does not require angular momentum,they may be able to drop to a lower potential and total energy. At the atomic level and below, systems are generallyconservative. Therefore, the work done goes into stored energy and the process is fully reversible. The electron energychanges are ‘done’ and ‘undone’ in a cyclic manner and no violation of accepted physics and chemistry is observed.
When this process occurs during the collision portion of the longitudinal optical-phonon cycle for deuteron pairsbound in the sub-lattice of a PdD crystal, work is performed. If the colliding deuterons do not get close enough fortheir nuclear forces to overcome the lattice or nuclear Coulomb barriers, they are subsequently drawn back into thesub-lattice sites and the cycle, at about 1014 Hz, begins again. If the collision is close enough for fusion to occur, then,the deep-well electrons absorb energy from the accelerating protons and reradiate it. One or both of the electrons canbe ejected. The now tightly bound and relativistic electron or pair participates in a nuclear ‘dance’ that leads the excited4He* to its ground state(s). This latter process is described by the Extended Lochon Model [10].
The Extended Model provides all of the observed effects in low-energy nuclear reactions (LENR). It has beenrecently reinforced by (and, in turn supports) a theoretical quantum mechanics work of Jan Naudts identifying a deep-level atomic orbital [9,11]. This deep level is not within the normal range of detectability (energy and intensity), is notgenerally occupied, here-to-fore has not been sought, and therefore has not had any experimental support. (However,actual experimental data for the Halo nucleons [12] can be interpreted to support this model.) The prior deep-orbittheoretical work, while neither fundamental nor essential to the lochon model, may provide a valuable basis forexplaining some parts of the model that had been postulated, based on accepted solid-state models and mathematicallyderived, but not proven rigorously. Similarity of portions of the lochon model to accepted physical processes mightbe considered as support for the model, just as experimental evidence of much higher fusion cross sections observedin keV deuteron–deuteron collisions [7,8] over the last two decades has supported the hypothesis of nuclear fusion inLENR in general. Nevertheless, these portions are only stepping stones; and they must be properly connected before
aThe lochon (a “local-charged boson”) is a pair of s electrons tightly coupled by the phonon field to a deuteron (in this case) during the longitudinaloptical-phonon collision mode of the hydrogen sub-lattice in a PdD crystal.
A. Meulenberg / Journal of Condensed Matter Nuclear Science 10 (2013) 15–29 17
the pathway is complete.Some of the Extended Lochon Model mimics or has similarities with known physical processes, such as proximity-
coupling, internal conversion, muon catalysis, electron capture, and cyclical, deep, electron orbitals. This present paperexplores the new deep atomic level and then compares this model with some accepted nuclear physics mechanisms todetermine the similarities and differences leading to each and the applicability of the known phenomena to the newLENR data and environment.
2. Naudts’ Orbits
A deep atomic orbital at a binding energy of about mc2 is predicted from one solution of the Klein–Gordon (KG)equation [9]. Earlier studies of the relativistic 1-dimensional hydrogen atom [13], of a normally rejected solution to theSchrodinger equation [14], and in an independent development [15], had predicted a similar deep orbit (in some casesinfinitely deep [13]). The deep-orbit solution of the KG equation has been rejected by other authors [16,17], as: beingfrom an equation that is not applicable to particles with spin, being non-square integrable, and being singular at theorigin. Therefore, by their definition, it cannot be applied to an electron and it could not be real even if it did pertain.Nevertheless, the same KG model predicts two sets of energy levels. One set is ‘acceptable’ (even without consideringspin) because it provides levels consistent with known values for bosons (e.g., pions) and is not singular. The otherset is ‘unacceptable’ because, along with the known levels, it predicts a level that has not been observed. However, inboth sets of solutions (neither including spin), the upper atomic-hydrogen levels are predicted to be within parts per 10thousand of each other and of the normally calculated results.
The values for the deep accepted energy levels (e.g., n = 1 and 2), calculated by the ‘unacceptable’ path, are slightlyfurther from experimental results than those predicted by the basic ‘standard’ model; but, they converge to those of the‘accepted’ Dirac model at the higher energy levels (e.g., n > 2). The reason for this deviation at the deeper levels (forboth solutions) is that the KG equation does not include the spin of an electron. At higher energies, the electrons arefurther from the nucleus and each other, so that spin-spin and spin–orbit interactions become less important. A morerecent paper [18] has established theoretical criteria for accepting the deep orbit solution in the KG equation, but not inthe Dirac equation for which such a solution had been claimed earlier (1993) [19]. This same deep orbit solution forthe Dirac equation, in a physical argument, has been rejected based on a low probability (" 2#10$9) of the solutionin the region of the nucleus [20]. Nevertheless, such an orbit is admitted, even in this earlier critical paper, based on amodified Coulomb potential that permits a non-singular origin (at r = 0).
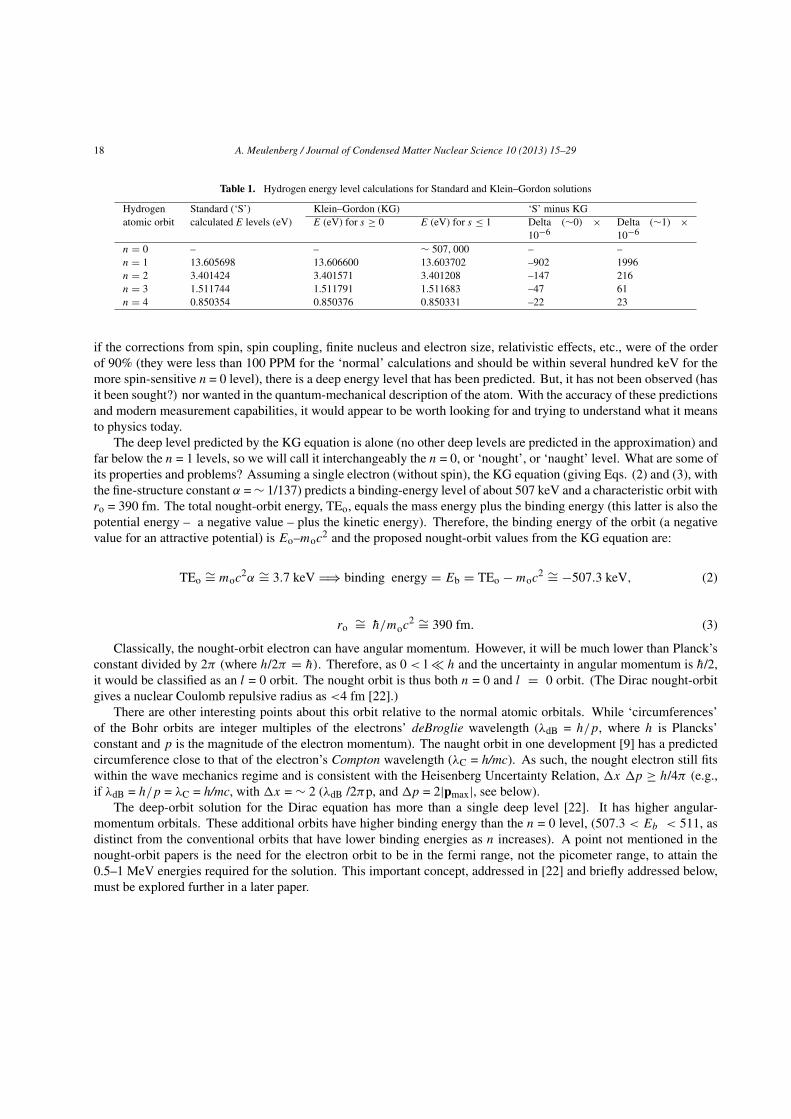
If the energy-level data are extended from Naudts’ paper and rewritten in more convenient notation (Table 1), thensome interesting conclusions can be drawn when they are compared with ‘standard’ [21] calculations. The solutionsto the KG equation provide two sets of levels identified by a parameter s (slightly modifying Naudts’ notation for thewave function, in Eq. (1)).
!(q) = exp$i Eot/h̄r$sexp$r/ro. (1)
The KG values for s % 0 correspond to the standard orbital energy levels. The KG values for s & 1, with a muchmore centrally concentrated probability distribution, are the ‘unacceptable’ levels. The n values in the table are chosento agree with conventional notation and neither the standard nor the KG sets contains a correction for the finite nuclearmass. It can be seen that the KG results ‘straddle’ the standard values and converge toward it (in parts-per-million, thedifferences in the last two columns) for the higher n values.
What does this all mean? If the KG equation can predict energy levels within milli-electron volts of the measuredand calculated values for the observed results, then it should be reasonable to expect it to predict all levels to somedegree of accuracy. In this case, the deepest (s & 1) level is predicted to have a binding energy of about 507 keV. Even
18 A. Meulenberg / Journal of Condensed Matter Nuclear Science 10 (2013) 15–29
Table 1. Hydrogen energy level calculations for Standard and Klein–Gordon solutions
Hydrogen Standard (‘S’) Klein–Gordon (KG) ‘S’ minus KGatomic orbit calculated E levels (eV) E (eV) for s % 0 E (eV) for s & 1 Delta ("0) #
10$6Delta ("1) #10$6
n = 0 – – " 507, 000 – –n = 1 13.605698 13.606600 13.603702 –902 1996n = 2 3.401424 3.401571 3.401208 –147 216n = 3 1.511744 1.511791 1.511683 –47 61n = 4 0.850354 0.850376 0.850331 –22 23
if the corrections from spin, spin coupling, finite nucleus and electron size, relativistic effects, etc., were of the orderof 90% (they were less than 100 PPM for the ‘normal’ calculations and should be within several hundred keV for themore spin-sensitive n = 0 level), there is a deep energy level that has been predicted. But, it has not been observed (hasit been sought?) nor wanted in the quantum-mechanical description of the atom. With the accuracy of these predictionsand modern measurement capabilities, it would appear to be worth looking for and trying to understand what it meansto physics today.
The deep level predicted by the KG equation is alone (no other deep levels are predicted in the approximation) andfar below the n = 1 levels, so we will call it interchangeably the n = 0, or ‘nought’, or ‘naught’ level. What are some ofits properties and problems? Assuming a single electron (without spin), the KG equation (giving Eqs. (2) and (3), withthe fine-structure constant " = " 1/137) predicts a binding-energy level of about 507 keV and a characteristic orbit withro = 390 fm. The total nought-orbit energy, TEo, equals the mass energy plus the binding energy (this latter is also thepotential energy – a negative value – plus the kinetic energy). Therefore, the binding energy of the orbit (a negativevalue for an attractive potential) is Eo–moc2 and the proposed nought-orbit values from the KG equation are:
TEo "= moc2" "= 3.7 keV '( binding energy = Eb = TEo $ moc2 "= $507.3 keV, (2)
ro "= h̄/moc2 "= 390 fm. (3)
Classically, the nought-orbit electron can have angular momentum. However, it will be much lower than Planck’sconstant divided by 2# (where h/2# = h̄). Therefore, as 0 < l ) h and the uncertainty in angular momentum is h̄/2,it would be classified as an l = 0 orbit. The nought orbit is thus both n = 0 and l = 0 orbit. (The Dirac nought-orbitgives a nuclear Coulomb repulsive radius as <4 fm [22].)
There are other interesting points about this orbit relative to the normal atomic orbitals. While ‘circumferences’of the Bohr orbits are integer multiples of the electrons’ deBroglie wavelength ($dB = h/p, where h is Plancks’constant and p is the magnitude of the electron momentum). The naught orbit in one development [9] has a predictedcircumference close to that of the electron’s Compton wavelength ($C = h/mc). As such, the nought electron still fitswithin the wave mechanics regime and is consistent with the Heisenberg Uncertainty Relation, %x %p % h/4# (e.g.,if $dB = h/p = $C = h/mc, with %x = " 2 ($dB /2#p, and %p = 2|pmax|, see below).
The deep-orbit solution for the Dirac equation has more than a single deep level [22]. It has higher angular-momentum orbitals. These additional orbits have higher binding energy than the n = 0 level, (507.3 < Eb < 511, asdistinct from the conventional orbits that have lower binding energies as n increases). A point not mentioned in thenought-orbit papers is the need for the electron orbit to be in the fermi range, not the picometer range, to attain the0.5–1 MeV energies required for the solution. This important concept, addressed in [22] and briefly addressed below,must be explored further in a later paper.

A. Meulenberg / Journal of Condensed Matter Nuclear Science 10 (2013) 15–29 19
The proposed electron naught orbit (radial or circular motion?) is of the same order as that of the muon orbit(rn = 0 = " 390 fm vs rµ = "250 fm) and therefore, a naught-orbit electron should be able to catalyze fusion in a similarmanner. If we assume that the predicted naught orbit is approximately valid, then, if it can be attained, it would becomea natural bridge to hydrogen fusion, just as is the muon. Moreover, electrons are plentiful (and cheap) and muons arenot. But, electrons do not naturally migrate to the nought orbits (as they do to the n = 1 orbits) or our universe wouldnot exist in its present form.
Given that this deep orbit exists, then the Quantum Mechanics (QM) argument that the hydrogen ground state isthe lowest orbit has only limited validity. However, a hydrogen atom with an electron in a nought orbit, Hˆ, wouldnot last long in the presence of other hydrogen atoms before they fuse; therefore a statement of the hydrogen groundstate as the lowest stable orbit may still be valid. Nevertheless, one should not reject the nought orbit based on thisQM claim. Perhaps, there is a reason that the QM claim could be rejected based on the naught orbit, but the accurateQM orbit-energy predictions could still be valid, since they are based on probabilities and the lifetime of this orbit isprobably very short. On the other hand, since the QM-orbit equations (Klein–Gordon and Dirac) do not include thenuclear-capture probability and do not address the difficulty in reaching this orbit, the orbit should be real and mighteven be stable in that limited calculation.
The non-relativistic QM predictions are based on the deBroglie wavelengths and associated resonances of the boundelectron. The addition of a (perhaps) single Compton wavelength for the electron could give a new orbit (a solutionor resonance) and still not violate the old QM models (they may just not include the most general solution). Since thestrict Coulomb potential has no minimum, and nothing except the perceived singularity at r = 0 prevents the electronfrom passing through the nucleus, the normal ground state is a minimum only as a result of ‘mechanical’ resonancestates of the electrons in a potential well. The photon and its requirements for E = h& and l = 1, which are critical to aproper understanding of the atom, do not directly enter the standard Schrodinger equation picture.
This resonance of an electron in a Coulomb potential is a consequence of the deBroglie relation ($dB = h/mv) that isoften used, but seldom explained. Alternatively, it is answered in the form of a mathematical solution of the Schrodingerequation with ‘no further discussion required (allowed?).’ The relativistic addition of the Compton relation ($C = h/mc)does not alter the former solutions. However, instead of multiple resonances possible because of the variable v (theelectron velocity) in the deBroglie wavelength, there may be only a single KG resonance for the single Comptonwavelength (v & c). On the other hand, just as there are beat frequencies when two frequencies are combined, it ispossible that there are multiple resonances that can be associated with the relativistic (near-nuclear) regime [22]. Thispossibility needs exploration.
If we convert the wavelengths to frequencies, we get &C = mc2/h for the Compton frequency and a coupled frequencyfor the deBroglie wavelength. This new frequency is related to E = h&dB = " (' $ 1)mc2, where ' is (1 $ &2/c2)$1/2.Thus, as the electron orbit shrinks and the velocity approaches that of the speed of light, its gamma, ' , and effectivefrequency increases and the effective wavelength of the electron ($dB = h/' mv) decreases further. Is there anotherresonance at an even deeper level? Approximate solution to the KG equation says no! The neutron could be a candidatefor the deep orbit of known stability; however, it takes more energy to get there than the Coulomb potential can provideat even the classical electron radius. On the other hand, the KG equation does not include the nuclear potential, mass,or particle spin; and the approximate solution does not even allow angular momentum. With these inclusions, a moredetailed equation could convert mass energy of the proton, assumed to be infinite in the simple case, into electronmass or kinetic energy and produce a two-level ‘neutron’ or a heavier charged particle. Since there are a number ofapproximations in the KG equation and its solution(s), particularly as the nucleus is approached, the neutron couldprovide the deep relativistic orbit that we are addressing and we might not recognize it as such. Some known physicscould be violated that was not included as appropriate boundary conditions in the mathematical equations. Therefore,that possibility becomes a different story. The nought-orbit solution of the Dirac equation needs to be explored further.
We have given a logical basis for the existence of very-deep energy level for atomic electrons that is predicted by a
20 A. Meulenberg / Journal of Condensed Matter Nuclear Science 10 (2013) 15–29
relativistic correction to the Schrodinger equation. What keeps electrons from filling it and precipitating high rates offusion in, for example, water? A possible key is in the inability to transfer energy between one or more bound electrons,between a bound electron and a photon/phonon, between a bound electron and a proton, or between the Coulomb fieldand the relativistic electron without transferring angular momentum. Both photons and phonons are bosons and haveangular momentum of 1 (h). Therefore, they are not candidates for energy transfer in this l = 0 case. However, to fitthe model results, all Coulomb potential energy must be converted into the electron’s relativistic kinetic energy.
A potentially more important answer to the question of why the nought orbit is not observed comes from the standardsolutions of the Dirac equations in 1-D vs 3-D. While the 1-D equation predicts a nought orbit, the 3-D version does not[13]. I had attributed this difference to the singular Coulomb potential. However, even when using a truncated potentialwithout singularity, this difference remains. There is a piece of information here that pertains directly to the presentdevelopment. An atom in free, or semi-free, space is essentially in three dimensions. However, when in a very-strongelectric field, a single dimension dominates. The lochon model describes that very situation. If the standard modelof the Dirac equation is correct, the very act of bringing two nuclei into close proximity, creates a nought orbit. Thenought orbit would almost never be observed, or recognized if observed, because it has such a transitory existence.Only if the orbit(s) can be populated by one or more electrons, and the nuclei stabilized in a femto molecule, would thenought orbit’s existence be demonstrable. We will explore the other options and implications below.
3. Naught Orbits as Applied to the Lochon Model
There are several differences between Naudts’ model and the Lochon Model of a nought orbit. First, the lochon modelpredicts two electrons in the orbit rather than one. This complicates matters and yet, being a boson, the electron pairalso counters some arguments against the naught orbit. As a first-order approximation, we ignore the fact that theelectron pair is two electrons with a mutually repulsive nature and not a single doubly charged boson. Assuming aboson with charge of 2e and mass of M = 2mo, Eqs. (2) and (3) give new values for energy and orbit radius. The energydepends on both mass and potential. The mass and charge are both doubled so that the lochon nought-orbit radius r *
owill be twice cut in half (hence, r *
o = "100 fm). The potential V for a single electron, given as proportional to thefine structure constant over the radius, will quadruple because of the reduced radius and double again because of thedouble charge. However, the r dependence cancels out in the calculation for the energy. Therefore, the lochon energylevel is E *
o = 2moc2(2") = 4Eo. (Inclusion of the electrons’ repulsion may reduce this energy to 1/2 to 3/3 of that for asingle-bodied doubly charged boson. However, the near-field relativistic magnetic attraction – spin–spin, orbit–orbit,and spin–orbit – may counter this effect.) On the other hand, the binding energy (a negative value) for the pair, being E *
ominus the rest mass energy, is still going to be close to twice that for the single electron (in our present approximation).
The actual value of E *o does not change the binding energy much. That is dominated by the mass energy and
Compton-wavelength resonance. Therefore, the internal energy of the lochon, which can reduce the Coulomb attractionof the nucleus for the paired electrons by 25– 50%, has little impact on the nought-orbit lochon binding energy that is"1 MeV. However, it could increase the field radius, r *
o, so that it exceeds the Compton radius of a single particle withthe same mass.
The binding energy for the nought-orbit lochon is: " 1 MeVThe kinetic energy of the nought-orbit lochon is: " 1 MeVThe potential energy of the nought-orbit lochon is: " -2 MeVThe suggested nought-orbit lochon radius, r *
o, is: " 100–200 fmTo achieve this high magnitude of potential energy, the average electron-charge orbital radius is only on the order
of a Fermi, which is near to the classical-electron radius. The electron has shed most of its identify in fusing with thenuclear proton(s) field. The Zitterbewegung is of the order of 390 fm. However, from Eq. (1), the strong 3-D focusingof the electron motion about the nucleus of r$1exp(-r/ro) allows dimensions of the average field concentration to be

A. Meulenberg / Journal of Condensed Matter Nuclear Science 10 (2013) 15–29 21
this small. Therefore, the Heisenberg Uncertainty Principle is not violated by the small confinement for a low-masscharged particle.
4. Muon Catalysis
Muons catalyze D–D fusion by filling a deep ground-state level in hydrogen atoms that is roughly 200 times smallerin radius than that of the electron [23,24]. This means that they first form pseudo-neutrons (pico-atoms) and then tinyhydrogenic molecular ions (pico-molecules of p–P, p–D, p–T, d–D, d–T, or t–T). These pico-molecules are bound by amuon and would be much smaller than the corresponding molecular ion bound by an atomic-orbit electron. In the d–Dcase, the proximity is sufficient to allow fusion to occur within 10s of picoseconds [25]. On fusion, the muon generallyflies off to restart the cycle.
Before we get into the muon-catalyzed fusion of nuclei, it is useful to mention muon fusion with a nucleus andhow it would differ from nought-orbit electron fusion with a nucleus. This comparison is important because it providesinformation, from a well-studied system, on the effects of a tightly bound negative charge for its capture by differentnuclei. “We shall also assume that lepton universality holds better than we need, so that the many lessons learned fromµ decay can be transferred over to muon capture, which thus can be considered as an extension of electron capture,though perhaps with many more states available” [26]. Except for very light nuclei, muon capture is more likelythan muon atomic decay through the many available states to the lowest orbit. We are interested in both the very-lightnuclei and a system with no states between the lowest Bohr orbit (n = 1) and the nought orbit (n = 0). Some otherdifferences exist. The muon has sufficient energy to form a neutron from a proton; the nought-orbit electron alonedoes not. “When muon capture occurs in any nucleus, the energy release of about 100 MeV is mainly donated to theneutrino,…’ and “… for muon capture from a µ–p atom, the recoiling neutron takes only 5.2 MeV of kinetic energy,whilst the neutrino takes away 99.1 MeV.” This means that any fusion reaction with muons falls into the high-energynuclear-physics regime. There can be no question about the non-existence of a nought orbit for the muon. The highmuon mass means that its nought orbit would be much smaller than that for an electron and therefore capture/fusionwould be nearly instantaneous. Can the same point be made for an electron in a nought orbit about a high-Z nucleus?Another point, which may become important for electron decay to the nought orbit about a proton, is that the muoncapture rate from a singlet state is more than 50 times that from the triplet state.
How does this picture compare with that of the Lochon Model? The muon starts out being massive and independent.The Lochon starts out as a bound electron pair in an s orbital about a nucleus (generally hydrogenic in our usage).The muon, on ‘atomically’ binding to a ‘proton’ subsequently finds another hydrogen atom or molecule and formsa very small (pm-size) molecule. The lochon in a special lattice matrix does work on a colliding hydrogen pair andin the process gains kinetic energy as it slides deeper into the Coulomb potential well. The muon resides in a deep‘Bohr’ orbit (" 250 fm) and the separation of the muonic molecule nuclei is about twice that radius. If attained,the nought-orbit-bound lochon will have become relativistic and, being doubly charged in the n = 0 orbit (at 100–200 fm,by one interpretation of the KG equation), will bind another proton or deuteron at about that distance, forminga ‘pico-molecule’.
The muonic molecular ion (e.g., HµH+) and the nought-orbit molecular ion (e.g., HˆH+) are of nearly the same size(both less than a pm in diameter). The major differences are in the location of the energies and the energy levels. Theexcess energy of the muonic molecule (relative to standard molecular hydrogen) is in the muon mass. In the nought-orbitmolecule, much energy is tied up in electron and nucleon kinetic energy and in the concentrated, fluctuating, EM fieldsabout the relativistic electron pair. This ‘AC’ EM-field energy, resulting from the extreme electron acceleration, hasbeen subtracted almost entirely from the proton field-energy (mass) in the nought-orbit molecule (not so in the muonicmolecule). From the fusion perspective, this reduced nuclear mass means that there might not be fragmentation inthe former case and there is confirmed fragmentation in the latter case. This is a major difference in the conventional
22 A. Meulenberg / Journal of Condensed Matter Nuclear Science 10 (2013) 15–29
muon-catalyzed D–D fusion story and in the lochon-catalyzed cold-fusion story.If the nought-orbits were accepted, there is little doubt that fusion, with different or reduced fragmentation ratios,
would be expected. It would be understood as a natural consequence of the reduced energy of the combined nuclei.There is still the problem of how to populate these orbits. It is not a given that this orbit must be filled with the assistanceof paired hydrogenic atoms under just the right circumstances. It is possible that the nought-orbit atom, and thereforethe nought-orbit molecule or molecular ion, could be created in another manner.
Another difference in the fusion processes of the two molecules is a consequence of the relative muon or lochonability to radiate or otherwise couple the fusion energy away from the excited helium nucleus. The muon is fat and slowrelative to the relativistic electrons or lochon. Therefore, it has little ability to radiate much acquired nuclear energyin the fusion process. Because it cannot readily dissipate nuclear energy, the fragmentation process is still dominant.In the case of the 0.5–1 MeV tightly-bound electrons, they have the ability to couple closely to both the acceleratingnucleons and to the adjacent Pd electrons. With this proximity to, and energy flow from, the fusing deuterons, theymay drop below the fragmentation levels before that becomes a real event.
Fragmentation is a feature of energetic nucleons in an excited nucleus when that energy exceeds the binding of thepotential well. Both the muon and the lochon, as tightly bound negative charges, will be able to reduce the protonCoulomb forces that will try to force the nucleons out of the nucleus. However, the lochon has twice the charge and,particularly in a fermi-sized nought orbit, will therefore raise the fragmentation levels much more than can a muon.
5. Electron Capture
We can talk of muon capture from a deep orbit by the nucleus, but we also have information about orbital-electroncapture by the nucleus [27]. This process, equivalent to positron ((+) emission in terms of change in nuclear charge, isa major contributor in nuclear decay. By 1977, it was found to contribute to the decay of nearly 500 different nuclides.Electron capture from a nought orbit may become as important to transmutation processes [28] in LENR as is the actualfusion of nuclei.
Two principle observations are made that will pertain to the comparison of electron capture from an atomic orbit tothat from a nought orbit. First, the nuclear weak interaction converts nuclear energy, an orbital electron, and a nuclearproton into a neutron and neutrino. Second, EM radiation may be involved in the collapse of the electron from an atomicorbit into the nuclear region during the capture. The weak interaction has a very small range defined by the overlap ofthe atomic electron and nuclear wave functions. This latter is of the same order as the classical electron radius. Therange for generation of EM radiation (called internal Bremsstrahlung in this case), is much larger. It is defined by therange of the Green’s function and is of the order of the Compton wavelength (except for energies near the electronbinding energy, where the Green’s function range expands greatly).
While the interaction cross section of an EM interaction is much greater at the binding energy, the total interactionis still reduced by about four orders-of-magnitude because the weak interaction must still take place. In this case, thenuclear decay energy is shared between the electron, the neutrino, and the photon. While we may normally considerBremsstrahlung to be a continuous process with many photons coming out from an accelerating electron with an energycontinuum, the probability of even a second photon being emitted in this single-event process of electron capture ismuch less than that for a single photon. Here is a case, of an electron changing energy levels (greatly) and not generallyradiating photons. This apparent violation of both Maxwell’s equations and QM explanations must be addressedelsewhere. (While quantum electrodynamics mathematically treats it accurately, the physical mechanism of radiation,or its inhibition, is not developed therein.)
When electron capture from an atomic orbit is discussed, that from a molecule is often referred to in a side noteindicating that capture from ‘outer’ electron shells can be influenced by the chemical environment. In a nought-orbitmolecule (a femto-molecule?), the nought orbit can be considered the outer orbit and it is very much affected by the
A. Meulenberg / Journal of Condensed Matter Nuclear Science 10 (2013) 15–29 23
neighboring nucleus (and vice versa). This effect could greatly enhance or retard electron capture. One means ofexplaining this has to do with an altering of the nature of the transitions. Electron capture has ‘allowed’ transitions(%J = 0, #i# f = +1, if L = 1 and %J = 1, #i# f = +1) and various levels of ‘forbidden’ transitions %J = 0,1 #i# f = -1;and %J = n > 1 #i# f = (-1)n ; or %J = n > 1 #i# f = (-1)n$1, where L , J , and #gre the radiation multipolarity and thespin and parity of the various states Forbidden transitions could be many orders of magnitude less likely than allowedones. The probability of electron capture relative to fusion of the nuclei in a femto-molecule could depend as much onparity as on the energy levels of the product nuclei.
As a competition to nought-orbit catalyzed fusion, the well-known electron capture from an atomic orbit should becompared with that proposed from a nought orbit. Some similarities include:
(1) Both atomic- and nought-orbit electron capture probabilities are proportional to their wave function overlapprobability with that of the nucleus (e.g. the electron density at the nucleus).
(2) Both may emit EM radiation in the process.(3) The assumed nuclear-charge distribution affects the capture probability calculation. However, for light elements,
the electron, during a transit, may have a greater effect on nuclear charge distribution than the model used.(4) Relativistic effects are important (s orbitals transit the nuclear region).(5) Capture probability depends on parity and change in angular momentum (spin and orbital) during the transition.
Forbidden transitions are many orders-of-magnitude less probable.
Some differences are as follows.
(1) The electron density for a nought-orbit electron is orders of magnitude larger than that for an atomic-orbitalelectron. Thus, nought-electron-capture probability can become orders of magnitude higher than the probabilityof positron decay (or some other decay paths) from many radioactive nuclei. This mechanism alone provides abasis for the observed LENR reduction of radioactive waste materials as seen in the transmutation studies thatshow strong trends toward stable nuclear isotopes.
(2) Effects of orbital-electron screening is large for orbital-electron capture, but negligible for nought-orbit electroncapture - where the orbit is far inside that of the atomic electrons and the nought-electron capture probability isso much higher.
(3) For the nought-orbit electron, distortion of the nuclear charge density is significant most of the time, not justduring a transit.
(4) Relativistic effects are important mainly for high-Z (Z > 70) atoms (where low-n orbital electrons are rela-tivisitic and transit the nucleus).
(5) Introduction of another ‘coupled’ nucleus can alter the transition probability of the nought orbit by changing theparity, spin, or angular momentum of the final nuclear state. Thus, a forbidden transition can become allowed,and vice versa. This cannot happen with an atomic electron capture.
(6) The lack of energetically nearby atomic levels, makes more difficult any transfer of energy from a nought-orbitelectron in its descent into the nucleus.
(7) The possibility of a lochon in a nought orbit, rather than a single electron, can change the spin and parity ofboth the initial and final states to increase the probability of either nuclear fusion or of electron(s) capture.
(8) A lochon in a nought orbit does have high proximity and enough energy to create a neutron from a proton(but not the one it is orbiting until the nuclear potential is available). Therefore, the fusion of a hydrogenicfemto-molecule (p–2eˆ—p % d+ + e) is very rapid.
24 A. Meulenberg / Journal of Condensed Matter Nuclear Science 10 (2013) 15–29
6. Internal Conversion
The details of nuclear de-excitation, once a nought-orbit electron, lochon, atom, or even a nought-orbit molecule havebeen captured by a nucleus, must be explored. There are similarities and differences between these systems and thatof normal nuclear decay. In electron capture, the formation of a neutron allows decay to a lower, or ground, state withthe excess nuclear energy leaving via the neutrino, and perhaps a gamma ray. Electron capture from the nought-orbitis not greatly different. However, the electron binding energy and kinetic energy are much greater. Therefore, theenergy requirements for the process are much less. Nevertheless, neutron formation is a weak interaction and there arecompeting processes for converting the nought-orbit or nuclear fusion energy to lower levels. Internal conversion, IC,is one of them.
IC is a radioactive decay process whereby an excited nucleus interacts with an electron in one of the deepest atomicorbitals, causing the electron to be emitted from the atom. However, the high-speed selectrons from internal conversionare not beta particles (( particles) since they have a well-specified discrete energy and have no associated neutrinos.The kinetic energy of the emitted electron is given as E = hg)g= (Ei $ Ef) $ EB, where Ei and Ef are the energiesof the atom in its initial and final states (including excited nucleus), respectively, while EB is the binding energy ofthe electron [29] and ) is the frequency of the electric dipole moment of the nucleus [32]. Since the probability ofIC is proportional to (2mc2/h)p7vy, energetic conversion electrons are much less common than low-energy ones (keVrange). The high binding energy of a nought-orbit electron (EB = " 0.5 MeV) prevents ejection of such electrons fortoo small energy transfers (%E = (Ei $ E f ) < EB). On the other hand, in the case of d–Dˆ fusion, the energy offusion is so high (E = "20 MeV) that, as the fusion energy is converted into nucleon kinetic energy, internal conversioncould be a major pathway for ejecting the nought-orbit electron as the nucleons approach within keVs of ground state.This event occurs by reducing the nuclear energy in a single energy step close to the electron binding energy. Anotherdifference between d–Dˆ fusion and normal IC has to do with the stability of the nuclear states. If Ei is not fixed (nota stationary orbit), then the conversion electron will not have a fixed energy. What values of the energies (Ei and E f )
should be used for an actively decaying nucleus in the equation above? The final energy of such IC is not necessarilythe ground state. How do the dynamics of this process affect the IC-like decay probability relative to the other decaymechanisms?
In the internal-conversion process, the wavefunction of an inner-shell electron penetrates the nucleus and maycouple to the excited state and take the energy of the nuclear transition directly, without an intermediate gamma raybeing produced first. The process of imparting energy to the electron may be seen as taking place by means of a virtualphoton, which never appears - except as a feature of an equation rather than as a directly measurable particle.
The importance of IC to our discussion of the nought-orbit electrons and the lochon is the known direct transferof excess nuclear energy to transiting electrons. Whether an electron or lochon is in a nought orbit of an atom, afemto-molecule, or in a fusing pair, because of the proximity to an adjacent accelerating charge [30,31], it is able todraw energy from any excited-state protons (and perhaps the neutrons?). In the same ‘manner’ as a photon can formfrom the EM field about an excited atomic electron, energy can concentrate in a resonant state or flow into or throughan ‘absorber’, e.g., the bound electron (this ‘manner’ is the topic of another paper) from Ref. [32]:
“In a semiclassical picture of internal conversion, the atomic electron is perturbed by an electromagnetic field thatcontains near- as well as far-zone components. The former corresponds to the instantaneous electromagnetic field,the latter contains components due to retardation which transport energy off to, in principle, infinity, that is, radiationcomponents.”
A deep-orbit electron, being relativistic most of the time, provides (and can receive) a much higher level of bothnear- and far-field EM energy from the nucleus than does an atomic electron. Thus, both IC and the nuclear-inducedphoto-effect are greatly enhanced. Sorenson continues,
“… contributions to internal conversion primarily come from distances from the nucleus of the order of the Compton
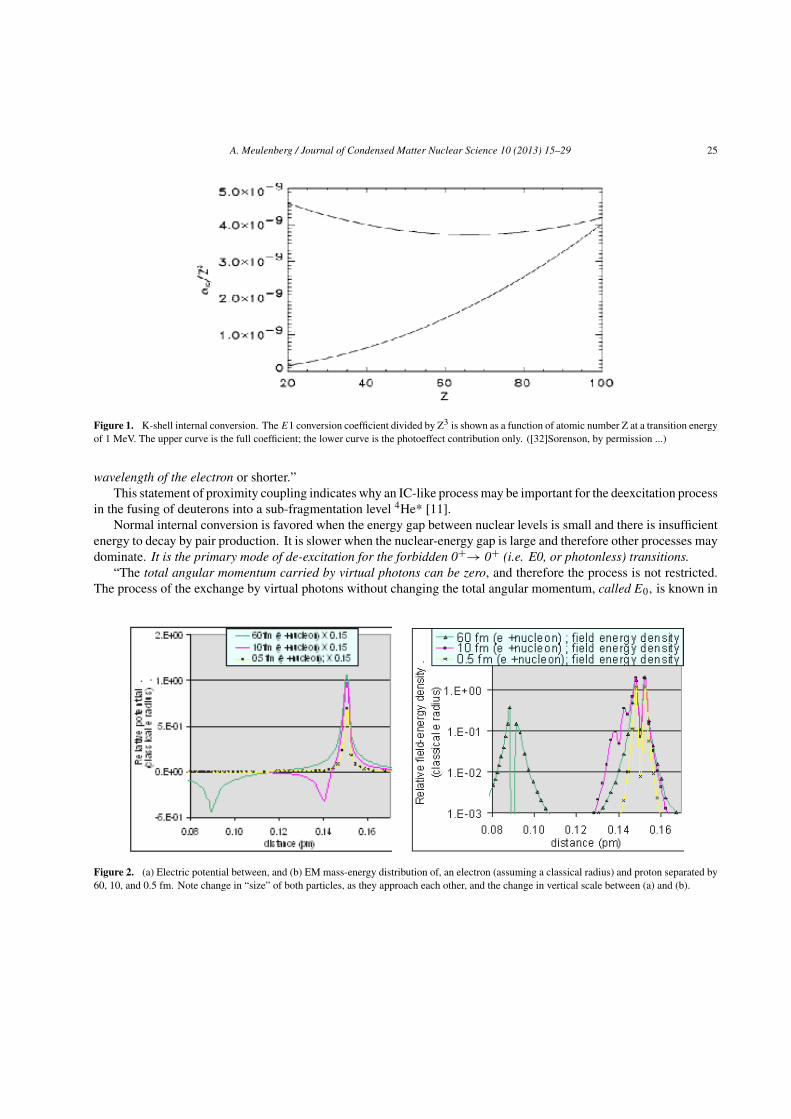
A. Meulenberg / Journal of Condensed Matter Nuclear Science 10 (2013) 15–29 25
Figure 1. K-shell internal conversion. The E1 conversion coefficient divided by Z3 is shown as a function of atomic number Z at a transition energyof 1 MeV. The upper curve is the full coefficient; the lower curve is the photoeffect contribution only. ([32]Sorenson, by permission ...)
wavelength of the electron or shorter.”This statement of proximity coupling indicates why an IC-like process may be important for the deexcitation process
in the fusing of deuterons into a sub-fragmentation level 4He* [11].Normal internal conversion is favored when the energy gap between nuclear levels is small and there is insufficient
energy to decay by pair production. It is slower when the nuclear-energy gap is large and therefore other processes maydominate. It is the primary mode of de-excitation for the forbidden 0++ 0+ (i.e. E0, or photonless) transitions.
“The total angular momentum carried by virtual photons can be zero, and therefore the process is not restricted.The process of the exchange by virtual photons without changing the total angular momentum, called E0, is known in
Figure 2. (a) Electric potential between, and (b) EM mass-energy distribution of, an electron (assuming a classical radius) and proton separated by60, 10, and 0.5 fm. Note change in “size” of both particles, as they approach each other, and the change in vertical scale between (a) and (b).
26 A. Meulenberg / Journal of Condensed Matter Nuclear Science 10 (2013) 15–29
nuclear spectroscopy and is sometimes called photonless exchange” [33]¸ my emphasis.In this process, the excited nuclei are able to rid themselves of energy (donating it to relativistic electrons) without
changing electric and magnetic moments.Compared to many competitive processes such as radiation or the photoelectric effect, IC is a dominant decay
mode for low-Z nuclei, even when angular momentum is available (for allowed photo-transitions). The upper curvein Fig. 1 (Sorenson fig get permission), for the total dipole-conversion coefficient ("I C = IC + photo effect) divided byZ3 as a function of Z , shows this increasing internal conversion coefficient relative to the photoeffect with decreasingatomic number. Since both effects are related to the number density of electrons in the vicinity of the excited nucleus,can the photoeffect be enhanced by the near presence of adjacent lattice-atom electrons? (For example, as the s–dhybrid electrons are shared by the Pd and D atoms.) If so, it would be a major means of dissipating excess nuclearenergy resulting from fusion of deuterons in condensed matter. In the case of femto-hydrides with a high-Z partner,the photoeffect would likely be the dominant de-excitation mode.
Internal conversion for forbidden optical transitions is greater for small nuclear-energy gaps. Therefore, MeVnaught-orbit electrons are not likely to be ejected from the nuclear region, via IC, until the nuclear energy has droppedto much lower levels or, via photoemission, until the electrons or protons have acquired angular momentum during thedecay process to the 4He ground state.
What are the similarities between internal conversion in the solid state [34]and the proposed nought-orbit electronor lochon-induced de-excitation of the excited 4He* nucleus?
(1) Both are an exchange of energy between nucleons and electrons transiting the nucleus.(2) Energy is directly transferred from protons to electrons within an electron Compton radius of the nucleus(3) Angular momentum is not necessarily transferred between nucleons and nought-orbit or internal-conversion
electrons(4) Both are competing with other nuclear decay modes.(5) Both take place when other, faster, decay processes are not possible or are suppressed, e.g., the forbidden
0+ +0+ transitions.(6) Both may result in the exit from the atom of an energetic electron.
How does internal conversion differ from the proposed lochon-induced deexcitation of the excited 4He* nucleus?
(1) IC is important in unstable or metastable nuclear states. Nought-orbit electrons, and a lack of any stable statesbeneath the energy level of an excited nucleus (e.g., in lochon-mediated deuterium fusion) prevents the relativenuclear stability required for consistent energy transfer to photons and atomic-orbit electrons.
(2) Internal conversion for forbidden transitions dominates in small-energy-gap transitions; the 4He* to 4He ground-state energy difference is very large (at least initially).
(3) Energies in the excited 4He* nucleus are sufficient to make real electron-positron pair production a competitiveprocess. IC for high-energy forbidden optical transitions is generally low and generally cannot compete withpair production. However, this characteristic radiation has not been observed in LENR – why not? See 1 above.
(4) Internal-conversion electrons exit the nucleus with fixed energy; in LENR, energetic electrons have not beenobserved to exit the nucleus; and, in the present model, they will not do so until they have already transferredmost of the excess nuclear energy to the surrounding electrons.
(5) Internal-conversion electrons have binding and average kinetic energies in the atomic-orbital range. Lochonshave binding and average kinetic energies in the MeV range. This difference in energies means that:
(a) The much greater binding energy of the lochon, makes it more difficult to be ejected from the nucleusCoulomb potential. Therefore, it can accumulate and reradiate large amounts of energy without beingejected itself.
A. Meulenberg / Journal of Condensed Matter Nuclear Science 10 (2013) 15–29 27
(b) The deBroglie frequencies of the Mev lochon is greater than that of the multi-Mev nucleons and thereforecan accumulate (and reradiate) energy from the 4He* protons. This competitive decay path (and theforbidden photo transition) accounts for the low observed electron–positron pair production.
(c) The deBroglie frequency of a low-Z atomic electron (multi-eV) is less than that of the nucleons andtherefore cannot gain resonant energy from such a source.
(d) The energy transfer from energetic nuclear protons to lattice electrons via proximity coupling is orders-of-magnitude less for the lower energy internal-conversion electrons.
(6) The possibility of an electron pair (lochon) rather than a single electron interacting with the nucleons permitssome additional decay processes. For instance, actual photon exchange might occur for paired electrons so thatno net change in nucleon angular momentum results.
The net result of these two lists is to show that there exists a process that allows transiting energetic electronsto de-excite a nucleus, via direct energy coupling and an internal-conversion-like process, without violating knownphysics. Also, the differences between internal conversion and the proposed lochon-induced deexcitation processes allpoint to a much greater efficiency in the energetic LENR process. This direct energy-coupling process improves theLENR competition with other decay modes. Therefore, even with fragmentation energetically possible, the ‘internal-conversion’ energy-transfer process involving tightly bound (and paired?) electrons could be important pathways tothe 4He ground state.
7. Summary
The Extended Lochon Model, in seeking to explain the observed phenomena of LENR, has begun to provide anunderstanding of bound electrons in relativistic quantum mechanics that has been available from the mathematics (KGand Dirac equations) for many decades. This important application of the ‘naught’ orbit may lend credence to a here-to-for rejected solution in the Quantum Mechanics formalism. The mathematical wave-mechanics model may not bethe reality. However, if not, it still reflects reality very well in most cases and is a very useful tool. We may not knowexactly how it works; and as a consequence we may not interpret it correctly. Nevertheless, with a new set of datafrom LENR, we may now be able to provide new insights into the physical nature of elementary particles and theirinteractions and benefit from some work that has gone before, but has not necessarily been accepted.
The naught orbit, defined by both the nature of an electron and its relativisitic interaction with charged nucleons,now becomes a powerful tool for physically explaining some accepted mathematical physics as well as a here-to-foreavailable, but unaccepted, physics model. It provides a mechanism for understanding how nature has avoided thecontradiction of an apparent singularity at the center of a Coulomb potential about a charge. More details of this newunderstanding, as it rapidly evolves, will be provided elsewhere. LENR may be providing the data needed to open upthe mystery of the nuclear interaction and to combine both nuclear and atomic physics in a smooth manner.
Acknowledgements
This work is supported in part by HiPi Consulting, New Market, MD, USA; by a Universiti Sains Malaysia Re-search Grant (1001-PNAV-817058), by the Science for Humanity Trust, Bangalore 560094, India; and by the Sci-ence for Humanity Trust Inc, Tucker, GA, USA. Various members of the CMNS googlegroup have been most help-ful in contributing concepts and comments to the development of this model. In particular, Tom Barnard (ideasdeveloping at http://www.ichaphysics.com/blog-commentary/), Robert Godes (brillouinenergy.com, ideas now ex-pressed in Infinite Energy http://www.brillouinenergy.com/GodesIE82.pdf), and Horace Heffner (ideas now organizedat http://www.mtaonline.net/"hheffner/dfRpt and http://www.journal-of-nuclear-physics.com/?p=179_) provided new
28 A. Meulenberg / Journal of Condensed Matter Nuclear Science 10 (2013) 15–29
ideas and novel concepts that supported, or developed into, important parts of the extended lochon model. Scott Chubbcorrected a misconception of the nature of the hydrogen electron structure in the Pd lattice. Ed Storm, from his greatknowledge of the LENR field and desire to understand the actual mechanisms, contributed continuing feedback in theform of useful questions and challenges.
References[1] V.A. Chechin, V.A. Tsarev, M. Rabinowitz and Y.E. Kim, Critical review of theoretical models for anomalous effects in
deuterated metals, Int. J. Theoret. Phys. 33 (1994) 3.[2] K.P. Sinha, Theoretical model for low-energy nuclear reactions in a solid matrix, Inf Energy 29 (2000) 54.[3] K.P. Sinha and A. Meulenberg, Laser stimulation of low-energy nuclear reactions in deuterated palladium, Current Science 91
(2006) 907 ( arXiv:cond-mat/0603213).[4] K.P. Sinha and A. Meulenberg, Lochon catalyzed D–D fusion in deuterated Pd in the solid state, Nat. Acad. of Sc. (India)
Letters 30(7,8) (2007) ( arXiv:0705.0595v1).[5] K.P. Sinha and A. Meulenberg, A model for enhanced fusion reaction in a solid matrix of metal deuterides, in Proc. of ICCF-
14 Int. Conf. on Condensed Matter Nuclear Science, Washington, DC, (2008), ISBN: 978-0-578-06694-3, D.J. Nagel, M.E.Melich, R. W. Johnson, S.R. Chubb and J. Rothwell (Eds.), http://www.iscmns.org/iccf14/ProcICCF14b.pdf.
[6] K.P. Sinha and A. Meulenberg, Quantum-correlated fluctuations, enhanced tunneling, and low-energy nuclear reactions incondensed matter (alloys), 16th Int. Conf. On Condensed Matter Nuclear Science (ICCF-16), Chennai, 6 Feb. (2011), to bepub. J. Condensed Matter Nucl. Sci. (JCMNS) (6).
[7] F. Raiola, et al.. of the LUNA Collaboration, Enhanced electron screening in d(d,p)t for deuterated metals, Eur. Phys. J. A 19(2004) 283–287, DOI 10.1140/epja/i2003-10125-0.
[8] K. Czerski, A. Huke, P. Heide and G. Ruprecht, Evidence for a host-material dependence of the n/p branching ratio of low-energyd+d reactions within metallic environments, Eur. Phys. J. A 27 (2006) 187.
[9] J. Naudts, On the hydrino state of the relativistic hydrogen atom, http://arxiv.org/abs/physics/0507193.[10] A. Meulenberg and K.P. Sinha, Tunneling beneath the fragmentation level, 15th Int. Conf. on Cond. Matter Nuclear Science,
Rome, Italy, Oct. (2009).[11] A. Meulenberg and K.P. Sinha, Tunneling beneath the 4He! fragmentation energy, J. Condensed Matter Nucl. Sci., JCMNS 4
(2011) 241–255.[12] http://en.wikipedia.org/wiki/Halo_nucleus.[13] H.N. Spector and J. Lee, Relativistic one-dimensional hydrogen atom, Am. J. Phys. 53 (1985) 248.[14] Zhong-Liang Zhang, Wu-Shou Zhang and Zhao-Qun Zhang, Further study on the solution of Schrödinger equation of hydrogen-
like atom, Pro. 9th Int. Conf. on Cold Fusion. May 21–25, 2002, Beijing, China, pp. 435–438.[15] J.V. Kadeisvili, The Rutherford–Santilli neutron, Hadronic Journal 31 (2008) 1–114.[16] N. Dombey, Phys. Lett. A 360 (2006) 62.[17] A. S. de Castro, Phys. Lett. A 369 (2007) 380.[18] T. Nadareishvili, A. Khelashvili, Some problems of self-adjoint extension in the Schrodinger equation,
http://arxiv.org/abs/0903.0234 accessed 28 June 2010.[19] J.A. Maly and J. Vavra, Electron transitions on deep Dirac levels I, Fusion Technol. 24 (Nov) (1993)
http://people.web.psi.ch/pruchova/Vavra_d_dirac_l.pdf.[20] R.A. Rice, Y.E. Kim and M. Rabinowitz, Comments on electron transitions on deep Dirac levels I, Fusion Technol. 26 (1994)
110.[21] http://hyperphysics.phy-astr.gsu.edu/hbase/hframe.html.[22] J.A. Maly and J. Vavra, Electron transitions on deep Dirac levels II, Fusion Techol. 27 (Jan) (1995) 59.[23] J.D. Jackson, Muonic-hydrogen molecular bound states, quasibound states, and resonances in the Born-Oppenheimer approx-
imation, Phys. Rev. A 49(1) (1994).[24] J.D. Jackson, A Personal adventure in muon-catalyzed fusion, Phys. Perspect. 12 (2010) 74–88 _2009, Published open access
at Springerlink.com, 1422-6944/10/010074-15, DOI 10.1007/s00016-009-0006-9.
A. Meulenberg / Journal of Condensed Matter Nuclear Science 10 (2013) 15–29 29
[25] J.C. Séamus Davis, Quoted from “Old question answered: ’Heavy fermions’ aren’t really heavy – they just dawdle,” CornellChronicle, June 3, 2010, http://www.news.cornell.edu/stories/June10/HeavyFermions.html.
[26] D.F. Measday, The nuclear physics of muon capture, Physics Reports 354 (2001) 243–409.[27] W. Bambynek et. al., Orbital electron capture by the nucleus, Rev. Mod. Phys. 49(1) (1977).[28] M. Srinivasan, G. Miley and E. Storms, Nuclear Energy Encyclopedia, Chapter 43, Steven B. Krivit and Jay H. Lehr (Eds.),
John Wiley, ISBN 978-0-470-89439-2 (Aug) (2011).[29] http://en.wikipedia.org/wiki/Internal_conversion .[30] K.P. Sinha, A. Meulenberg and P.L. Hagelstein, Quantum-coupling between closely-spaced surfaces via transverse photons,
arXiv:cond-mat/0606184v2.[31] K.P. Sinha and A. Meulenberg, Radiative-field quantum-coupling between closely-spaced surfaces, arXiv:0902.0682.[32] A.H. Sørensen, Internal conversion and the photoelectric effect, Phys. Rev. A 73 032719 _2006.[33] H.C. Pauli, K. Adler and R.M. Steffen, The Electromagnetic Interaction in Nuclear Spectroscopy, W.D. Hamilton (Ed.),
(North-Holland, Amsterdam, Oxford, 1975), p. 341.[34] P. Kalman and T. Keszthelyi, Phys. Rev. C69 (2004) 031606(R).
J. Condensed Matter Nucl. Sci. 10 (2013) 30–39
Research Article
Protocol for a Silicate-based LENR Using Electrodesof Various Metals
Brian P. Roarty !
522 Outlook Drive, Los Altos, CA 94024, USA
Carol J. Walker308 Martindale Avenue, Ojai, CA 93023, USA
Abstract
This paper reports a protocol that consists of applying concurrent electronic and photonic stimuli in a cell with two or more electrodesat or near the boiling point of the liquid. The liquid in the cell is a solution including a silicate, a lithium salt, and a surfactant. Theelectrical stimuli are RF signals and, optionally, a direct current. The protocol generates an exothermic reaction characterized bysharp temperature transients. We have successfully used three different silicates and four different metals for electrodes. We believethe exothermic reaction is nuclear in nature. The evidence supporting that statement includes:
• Data logs show brief, intense temperature transients.• Electron diffraction scattering (EDS) analyses show elements to be present after the reaction that could be transmutation
products of several elements in the ingredients of the protocol, specifically including silver, a possible transmutationproduct of palladium.
• Auger analysis of one experiment also shows evidence of transmutation of the elements in the reaction cell.• SEM photos show “volcanic sites” and other evidence of metal migration.• Other SEM photos show large areas where electrodes have spalled during experiments.
© 2013 ISCMNS. All rights reserved. ISSN 2227-3123
Keywords: Gold, Heat transients, LENR, Lithium silicate, Palladium
1. Background
We hypothesized that using a lower surface tension electrolyte in the Fleischman–Pons experiment would better wetthe Pd electrode, leading to more efficient reaction and possibly greater excess heat. Anionic silica hydride was chosenbecause it is a soluble silicate known to have surfactant properties, but not to have a surfactant tail, which we wanted to
!E-mail: [email protected]
© 2013 ISCMNS. All rights reserved. ISSN 2227-3123
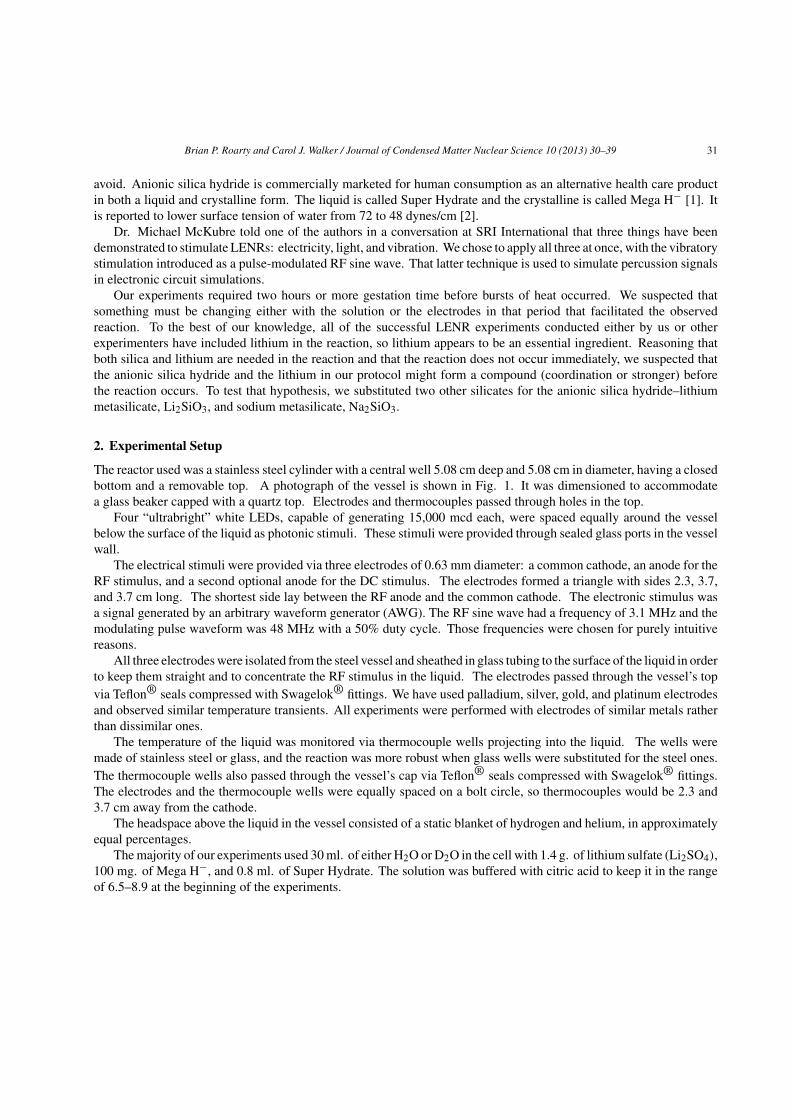
Brian P. Roarty and Carol J. Walker / Journal of Condensed Matter Nuclear Science 10 (2013) 30–39 31
avoid. Anionic silica hydride is commercially marketed for human consumption as an alternative health care productin both a liquid and crystalline form. The liquid is called Super Hydrate and the crystalline is called Mega H" [1]. Itis reported to lower surface tension of water from 72 to 48 dynes/cm [2].
Dr. Michael McKubre told one of the authors in a conversation at SRI International that three things have beendemonstrated to stimulate LENRs: electricity, light, and vibration. We chose to apply all three at once, with the vibratorystimulation introduced as a pulse-modulated RF sine wave. That latter technique is used to simulate percussion signalsin electronic circuit simulations.
Our experiments required two hours or more gestation time before bursts of heat occurred. We suspected thatsomething must be changing either with the solution or the electrodes in that period that facilitated the observedreaction. To the best of our knowledge, all of the successful LENR experiments conducted either by us or otherexperimenters have included lithium in the reaction, so lithium appears to be an essential ingredient. Reasoning thatboth silica and lithium are needed in the reaction and that the reaction does not occur immediately, we suspected thatthe anionic silica hydride and the lithium in our protocol might form a compound (coordination or stronger) beforethe reaction occurs. To test that hypothesis, we substituted two other silicates for the anionic silica hydride–lithiummetasilicate, Li2SiO3, and sodium metasilicate, Na2SiO3.
2. Experimental Setup
The reactor used was a stainless steel cylinder with a central well 5.08 cm deep and 5.08 cm in diameter, having a closedbottom and a removable top. A photograph of the vessel is shown in Fig. 1. It was dimensioned to accommodatea glass beaker capped with a quartz top. Electrodes and thermocouples passed through holes in the top.
Four “ultrabright” white LEDs, capable of generating 15,000 mcd each, were spaced equally around the vesselbelow the surface of the liquid as photonic stimuli. These stimuli were provided through sealed glass ports in the vesselwall.
The electrical stimuli were provided via three electrodes of 0.63 mm diameter: a common cathode, an anode for theRF stimulus, and a second optional anode for the DC stimulus. The electrodes formed a triangle with sides 2.3, 3.7,and 3.7 cm long. The shortest side lay between the RF anode and the common cathode. The electronic stimulus wasa signal generated by an arbitrary waveform generator (AWG). The RF sine wave had a frequency of 3.1 MHz and themodulating pulse waveform was 48 MHz with a 50% duty cycle. Those frequencies were chosen for purely intuitivereasons.
All three electrodes were isolated from the steel vessel and sheathed in glass tubing to the surface of the liquid in orderto keep them straight and to concentrate the RF stimulus in the liquid. The electrodes passed through the vessel’s topvia Teflon® seals compressed with Swagelok® fittings. We have used palladium, silver, gold, and platinum electrodesand observed similar temperature transients. All experiments were performed with electrodes of similar metals ratherthan dissimilar ones.
The temperature of the liquid was monitored via thermocouple wells projecting into the liquid. The wells weremade of stainless steel or glass, and the reaction was more robust when glass wells were substituted for the steel ones.The thermocouple wells also passed through the vessel’s cap via Teflon® seals compressed with Swagelok® fittings.The electrodes and the thermocouple wells were equally spaced on a bolt circle, so thermocouples would be 2.3 and3.7 cm away from the cathode.
The headspace above the liquid in the vessel consisted of a static blanket of hydrogen and helium, in approximatelyequal percentages.
The majority of our experiments used 30 ml. of either H2O or D2O in the cell with 1.4 g. of lithium sulfate (Li2SO4),100 mg. of Mega H", and 0.8 ml. of Super Hydrate. The solution was buffered with citric acid to keep it in the rangeof 6.5–8.9 at the beginning of the experiments.

32 Brian P. Roarty and Carol J. Walker / Journal of Condensed Matter Nuclear Science 10 (2013) 30–39
Figure 1. Reaction cell, showing LEDs and ports on the side. Electrodes and thermocouple wells can be seen on the top, along with relief valvesand gas valves.
When Li2SiO3 and Na2SiO3 were used, they were mixed with EDTA to dissolve and/or suspend the silicates in theD2O. The electrodes used in those experiments were palladium. In the experiments using either lithium metasilicate orcalcium metasilicate, the solution was buffered, using sodium bicarbonate, to keep 6.5 <pH< 8.9.
The input heater power was determined by measuring the voltage and current applied to a heating coil, located ina cavity in the bottom of the vessel. The temperature of the vessel was initially raised to 101˚C ± 1˚C. After thetemperature of the liquid had remained stable within that range for at least two hours, we applied the photonic and RFstimuli. Temperature was controlled by manually adjusting the input power to the heating coil. We did not attempt todeliberately raise the temperature of the solution above the boiling point or to measure pressure.
In latter experiments we applied a signal consisting of a 3.1 MHz fundamental sine wave modulated by a smaller43.4 MHz sine wave. After reaching equilibrium near the boiling point of the solution, the applied stimuli add less than100mW of incremental power to initiate the reaction [3,4].
As a safety practice appropriate when working with exothermic reactions in a sealed vessel at or near the boilingpoint of water, our vessel was equipped with two relief valves set to lift sequentially at different pressures. We stronglyrecommend that others replicating this protocol do the same thing.
3. Results
Figure 2 shows a datalog from Experiment No. 1, where the horizontal axis is two minutes per division and the verticalaxis is either 1˚C or 1 V, as appropriate for the variable measured. Data was logged at 10-second intervals. Theexperiment was conducted with palladium electrodes in heavy water. The electrolyte was lithium sulfate and the silicareagent was anionic silica hydride. The time-varying electrical stimulus was the sinusoidally modulated pulse streamdescribed above.
• The data was logged with an Agilent 34970A Data Acquisition Unit, which uses a proprietary database system,
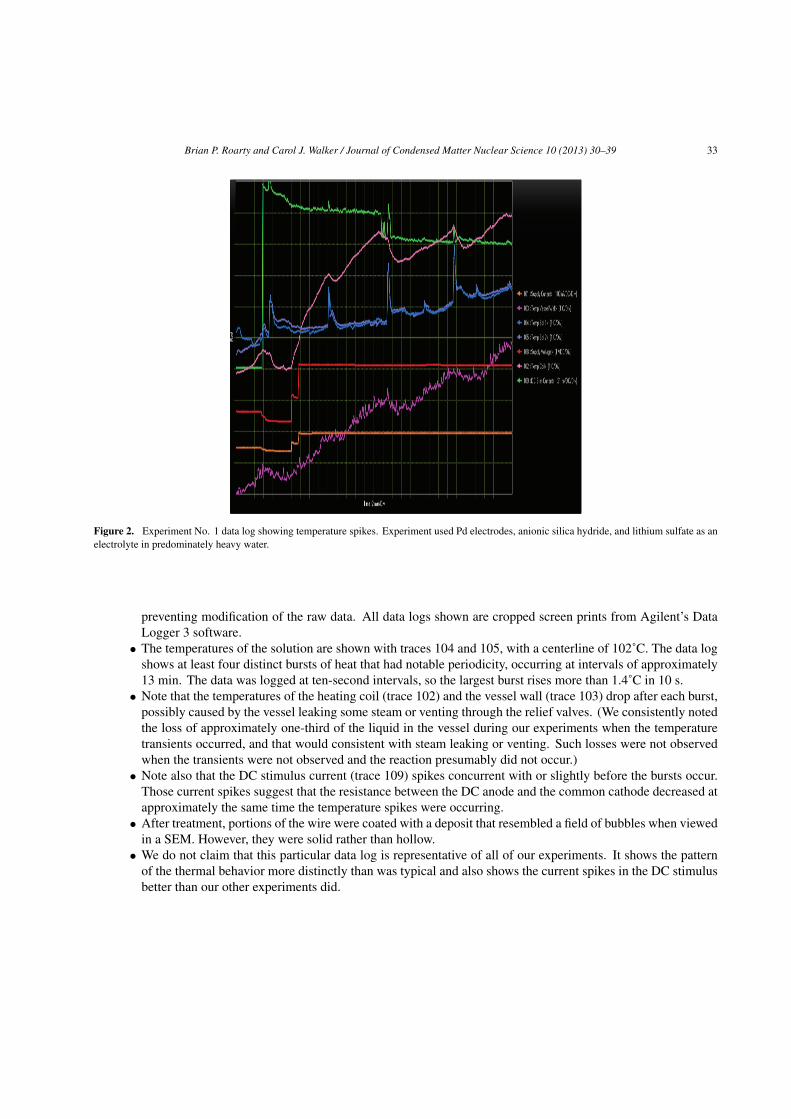
Brian P. Roarty and Carol J. Walker / Journal of Condensed Matter Nuclear Science 10 (2013) 30–39 33
Figure 2. Experiment No. 1 data log showing temperature spikes. Experiment used Pd electrodes, anionic silica hydride, and lithium sulfate as anelectrolyte in predominately heavy water.
preventing modification of the raw data. All data logs shown are cropped screen prints from Agilent’s DataLogger 3 software.
• The temperatures of the solution are shown with traces 104 and 105, with a centerline of 102˚C. The data logshows at least four distinct bursts of heat that had notable periodicity, occurring at intervals of approximately13 min. The data was logged at ten-second intervals, so the largest burst rises more than 1.4˚C in 10 s.
• Note that the temperatures of the heating coil (trace 102) and the vessel wall (trace 103) drop after each burst,possibly caused by the vessel leaking some steam or venting through the relief valves. (We consistently notedthe loss of approximately one-third of the liquid in the vessel during our experiments when the temperaturetransients occurred, and that would consistent with steam leaking or venting. Such losses were not observedwhen the transients were not observed and the reaction presumably did not occur.)
• Note also that the DC stimulus current (trace 109) spikes concurrent with or slightly before the bursts occur.Those current spikes suggest that the resistance between the DC anode and the common cathode decreased atapproximately the same time the temperature spikes were occurring.
• After treatment, portions of the wire were coated with a deposit that resembled a field of bubbles when viewedin a SEM. However, they were solid rather than hollow.
• We do not claim that this particular data log is representative of all of our experiments. It shows the patternof the thermal behavior more distinctly than was typical and also shows the current spikes in the DC stimulusbetter than our other experiments did.
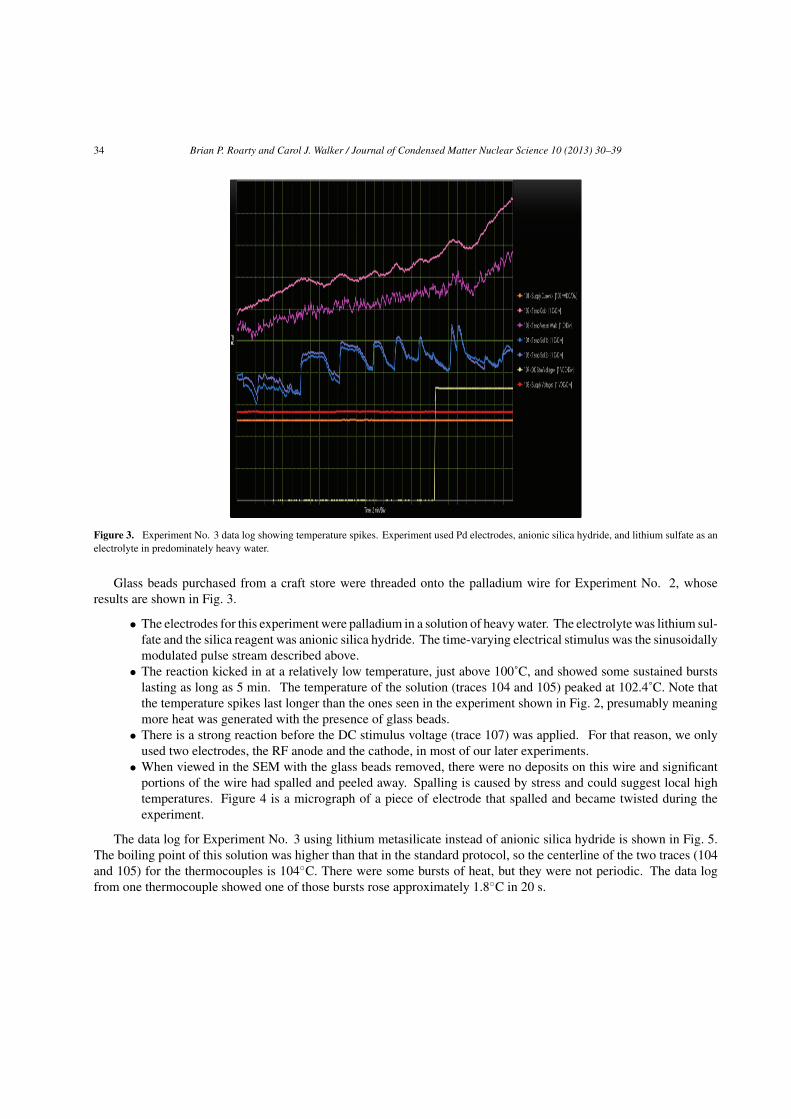
34 Brian P. Roarty and Carol J. Walker / Journal of Condensed Matter Nuclear Science 10 (2013) 30–39
Figure 3. Experiment No. 3 data log showing temperature spikes. Experiment used Pd electrodes, anionic silica hydride, and lithium sulfate as anelectrolyte in predominately heavy water.
Glass beads purchased from a craft store were threaded onto the palladium wire for Experiment No. 2, whoseresults are shown in Fig. 3.
• The electrodes for this experiment were palladium in a solution of heavy water. The electrolyte was lithium sul-fate and the silica reagent was anionic silica hydride. The time-varying electrical stimulus was the sinusoidallymodulated pulse stream described above.
• The reaction kicked in at a relatively low temperature, just above 100˚C, and showed some sustained burstslasting as long as 5 min. The temperature of the solution (traces 104 and 105) peaked at 102.4˚C. Note thatthe temperature spikes last longer than the ones seen in the experiment shown in Fig. 2, presumably meaningmore heat was generated with the presence of glass beads.
• There is a strong reaction before the DC stimulus voltage (trace 107) was applied. For that reason, we onlyused two electrodes, the RF anode and the cathode, in most of our later experiments.
• When viewed in the SEM with the glass beads removed, there were no deposits on this wire and significantportions of the wire had spalled and peeled away. Spalling is caused by stress and could suggest local hightemperatures. Figure 4 is a micrograph of a piece of electrode that spalled and became twisted during theexperiment.
The data log for Experiment No. 3 using lithium metasilicate instead of anionic silica hydride is shown in Fig. 5.The boiling point of this solution was higher than that in the standard protocol, so the centerline of the two traces (104and 105) for the thermocouples is 104#C. There were some bursts of heat, but they were not periodic. The data logfrom one thermocouple showed one of those bursts rose approximately 1.8#C in 20 s.

Brian P. Roarty and Carol J. Walker / Journal of Condensed Matter Nuclear Science 10 (2013) 30–39 35
Figure 4. Spalled portion of Pd cathode after treatment with protocol. This experiment included glass beads on the cathode. Such spalling wasonly seen when glass beads were used.
The data logs from the experiment with sodium metasilicate showed a temperature transient, albeit a small one.Figure 6 shows a “volcanic site” observed during SEM analysis of a gold electrode after treatment with the protocol.
Interestingly, gold does not form a hydride at or near the boiling point of water, so that means its metal lattice is notbeing loaded with either hydrogen or deuterium atoms during the protocol. That suggests that the reaction is not drivenby the interaction of those atoms while they are immobilized in the metal lattice and allowed to interact in ways thatare stochastically impossible as gases, as was postulated by Fleischman and Pons to cause “cold fusion”. Somethingelse is going on with this protocol besides that reaction.
We have performed three experiments where the BES analyses of the electrodes show the presence of silver,a possible transmutation product of palladium. We have also observed in SEM examinations that the apparentlytransmuted material is often associated with different morphologies than the surrounding palladium. Figure 7 showsa SEM photo and its accompanying BES spectra of the treated surface of a palladium cathode; silver is shown to bepresent on the surface. A similar BES analysis of the interior of the untreated interior of the wire did not show thepresence of silver.
BES analysis also detected the presence of nitrogen, fluorine, aluminum, and chlorine during various experiments,which could be transmutation products of elements added to the reactor, assuming these elements undergo Beta decay.
The cathode from one of those three experiments was also analyzed using Auger spectroscopy. That analysis showedthe presence of nitrogen, aluminum, chlorine, calcium, and zinc. Each of these also could be a transmutation productof one of the elements added to the reactor, again assuming those elements undergo Beta decay
The results of the BES and Auger analysis are summarized in Table 1. The left-hand column shows the elementsadded to the reactor. The next column shows the possible transmutation products of those initial elements. Both BESand Auger analysis have detection limits of 1%, and both kinds of analysis show five possible transmutation productsto be present. Magnesium is both an ingredient and a possible transmutation product, so its presence is not indicativeof a transmutation. The fields that are labeled “NA” indicate that the respective method does not detect the presence ofthose elements with lower atomic numbers. Na and Cu are shown in red because they were not listed as ingredients in
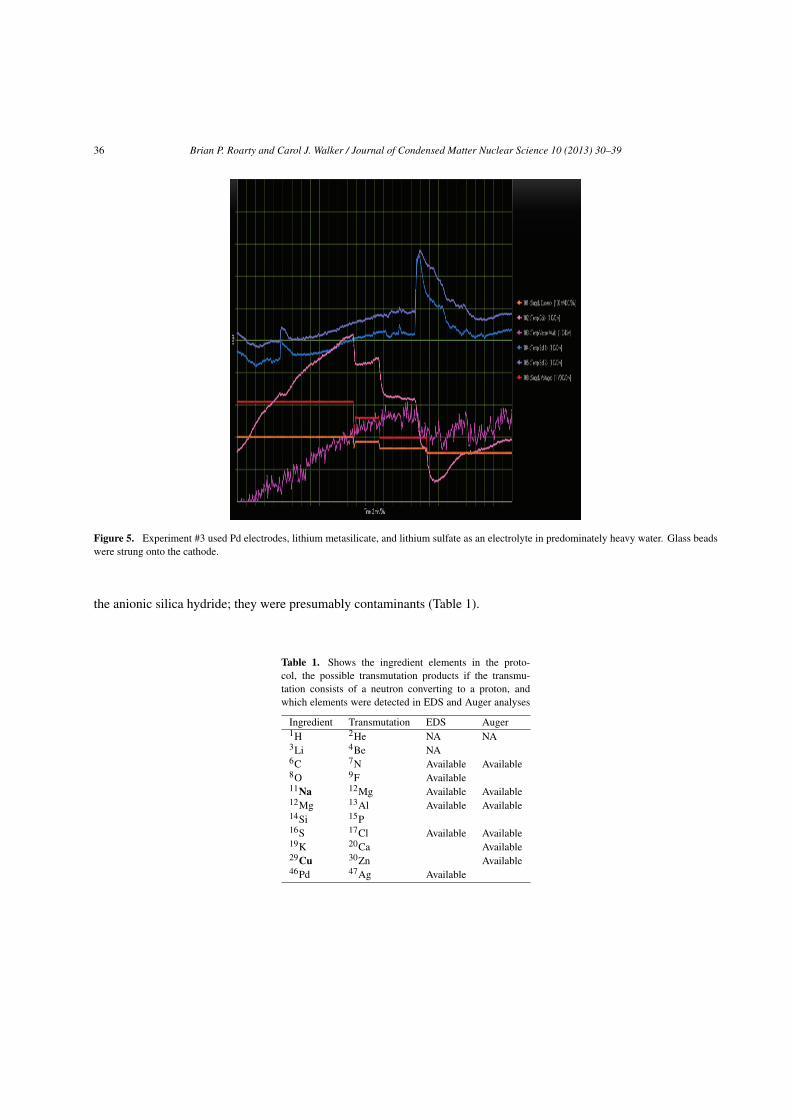
36 Brian P. Roarty and Carol J. Walker / Journal of Condensed Matter Nuclear Science 10 (2013) 30–39
Figure 5. Experiment #3 used Pd electrodes, lithium metasilicate, and lithium sulfate as an electrolyte in predominately heavy water. Glass beadswere strung onto the cathode.
the anionic silica hydride; they were presumably contaminants (Table 1).
Table 1. Shows the ingredient elements in the proto-col, the possible transmutation products if the transmu-tation consists of a neutron converting to a proton, andwhich elements were detected in EDS and Auger analyses
Ingredient Transmutation EDS Auger1H 2He NA NA3Li 4Be NA6C 7N Available Available8O 9F Available11Na 12Mg Available Available12Mg 13Al Available Available14Si 15P16S 17Cl Available Available19K 20Ca Available29Cu 30Zn Available46Pd 47Ag Available
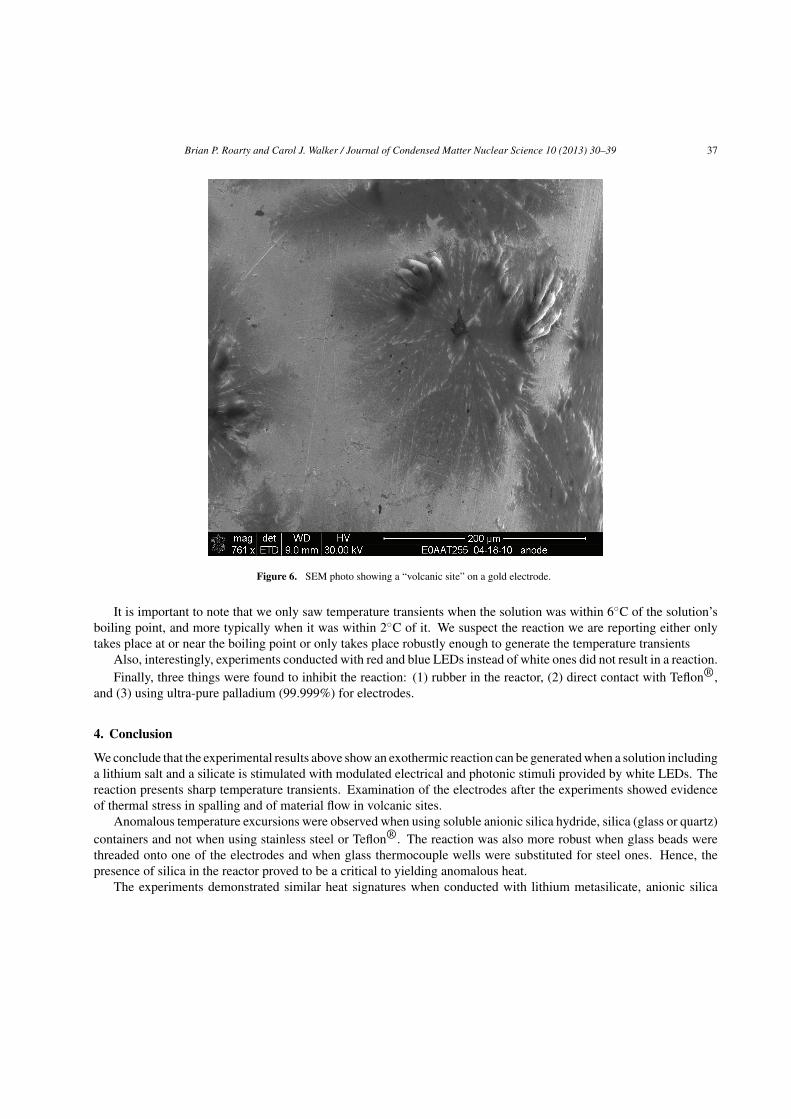
Brian P. Roarty and Carol J. Walker / Journal of Condensed Matter Nuclear Science 10 (2013) 30–39 37
Figure 6. SEM photo showing a “volcanic site” on a gold electrode.
It is important to note that we only saw temperature transients when the solution was within 6#C of the solution’sboiling point, and more typically when it was within 2#C of it. We suspect the reaction we are reporting either onlytakes place at or near the boiling point or only takes place robustly enough to generate the temperature transients
Also, interestingly, experiments conducted with red and blue LEDs instead of white ones did not result in a reaction.Finally, three things were found to inhibit the reaction: (1) rubber in the reactor, (2) direct contact with Teflon®,
and (3) using ultra-pure palladium (99.999%) for electrodes.
4. Conclusion
We conclude that the experimental results above show an exothermic reaction can be generated when a solution includinga lithium salt and a silicate is stimulated with modulated electrical and photonic stimuli provided by white LEDs. Thereaction presents sharp temperature transients. Examination of the electrodes after the experiments showed evidenceof thermal stress in spalling and of material flow in volcanic sites.
Anomalous temperature excursions were observed when using soluble anionic silica hydride, silica (glass or quartz)containers and not when using stainless steel or Teflon®. The reaction was also more robust when glass beads werethreaded onto one of the electrodes and when glass thermocouple wells were substituted for steel ones. Hence, thepresence of silica in the reactor proved to be a critical to yielding anomalous heat.
The experiments demonstrated similar heat signatures when conducted with lithium metasilicate, anionic silica
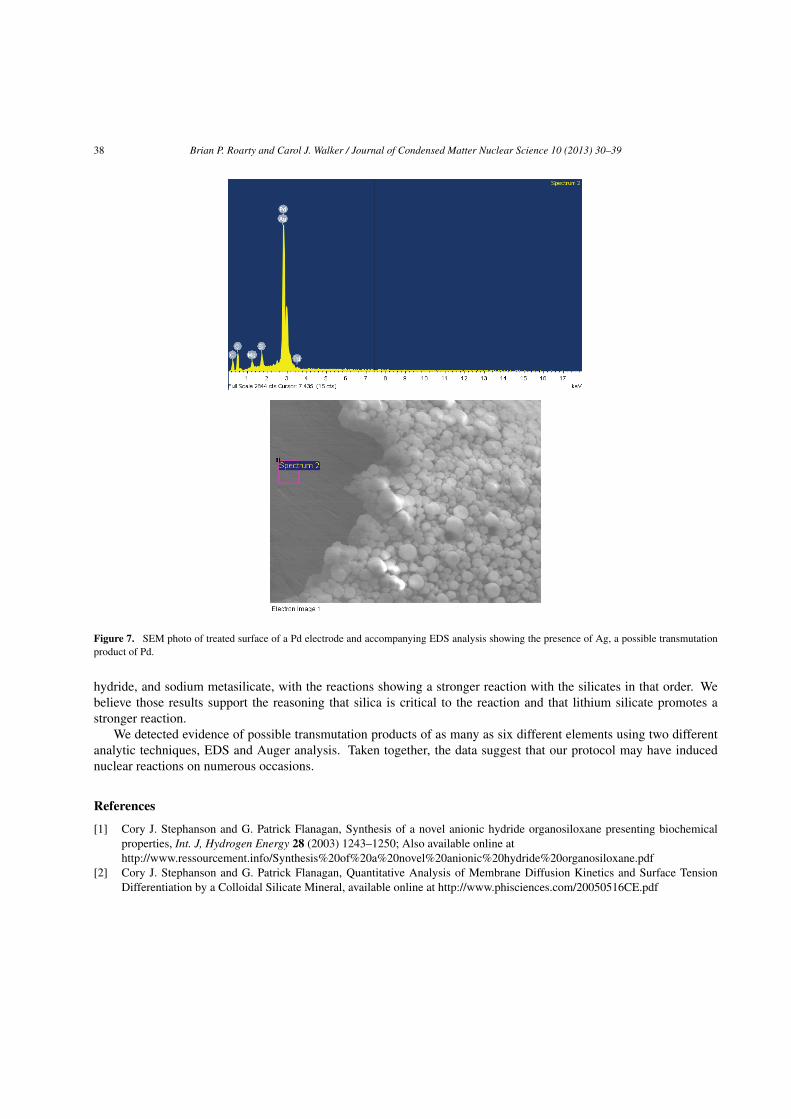
38 Brian P. Roarty and Carol J. Walker / Journal of Condensed Matter Nuclear Science 10 (2013) 30–39
Figure 7. SEM photo of treated surface of a Pd electrode and accompanying EDS analysis showing the presence of Ag, a possible transmutationproduct of Pd.
hydride, and sodium metasilicate, with the reactions showing a stronger reaction with the silicates in that order. Webelieve those results support the reasoning that silica is critical to the reaction and that lithium silicate promotes astronger reaction.
We detected evidence of possible transmutation products of as many as six different elements using two differentanalytic techniques, EDS and Auger analysis. Taken together, the data suggest that our protocol may have inducednuclear reactions on numerous occasions.
References[1] Cory J. Stephanson and G. Patrick Flanagan, Synthesis of a novel anionic hydride organosiloxane presenting biochemical
properties, Int. J, Hydrogen Energy 28 (2003) 1243–1250; Also available online athttp://www.ressourcement.info/Synthesis%20of%20a%20novel%20anionic%20hydride%20organosiloxane.pdf
[2] Cory J. Stephanson and G. Patrick Flanagan, Quantitative Analysis of Membrane Diffusion Kinetics and Surface TensionDifferentiation by a Colloidal Silicate Mineral, available online at http://www.phisciences.com/20050516CE.pdf

Brian P. Roarty and Carol J. Walker / Journal of Condensed Matter Nuclear Science 10 (2013) 30–39 39
[3] An early version of the protocol using anionic silica hydride is described more fully in United States Patent 7,442,287. It isavailable online at uspto.gov.
[4] The version of the protocol using lithium metasilicate is described more fully in United States patent application 20110174632.It is available online at us pto.gov.
J. Condensed Matter Nucl. Sci. 10 (2013) 40–45
Research Article
An Introduction to the Pico-chemistry Working Hypothesis
Jacques Dufour !
CNAM Laboratoire des sciences nucléaires, 2 rue Conté, 75003 Paris, France
Abstract
The nuclear signatures that can be expected when contacting hydrogen with nickel were derived from thermal results recently obtained(Rossi energy amplifier), using the type of reaction paths proposed as the explanation of the energy produced. The consequencesof either proton or neutron capture have been studied. It was shown that these consequences are not in line with the experimentalobservations. A novel tentative explanation is thus described. Should this explanation be true? It is proposed to call pico-chemistrythe novel field thus opened.© 2013 ISCMNS. All rights reserved. ISSN 2227-3123
Keywords: Enthalpie of formation, Hydrogen, Nickel, Nickel hydride, Nickel pico-hydride
1. Introduction
This paper is an improved version of the paper “Is the Rossi energy amplifier the first pico-chemical reactor" publishedJuly 18TH 2010 in the “Journal of Nuclear Physics"
In a recent paper [1], it was shown that, if the reaction path occurring in a Rossi energy amplifier [2] was mainlyproton capture, the lead thickness required to completely suppress the gamma flux produced would be of the orderof tens of centimeters. The lead screen used (2 cm) should thus have resulted in a lethal gamma dose emitted in thesurroundings. Another explanation different from either proton or neutron capture is to be found. In [3], the conceptof pico-chemistry was presented which could explain the generation of photons in the range of tens of keVs, thuscompatible with the lead screening used in the energy amplifier.
In chemistry, compounds are formed by the binding of the components through their outer electronic shells. Ionic,metallic and covalent hydrides of metals are known. Thus, nickel hydride NiH can be viewed as hydrogen and nickelatoms maintained at few angstroms distance from a metallic bound.
In contrast, in a pico-nickel hydride, a (shrunken) hydrogen atom would be inside the electronic shells of nickel andbound to the nickel at close proximity of its nucleus. In [3], a tentative explanation was given to the possibility of suchan exotic hydride. A different approach is presented in this paper.
!E-mail: [email protected]
© 2013 ISCMNS. All rights reserved. ISSN 2227-3123
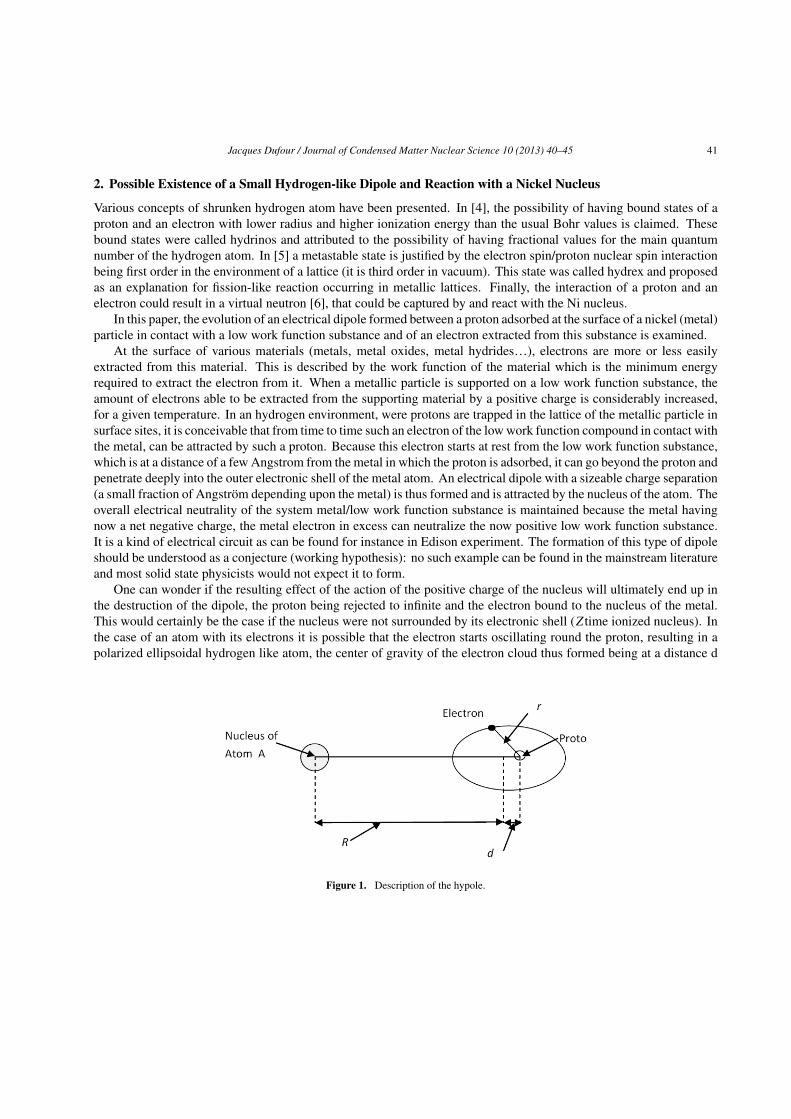
Jacques Dufour / Journal of Condensed Matter Nuclear Science 10 (2013) 40–45 41
2. Possible Existence of a Small Hydrogen-like Dipole and Reaction with a Nickel Nucleus
Various concepts of shrunken hydrogen atom have been presented. In [4], the possibility of having bound states of aproton and an electron with lower radius and higher ionization energy than the usual Bohr values is claimed. Thesebound states were called hydrinos and attributed to the possibility of having fractional values for the main quantumnumber of the hydrogen atom. In [5] a metastable state is justified by the electron spin/proton nuclear spin interactionbeing first order in the environment of a lattice (it is third order in vacuum). This state was called hydrex and proposedas an explanation for fission-like reaction occurring in metallic lattices. Finally, the interaction of a proton and anelectron could result in a virtual neutron [6], that could be captured by and react with the Ni nucleus.
In this paper, the evolution of an electrical dipole formed between a proton adsorbed at the surface of a nickel (metal)particle in contact with a low work function substance and of an electron extracted from this substance is examined.
At the surface of various materials (metals, metal oxides, metal hydrides…), electrons are more or less easilyextracted from this material. This is described by the work function of the material which is the minimum energyrequired to extract the electron from it. When a metallic particle is supported on a low work function substance, theamount of electrons able to be extracted from the supporting material by a positive charge is considerably increased,for a given temperature. In an hydrogen environment, were protons are trapped in the lattice of the metallic particle insurface sites, it is conceivable that from time to time such an electron of the low work function compound in contact withthe metal, can be attracted by such a proton. Because this electron starts at rest from the low work function substance,which is at a distance of a few Angstrom from the metal in which the proton is adsorbed, it can go beyond the proton andpenetrate deeply into the outer electronic shell of the metal atom. An electrical dipole with a sizeable charge separation(a small fraction of Angström depending upon the metal) is thus formed and is attracted by the nucleus of the atom. Theoverall electrical neutrality of the system metal/low work function substance is maintained because the metal havingnow a net negative charge, the metal electron in excess can neutralize the now positive low work function substance.It is a kind of electrical circuit as can be found for instance in Edison experiment. The formation of this type of dipoleshould be understood as a conjecture (working hypothesis): no such example can be found in the mainstream literatureand most solid state physicists would not expect it to form.
One can wonder if the resulting effect of the action of the positive charge of the nucleus will ultimately end up inthe destruction of the dipole, the proton being rejected to infinite and the electron bound to the nucleus of the metal.This would certainly be the case if the nucleus were not surrounded by its electronic shell (Z time ionized nucleus). Inthe case of an atom with its electrons it is possible that the electron starts oscillating round the proton, resulting in apolarized ellipsoidal hydrogen like atom, the center of gravity of the electron cloud thus formed being at a distance d
Figure 1. Description of the hypole.
42 Jacques Dufour / Journal of Condensed Matter Nuclear Science 10 (2013) 40–45
from the proton, between the nucleus of the metal and the proton. This could result from the alternative repulsion bythe inner electrons of the metal when the electron is between the proton and the metal nucleus and the attraction by theproton when it is on the other side. To demonstrate the possibility of such a bound state, the complete Hamiltonianof the system would have to be solved, which is not possible. A semi-empirical approach has thus been developed,to evaluate the orders of magnitude of the characteristics of such a polarized hydrogen like atom when it reaches thevicinity of the k electrons layer of the metal nucleus. This layer is likely to be a strong barrier, preventing the electronand thus the polarized hydrogen like atom, to further progress towards the metal nucleus. The orders of magnitude ofthese characteristics have been accessed by determining the dimensions of the object for which the potential and thekinetic energy are balanced (Bohr radius). They could be used as a guide when looking at the experimental resultsexpected in case of an excess energy measured in systems hydrogen/metal (energy of radiations emitted, characteristicsof the by-products…). In order to distinguish this concept of shrunken hydrogen atom from others, it is proposed tocall it Hypole (Deupole and Tripole being the two other isotopes).
3. Semi-empiric Description of the Hypole
Figure 1 gives a description of the Hypole, which is proposed to be written"#H Ni when the host atom A is nickel and
its (possible) bound state with the Ni atom, a nickel pico-hydride Ni"#H Ni. The electron is moving around the proton at
a mean distance r and the center of gravity of the resulting electron cloud is close to the center of the proton, creatingan electrical dipole. d is the distance between the center of gravity of the electron cloud and the center of the proton. ris the distance between the proton and the electron of the hypole. R is the distance between the center of the nucleusof the atom A and the electrical center of gravity of the hypole. Z is the charge number of the atom A .
The potential that the dipole proton/electron feels from the nucleus of A is at first order (when d/R is small):
V= " Ze2!
1R
" 1R + d
"$= "Ze2 d
R2 .
The condition for the dipole to be stable is that the repulsive potential between the nickel nucleus and the proton islower than the sum of the attractive potentials between the nickel nucleus and the electrical center of gravity of thehypole and between this center of gravity and the proton:
ZR
% Zr
+ 1d
.
This condition is met when d is small compared to R, with can be written d = kR (k small and constant). The stabilitycondition is then:
ZR
% Zr
+ 1k R
ork Z " 1
kr% 1
k R
This condition is thus met for k % 1#
Z .
During its attraction by A, the spatial extension of the dipole is limited by the repulsion of the inner layers ofthe electrons of A, resulting in a shrinking of this hydrogen-like object and in a limitation of its polarization, when itcascades down towards the nucleus of A through its various electronic layers. In the vicinity of the k layer of A, the2 s k electrons of A are a strong obstacle for further progression towards the nucleus. In order to get first estimatedvalues of the size and energy of the final state of the hypole and of the bound state it might form with A, followingassumptions are made.
(1) The action of the k electronic shell of A on the dipole and the presence at short distance of the Z protons of Aare equivalent to the attraction of the electron by the proton in the hypole being multiplied by a factor K. The
Jacques Dufour / Journal of Condensed Matter Nuclear Science 10 (2013) 40–45 43
electron oscillates round the proton and feels a strong repulsive potential of the k electrons of the nickel (Pauliexclusion principle resulting in a kind of Lennard-Jones potential) when between the proton and the nickelnucleus and the strong attraction of the proton and the nickel nucleus when on the other side. The object formedcan be viewed as a reduced and ellipsoidal hydrogen like atom, the electrically negative electron cloud havinga charge center of gravity slightly closer to the Nickel nucleus than the proton, at a small distance d from theproton. Hence, the (pseudo) coulomb interaction between the electron and the proton in the dipole is taken as:v = K e2#r .
(2) d is small and proportional to R. Hence, d = kR with k small (note that the electron is not at this small distance,which would imply MeV energy levels). The parameter d describes the polarization of the hydrogen like hypole.The dimension of this hypole will be shown to be in the order of picometer thus implying keV energy levels forthe localization of the electron involved in its formation.
(3) The electron of the hypole"#H A cannot be found in the nucleus of the atom A (competition with the k layer s
electrons of A resulting in a Lennard–Jones type of repulsive potential). Hence, r % R.
With assumption (1), the Bohr radius of"#H A would be r"#
H A= h̄2#meK e2 and its energy of formation E"#
H A=
meK 2e4#2h̄2.With assumption (2), the potential between the dipole and A is
V = " Ze2!
1R
" 1R + d
"$= "Ze2 d
R2$= "Ze2 k
R
and thus Coulombic: the Bohr radius of A"#H A attracted by A would then be RA
"#H A
= h̄2#mHK Ze2 and its energy
of formation EA"#H A
= mHK 2 Z2e4#2h̄2 with mH being the mass of the hydrogen atom.
Under assumption (3), the smallest possible bound object A"#H A is obtained for R = r . In that case me K = mH K Z .
Expressing the energies as a function of the unknown k, one gets:
E"#H A
= e4
2h̄2mH
memHk2 Z2 and EA
"#H A
= e4
2h̄2 mHk2 Z2
finally yielding the following value for the total energy given by the hypole formation followed by its binding with A: .
ET = E"#H A
+ E"#H A
= e4
2h̄2
$mek2 + mHk2 Z2
%= e4
2h̄2 mHk2 Z2!
1 + mH
me
".
The bulk of the energy is coming from the formation of the Hypole. E"#H A
is likely to be of the order of magnitude ofthe energies that can be found close to the A nucleus, that is the K layer selectrons energy E sK
A as a first approximation.A guesstimated value of the order of magnitude of k is thus:
k = 1Z
&
E sKA
2h̄2
mHe4me
mH.
In the case of nickel and taking for E sKA the average value 10.5 keV , the the following guesstimated description of
"#H Ni
and Ni"#H Ni is obtained (Table 1).
It should be noted that a charge separation (1 fm) for a dipole formed by a proton and an electron, would involveseveral hundred MeV of localization energy and this point will need to be addressed at some point in the future.
It should also be noted that solving the radial Schrödinger equation for the 1#
r2 interaction for a dipole (i.e. notCoulombic as proposed) would give an hypole energy of formation of some 55 keV, not in very good agreement with the
44 Jacques Dufour / Journal of Condensed Matter Nuclear Science 10 (2013) 40–45
Table 1. Nickel hypole and nickel pico-hydride energies of formation.
HypoledimensionR = r (fm)
Hypolechargesseparation d(fm)
Hypoleenergyo formation(eV)
Nipico-hydrideenergy of for-mation (eV)
ApparentCoulomb in-teraction K
Charges sep-arationfactor k
1906 1.03 10500 5.7 27.8 5.4 & 10"4
energy found (10,5 keV) and a proton localization much closer to the nickel nucleus than obtained above (this resultingin an even more localized electron).
4. Properties of the Hypole
The hypole is a picometer size hydrogen-like object. It can only exist when embedded in the electronic shell of an atomA, where its equilibrium position is very close to the nucleus of A. Its size and energy of formation depends upon A.In the case of nickel, the size is some 2 pm and the energy of formation round 10 keV. Hence the names and notationsproposed.
The best way for characterizing a hypole is to measure the mass of the corresponding A/pico-hydride. In the caseof nickel, following masses are expected, that take into account the energy of formation (Table 2):
The mass differences given by Table 2 could be easily detected using a high-resolution TOF Mass Spectrometeron an acidic solution of the nickel pico-hydride (probably possible see below, chemical properties). SIMS TOF MassSpectrometry is not adapted, since the primary ions energies are of the order of the energy of formation of the hypole.An ICP TOF Mass Spectrometer would be adapted. The modifications of the electronic shell of the atom A (nickel inthat case) could be evidenced using EDS-X analysis. X-ray emission during the formation of the hypole should alsobe observed (energy lower or equal to 10.3 keV in the case of nickel).
As regards the chemical properties of Ni"#H Ni, they should be close to the nickel ones. The outer electronic layers
of Ni"#H Ni indeed see the positive charge of the nickel atom, the effect of the hypole
"#H Ni being second order in that
respect. A shift of the characteristic rays given by nickel in ICP-AOS could be observed. Finally the radiations emittedduring the hypole formation, would be photons in the 10 keV range, thus completely suppressed by the 2 cm layer oflead in the energy amplifier. Faint signals of higher energy photons (annihilation radiation) could anyhow be detected.They might be the signature of an inherent instability of the hypole and of the corresponding pico-hydride, which isdiscussed now.
Table 2. Nickel pico-hydrides masses.
Ni parentcomposi-tion (xi )
Ni parentnucleus
Mass ofparent Ninucleus
Mass ofNi pico-hydride
Mass ofthe closeststableatom
The clos-est stableatom
Mass dif-ference(ppm)
0.68007 58Ni 57.935346 58.943152 58.933198 59Co 1690.26223 60Ni 59.930788 60.938594 60.931058 61Ni 1240.0114 61Ni 60.931058 61.938864 61.928346 62Ni 1700.03634 62Ni 61.928346 62.936152 62.929598 63Cu 1040.0926 64Ni 63.927968 64.935774 64.927793 65Cu 123
Jacques Dufour / Journal of Condensed Matter Nuclear Science 10 (2013) 40–45 45
5. Stability of the (Nickel) Hypole
The nickel hypole is a small object of picometer dimension and at picometer distance from the nickel nucleus. Itsvirtual neutron state may have a non-zero probability to penetrate the nickel nucleus and react with it according to theneutron capture route developed in [6,1]. Most of the gamma photons resulting from the stabilization of the primaryexcited nickel nuclei are of energy higher than 1 MeV [1]. They mainly interact with the lead shield by producingelectron/positron pairs, ultimately yielding the annihilation radiation. From the experimental observations, the rate ofvirtual neutron capture should be very low (some 10"10 s"1, in the experiment 2009 (3–5/4–26) presented in [2]).
6. Discussion
The model described in this paper should be viewed as a working hypothesis aimed at guiding the experiments. It couldbe validated by the above-predicted characteristics of the reaction products.
Finally, one might wonder what would be the impact, if true, of the pico-chemistry on other known NiH system.Indeed, abnormal heat release could already have been observed in catalysis for instance. But commercial catalysts arevery seldom prepared with carriers having a low work function and according to the pico-chemistry no abnormal heatproduction should be observed when using them.
7. Conclusions
In this paper, a rough description is given, of a possible novel chemical interaction. Orders of magnitudes of the maincharacteristics of this still hypothetical interaction are given. It is hoped that this approach will be of help when tryingto understand the thermal results obtained in certain Ni/H (or other metal/H) systems. Should the experimental resultsand their interpretation be true, the pico-chemistry working hypothesis could be accepted as an explanation of theexperimental data.
Acknowledgment
The author would like to thank the referee for his valuable comments
References[1] J. Dufour, Nuclear signatures to be expected from Rossi energy amplifier, J. Nucl. Phy. 6 May 2010.[2] S. Focardi and A. Rossi, A new energy source from nuclear fusion, J. Nncl. Phy.[3] J. Dufour, Very sizeable increase of gravity at pico-meter distance: a novel working hypothesis to explain anomalous heat
effects and apparent transmutations in certain metal hydrogen systems, J. Condensed Matter Nucl. Sci. 1 (2007) 47–61.[4] L. Mills and W.R. Good, A Unified Theory Derived From First Principles, Black Light Power Inc. (1992).[5] J. Dufour, D. Murat, X. Dufour and J. Foos, Experimental observation of nuclear reactions in palladium and uranium: possible
explanation by the hydrex mode, Fusion Sci. Technol. 40 (2001) 91–106.[6] L. Daddi, Virtual neutrons in orbital capture, J. Nucl. Phy. March 18, 2001.
J. Condensed Matter Nucl. Sci. 10 (2013) 46–62
Research Article
Effect of Forced Oxidation on Hydrogen IsotopeAbsorption/Adsorption Characteristics of Pd–Ni–Zr Oxide
Compounds !
Yuki Miyoshi, Hideyuki Sakoh, Akira Taniike, Akira Kitamura † ‡
Graduate School of Maritime Sciences, Kobe University, 5-1-1 Fukaeminani-machi, Higashinada-ku, Kobe 658-0022, Japan
Akito Takahashi §, Reiko Seto and Yushi FujitaTechnova Inc., Uchisaiwaicho 1-1-1, Chiyodaku, Tokyo 100-0011, Japan
Abstract
Deuterium and protium gas absorption/adsorption by 0.1-µm! Pd powder (PP), Pd-black (PB), Pd nano-particles ("10 nm!) admixedwith ZrO2 (PZ) and Pd·Ni binary nano-particles ("2 nm!) dispersed in ZrO2 holder-flakes (PNZ2B) has been examined. For thePP, the PB and the PZ samples, both the deoxidized samples and those reused without baking process showed essentially the samevalues of the loading ratio D(H)/Pd, the specific output energy E1 and the hydridation energy QD(H) which are consistent withthe published values for bulky samples. For the as-received and oxidized samples both D(H)/Pd and E1 are increasing functionsof fineness of the Pd surface, and exceeds 2.0 and 1.5 eV/atom-Pd, respectively, for the PZ sample, giving the hydridation energylarger than the published value of the surface adsorption energy of 0.5 eV for bulky Pd samples. A rather large isotope effect in thedifferential heat of sorption, "D(H), has sometimes been observed in the 1a-phase characteristic of the oxygen-treated samples. ThePd0.04Ni0.29Zr0.67 oxide composite sample, PNZ2B, has unique properties: Both D(H)/[Pd·Ni] # 3.0 and E1 # 1.4 eV/atom-[Pd·Ni] for the as-received, the oxidized and deoxidized sample runs are very large, while QD(H) = 0.50± 0.1 eV/atom-D(H) forall cases is modest. It is inferred that the Pd atoms act as a catalyst for the hydrogen isotope absorption/adsorption of Ni at roomtemperature. From the fact that the No. 2 run after the forced deoxidation has essentially the same values of the absorption parametersas those of the No. 1 and No. 3 runs, it is inferred that the surface adsorption potential is made shallower in the PNZ2B samplethan in Pd-based samples. The ratio "D/"H is sometimes greater than 1.5, which appears to be suggesting the existence of heatcomponent of nuclear origin.© 2013 ISCMNS. All rights reserved. ISSN 2227-3123
Keywords: Anomalous heat, Deuterium absorption, Differential heat of hydrogen uptake, Forced oxidation, Isotope effect,
© 2013 ISCMNS. All rights reserved. ISSN 2227-3123
A. Kitamura et al. / Journal of Condensed Matter Nuclear Science 10 (2013) 46–62 47
Loading ratio, Pd·Ni·Zr nano-composite
1. Introduction
Palladium has been one of the most interesting and important elements for catalysis, hydrogen storage and purificationfor many years, and extensive works have been done. Among them, the most important researches are those on theisotope effect of absorption by 10-µm-thick Pd film [1] and on the particle size effect on the absorption characteristics[2,3].
Palladium has also been the key element for condensed matter nuclear phenomena, the so-called cold fusion [4].Arata and Zhang [5] reported that highly pure D2 gas charging of Pd nano-powders in the form of Pd/ZrO2 inducedsignificantly higher temperatures inside the reactor vessel than at the outside wall continuing for more than 50 h, whileruns with H2 gas showed almost no temperature difference. To verify that the excess heat originated in a nuclear process,a quadrupole mass spectrometer was employed to show the existence of significant amount of 4He as nuclear ash inthe vessel and in the powder after the charging. The charging system is a sophisticated, yet simplified, version of theprevious-generation DS reactor [6].
Since then, the gas-phase charging systems have been another important method to induce possible anomaly inheat generation. Successful replications using systems similar to the DS reactor with Pd-black have been reported byKirkinski et al. [7], Biberian et al. [8] and Celani et al. [9]. On the other hand, Kidwell et al. [10], Hioki et al.[11,12], and Dmitriyeva et al. [13] have also developed independently gas absorption systems with precise calorimetryequipments for samples of Pd-loaded zeolites and/or alumina.
A more sophisticated system has been developed also in our laboratory [14–18]. Our system is a twin absorptionsystem, which enables simultaneous mass-flow-calorimetry for D2 and H2 gas absorption. We have used commerciallyavailable powder samples and those supplied by Santoku Corporation.
On the other hand, B. Ahern (BA), Vibronic Energy Technologies Corporation, fabricated his own samples ofPd·Ni·Zr oxide compounds by melt-spinning method to perform gas absorption and temperature measurement. Hereported very large loading ratio of hydrogen and heat evolution [19]. He offered us the sample to perform precisecalorimetry in our twin-absorption system. The present paper describes the comprehensive results of time-dependentmeasurements of hydrogen isotope gas absorption/adsorption (sorption) at room temperature and associated heat evo-lution from a variety of micron sized powders of Pd; the Pd·Ni·Zr oxide nano-compounds supplied by BA and othersamples containing Pd examined so far in our laboratory [14–17]. Special emphasis is laid on the time-resolvedcharacteristics as well as effect of oxidation of the samples on the sorption characteristics.
2. Experimental Apparatus
The twin absorption system for hydrogen isotope absorption experiments is composed of two identical parts, A1 andA2, one of which is as shown in Fig. 1. Palladium nano-particles are put in the reaction chamber, and the outer chamberis evacuated for thermal insulation during hydrogen isotope sorption. The reservoir tank is filled with D2 (H2) gas at apressure of 0.4 MPa, typically, before an absorption run starts. The flow rate of D2 (or H2) gas is adjusted and regulatedwith a “Super Needle” valve.
!Note: This paper is prepared for the Proceeding of ICCF16, Chennai, India, 2011.†E-mail: [email protected]‡Also at: Technova Inc., Uchisaiwaicho 1-1-1, Chiyodaku, Tokyo 100-0011, Japan.§Also at: Osaka University, Suita 5650871, Japan.
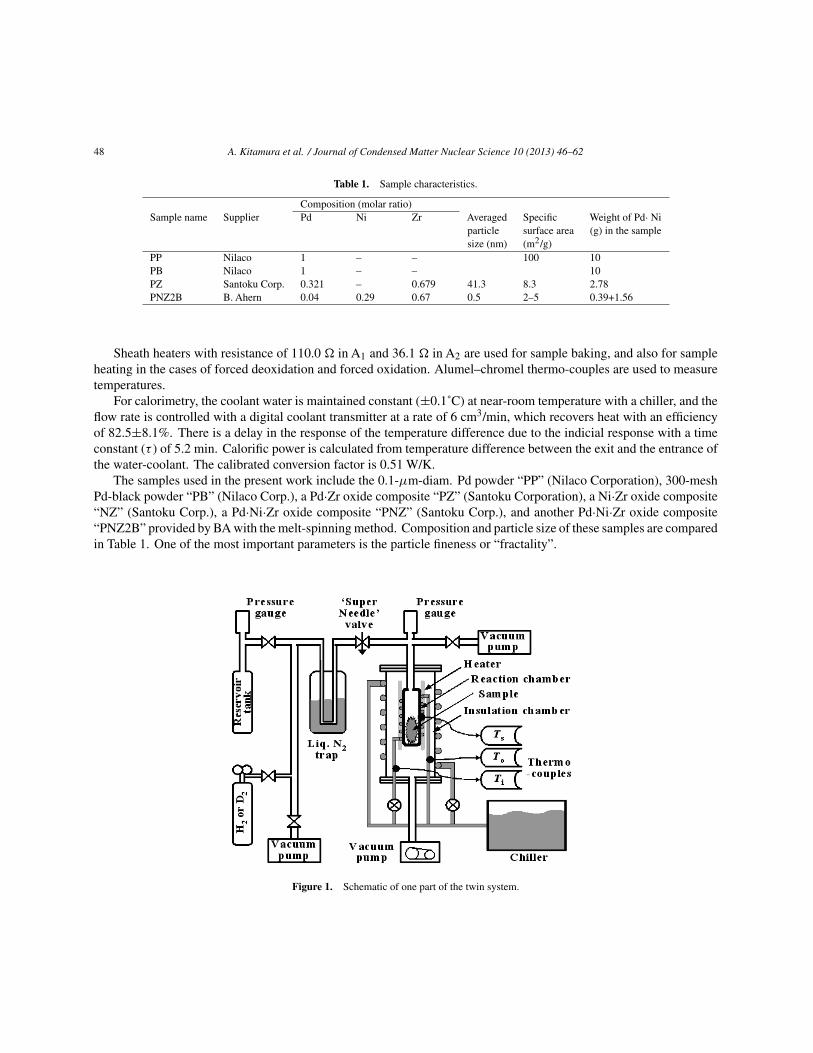
48 A. Kitamura et al. / Journal of Condensed Matter Nuclear Science 10 (2013) 46–62
Table 1. Sample characteristics.
Composition (molar ratio)Sample name Supplier Pd Ni Zr Averaged
particlesize (nm)
Specificsurface area(m2/g)
Weight of Pd· Ni(g) in the sample
PP Nilaco 1 – – 100 10PB Nilaco 1 – – 10PZ Santoku Corp. 0.321 – 0.679 41.3 8.3 2.78PNZ2B B. Ahern 0.04 0.29 0.67 0.5 2–5 0.39+1.56
Sheath heaters with resistance of 110.0 # in A1 and 36.1 # in A2 are used for sample baking, and also for sampleheating in the cases of forced deoxidation and forced oxidation. Alumel–chromel thermo-couples are used to measuretemperatures.
For calorimetry, the coolant water is maintained constant (±0.1˚C) at near-room temperature with a chiller, and theflow rate is controlled with a digital coolant transmitter at a rate of 6 cm3/min, which recovers heat with an efficiencyof 82.5±8.1%. There is a delay in the response of the temperature difference due to the indicial response with a timeconstant ($ ) of 5.2 min. Calorific power is calculated from temperature difference between the exit and the entrance ofthe water-coolant. The calibrated conversion factor is 0.51 W/K.
The samples used in the present work include the 0.1-µm-diam. Pd powder “PP” (Nilaco Corporation), 300-meshPd-black powder “PB” (Nilaco Corp.), a Pd·Zr oxide composite “PZ” (Santoku Corporation), a Ni·Zr oxide composite“NZ” (Santoku Corp.), a Pd·Ni·Zr oxide composite “PNZ” (Santoku Corp.), and another Pd·Ni·Zr oxide composite“PNZ2B” provided by BA with the melt-spinning method. Composition and particle size of these samples are comparedin Table 1. One of the most important parameters is the particle fineness or “fractality”.
Figure 1. Schematic of one part of the twin system.
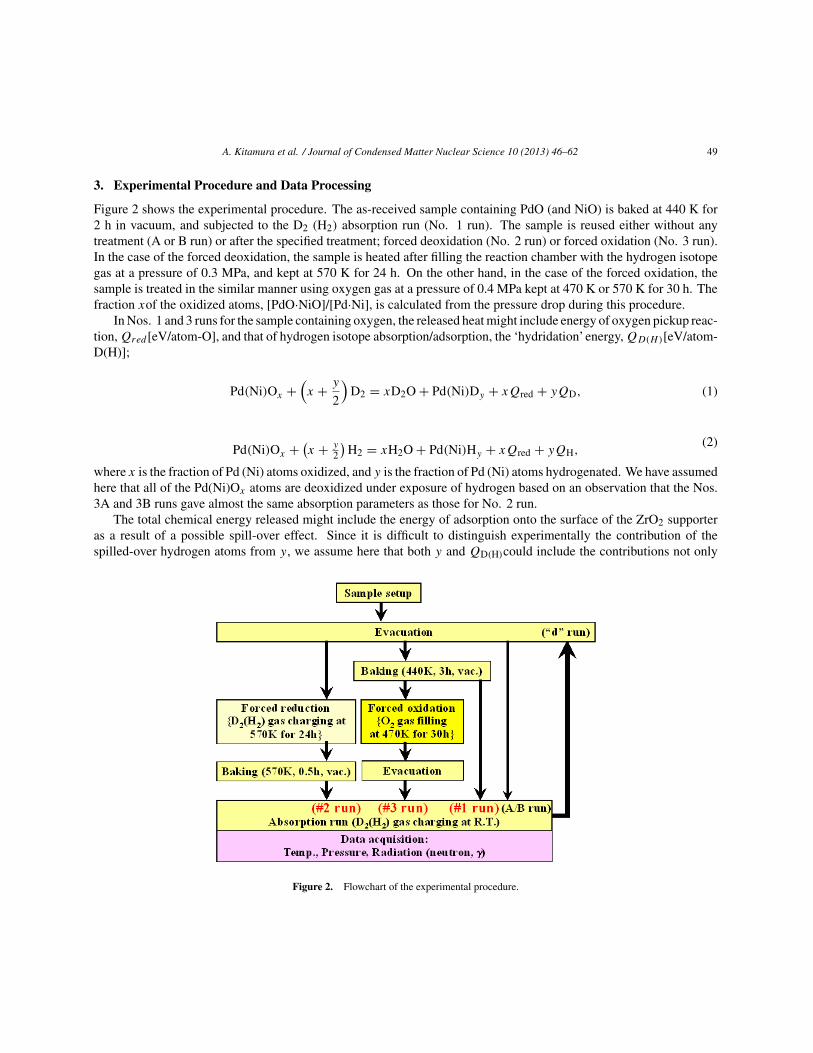
A. Kitamura et al. / Journal of Condensed Matter Nuclear Science 10 (2013) 46–62 49
3. Experimental Procedure and Data Processing
Figure 2 shows the experimental procedure. The as-received sample containing PdO (and NiO) is baked at 440 K for2 h in vacuum, and subjected to the D2 (H2) absorption run (No. 1 run). The sample is reused either without anytreatment (A or B run) or after the specified treatment; forced deoxidation (No. 2 run) or forced oxidation (No. 3 run).In the case of the forced deoxidation, the sample is heated after filling the reaction chamber with the hydrogen isotopegas at a pressure of 0.3 MPa, and kept at 570 K for 24 h. On the other hand, in the case of the forced oxidation, thesample is treated in the similar manner using oxygen gas at a pressure of 0.4 MPa kept at 470 K or 570 K for 30 h. Thefraction xof the oxidized atoms, [PdO·NiO]/[Pd·Ni], is calculated from the pressure drop during this procedure.
In Nos. 1 and 3 runs for the sample containing oxygen, the released heat might include energy of oxygen pickup reac-tion, Qred [eV/atom-O], and that of hydrogen isotope absorption/adsorption, the ‘hydridation’energy, QD(H)[eV/atom-D(H)];
Pd(Ni)Ox +!x + y
2
"D2 = xD2O + Pd(Ni)Dy + xQred + yQD, (1)
Pd(Ni)Ox +#x + y
2
$H2 = xH2O + Pd(Ni)Hy + xQred + yQH,
(2)
where x is the fraction of Pd (Ni) atoms oxidized, and y is the fraction of Pd (Ni) atoms hydrogenated. We have assumedhere that all of the Pd(Ni)Ox atoms are deoxidized under exposure of hydrogen based on an observation that the Nos.3A and 3B runs gave almost the same absorption parameters as those for No. 2 run.
The total chemical energy released might include the energy of adsorption onto the surface of the ZrO2 supporteras a result of a possible spill-over effect. Since it is difficult to distinguish experimentally the contribution of thespilled-over hydrogen atoms from y, we assume here that both y and QD(H)could include the contributions not only
Figure 2. Flowchart of the experimental procedure.
50 A. Kitamura et al. / Journal of Condensed Matter Nuclear Science 10 (2013) 46–62
from the absorption into the Pd/Pd·Ni bulk lattice but also adsorption onto the surfaces of the Pd/Pd·Ni nano-particleand the supporter. Thus the total chemical output energy, which is observed as the first-phase output energy E1, as willbe seen in the following paragraphs, is expressed as
E1 = xQred + yQD(H).(3)
The energies of formation of oxides associated in the present phenomena for the bulk samples not under influence ofnano-structure are as follows:
Pd + 12 O2 $ PdO + QPdO(QPdO = 0.886 eV),
(4)
Ni + 12 O2 $ NiO + QNiO(QNiO = 2.478 eV),
(5)
D2 + 12 O2 $ D2O + QD2O(QD2O = 2.654 eV),
(6)
H2 + 12
O2 $ H2O + QH2O(QH2O = 2.511 eV). (7)
The energies of the oxygen pickup reactions, Qred , are calculated by combining the above equations;
PdO + D2 $ Pd + D2O + QPd,Dred , QPd,D
red = QD2O % QPdO = 1.768 eV,(8)
PdO + H2 $ Pd + H2O + QPd,Hred , QPd,H
red = QH2O % QPdO = 1.6 25eV,(9)
NiO + D2 $ Ni + D2O + QNi,Dred , QNi,D
red = QD2O % QNiO = 0.176 eV,(10)
NiO + H2 $ Ni + H2O + QNi,Hred , QNi,H
red = QH2O % QNiO = 0.033 eV.(11)
We note that the energies of the oxygen pickup reactions for PdO, in Eqs. (??) and (??), are of the order of magnitudelarger than those for NiO, in Eqs. (??) and (??).
We have to use Eq. (??) to know the value of yQD(H) by subtracting the first term xQred from the value of E1 obtainedexperimentally. However, in the case of No. 1 run we do not know x, the fractions of PdO and NiO, independentlyfrom y. We want to determine (x + y/2) in Eqs. (??) and (??) from decrease in the number of gas-phase atoms, %N ,calculated by changes in the pressure of the reservoir and the reaction chambers. If the water, D2O or H2O, remains inthe gas phase with the same volume as D2/H2, then the decrease %N is due solely to y/2, the absorption/adsorption.On the other hand, if the water atoms condensate into the liquid phase or adsorbed not only on the sample surfaces butalso on the inner surface of the reaction chamber and pipes, the water formation is also responsible to the decrease %N .We have no means to experimentally determine the fraction of x to be subtracted from the decrease %N to determine y.
In the case of No. 3 run, we know x. However, we have found a problem: if we assume that all the oxygen atomswhich would give a pressure in excess of the vapor pressure of 4 kPa at room temperature are condensed, we have
A. Kitamura et al. / Journal of Condensed Matter Nuclear Science 10 (2013) 46–62 51
too small, sometimes negative, values of yQD(H). In the present work, we therefore calculate yQD(H) by assuming thatxQred = 0 first, and evaluate the error when the proper values of x and the cited values of Qred for bulky samples areassumed. The assumption that Qredis negligible, or equivalently that the values of the oxidation energy QPdO and QNiOare very much enhanced for the nano-particle samples, could be reasonable, just by the same reason as the assumptionthat the hydridation energy QD(H) is enhanced significantly for the nano-particle samples, which, as will be seen later,we want to make one of the most important conclusion of the present work.
Another important parameter is the differential heat of hydrogen uptake [3], which is calculated in the present workas the time-resolved sorption energy per one hydrogen atom absorbed/adsorbed [18,20]
" (t) #% t+%tt W(t,$ ) dt
L(t+%t)%L(t) ,
(12)
where L(t) is the time-resolved loading ratio, and
W (t, $ ) =% t+$t Wmeas (t) dt
$(13)
is the measured output power per one Pd atom, Wmeas(t), averaged over the time constant $ of the calorimetry system.The averaging was necessary, since the measured power has an indicial response of exponential delay with the timeconstant of $ = 5.2 min. The numerator of Eq. (??) is the output energy per one Pd atom during a time interval of %t ,and the denominator is the number of the hydrogen atom absorbed/adsorbed per one Pd atom during the same interval.The value of "(t) is averaged over the time interval of %t , which is arbitrarily chosen here to be the time constant ofthe calorimetry;%t = $ . The averaging was necessary, since the scattering in the data of L(t) was rather large.
4. Results and Discussion
4.1. Characteristics of the PZ sample
It was shown in Refs. [16,17] that the absorption characteristics of the Pd particles are strongly dependent on the particlesize. Here the results are briefly summarized. The PZ sample showed much larger loading ratio, D/Pd and H/Pd, and thefirst-phase specific absorption/adsorption energy, E1, than those for the PP sample and the PB sample. Figure 3 shows(a) typical variation of the heat evolution, WD and WH, pressure in the reaction chamber, PD and PH, the loading ratio,LD and LH, and the time-resolved specific sorption energy, "D, and "H, and (b) the L(t)–P(t) diagram in the hydrogenisotope absorption runs after forced oxidation, D-PZ13# 3 and H-PZ14# 3, for the PZ samples containing 2.78 g ofPd. The first phase is defined as the duration of the run during which absorption of hydrogen (deuterium/protium) isterminated, or the loading ratio LD/LH reaches a steady-state value. In the second phase, there were observed sometimesanomalous temperature hump possibly suggesting an anomalous heat evolution in the deuterium absorption runs [16],however with poor reproducibility. In the following, we pay attention only to the first-phase parameters in the presentpaper.
The first-phase-integrated parameters for the samples PZ#1 through PZ#14 are shown as histograms in Fig. 4. Toevaluate QD(H) in No. 3 runs with use of Eq. (??), as has been explained above, we have ignored the contribution ofthe oxygen pickup reaction to the output energy, i.e., xQred = 0. This is because yQD(H) was calculated to be negative,if we used the cited values of Qred, Eqs. (??) and (??), for bulky samples. Later in this paper we will find other basesto assume that xQred should be negligible for the nano-particle samples.
The first-phase was found to be divided into two sub-phases, the 1a-phase and the 1b-phase [18]. In the 1a-phase,rapid absorption/adsorption occurred with high heat output, "1a " 1.0 eV/atom-D(H), probably in the near-surface
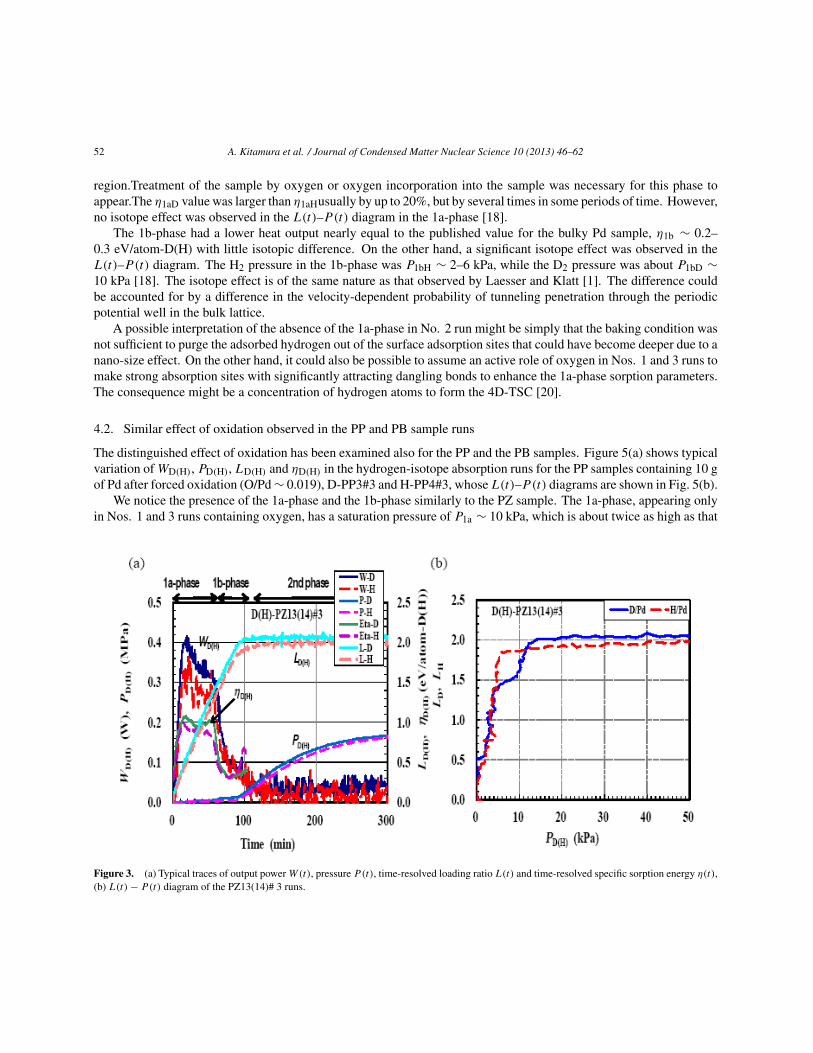
52 A. Kitamura et al. / Journal of Condensed Matter Nuclear Science 10 (2013) 46–62
region.Treatment of the sample by oxygen or oxygen incorporation into the sample was necessary for this phase toappear.The "1aD value was larger than "1aHusually by up to 20%, but by several times in some periods of time. However,no isotope effect was observed in the L(t)–P(t) diagram in the 1a-phase [18].
The 1b-phase had a lower heat output nearly equal to the published value for the bulky Pd sample, "1b " 0.2–0.3 eV/atom-D(H) with little isotopic difference. On the other hand, a significant isotope effect was observed in theL(t)–P(t) diagram. The H2 pressure in the 1b-phase was P1bH " 2–6 kPa, while the D2 pressure was about P1bD "10 kPa [18]. The isotope effect is of the same nature as that observed by Laesser and Klatt [1]. The difference couldbe accounted for by a difference in the velocity-dependent probability of tunneling penetration through the periodicpotential well in the bulk lattice.
A possible interpretation of the absence of the 1a-phase in No. 2 run might be simply that the baking condition wasnot sufficient to purge the adsorbed hydrogen out of the surface adsorption sites that could have become deeper due to anano-size effect. On the other hand, it could also be possible to assume an active role of oxygen in Nos. 1 and 3 runs tomake strong absorption sites with significantly attracting dangling bonds to enhance the 1a-phase sorption parameters.The consequence might be a concentration of hydrogen atoms to form the 4D-TSC [20].
4.2. Similar effect of oxidation observed in the PP and PB sample runs
The distinguished effect of oxidation has been examined also for the PP and the PB samples. Figure 5(a) shows typicalvariation of WD(H), PD(H), LD(H) and "D(H) in the hydrogen-isotope absorption runs for the PP samples containing 10 gof Pd after forced oxidation (O/Pd " 0.019), D-PP3#3 and H-PP4#3, whose L(t)–P(t) diagrams are shown in Fig. 5(b).
We notice the presence of the 1a-phase and the 1b-phase similarly to the PZ sample. The 1a-phase, appearing onlyin Nos. 1 and 3 runs containing oxygen, has a saturation pressure of P1a " 10 kPa, which is about twice as high as that
Figure 3. (a) Typical traces of output power W(t), pressure P(t), time-resolved loading ratio L(t) and time-resolved specific sorption energy "(t),(b) L(t) % P(t) diagram of the PZ13(14)# 3 runs.
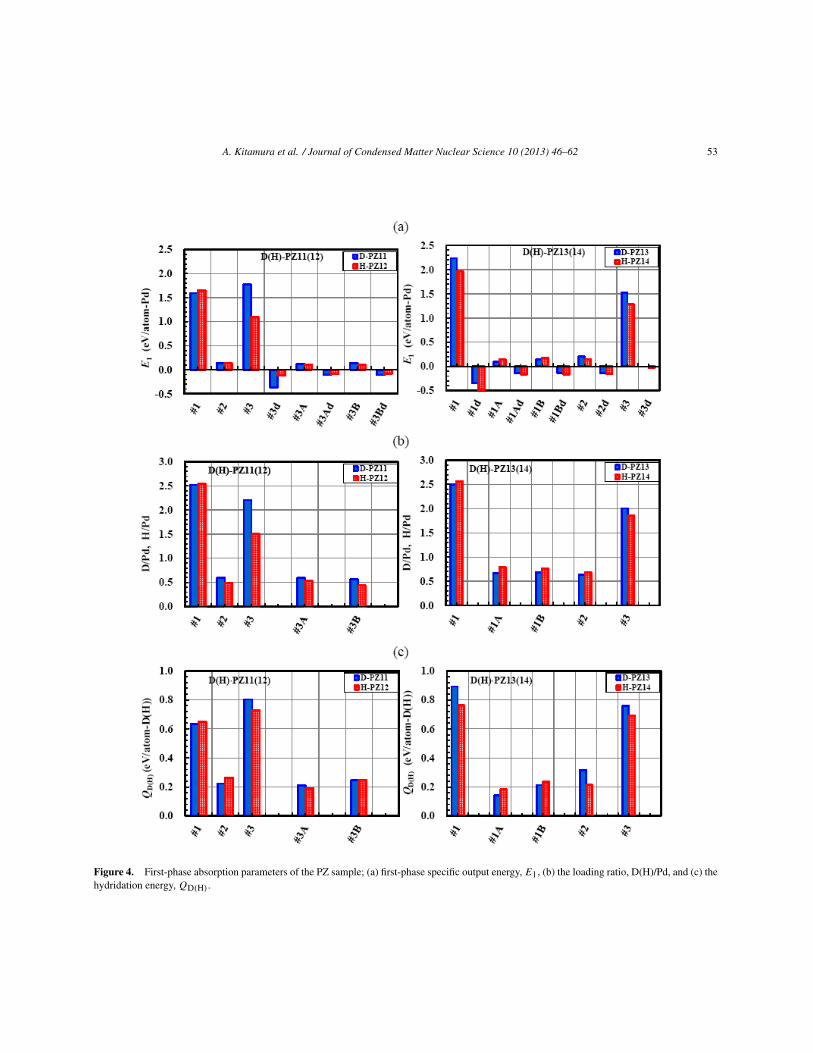
A. Kitamura et al. / Journal of Condensed Matter Nuclear Science 10 (2013) 46–62 53
Figure 4. First-phase absorption parameters of the PZ sample; (a) first-phase specific output energy, E1, (b) the loading ratio, D(H)/Pd, and (c) thehydridation energy, QD(H).
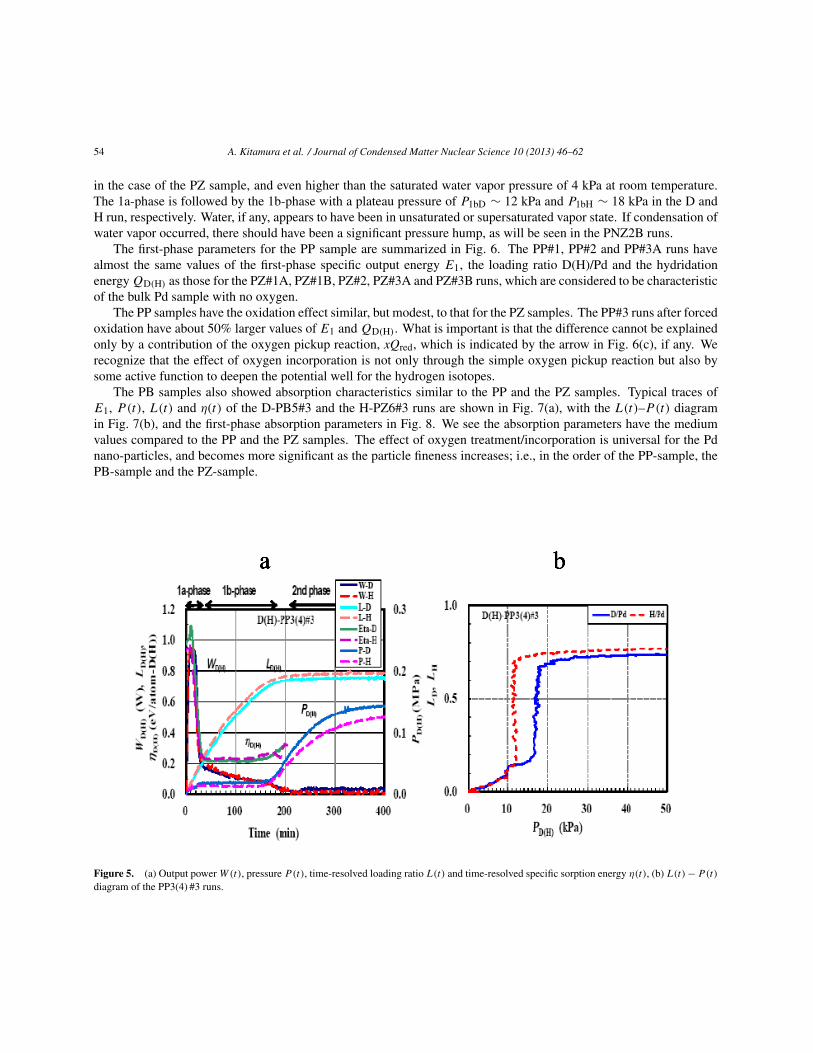
54 A. Kitamura et al. / Journal of Condensed Matter Nuclear Science 10 (2013) 46–62
in the case of the PZ sample, and even higher than the saturated water vapor pressure of 4 kPa at room temperature.The 1a-phase is followed by the 1b-phase with a plateau pressure of P1bD " 12 kPa and P1bH " 18 kPa in the D andH run, respectively. Water, if any, appears to have been in unsaturated or supersaturated vapor state. If condensation ofwater vapor occurred, there should have been a significant pressure hump, as will be seen in the PNZ2B runs.
The first-phase parameters for the PP sample are summarized in Fig. 6. The PP#1, PP#2 and PP#3A runs havealmost the same values of the first-phase specific output energy E1, the loading ratio D(H)/Pd and the hydridationenergy QD(H) as those for the PZ#1A, PZ#1B, PZ#2, PZ#3A and PZ#3B runs, which are considered to be characteristicof the bulk Pd sample with no oxygen.
The PP samples have the oxidation effect similar, but modest, to that for the PZ samples. The PP#3 runs after forcedoxidation have about 50% larger values of E1 and QD(H). What is important is that the difference cannot be explainedonly by a contribution of the oxygen pickup reaction, xQred, which is indicated by the arrow in Fig. 6(c), if any. Werecognize that the effect of oxygen incorporation is not only through the simple oxygen pickup reaction but also bysome active function to deepen the potential well for the hydrogen isotopes.
The PB samples also showed absorption characteristics similar to the PP and the PZ samples. Typical traces ofE1, P(t), L(t) and "(t) of the D-PB5#3 and the H-PZ6#3 runs are shown in Fig. 7(a), with the L(t)–P(t) diagramin Fig. 7(b), and the first-phase absorption parameters in Fig. 8. We see the absorption parameters have the mediumvalues compared to the PP and the PZ samples. The effect of oxygen treatment/incorporation is universal for the Pdnano-particles, and becomes more significant as the particle fineness increases; i.e., in the order of the PP-sample, thePB-sample and the PZ-sample.
Figure 5. (a) Output power W(t), pressure P(t), time-resolved loading ratio L(t) and time-resolved specific sorption energy "(t), (b) L(t) % P(t)
diagram of the PP3(4) #3 runs.
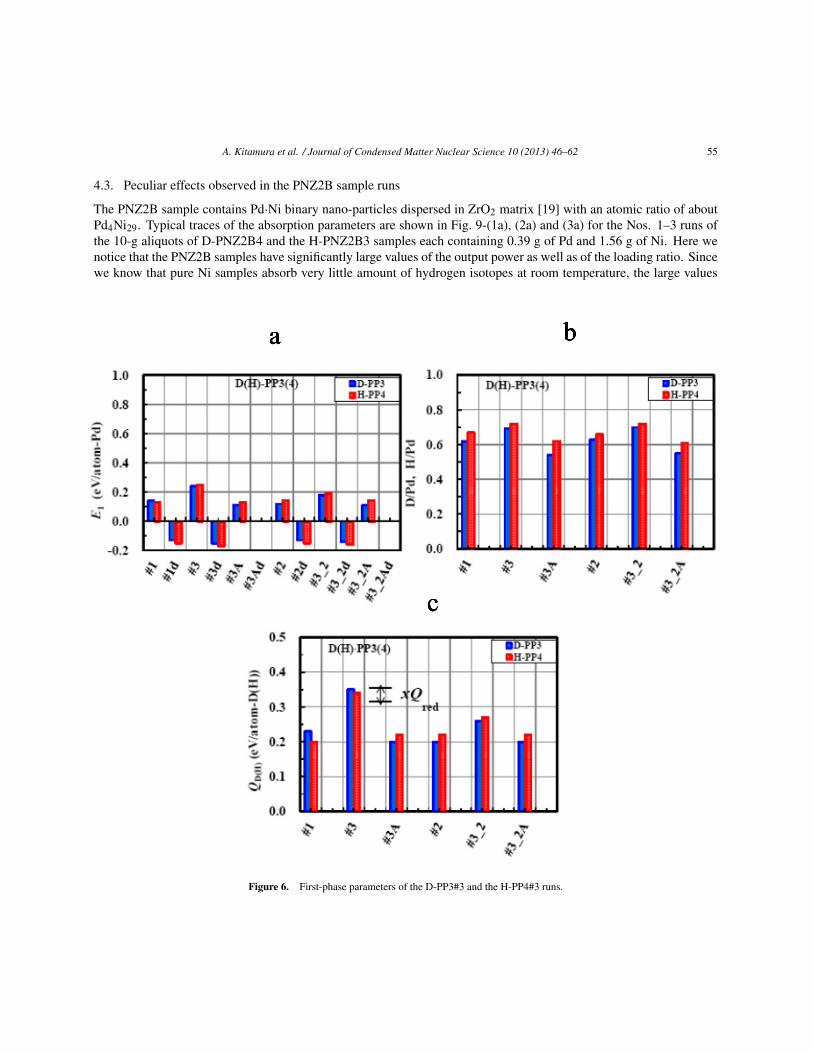
A. Kitamura et al. / Journal of Condensed Matter Nuclear Science 10 (2013) 46–62 55
4.3. Peculiar effects observed in the PNZ2B sample runs
The PNZ2B sample contains Pd·Ni binary nano-particles dispersed in ZrO2 matrix [19] with an atomic ratio of aboutPd4Ni29. Typical traces of the absorption parameters are shown in Fig. 9-(1a), (2a) and (3a) for the Nos. 1–3 runs ofthe 10-g aliquots of D-PNZ2B4 and the H-PNZ2B3 samples each containing 0.39 g of Pd and 1.56 g of Ni. Here wenotice that the PNZ2B samples have significantly large values of the output power as well as of the loading ratio. Sincewe know that pure Ni samples absorb very little amount of hydrogen isotopes at room temperature, the large values
Figure 6. First-phase parameters of the D-PP3#3 and the H-PP4#3 runs.

56 A. Kitamura et al. / Journal of Condensed Matter Nuclear Science 10 (2013) 46–62
of the absorption parameters are ascribed to the existence of a small amount of Pd added to Ni and/or to the dispersedstructure itself of the PNZ2B sample prepared by the melt-spinning method.
The PNZ2B samples showed peculiar pressure changes. Figure 9-(1b), (2b) and (3b) shows the L(t)–P(t) diagramfor the D-PNZ2B4 and H-PNZ2B3runs. One of the distinctive features is that Nos. 1 and 3 runs have pressure humpsin the early stage of the first phase. The gas sorption became significant after the pressure increased to several tens ofkPa.
This behavior, never observed in the runs usingthe samples other than PNZ2B, could be ascribed to possible existenceof NiO layers covering the surface of the Pd·Ni nano-particles. The surface NiO layer is relatively hard to be deoxidized.However, once the deoxidation reaction (??) or (??) with a small reaction energy occurs at a point on the surface anda pit with a dangling bond on the surface of the Pd·Ni nano-particle is exposed to ambient D2 / H2 atmosphere, rapiddissociation to D/H atoms could be initiated at the pit, and rushing of the hydrogen atoms into the bulk would follow,which results in the rapid decrease in the pressure. This could be possible, since the hydrogen adsorption and absorptionof Ni are as easy as those of Pd having almost the same values of adsorption and absorption energies [21]. However,we know that the samples had very little amount of oxygen atoms after each absorption run. Complete deoxidationduring No. 1 run and No. 3 run should therefore be concluded. So the above story seems to be not probable.
Another interpretation of the pressure behavior could be condensation of supersaturated water vapor produced fromthe hydrogen and oxygen in/on the sample contained in the as-received (No. 1) and the oxidized (No. 3) samples. Ifthis is the case, the assumption could be justified that there occurred no water condensation in the PP, PB and PZ runs,which had no humps in the pressure traces.
Figure 10 shows the absorption parameters E1, D(H)/[Pd·Ni] and QD(H) as histograms. In evaluating QD(H) usingEq. (??), no contribution of the term xQred has also been assumed here. The most remarkable feature of the PNZ2B
Figure 7. (a) Output power W(t), pressure P(t), time-resolved loading ratio L(t) and time-resolved specific sorption energy "(t), (b) L(t) % P(t)
diagram of the PB5(6)#3 runs.
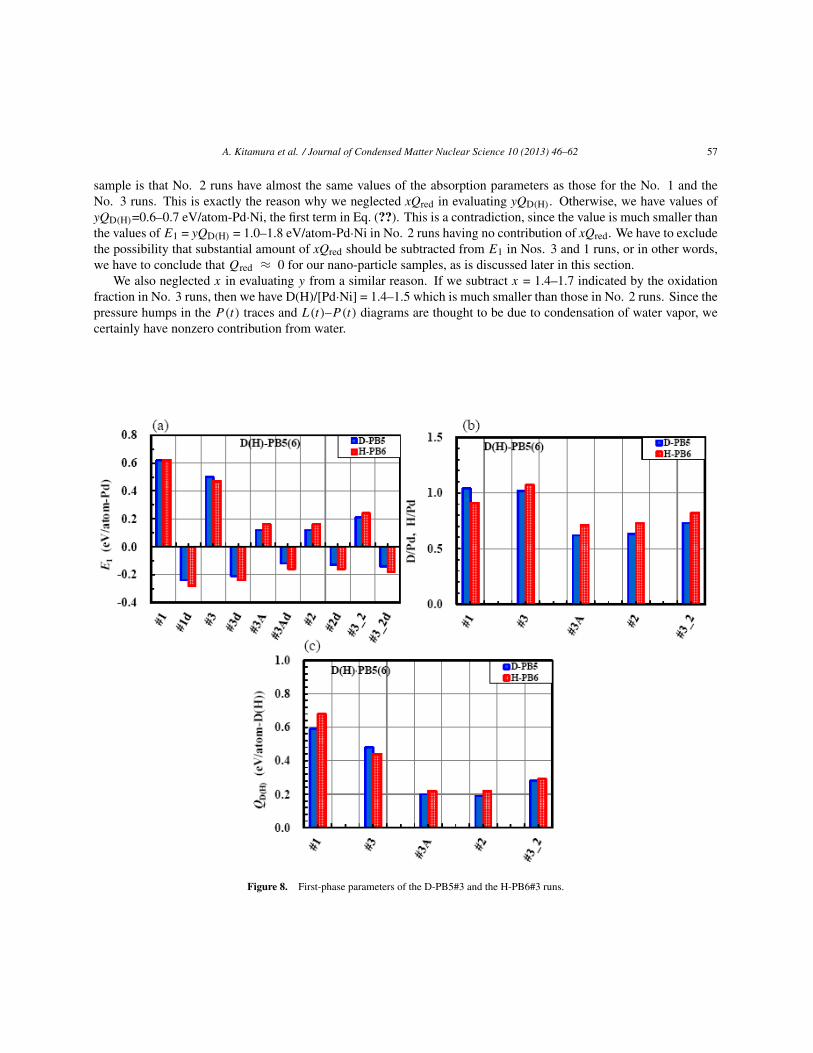
A. Kitamura et al. / Journal of Condensed Matter Nuclear Science 10 (2013) 46–62 57
sample is that No. 2 runs have almost the same values of the absorption parameters as those for the No. 1 and theNo. 3 runs. This is exactly the reason why we neglected xQred in evaluating yQD(H). Otherwise, we have values ofyQD(H)=0.6–0.7 eV/atom-Pd·Ni, the first term in Eq. (??). This is a contradiction, since the value is much smaller thanthe values of E1 = yQD(H) = 1.0–1.8 eV/atom-Pd·Ni in No. 2 runs having no contribution of xQred. We have to excludethe possibility that substantial amount of xQred should be subtracted from E1 in Nos. 3 and 1 runs, or in other words,we have to conclude that Qred # 0 for our nano-particle samples, as is discussed later in this section.
We also neglected x in evaluating y from a similar reason. If we subtract x = 1.4–1.7 indicated by the oxidationfraction in No. 3 runs, then we have D(H)/[Pd·Ni] = 1.4–1.5 which is much smaller than those in No. 2 runs. Since thepressure humps in the P(t) traces and L(t)–P(t) diagrams are thought to be due to condensation of water vapor, wecertainly have nonzero contribution from water.
Figure 8. First-phase parameters of the D-PB5#3 and the H-PB6#3 runs.
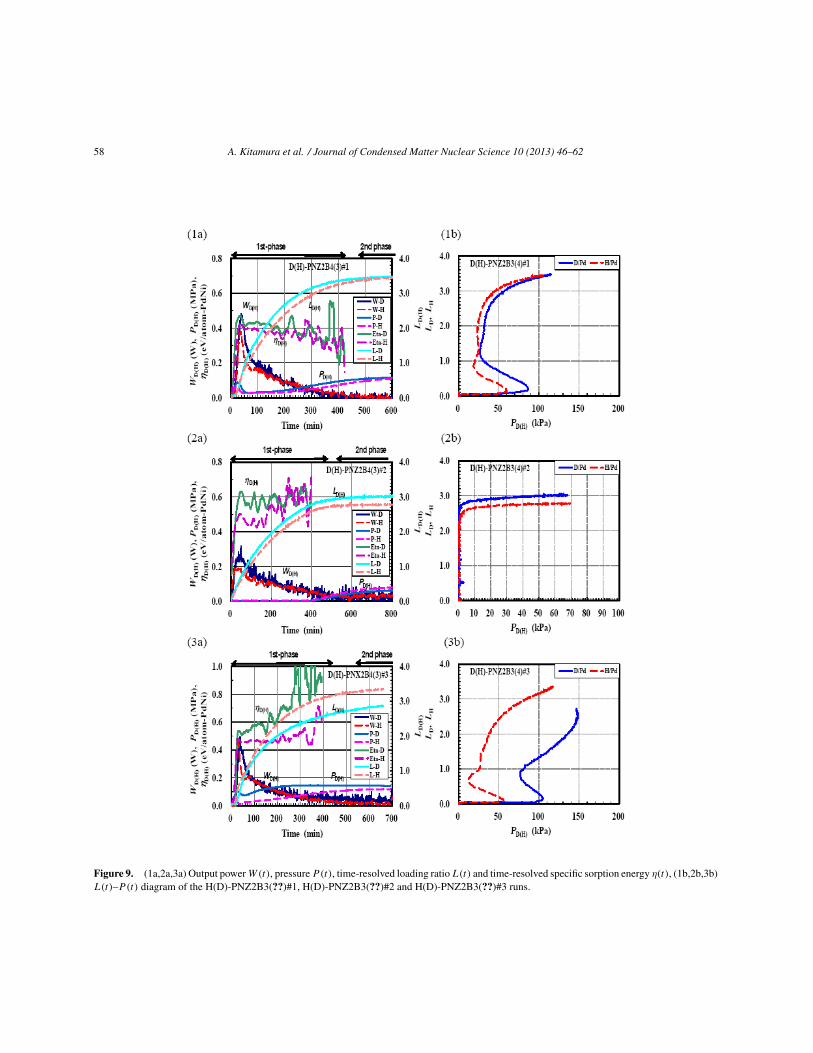
58 A. Kitamura et al. / Journal of Condensed Matter Nuclear Science 10 (2013) 46–62
Figure 9. (1a,2a,3a) Output power W(t), pressure P(t), time-resolved loading ratio L(t) and time-resolved specific sorption energy "(t), (1b,2b,3b)L(t)–P(t) diagram of the H(D)-PNZ2B3(??)#1, H(D)-PNZ2B3(??)#2 and H(D)-PNZ2B3(??)#3 runs.
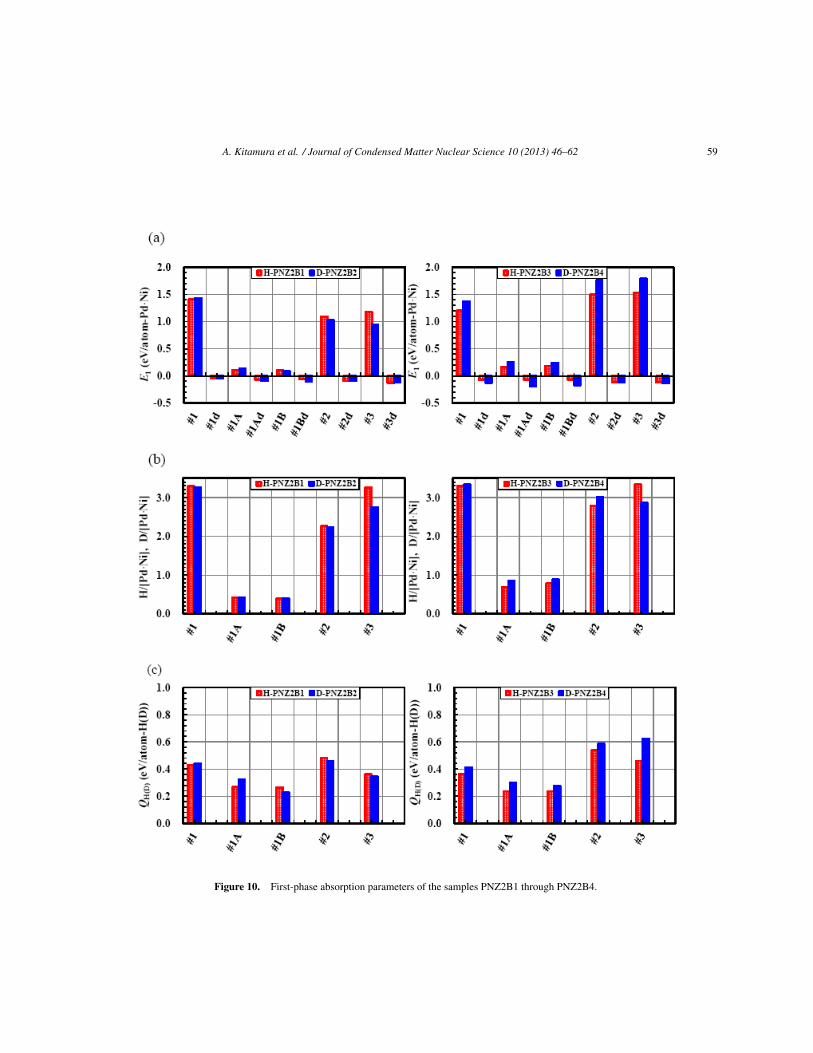
A. Kitamura et al. / Journal of Condensed Matter Nuclear Science 10 (2013) 46–62 59
Figure 10. First-phase absorption parameters of the samples PNZ2B1 through PNZ2B4.
60 A. Kitamura et al. / Journal of Condensed Matter Nuclear Science 10 (2013) 46–62
We have to have an additional diagnostic tool to measure x independently, e.g., a residual gas mass analyzer.The finally saturated value of the loading ratio, D(H)/[Pd·Ni], is extraordinarily large; 2.1 or larger not only in Nos.
1 and 3 runs but also in No. 2 run for the sample containing no oxygen. The large values of the loading ratio couldbe explained by adsorption on the supporter (ZrO2) surface and/or in the grain boundaries via the so-called spill-overeffect catalyzed by small amount of Pd atoms on the Ni nano-particle surface. An assumption that hydrogen isotopesare loaded both into the tetrahedral and octahedral sites seems to be too bold.
The No. 2 samples absorb/adsorb almost the same amount of hydrogen with almost the same sorption energy asthose in Nos. 1 and 3 runs. This fact can be explained by an assumption that the baking condition of 0.5 h at 570 Kwas sufficient to purge almost all the hydrogen atoms adsorbed and absorbed in the preceding runs and the forceddeoxidation process. This is consistent with the relatively small values of QD(H) # 0.4 eV/atom-D(H) shown inFig. 10 (c) compared with those for the PP, the PB and the PZ samples.
From this fact, we can be confident about the assumption of neglecting the term xQred in evaluating yQD(H) usingEq. (??). Since x is not negligible at least for the PNZ2B sample, we may conclude that the oxygen pickup energyQredin Eqs. (??)–(??) is reduced to small values as a result of a nano-size effect. This is equivalent to a deductionthat oxidation energies, QPdO and QNiO, are significantly increased for the nano-particle samples due to the nano-sizeeffect.
Another distinctive feature is that the pressure in the first-phase of No. 2 run is too low to notice the isotope effectin the L(t)–P(t) diagram. This could be due to an unknown effect of the nano-particle-dispersed structure, or to thatof the Ni nano-particle itself. At the moment, we have no further information to determine what the case is.
Next, we notice that "D(H) is relatively constant throughout a run with the mean value lying between 0.4 and0.6 eV/atom-D(H), in accordance with the absence of the sub-phase transition. This is in contrast to the PZ, PP and PBsamples whose first-phases were divided into the 1a- and the 1b-phases. The mean values for the PNZ2B samples arerather modest compared with those ("1 eV/atom-D(H))in the 1a-phase of other sample runs.This is a consequence oflarge LD(H)(t) for the PNZ2B sample.
Finally it should be pointed out that in all cases of Nos. 1–3 runs, the averaged value of "Dfor deuterium is largerthan that of "H for protium, sometimes by a factor of 1.5 or more. This might indicate that some nuclear effects includingnuclear reactions could contribute to the heat evolution.
5. Summary
Deuterium and protium gas absorption/adsorption by a variety of Pd nano-powders has been examined using a twinabsorption system. The powders include "0.1-µm!Pd powder (PP), Pd-black (PB), Pd nano-particles ("10 nm!)admixed with ZrO2 (PZ) and Pd·Ni binary nano-particles ("2 nm!) dispersed in ZrO2 holder-flakes (PNZ2B). Thefirst-phase parameters of the absorption runs for the PP, the PB and the PZ samples are summarized as follows:
(1) Both the deoxidized samples and those reused without baking process showed essentially the same valuesof 0.62 ± 0.04 (0.70 ± 0.06) for the loading ratio D(H)/Pd, and 0.14 ± 0.03 (0.16 ± 0.01) eV/atom-Pd forthe specific output energy E1D(H). The resultant hydridation energy QD(H) = 0.23 ± 0.05 (0.23 ± 0.01)eV/atom-D(H) is consistent with the published value of the inter-lattice absorption energy for bulky samples.
(2) For the as-received and oxidized samples the values of D(H)/Pd and E1 are both increasing functions of finenessof the Pd surface, and exceeds 2.0 and 1.5 eV/atom-Pd, respectively, for the PZ sample. The hydridationenergy QD(H) = 0.83 ± 0.06 (0.72 ± 0.05) eV/atom-D(H) is substantially larger than the published value of0.5 eV/atom-D(H) for the surface adsorption energy.
(3) Time-resolved measurements of pressure and heat output revealed sub-phase (1a to 1b) transition in the first-phase for the as-received and the oxidized samples. The 1a-phase, characterized by rapid absorption/adsorptionand high heat output, is found to be characteristic of nano-particles containing oxygen, probably caused by the
A. Kitamura et al. / Journal of Condensed Matter Nuclear Science 10 (2013) 46–62 61
process occurring in the near-surface region. A rather large isotope effect in the differential heat of sorption,"D(H), has sometimes been observed in the 1a-phase. The 1b-phase, on the other hand, is thought to be due toabsorption into the bulk with significant isotope effect on the loading-pressure relation, L(t)–P(t).
The Pd0.04Ni0.29Zr0.67 oxide composite sample, PNZ2B, has unique properties summarized as follows:
(1) The observed loading ratio, D(H)/[Pd·Ni] # 3.2 ± 0.3 (3.4 ± 0.1), and the specific heat release, E1 # 1.4 ± 0.3(1.2 ± 0.3) eV/atom-[Pd·Ni], in the first-phase of the as-received and the oxidized sample runs are both verylarge, while the hydridation energy QD(H) = 0.45 ± 0.12 (0.33 ± 0.09) eV/atom-D(H) is nearly equal to themean value of the surface hydrogen adsorption energy and the absorption energy of bulky Pd. It is inferred thatthe Pd atoms act as a catalyst for the hydrogen isotope absorption/adsorption of Ni at room temperature.
(2) An important difference between the PNZ2B sample and other Pd samples is that the No. 2 run after the forceddeoxidation has essentially the same values of the absorption parameters as those of Nos. 1 and 3 runs. It isinferred that the surface adsorption potential is shall-ower for the PNZ2B sample than for the Pd-based samples.
(3) The as-received and the oxidized PNZ2B samples show anomalous change of gas pressure in the beginning ofthe first-phase, which is thought to be due to condensation of water.
(4) The time-dependent sorption energy is rather constant at"D(H) # 0.60 (0.53) eV/atom-D(H) with no 1a–1b sub-phase transition. The ratio "D/"H is sometimes greater than 1.5, which appears to be suggesting theexistence of heat component of nuclear origin.
References
[1] R. Laesser and K.-H. Klatt; Solubility of hydrogen isotopes in palladium, Phys. Rev. B 28 (1983) 748–758.[2] M.A. Chou and P. Vannice; Calorimetric heat of adsorption measurements of palladium: 1. Influence of crystallite size and
support on hydrogen adsorption, J. Catalysis 104 (1987) 1–16.[3] S.-Y. Huang, C.-D. Huang, B.-T. Chang and C.-T. Yeh; Chemical activity of palladium clusters: sorption of hydrogen; J. Phys.
Chem. B 110 (2006) 21783–21787.[4] For example, E. Storms, Status of cold fusion; Naturwiss .97 (2010) 861–881.[5] Y. Arata and Y. Zhang; The special report on research project for creation of new energy; J. High Temperature Society 34
(2008) 85–93.[6] Y. Arata and Y. Zhang; Development of “DS-Reactor” as the practical reactor of “Cold Fusion” based on the “DS-Cell”
with “DS-Cathode”; In Takahashi A (Ed.) Condensed Matter Nuclear Science, Proc. 12th Int. Conf. on Cold Fusion, WorldScientific, Singapore, 2006, pp. 44–54.
[7] V.A. Kirkinskii and A.I. Khmelnikov; Setup or measuring of energy balance at interaction of metals and hydrogen isotopes gasat high temperatures and pressures, Proc. ICCF13, Sochi, 2007, Publisher Center MATI, Moscow (ISBN 978-5-93271-428-7)pp. 43–46.
[8] J.P. Biberian and N. Armanet, Excess heat production during D2diffusion through palladium, Proc. ICCF13, Sochi, 2007.Publisher Center MATI, Moscow (ISBN 978-5-93271-428-7) pp. 170–180.
[9] F. Celani, P. Marini, V. di Stefano, M. Nakamura, O.M. Calamai, A. Spallone, E. Purchi, V. Andreassi, B. Ortenzi, E. Righi,G. Trenta, G. Cappuccio, D. Hampai, F. Piastra and A. Nuvoli; Towards a high temperature CMNS reactor: nano-coated Pdwires with D2 at high pressures; http://iccf15.frascati.enea.it/ICCF15-PRESENTATIONS/S4_O3_Celani.pdf.
[10] D. Kidwell, A. Rogers, K. Grabowski and D. Knies, Does gas loading produce anomalousheat?;http://iccf15.frascati.enea.it/ICCF15-PRESENTATIONS/S4_O6_Kidwell.pdf. (2009).
[11] T. Hioki, H. Azuma, T. Nishi, A. Itoh, J. Gao, S. Hibi, T. Motohiro and J. Kasagi, Hydrogen/deuterium absorption property ofPd fine particle systems and heat evolution associated with hydrogen/deuterium loading, Proc. ICCF-15, 2009, Rome, Italy,2011.
[12] T. Hioki, H. Azuma, T. Nishi, A. Itoh, S. Hibi, J. Gao, T. Motohiro and J. Kasagi; Absorption capacity and heat evolution
62 A. Kitamura et al. / Journal of Condensed Matter Nuclear Science 10 (2013) 46–62
with loading of hydrogen isotope gases for Pd nanopowder and Pd/ceramics nanocomposite, J. Condensed Matter Nucl. Sci.4 (2011) 69–80.
[13] O. Dmitriyeva, R. Cantwell, M. McConnell, G. Moddel, Deuterium and hydrogen loading into nano-Pd on zeolite and aluminamatrices at low pressures, 9thInt. Work shop on Anomalies in Hydrogen/Deuterium Loaded Metals, 2010, Sienna, Italy.
[14] T. Nohmi, Y. Sasaki, T. Yamaguchi, A. Taniike, A. Kitamura, A. Takahashi, R. Seto and Y. Fujita, Basic research on condensedmatter nuclear reaction using Pd powders charged with high density deuterium; http://www.ler-canr.org; Proc. 14th Int. Conf.Condensed Matter Nucl. Sci. (ICCF14), Washington, DC, 2008.
[15] Y. Sasaki, A. Kitamura, Y. Miyoshi, T. Nohmi, A. Taniike, A. Takahashi, R. Seto and Y. Fujita; Anomalous heat generationin charging of Pd powders with high density hydrogen isotopes -(I). Results of absorption experiments using Pd powders;http://iccf15.frascati.enea.it/ICCF15-PRESENTATIONS/S7_O5_Sasaki.pdf.
[16] A. Kitamura, T. Nohmi,Y. Sasaki, A. Taniike, A. Takahashi, R. Seto andY. Fujita; Anomalous effects in charging of Pd powderswith high density hydrogen isotopes, Phys. Lett. A 373 (2009) 3109–3112.
[17] A. Kitamura, Y. Sasaki, Y. Miyoshi, A. Taniike, A. Takahashi, R. Seto and Y. Fujita, Heat Evolution from Pd nano-powdersexposed to high-pressurehydrogen isotopes and associated radiation measurements, J. Condensed Matter Nucl. Sci. 4 (2011)56–68.
[18] A. Kitamura, Y. Miyoshi, H. Sakoh, A. Taniike, A. Takahashi, R. Seto and Y. Fujita, Time-resolved measurements of loadingratios and heat evolution in D2 (and H2)–Pd·Zr mixed-oxide systems, J. Condensed Matter Nucl. Sci. 5 (2011) 42–51.
[19] B. Ahern, Private communication, 2011.[20] A. Takahashi, A. Kitamura, Y. Sasaki, Y. Miyoshi, A. Taniike, A. Takahashi, R. Seto and Y. Fujita, Role of PdO surface-coating
of Pd nano-particle for D(H) charging and cluster fusion, Proc. 10th Meeting of Japan-CF Research Society, 2010, pp. 46–53.[21] Y. Fukai, K. Tanaka and H. Uchida, Hydrogen and Metals (Uchida Rokakuho, Tokyo, 1998) [in Japanese].
J. Condensed Matter Nucl. Sci. 10 (2013) 63–71
Research Article
Recent Advances in Deuterium PermeationTransmutation Experiments
Y. Iwamura !, T. Itoh and N. YamazakiAdvanced Technology Research Center, Mitsubishi Heavy Industries Ltd., Yokohama 220-0012, Japan
H. YonemuraHigh Energy Accelerator Research Organizations (KEK), Tsukuba 305-0801, Japan
K. FukutaniInstitute of Industrial Science, University of Tokyo, Tokyo 153-8505, Japan
D. SekibaResearch Facility Center for Science and Technology, University of Tsukuba, 1-1-1 Tennodai, Tsukuba, Ibaraki 305-8577, Japan
Abstract
We have been investigating low-energy nuclear transmutation reactions observed in the nano-structured Pd/CaO multilayer complexinduced by deuterium permeation through it. A micro-beam Nuclear Reaction Analysis (NRA) system, by means of a resonantnuclear reaction 1H(15N,!" )12C, has been developed for the purpose of the 3D mapping of the hydrogen distribution in the Pdmultilayer complex. Using this system, we observed hydrogen density of Pd/CaO multilayer is higher than that of normal Pd.Preliminary experimental results were obtained, which suggested that implanted W was transmuted into Os or Pt.© 2013 ISCMNS. All rights reserved. ISSN 2227-3123
Keywords: Deuterium, Multilayer, Nano-structure, Permeation, Pd, Transmutation
1. Introduction
Low-energy nuclear transmutation reactions have been observed in the nano-structured Pd multilayer complex, whichare composed of Pd and CaO thin film and Pd substrate, induced by deuterium permeation through the Pd multilayercomplex [1–5]. Transmutation reactions of Cs into Pr, Ba into Sm and Sr into Mo were observed. Especially,transmutation of Cs into Pr has been confirmed by “in-situ” measurements using X-ray fluorescence spectrometry
!E-mail: [email protected]
© 2013 ISCMNS. All rights reserved. ISSN 2227-3123
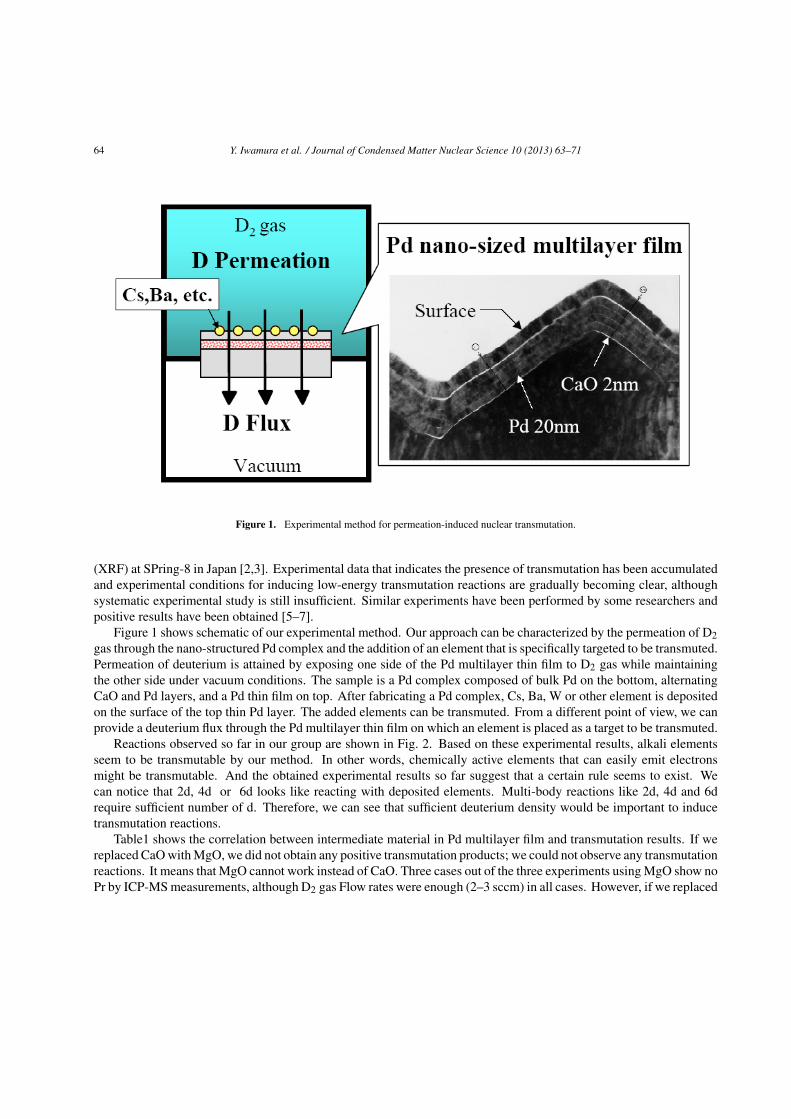
64 Y. Iwamura et al. / Journal of Condensed Matter Nuclear Science 10 (2013) 63–71
Figure 1. Experimental method for permeation-induced nuclear transmutation.
(XRF) at SPring-8 in Japan [2,3]. Experimental data that indicates the presence of transmutation has been accumulatedand experimental conditions for inducing low-energy transmutation reactions are gradually becoming clear, althoughsystematic experimental study is still insufficient. Similar experiments have been performed by some researchers andpositive results have been obtained [5–7].
Figure 1 shows schematic of our experimental method. Our approach can be characterized by the permeation of D2gas through the nano-structured Pd complex and the addition of an element that is specifically targeted to be transmuted.Permeation of deuterium is attained by exposing one side of the Pd multilayer thin film to D2 gas while maintainingthe other side under vacuum conditions. The sample is a Pd complex composed of bulk Pd on the bottom, alternatingCaO and Pd layers, and a Pd thin film on top. After fabricating a Pd complex, Cs, Ba, W or other element is depositedon the surface of the top thin Pd layer. The added elements can be transmuted. From a different point of view, we canprovide a deuterium flux through the Pd multilayer thin film on which an element is placed as a target to be transmuted.
Reactions observed so far in our group are shown in Fig. 2. Based on these experimental results, alkali elementsseem to be transmutable by our method. In other words, chemically active elements that can easily emit electronsmight be transmutable. And the obtained experimental results so far suggest that a certain rule seems to exist. Wecan notice that 2d, 4d or 6d looks like reacting with deposited elements. Multi-body reactions like 2d, 4d and 6drequire sufficient number of d. Therefore, we can see that sufficient deuterium density would be important to inducetransmutation reactions.
Table1 shows the correlation between intermediate material in Pd multilayer film and transmutation results. If wereplaced CaO with MgO, we did not obtain any positive transmutation products; we could not observe any transmutationreactions. It means that MgO cannot work instead of CaO. Three cases out of the three experiments using MgO show noPr by ICP-MS measurements, although D2 gas Flow rates were enough (2–3 sccm) in all cases. However, if we replaced
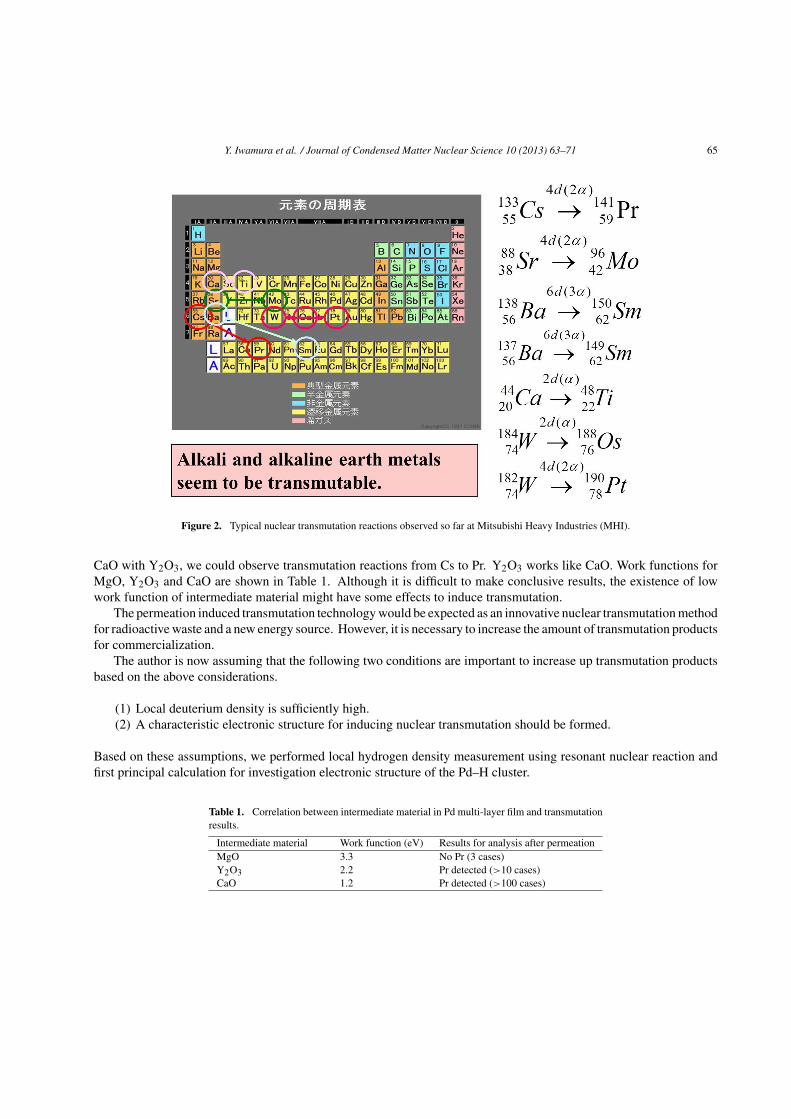
Y. Iwamura et al. / Journal of Condensed Matter Nuclear Science 10 (2013) 63–71 65
Figure 2. Typical nuclear transmutation reactions observed so far at Mitsubishi Heavy Industries (MHI).
CaO with Y2O3, we could observe transmutation reactions from Cs to Pr. Y2O3 works like CaO. Work functions forMgO, Y2O3 and CaO are shown in Table 1. Although it is difficult to make conclusive results, the existence of lowwork function of intermediate material might have some effects to induce transmutation.
The permeation induced transmutation technology would be expected as an innovative nuclear transmutation methodfor radioactive waste and a new energy source. However, it is necessary to increase the amount of transmutation productsfor commercialization.
The author is now assuming that the following two conditions are important to increase up transmutation productsbased on the above considerations.
(1) Local deuterium density is sufficiently high.(2) A characteristic electronic structure for inducing nuclear transmutation should be formed.
Based on these assumptions, we performed local hydrogen density measurement using resonant nuclear reaction andfirst principal calculation for investigation electronic structure of the Pd–H cluster.
Table 1. Correlation between intermediate material in Pd multi-layer film and transmutationresults.
Intermediate material Work function (eV) Results for analysis after permeationMgO 3.3 No Pr (3 cases)Y2O3 2.2 Pr detected (>10 cases)CaO 1.2 Pr detected (>100 cases)
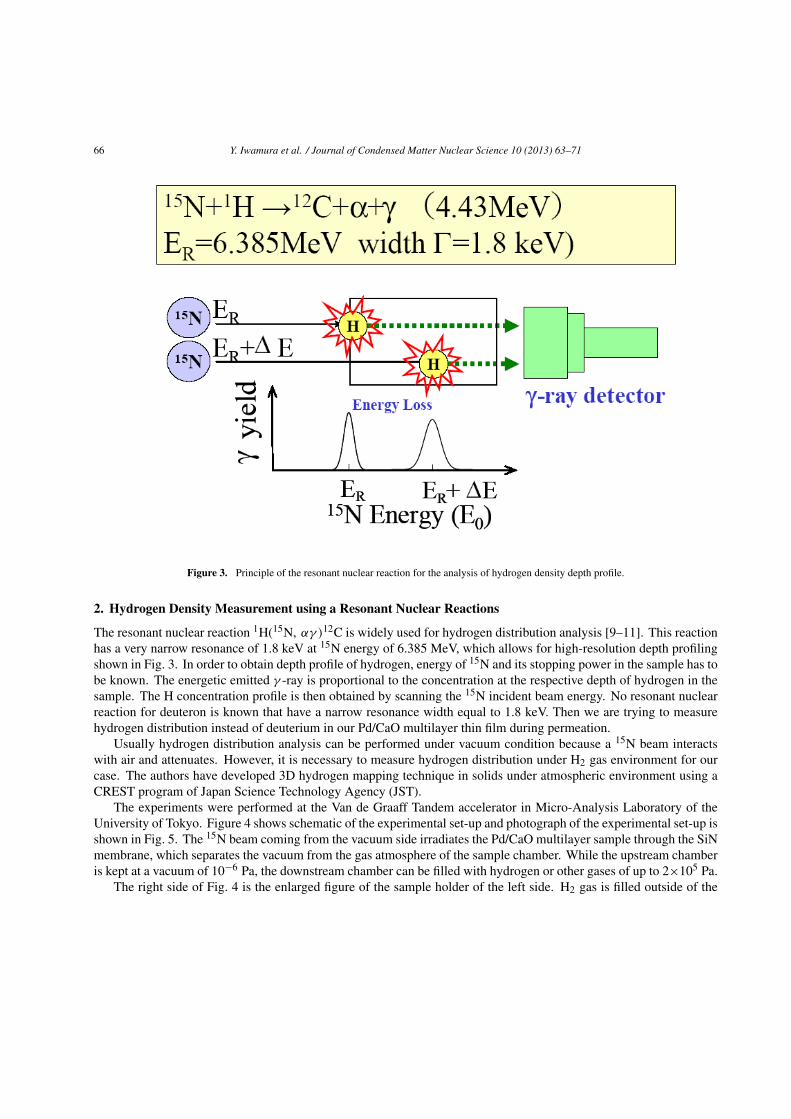
66 Y. Iwamura et al. / Journal of Condensed Matter Nuclear Science 10 (2013) 63–71
Figure 3. Principle of the resonant nuclear reaction for the analysis of hydrogen density depth profile.
2. Hydrogen Density Measurement using a Resonant Nuclear Reactions
The resonant nuclear reaction 1H(15N, !" )12C is widely used for hydrogen distribution analysis [9–11]. This reactionhas a very narrow resonance of 1.8 keV at 15N energy of 6.385 MeV, which allows for high-resolution depth profilingshown in Fig. 3. In order to obtain depth profile of hydrogen, energy of 15N and its stopping power in the sample has tobe known. The energetic emitted " -ray is proportional to the concentration at the respective depth of hydrogen in thesample. The H concentration profile is then obtained by scanning the 15N incident beam energy. No resonant nuclearreaction for deuteron is known that have a narrow resonance width equal to 1.8 keV. Then we are trying to measurehydrogen distribution instead of deuterium in our Pd/CaO multilayer thin film during permeation.
Usually hydrogen distribution analysis can be performed under vacuum condition because a 15N beam interactswith air and attenuates. However, it is necessary to measure hydrogen distribution under H2 gas environment for ourcase. The authors have developed 3D hydrogen mapping technique in solids under atmospheric environment using aCREST program of Japan Science Technology Agency (JST).
The experiments were performed at the Van de Graaff Tandem accelerator in Micro-Analysis Laboratory of theUniversity of Tokyo. Figure 4 shows schematic of the experimental set-up and photograph of the experimental set-up isshown in Fig. 5. The 15N beam coming from the vacuum side irradiates the Pd/CaO multilayer sample through the SiNmembrane, which separates the vacuum from the gas atmosphere of the sample chamber. While the upstream chamberis kept at a vacuum of 10"6 Pa, the downstream chamber can be filled with hydrogen or other gases of up to 2#105 Pa.
The right side of Fig. 4 is the enlarged figure of the sample holder of the left side. H2 gas is filled outside of the

Y. Iwamura et al. / Journal of Condensed Matter Nuclear Science 10 (2013) 63–71 67
permeation unit. The permeation unit can be heated by the heater since transmutation experiments are conducted at60–80oC.
Two 4-inch-BGO scintillators mounted 30 mm from the sample outside the vacuum are used for " -ray detection.The yield of " -ray at 4.4 MeV due to the nuclear reaction is normalized to the Rutherford backscattering spectroscopy(RBS) signal from the gold layer on the SiN membrane, which is proportional to the 15N beam current. The acceleratorset-up, i.e. the beam energy and lens/deflector parameters, and data acquisition, i.e. " -ray detection, RBS measurement,beam current reading and sample positioning, are computer-controlled by a Labview-based software, which enables usto perform automatic beam-energy scan and NRA measurements and detector geometry.
Typical size and current of the 15N beam at the target were 200 µm in diameter and 20 nA, respectively. A SiNmembrane grown by low-pressure chemical vapor deposition with a size of 1.1 mm2 and a thickness of 100 nm(Silson Ltd., UK) were used for beam extraction into an ambient condition.
Several depth profiles of hydrogen density during H2 gas permeation have been taken by our groups. However, dueto the limitation of the 15N beam time and the time for experiments, we cannot obtain reasonable and consistent depthprofiles up to now. I would like to stress that the all the depth profiles of Pd/CaO/Pd and pure Pd were different fromeach other. We could not arrange the experimental condition (pressure and temperature) similar to the transmutationexperimental condition (1 atm and 70oC) due to the lack of heater capacity or strength of SiN membrane.We are improv-ing the permeation unit and have plans to measure hydrogen density distribution under various conditions(temperature,time, layer, pressure, etc.) to understand hydrogen behavior in our nano-structured Pd multilayer thin film in the nearfuture.
Figure 4. Schematic of the experimental setup for measurement of hydrogen density distribution during permeation.
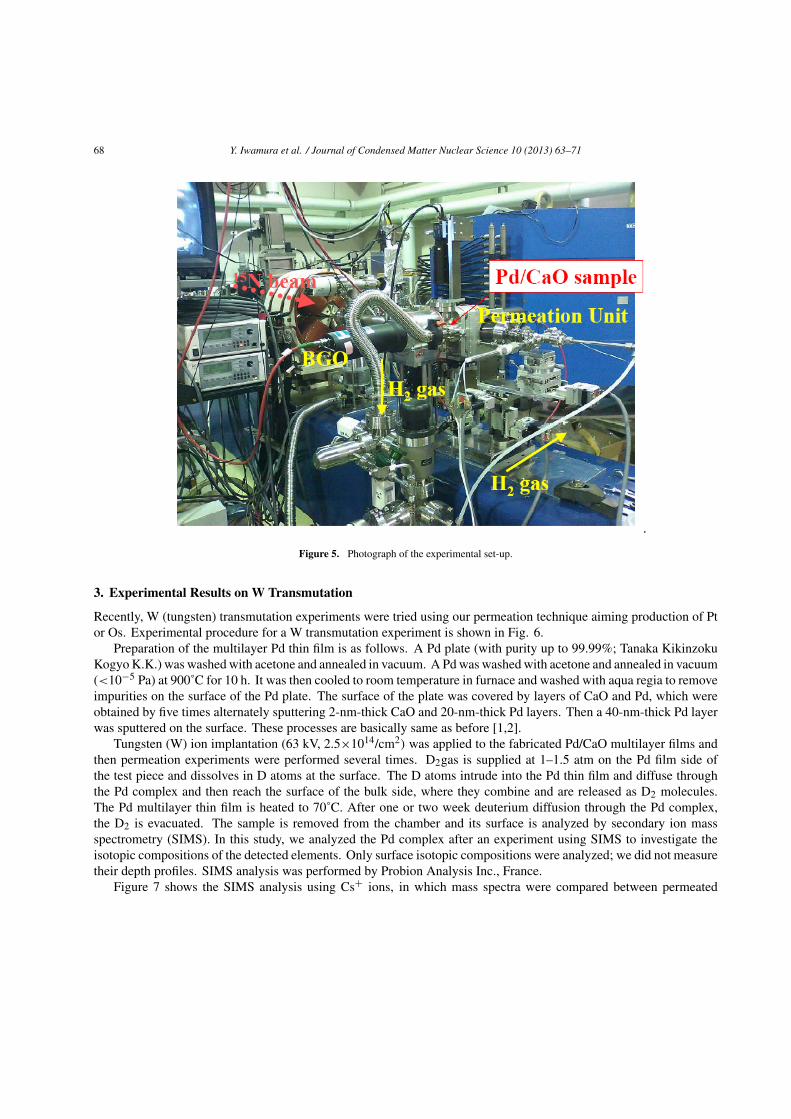
68 Y. Iwamura et al. / Journal of Condensed Matter Nuclear Science 10 (2013) 63–71
Figure 5. Photograph of the experimental set-up.
3. Experimental Results on W Transmutation
Recently, W (tungsten) transmutation experiments were tried using our permeation technique aiming production of Ptor Os. Experimental procedure for a W transmutation experiment is shown in Fig. 6.
Preparation of the multilayer Pd thin film is as follows. A Pd plate (with purity up to 99.99%; Tanaka KikinzokuKogyo K.K.) was washed with acetone and annealed in vacuum. A Pd was washed with acetone and annealed in vacuum(<10"5 Pa) at 900˚C for 10 h. It was then cooled to room temperature in furnace and washed with aqua regia to removeimpurities on the surface of the Pd plate. The surface of the plate was covered by layers of CaO and Pd, which wereobtained by five times alternately sputtering 2-nm-thick CaO and 20-nm-thick Pd layers. Then a 40-nm-thick Pd layerwas sputtered on the surface. These processes are basically same as before [1,2].
Tungsten (W) ion implantation (63 kV, 2.5#1014/cm2) was applied to the fabricated Pd/CaO multilayer films andthen permeation experiments were performed several times. D2gas is supplied at 1–1.5 atm on the Pd film side ofthe test piece and dissolves in D atoms at the surface. The D atoms intrude into the Pd thin film and diffuse throughthe Pd complex and then reach the surface of the bulk side, where they combine and are released as D2 molecules.The Pd multilayer thin film is heated to 70˚C. After one or two week deuterium diffusion through the Pd complex,the D2 is evacuated. The sample is removed from the chamber and its surface is analyzed by secondary ion massspectrometry (SIMS). In this study, we analyzed the Pd complex after an experiment using SIMS to investigate theisotopic compositions of the detected elements. Only surface isotopic compositions were analyzed; we did not measuretheir depth profiles. SIMS analysis was performed by Probion Analysis Inc., France.
Figure 7 shows the SIMS analysis using Cs+ ions, in which mass spectra were compared between permeated
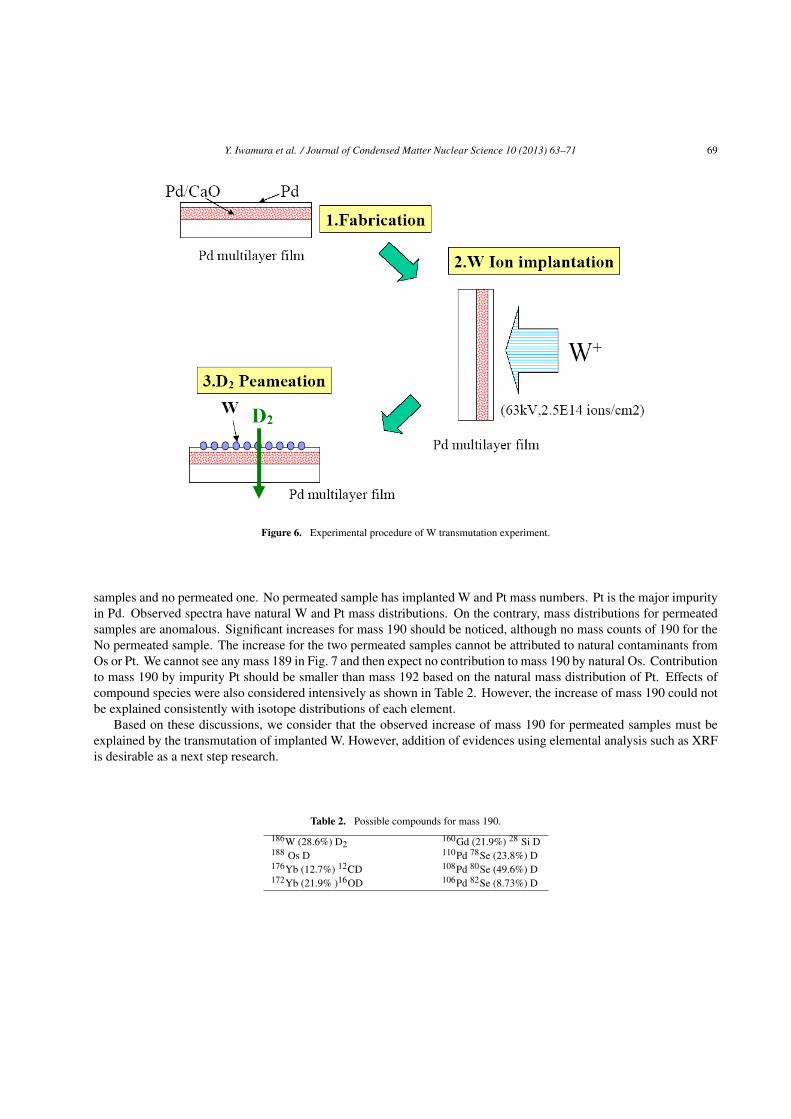
Y. Iwamura et al. / Journal of Condensed Matter Nuclear Science 10 (2013) 63–71 69
Figure 6. Experimental procedure of W transmutation experiment.
samples and no permeated one. No permeated sample has implanted W and Pt mass numbers. Pt is the major impurityin Pd. Observed spectra have natural W and Pt mass distributions. On the contrary, mass distributions for permeatedsamples are anomalous. Significant increases for mass 190 should be noticed, although no mass counts of 190 for theNo permeated sample. The increase for the two permeated samples cannot be attributed to natural contaminants fromOs or Pt. We cannot see any mass 189 in Fig. 7 and then expect no contribution to mass 190 by natural Os. Contributionto mass 190 by impurity Pt should be smaller than mass 192 based on the natural mass distribution of Pt. Effects ofcompound species were also considered intensively as shown in Table 2. However, the increase of mass 190 could notbe explained consistently with isotope distributions of each element.
Based on these discussions, we consider that the observed increase of mass 190 for permeated samples must beexplained by the transmutation of implanted W. However, addition of evidences using elemental analysis such as XRFis desirable as a next step research.
Table 2. Possible compounds for mass 190.186W (28.6%) D2
160Gd (21.9%) 28 Si D188 Os D 110Pd 78Se (23.8%) D176Yb (12.7%) 12CD 108Pd 80Se (49.6%) D172Yb (21.9% )16OD 106Pd 82Se (8.73%) D

70 Y. Iwamura et al. / Journal of Condensed Matter Nuclear Science 10 (2013) 63–71
Figure 7. SIMS spectra for D2 permeated samples and no permeated sample.
4. Concluding Remarks
We assume that the following two conditions are important to induce nuclear transmutation reactions in the permeationexperiments.
(1) Local deuterium density is sufficiently high.(2) A characteristic electronic structure for inducing nuclear transmutation should be formed.
Based on these assumptions, we performed local hydrogen density measurement using resonant nuclear reaction andfirst principal calculation for investigation electronic structure of the Pd–H cluster. The hydrogen density measurementexperiments suggested that hydrogen density of Pd/CaO multilayer seems higher than that of pure Pd. The first-principles computation suggested that high hydrogen density state (H/Pd = 1) in Pd–Cs–H cluster was more stable thanlow hydrogen density state (H/Pd = 0.33).
Tungsten transmutation experiments were tried using our permeation transmutation method.Significant increasesfor mass 190 in SIMS were observed, which suggested that W was transmuted into Os or Pt.
Y. Iwamura et al. / Journal of Condensed Matter Nuclear Science 10 (2013) 63–71 71
Acknowledgements
The authors would like acknowledge Dr. C. Nishimura, Prof. A.Takahashi, Prof. J. Kasagi, Dr. Hioki, Prof. M. Melich,Dr. K. Grabowski, Dr. F. Clelani, Prof. H. Yamada and Prof. S. Narita for their supports and valuable discussions.This work is supported by Japan Science Technology Agency (JST) CREST Program, and Thermal & Electric EnergyTechnology Foundation (TEET).
References[1] Y. Iwamura, M. Sakano and T. Itoh, Elemental analysis of Pd complexes: Effects of D2 gas permeation, Japanese J. App.
Phys. 41 (2002) 4642–4650.[2] Y. Iwamura, T. Itoh, N. Yamazaki, J. Kasagi, Y. Terada, T. Ishikawa, D. Sekiba, H. Yonemuraand and K. Fukutani, Observation
of low energy nuclear transmutation reactions induced by deuterium permeation through multilayer Pd and CaO thin film, J.Condensed Matter Nucl. Sci .4 (2011)132–144.
[3] Y. Iwamura, T. Itoh, M. Sakano, S.Kuribayashi, Y. Terada and T. Ishikawa, Observation of surface distribution of products byX-ray fluorescence spectrometry during D2 gas permeation through Pd complexes, Proc. ICCF 12, A. Takahashi et al. (Eds.),World Scientific, New Jersey (2006), pp. 178–187.
[4] Y. Iwamura, T. Itoh, M. Sakano , S. Sakai and S. Kuribayashi, Low energy nuclear transmutation in condensed matter inducedby D2 gas permeation through pd complexes: Correlation between deuterium flux and nuclear products, Proc. ICCF 10,P.H. Hagelstein and S. Chubb (Eds.), World Scientific, New Jersey (2006), pp. 435–446.
[5] Y. Iwamura, T. Itoh, M. Sakano, S.Kuribayashi, Y. Terada, T. Ishikawa and J. Kasagi, Observation of nuclear transmutationreactions induced by D2 gas permeation through Pd complexes, Proc. ICCF 11, J.-P. Biberian (Ed.), World Scientific, NewJersey (2004), pp. 339–350.
[6] T. Higashiyama, M. Sakano, H. Miyamaru and A. Takahashi, Replication of MHI transmutation experiment by D2 gaspermeation through Pd complex, Proceedings of 10th International Conference on Condensed Matter Nuclear Science,P.H. Hagelstein et al. (Eds.), Condensed Matter Nuclear Science, World Scientific, New Jersey (2006), pp. 447–454.
[7] H. Yamada et al., Producing transmutation elements on plain Pd-foil by permeation of highly pressurized deuterium gas, Proc.ICCF 12, A. Takahashi et al. (Eds.), Condensed Matter Nuclear Science, World Scientific, New Jersey (2006), pp. 196–205.
[8] N. Takahashiet et al., Verification of MHI transmutation, No. 8 Spring-8 Industrial Application Conference, Sep.8–Sep.9,2011, Kobe, Japan (in Japanese).
[9] H. Yonemura, Y. Kitaoka, D. Sekiba, H. Matsuzaki, S. Ogura, M. Matsumoto, Y. Iwamura, T. Ito, T. Narusawa and K. Fukutani,Depth profiling of hydrogen under an atmospheric pressure, Nucl. Instr. Methods Phys. Res. B 269 (2011) 632–635.
[10] H. Yonemura, D. Sekiba, Y. Kitaoka, S. Ogura, M. Wilde, T. Narusawa, T. Nebiki, Y. Iwamura, T. Ito, H. Matsuzaki and K.Fukutani, Development of H(15N, "!)12C nuclear reactionanalysis method at atmosphere with glass capillary, J. Vac. Soc.Jpn. 52 (2009) 145.
[11] D. Sekiba, H. Yonemura, T. Nebiki, M. Wilde, S. Ogura, H. Yamashita, M. Matsumoto, J. Kasagi, Y. Iwamura, T. Itoh, H.Matsuzaki, T. Narusawa and K. Fukutani, Development of micro-beam NRA for 3D-mappingof hydrogen distribution in solids:Application of taperedglass capillary to 6 MeV 15 N ion, Nucl. Instr. Methods Phys. Res. B 266 (2008) 4027–4036.