Journal of Business ForecastinG - SAS Support · Journal of Business ForecastinG ... and SAS are...
14
J O U R N A L O F BUSINESS FORECASTING Interdepartmental Cooperation Optimizes Supply Chain Limitations By Michael Morris 2014 | FALL VOLUME 33 | ISSUE 3 22 18 12 S&OP: The Process Revisited By Larry Lapide Creating an Effective Integrated Business Planning Process: Clif Bar’s Experience By Vicky Grillo Innovations in Business Forecasting By Charles W. Chase, Jr. 4 Institute of Business Forecasting & Planning
Transcript of Journal of Business ForecastinG - SAS Support · Journal of Business ForecastinG ... and SAS are...
J o u r n a l o f
Business ForecastinG
Interdepartmental Cooperation Optimizes Supply Chain Limitations
By Michael Morris
2 0 1 4 | f a l l V o l u m e 3 3 | I s s u e 3
221812 S&OP: The Process Revisited By Larry Lapide
Creating an Eff ective Integrated Business Planning Process: Clif Bar’s ExperienceBy Vicky Grillo
Innovations in Business Forecasting By Charles W. Chase, Jr.
4
Institute of BusinessForecasting & Planning
Institute of BusinessForecasting & Planning
Chaman L. JainEditor-in-Chief
Tom SavageEditor at Large
Evangelos O. SimosEditor, International Economic Affairs
U. RaniBusiness Manager
Judy ChanGraphic Designer
Manuscripts InvitedSubmit manuscript to:Dr. Chaman L. JainTobin College of BusinessSt. John’s University, Jamaica, NY [email protected]
Subscription InformationChange of address requests for subscription, and other correspondence should be addressed to:
Journal of Business Forecasting350 Northern Boulevard, Suite 203Great Neck, New York 11021 USA
Tel: +1.516.504.7576
email: [email protected]: http://www.ibf.orgID No: 11-263-2688
Published Quarterly Domestic $95 Foreign $120
© Copyright 2014 by Journal of Business Forecasting ISSN 1930-126X
Editorial Review Board
George C. WangConsultantNew York, NY
Mark J. LawlessConsultantBraintree, MA
Paul Sheldon FooteCal. State University–FullertonFullerton, CA
Mitchel F. Bloom, Pres.Bloom Forecasting, Inc.Kelowna, BC, Canada
3 Answers to Your Forecasting Questions
4 Interdepartmental Cooperation Optimizes Supply Chain LimitationsBy Michael Morris
7 Is Communication More Important Than Accuracy in Demand Planning? By John Gallucci
12 S&OP: The Process Revisited By Larry Lapide
18 Creating an Effective Integrated Business Planning Process: Clif Bar’s ExperienceBy Vicky Grillo
22 Innovations in Business Forecasting By Charles W. Chase, Jr.
35 Fading Growth Acceleration for the Rest of the Year By Evangelos Otto Simos
40 The U.S. Economic Growth: Steady but Still below Potential By Jamal Nahavandi
48 IBF Calendar 2014-2015
J o u r n a l o f
Business ForecastinGV o l u m e 3 3 I s s u e 3 | f a l l 2 0 1 4
2 Copyright © 2014 Journal of Business Forecasting | All Rights Reserved | Fall 2014
As used in this document, “Deloitte” means Deloitte LLP and its subsidiaries. Please see www.deloitte.com/us/about for a detailed description of the legal structure of Deloitte LLP and its subsidiaries. Certain services may not be available to attest clients under the rules and regulations of public accounting.
Copyright © 2014 Deloitte Development LLC. All rights reserved. Member of Deloitte Touche Tohmatsu Limited
Demand driven forecasting to achieve sustainable resultsJoin us at IBF’s Supply Chain Forecasting & Planning Conference 2014 in Orlando to learn how Deloitte and SAS are working together to help companies develop demand driven supply chains:
• Identifying and sensing true demand drivers
• Enhancing near-term demand plan using the demand signals
• Shaping demand to maximize revenue and profitability
We invite you to the Grand Harbor Salon I at 9:00 a.m. on October 29th to receive a FREE copy of the book, Demand Driven Forecasting. Meet the author Charlie Chase and network with other industry leaders.
And don’t forget to stop by our booth #S1, or visit www.deloitte.com/us/supply_chain.
lIVe OnlIne TraInInG:
deMand PlannInG & FOreCaSTInGPRESERVE CASH, ACHIEVE NEW PRODUCT FORECASTING SUCCESS, OPTIMIZE INVENTORY
& SUPPLY CHAIN EFFICIENCY, IMPROVE CUSTOMER SERVICE, AND MORE
ONLINE EDUC ATIONOnline Education 1 | April 2015 Fundamentals of Demand Planning & Forecasting: 1-Day Workshop 10:00am–4:00pm EST
Online Education 2 | April 2015 An Introduction to Statistical Forecasting: 1-Day Hands-On Workshop 10:00am–4:00pm EST
Online Education 3 | April 2015 Collaborative Planning, POS Based & New Product Forecasting: 1-Day Workshop10:00am–4:00pm EST
Online Education 4 | April 2015 Sales & Operations Planning: What, Why, How, Who, When: 1-Day Workshop10:00am–3:00pm EST
REGISTRATION: $299 (USD) PER COURSE $999 (USD) FULL COURSE (4 DAYS)
IBF’s training program is based on its body of knowledge and over 30 years of fostering the growth of demand planning, forecasting, S&OP, analytics, and careers of those in the fi eld.
FOR FURTHER DETAILS OR TO REGISTER: WEB: www.ibf.org/onlinetraining.cfm | TEL: +1.516.504.7576
ADVANTAGES OF IBF’S ONLINE TRAINING:
• Benchmarks & Best Practices: Get access to valuable benchmarking data, as well as best practices that successful companies are using to win in today’s challenging marketplace. Identify the gaps in regards to your people, process, and technology, and learn what action plans are required to correct them.
• Valuable Bonus Materials: Case studies, exercises, data-sets, templates, and complete presentation slides.
• Save Money & Unlock the Power of Your ERP / Demand Planning Solution: Learn to leverage the power of your ERP for improved demand planning & forecasting. Most companies only utilize a small percentage of their system’s capabilities.
• Certifi cation Preparation: If you’re registered to take IBF’s Certifi ed Professional Forecaster (CPF) exams, this training program is a great way to prepare.
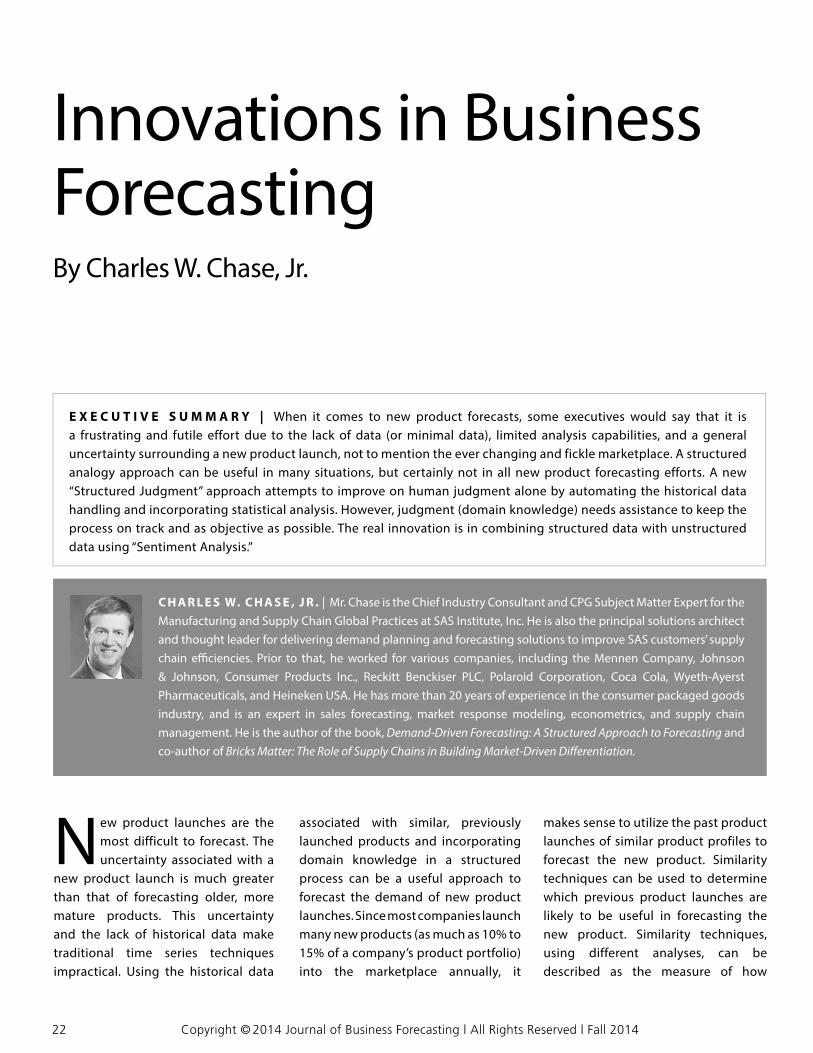
E X E C U T I V E S U M M A R Y | When it comes to new product forecasts, some executives would say that it is a frustrating and futile effort due to the lack of data (or minimal data), limited analysis capabilities, and a general uncertainty surrounding a new product launch, not to mention the ever changing and fickle marketplace. A structured analogy approach can be useful in many situations, but certainly not in all new product forecasting efforts. A new “Structured Judgment” approach attempts to improve on human judgment alone by automating the historical data handling and incorporating statistical analysis. However, judgment (domain knowledge) needs assistance to keep the process on track and as objective as possible. The real innovation is in combining structured data with unstructured data using “Sentiment Analysis.”
C H A R L E S W. C H A S E , J R . | Mr. Chase is the Chief Industry Consultant and CPG Subject Matter Expert for the Manufacturing and Supply Chain Global Practices at SAS Institute, Inc. He is also the principal solutions architect and thought leader for delivering demand planning and forecasting solutions to improve SAS customers’ supply chain effi ciencies. Prior to that, he worked for various companies, including the Mennen Company, Johnson & Johnson, Consumer Products Inc., Reckitt Benckiser PLC, Polaroid Corporation, Coca Cola, Wyeth-Ayerst Pharmaceuticals, and Heineken USA. He has more than 20 years of experience in the consumer packaged goods industry, and is an expert in sales forecasting, market response modeling, econometrics, and supply chain management. He is the author of the book, Demand-Driven Forecasting: A Structured Approach to Forecasting and co-author of Bricks Matter: The Role of Supply Chains in Building Market-Driven Diff erentiation.
Innovations in Business Forecasting By Charles W. Chase, Jr.
New product launches are the most difficult to forecast. The uncertainty associated with a
new product launch is much greater than that of forecasting older, more mature products. This uncertainty and the lack of historical data make traditional time series techniques impractical. Using the historical data
associated with similar, previously launched products and incorporating domain knowledge in a structured process can be a useful approach to forecast the demand of new product launches. Since most companies launch many new products (as much as 10% to 15% of a company’s product portfolio) into the marketplace annually, it
makes sense to utilize the past product launches of similar product profiles to forecast the new product. Similarity techniques can be used to determine which previous product launches are likely to be useful in forecasting the new product. Similarity techniques, using different analyses, can be described as the measure of how
22 Copyright © 2014 Journal of Business Forecasting | All Rights Reserved | Fall 2014
much two or more objects are alike. In this case products that are similar based on their characteristics (i.e., flavor, color, package type, size, and more). Similarity can also be seen as the numerical distance between multiple data objects that are typically represented as value between the range of 0 (not similar at all) and 1 (completely similar). The new product is then forecast based on these similar product profiles using analogous forecasting techniques. Once the new product is launched, the sales can be monitored, tracked, and adjusted based on actual sales over time. This quarterly column discusses recent innovations in new product launches, using data mining, segmentation and clustering, statistical forecasting, domain knowledge, and unstructured data to forecast what is referred to as evolutionary new products (e.g., line extensions, or “As Like” products).
EVOLUTIONARY VERSUS REVOLUTIONARY NEW PRODUCTS
There are two basic types of new products: revolutionary and evolutionary. Revolutionary new products change the way people behave and work. Evolutionary new products typically add incremental improvements, or evolutionary changes to an existing product line. Revolutionary products establish a new market or solution within a market. Evolutionary products typically provide new useful, usable, or desirable innovations that address the current trends. They require injections of new value to maintain the consumer’s connection to the product. Revolutionary products create new
markets, channels, and product lines that either replace products lines or create completely new ones. Over the past two decades, we have experienced both types of new product launches.
Evolutionary product launches at best result in small consistent improvements by expanding a product line, such as expanding chocolate ice cream from non-fat chocolate ice cream to slow-churned chocolate ice cream. However, in the case of evolutionary new products, unless the approach is modified over time, the results soon flat line. Revolutionary new product launches, however, can have an exponential effect. For example, let’s consider a high-tech manufacturing company. In 1972, Polaroid introduced a new instant camera that released the picture from the front of the camera, and the picture developed instantly as you viewed it. Everyone thought this was a revolutionary product when in fact it was evolutionary. The earlier Polaroid camera developed the instant picture inside the camera. After 60 seconds, the user could pull the picture out of the back of the camera, wait two minutes, and then peel the layers apart to view the final developed picture. The new camera shot the instant picture out of the front of the camera, and it developed instantly in front of the user in two minutes. In each case, the user held the picture in the air, waving it in the belief that doing so helped the development process, when in fact it did not. Although this was an improvement from the original camera, it was still using instant film, and it was an instant camera taking the picture. In other words, this was an evolutionary new product. Over time, many evolutionarily new products eventually become commodities. It was the digital camera in 1994 that was revolutionary, and changed
the landscape of photography for consumers.
Today, almost no one uses film, and everyone has a digital camera that allows them to share photographs via the Internet, cell phones, and other social media devices. Over time, most commodities soon go to the lowest bidder or become obsolete. In this case, instant photography became obsolete, as did film. Today, companies like Kodak, which was once the king of film manufacturing, are announcing that they are discontinuing much of their film production.
Apple has come out with many revolutionary new products. Walk into an Apple store and be wowed with innovation. Starting with the Mac back in the 1980s, almost every product has set new ground. There was the iPod, the iPhone, and now the iPad, each new product selling out with lines to the stores around the block. Revolution done right can have incredible results. However, most revolutionary products have virtually no historical data to use to predict the demand on launch, making it very difficult to forecast.
Nevertheless, the vast majority (85% to 90%, on average, across all industries) of new product launches are evolutionary. They build on something that is well established in the marketplace and understood by many people. A product can evolve in one of these ways: • Improvements in product per-
formance• Reduced price due to mass market
demand and innovation• Expanding the product into new
markets• Expand the product for different usage
(e.g., Arm & Hammer Baking Soda) Most products start out simple with
basic consumer value. There is little
Copyright © 2014 Journal of Business Forecasting | All Rights Reserved | Fall 2014 23

data to determine what customers like because customers themselves are exploring how to use the product. For this reason, adding lots of features up front provides little benefit. Over time, customers help define desired features. The challenge then is to iterate fast enough to deliver more and better features to the market. The smart phone market comes to mind, where every year brings systems that offer more power, more memory, more applications, and more features in ever smaller packages with ever bigger touch screens. Given the success of the iPhone 5, it should be relatively easy for Apple to predict the demand upon launch for the next iPhone.
NEW PRODUCT FORECASTING PROCESS The typical new product forecasting process normally involves four key steps:
1. Query. Finds a set of candidate products that have similar attributes to the new product. Based on the new product’s attributes, this step
returns a set of candidate series that are similar to the unknown new product series.
2. Filter. Removes outlier products from the set of candidate products to form a set of surrogate products. Based on the candidate series statistical properties, this step returns a set of surrogate series that have more similar statistical properties to the unknown new product series.
3. Model. Extracts statistical model features from the set of surrogate products and possibly finds model-based outliers. Based on the surrogate series statistical features, this step returns the statistical features associated with the unknown new product series.
4. Forecast. Uses the extracted statistical model features to forecast the new product and compensate for timing issues. Based on statistical features of the new product series, this step returns the forecasts for the unknown new product series and compensates for timing issues. Timing includes initial period or season of introduction to the marketplace.
STRUCTURED JUDGMENT ANALYSIS
Structured judgment (Michael Leonard et al. April 2007) guides human judgment (overrides) using an otherwise purely statistical analysis (specified or automatic) based on the data. Each process step involves specification, analysis, exploration, judgment, and feedback sub-steps.• Specification. Specify the statistical
analysis to be performed for the process step. This specification may possibly be defaulted or automatically selected based on a selection criterion.
• Analysis. Compute the specified statistical analysis for the process step.
• Exploration. Explore the statistical analysis results (tabular or graphi-cal) for the process step.
• Judgment. Override the statistical analysis results with domain knowledge for the process step.
• Feedback. View the impact of the overrides in the context of the statistical analysis results for the process step. Figure 1 defines the sub-steps
associated with the structured judgmental analysis process. Given the input data sets supplied by the previous step in the process, the modeler specifies the statistical analysis to be performed on the input data sets. The specified analysis is performed on the input data sets, which generates the statistical results data sets. The modeler graphically explores the statistical results from the results data sets. The modeler can accept the results, change the analysis specification, or apply domain knowledge (judgment) to further define the data sets. If the modeler
Figure 1 | Sub-Steps Associated with the Structured Judgmental Analysis Process
26 Copyright © 2014 Journal of Business Forecasting | All Rights Reserved | Fall 2014
decides to modify the analysis specification, then the Specification sub-step is repeated. If the modeler applies judgment, the judgmental graphical results are displayed as feedback. If the modeler accepts the results, the next step in the process is Execution, or deployment to the demand plan, adding it to its specified market, channel, brand, product group, product, and stock-keeping unit business hierarchy for consumption.
Note that structured judgment can be used to combine statistical analysis with judgmental analysis in the new product forecasting process. This is a real innovation combining data, analytics (data mining, clustering, statistical forecasting), and domain knowledge (judgment), using wizard-driven (point-and-click) technology.
USING STRUCTURED JUDGMENT: A CONSUMER PACKAGED GOODS EXAMPLE
The new product forecasting process involves four steps: Querying, Filtering, Modeling, and Forecasting. Not all new product forecasting processes include these steps, and in some situations more steps may be needed to augment the process. The process assumes that the necessary historical data have been properly collected and stored.
Query Step. Define candidate pro ducts. The purpose of this step is to find a set of candidate products, whose attributes are similar to the new product that can be useful in forecasting the unknown new product series. Typically, the set of candidate series should be similar to the new
product series. However, since the new product series is not known, the known attributes of the new product can be used to find a set of candidate series with similar attributes. Typically, the size of the set of candidate series should not be too small or too large, because the sample may not be representative of the properties and/or variations associated with the new product series. However, the size of the set may be very narrow because the new product series has very specific and/or atypical features compared to the larger set of possible historical series.
Specification. The modeler speci-fies the attribute values or range of values associated with the new product. There may be many attributes associated with the products. In addition, the attributes may be discrete or continuous. The modeler may decide to specify values for some or all of the attributes recorded in the historical data for consideration. Let’s consider a CPG product in the carbonated soft drink (CSD) category. The modeler may want to specify common attribute and/or product specific attribute values regarding markets, channels, categories and/or brand, product group, package type, and package size. For example, it could be sold only in the United States, in the grocery and mass merchandizing channels, and is a 12-oz bottle six-pack. There may be other attributes recorded in the historical data that are not used, such as flavor or other related factors.
Analysis. After specifying the attri-butes and their values, the modeler queries the historical attribute data set for candidate products with attributes that are similar to the new product. Additionally, the number of candidate products is returned as well
as the percentage associated with each attribute. The query returns all products that satisfy the candidate profile as well as the percentage of products that have attribute values outlined in the query. Depending on the size of the historical attribute data set and the number of past new product introductions, manually identifying candidates may take a very long time. However, using a new product forecasting software package that has preprocessed the data into a readily searchable structure, we can create the query and execute in a matter of minutes resulting in hundreds of candidates.
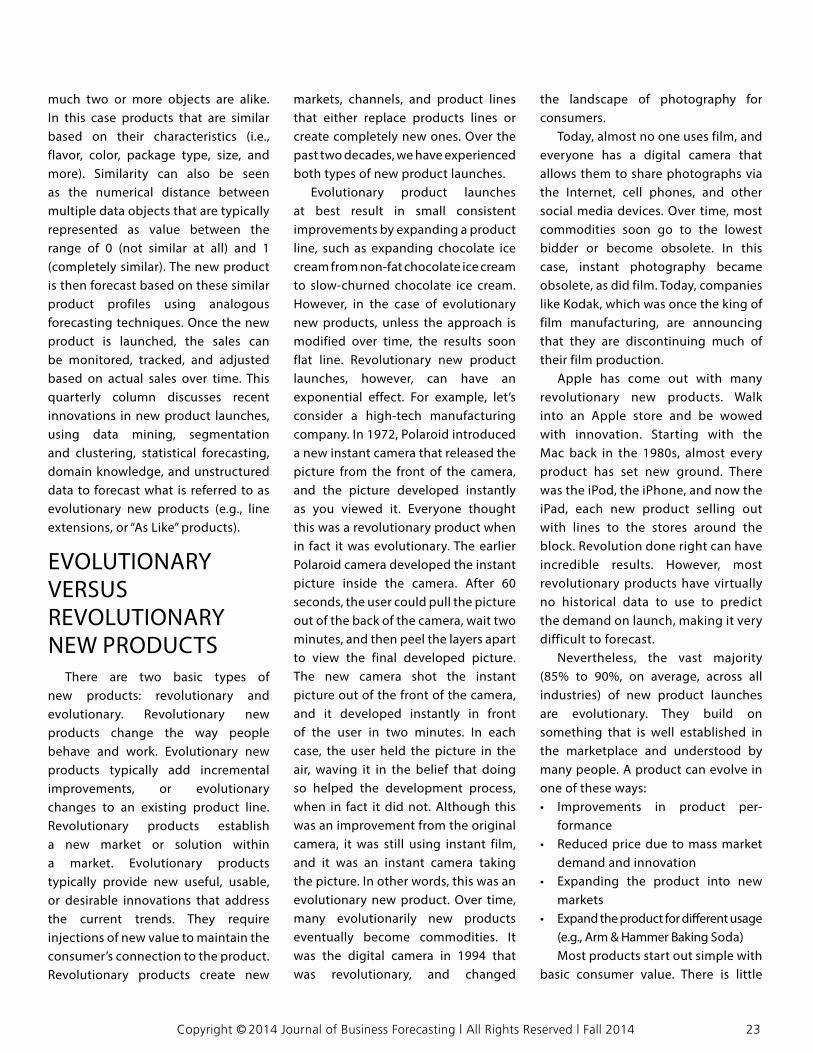
Analytic Exploration. The modeler graphically explores the set of candidate series associated with the candidate products. Figure 2 displays all the candidate (surrogate) time series for the first 20 weeks of demand after launch. The exploration process may involve transforming the set of candidate series to better understand their properties. In this example, the candidate time series have been standardized across the 20 weeks and adjusted for seasonality. Furthermore, the modeler explores the size of the sample to ensure the returned sample is sufficient. The modeler may want to explore a log transformation for the set of candidate series. The modeler may also want to explore the percentage of products associated with the package and pack size attributes.
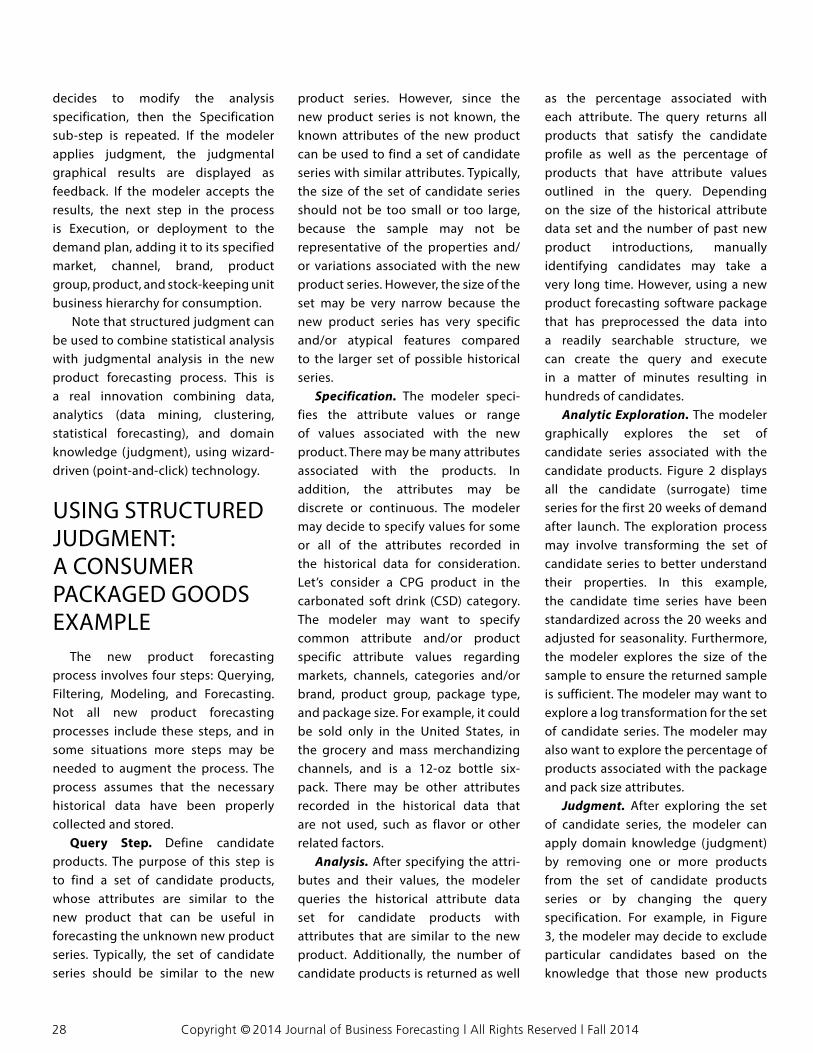
Judgment. After exploring the set of candidate series, the modeler can apply domain knowledge (judgment) by removing one or more products from the set of candidate products series or by changing the query specification. For example, in Figure 3, the modeler may decide to exclude particular candidates based on the knowledge that those new products
28 Copyright © 2014 Journal of Business Forecasting | All Rights Reserved | Fall 2014
(indicated) are special situations where those new products were not launched under the same conditions as the other candidates, and recalculate the remaining candidates, or simply decide to specify another query.
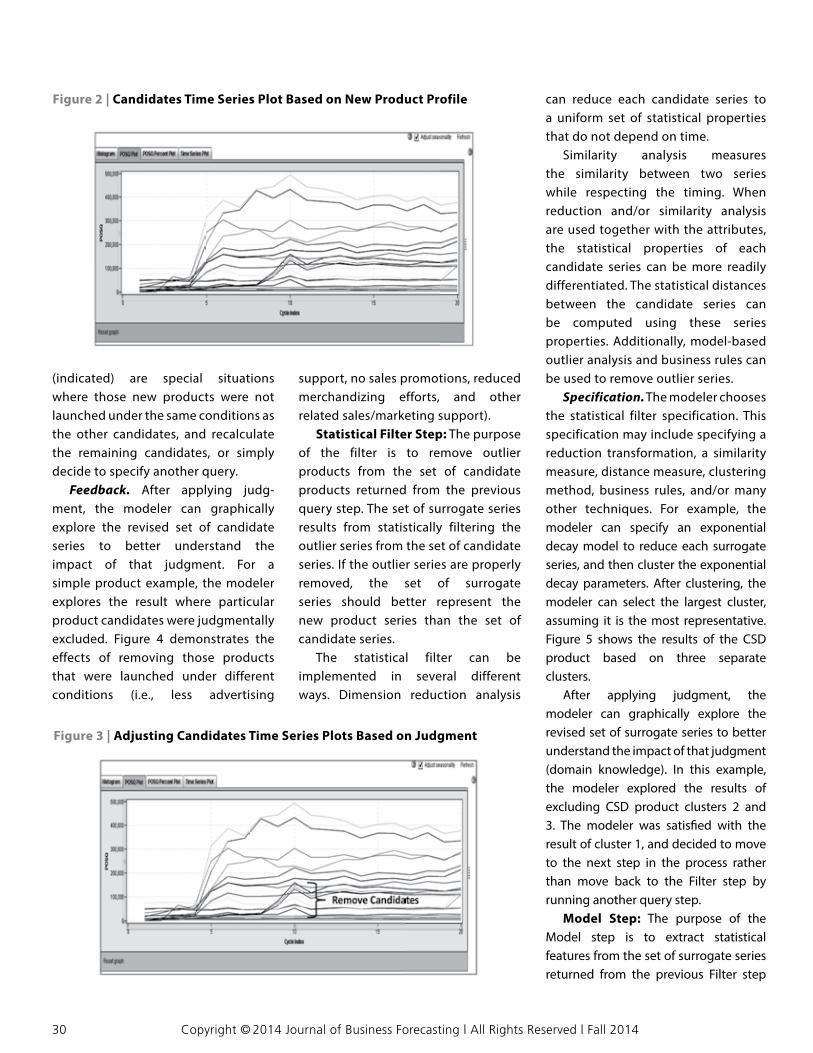
Feedback. After applying judg-ment, the modeler can graphically explore the revised set of candidate series to better understand the impact of that judgment. For a simple product example, the modeler explores the result where particular product candidates were judgmentally excluded. Figure 4 demonstrates the effects of removing those products that were launched under different conditions (i.e., less advertising
support, no sales promotions, reduced merchandizing efforts, and other related sales/marketing support).
Statistical Filter Step: The purpose of the filter is to remove outlier products from the set of candidate products returned from the previous query step. The set of surrogate series results from statistically filtering the outlier series from the set of candidate series. If the outlier series are properly removed, the set of surrogate series should better represent the new product series than the set of candidate series.
The statistical filter can be implemented in several different ways. Dimension reduction analysis
can reduce each candidate series to a uniform set of statistical properties that do not depend on time.
Similarity analysis measures the similarity between two series while respecting the timing. When reduction and/or similarity analysis are used together with the attributes, the statistical properties of each candidate series can be more readily differentiated. The statistical distances between the candidate series can be computed using these series properties. Additionally, model-based outlier analysis and business rules can be used to remove outlier series.
Specification. The modeler chooses the statistical filter specification. This specification may include specifying a reduction transformation, a similarity measure, distance measure, clustering method, business rules, and/or many other techniques. For example, the modeler can specify an exponential decay model to reduce each surrogate series, and then cluster the exponential decay parameters. After clustering, the modeler can select the largest cluster, assuming it is the most representative. Figure 5 shows the results of the CSD product based on three separate clusters.
After applying judgment, the modeler can graphically explore the revised set of surrogate series to better understand the impact of that judgment (domain knowledge). In this example, the modeler explored the results of excluding CSD product clusters 2 and 3. The modeler was satisfi ed with the result of cluster 1, and decided to move to the next step in the process rather than move back to the Filter step by running another query step.
Model Step: The purpose of the Model step is to extract statistical features from the set of surrogate series returned from the previous Filter step
Figure 3 | Adjusting Candidates Time Series Plots Based on Judgment
Figure 2 | Candidates Time Series Plot Based on New Product Profile
30 Copyright © 2014 Journal of Business Forecasting | All Rights Reserved | Fall 2014
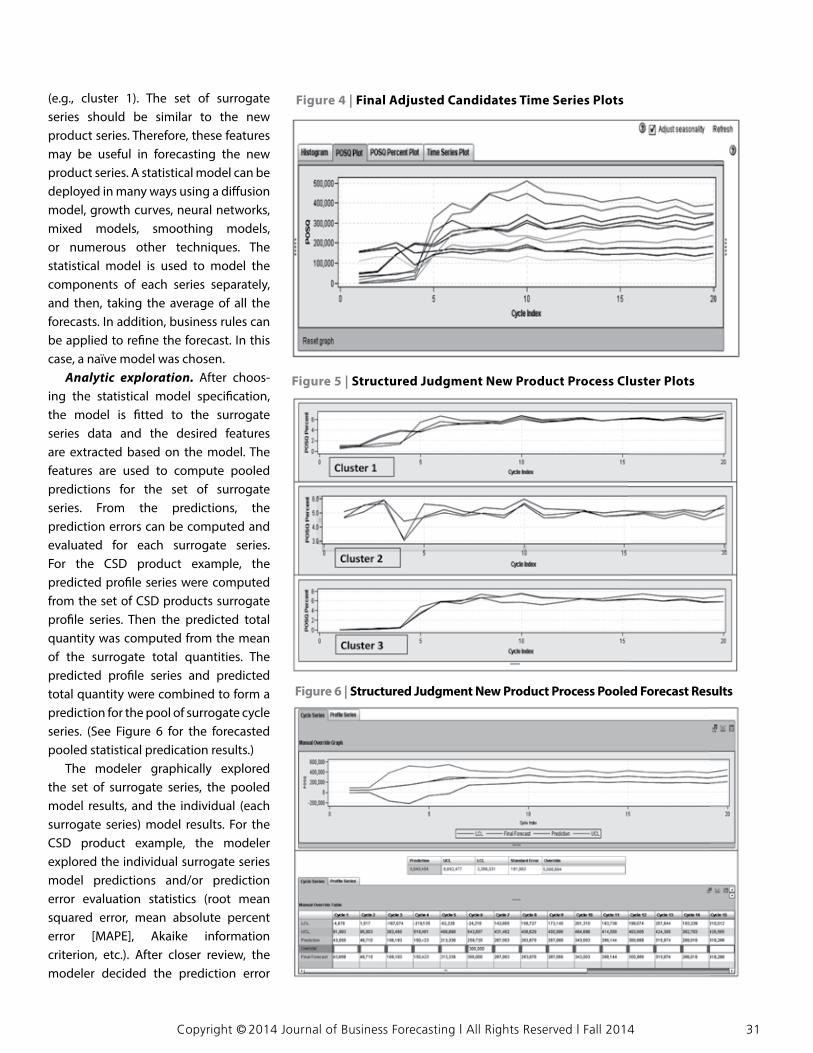
Figure 4 | Final Adjusted Candidates Time Series Plots(e.g., cluster 1). The set of surrogate series should be similar to the new product series. Therefore, these features may be useful in forecasting the new product series. A statistical model can be deployed in many ways using a diff usion model, growth curves, neural networks, mixed models, smoothing models, or numerous other techniques. The statistical model is used to model the components of each series separately, and then, taking the average of all the forecasts. In addition, business rules can be applied to refi ne the forecast. In this case, a naïve model was chosen.
Analytic exploration. After choos-ing the statistical model specifi cation, the model is fi tted to the surrogate series data and the desired features are extracted based on the model. The features are used to compute pooled predictions for the set of surrogate series. From the predictions, the prediction errors can be computed and evaluated for each surrogate series. For the CSD product example, the predicted profi le series were computed from the set of CSD products surrogate profi le series. Then the predicted total quantity was computed from the mean of the surrogate total quantities. The predicted profi le series and predicted total quantity were combined to form a prediction for the pool of surrogate cycle series. (See Figure 6 for the forecasted pooled statistical predication results.)
The modeler graphically explored the set of surrogate series, the pooled model results, and the individual (each surrogate series) model results. For the CSD product example, the modeler explored the individual surrogate series model predictions and/or prediction error evaluation statistics (root mean squared error, mean absolute percent error [MAPE], Akaike information criterion, etc.). After closer review, the modeler decided the prediction error
Figure 6 | Structured Judgment New Product Process Pooled Forecast Results
Figure 5 | Structured Judgment New Product Process Cluster Plots
Copyright © 2014 Journal of Business Forecasting | All Rights Reserved | Fall 2014 31
of CSD candidate product 3 was too high (e.g., MAPE 42%) and decided to drop this individual candidate out of the candidate pooled profile. Then the modeler remodeled and created a new forecast. It should be noted that it is not always a good idea just to exclude candidates that don’t closely fit the model. These candidates may indicate that there was a lot of variability in past new product launches. We shouldn’t expect to be able to forecast new product launches with higher accuracy after removing such candidate products. Excluding candidates may just give you false confidence in the forecast.
Forecast Step. The purpose of the Forecast step is to predict the new product series using the pooled predictions associated with the features extracted from the set of surrogate series returned from the previous Model step. In addition, since the new product forecasts are anchored to a particular time period and season, the model forecasts must be compensated for timing (point in time or season when the new product will be introduced to the marketplace).
Specification. Once the modeler chooses a forecast specification using the surrogate, a forecast can be created. The forecast specification describes the timing of the new product (conversion from the cycle index to the time index). In the case of the CSD product, the modeler can specify that the new product will be introduced in the first week of June 2013 with an official launch of July 1, which coincides with the third fiscal quarter of the year. Also, the timing of the July 4 holiday will give the product more visibility as shoppers begin to prepare for the holiday celebration. The product is being introduced early in the summer season (June), giving retailers enough time to stock their shelves prior to the official launch of July 1. The model
forecasts (cycle based) are compensated for the timing effect with the set of surrogate series.
Structured Judgment. After ex-ploring the forecasts for the new product (profile series, total quantity, and cycle series), the modeler may decide to make an override to the statistical predictions. For example, the modeler can make an override to the forecast either at the total quantity level and have it allocated seasonally across the 20 weeks or make an override for any individual week (cycle). The modeler decides (based on domain knowledge) to make an override of 300,000 units in week 6, as the sales and marketing teams plan to support the launch with a sales promotion and new advertising campaign.
Companies continue to admit that other techniques for new product launch forecasts remain a challenge, with many identifying attribute-based forecasting as an area requiring more improvement. In my experience, com panies typically rely on different approaches for determining patterns for new product launches. The most basic but most useful approach to implement is attribute-based forecasting using like-item logic that attempts to compare the new product to an existing one. The most useful approach to the new product forecasting process uses statistical testing to examine the validity of available attributes and construct statistical analysis to create a baseline estimate of new product demand. All the techniques have seen limited adoption because of the initial setup work required to identify significant attributes and the lack of enabling technology to provide a structured approach.
This new innovative approach to new product forecasting, called, “Structured Judgment,” combines data analytics, domain knowledge, and
technology to create more accurate new product forecasts. It has been proven to improve the accuracy of new product forecasts by as much as 15%, while reducing cycle times from days to hours.
COMPLEMENTING STRUCTURED JUDGMENT WITH SENTIMENT ANALYSIS
The technology revolution has provided a wealth of data that has created live streaming information in real time with minimal latency. In fact, “big data” is the result of ever increasing data that is being captured by the minute. However, much of that information is what is referred to as unstructured data, which refers to information that doesn’t reside in a traditional row-column database. As you might expect, it’s the opposite of structured data—the data stored in fields in a database. Unstructured data files often include text and multimedia content. Examples include e-mail messages, word processing documents, videos, photos, audio files, presentations, webpages, tweets, Facebook posts, and many other kinds of business and personal information. Note that while these sorts of files may have an internal structure, they are still considered “unstructured” because the data they contain don’t fit neatly in a database. Experts estimate that 80% to 90% of the data in any organization is unstructured. And the amount of unstructured data in enterprises is growing significantly—often many times faster than structured databases are growing.
Most organizations believe that their unstructured databases include information that could help them make better business decisions.
32 Copyright © 2014 Journal of Business Forecasting | All Rights Reserved | Fall 2014
Unfortunately, it’s often very diffi cult to analyze unstructured data. To help with a particular business problem, organizations have turned to a number of diff erent software solutions designed to search unstructured data and extract important information. The primary benefi t of these tools is the ability to gather actionable information that can help a business succeed in a competitive environment. One of the most eff ective uses of unstructured data is analyzed using “sentiment analysis” to support new product launches. Sentiment analysis (also known as opinion mining) refers to the use of natural language process, test mining, and computations to identify and extract subjective information from source materials (i.e., tweets, Facebook posts, Internet blogs, and others).
Generally speaking, sentiment analysis aims to determine the attitude of a speaker or a writer with respect to some topics or the overall contextual divergence of information. The attitude may be his or her judgment or evaluation of a new product purchased and how it was accepted by consumers (that is to say, did they like the product overall, did they like the price, quality, sales promotion, advertising, and other related attributes) or did it evoke the intended emotional communication (that is to say, will they buy it again).
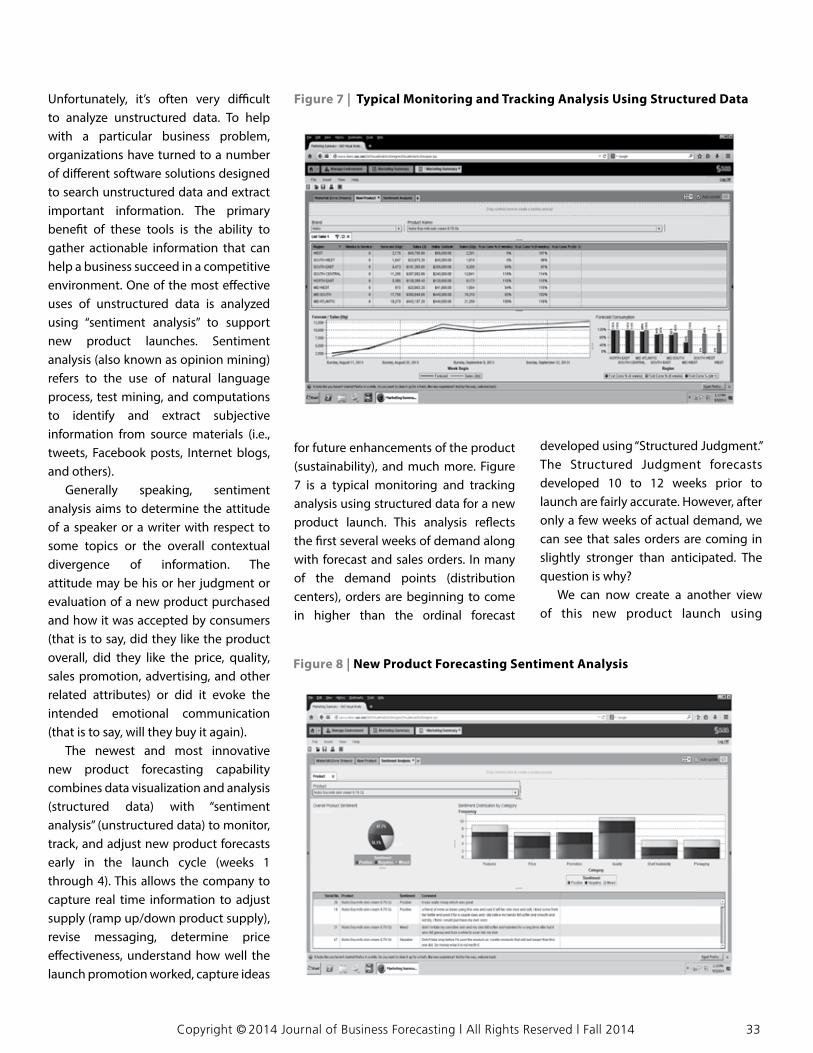
The newest and most innovative new product forecasting capability combines data visualization and analysis (structured data) with “sentiment analysis” (unstructured data) to monitor, track, and adjust new product forecasts early in the launch cycle (weeks 1 through 4). This allows the company to capture real time information to adjust supply (ramp up/down product supply), revise messaging, determine price eff ectiveness, understand how well the launch promotion worked, capture ideas
for future enhancements of the product (sustainability), and much more. Figure 7 is a typical monitoring and tracking analysis using structured data for a new product launch. This analysis refl ects the fi rst several weeks of demand along with forecast and sales orders. In many of the demand points (distribution centers), orders are beginning to come in higher than the ordinal forecast
developed using “Structured Judgment.” The Structured Judgment forecasts developed 10 to 12 weeks prior to launch are fairly accurate. However, after only a few weeks of actual demand, we can see that sales orders are coming in slightly stronger than anticipated. The question is why?
We can now create a another view of this new product launch using
Figure 7 | Typical Monitoring and Tracking Analysis Using Structured Data
Figure 8 | New Product Forecasting Sentiment Analysis
Copyright © 2014 Journal of Business Forecasting | All Rights Reserved | Fall 2014 33

“Sentiment Analysis” to determine why orders are coming in stronger than originally projected for this new product called “Nutro Soy Milk Skin Cream, 6.76 oz.”
Figure 8 is the sentiment analysis that is representing using text mining technology to crawl the Internet to capture what consumers who purchased this new product are saying about it. The unstructured data are a combination of tweets, Facebook posts, and other related web generated information.
The results of the sentiment analysis indicate that 47.7% of those consumers who purchased this new product liked it, and 34.1% didn’t like it with the remaining 18.2% mixed. Of those who used the product, 60% liked the featured ads in retailers’ circulars, over 60% liked the quality, and 40% liked the sales promotion. Only 25% liked the price, so there is a pricing concern; possibly we should run another promotion with a feature ad in the retailers’ circulars. Also, shelf availability is low, which means the sales organization needs to do a better job gaining shelf acceptance by retailers. Finally, the packaging was not reviewed very well, so marketing needs to make some changes to the packaging in the future. The real benefi ts are the actual consumer comments at the bottom of the analysis that can be used for making adjustments to the price, packaging, sales promotions, and other related future
enhances for sustainability purposes.
SUMMARYA structured analogy approach can be
useful in many situations, but certainly not for all new product forecasting. This structured judgment approach attempts to improve on human judgment alone by automating the historical data handling and incorporating statistical analysis. A structured analogy software package designed for conducting structured judgmental new product forecasts can make it possible to quickly extract candidate products based on the user-specifi ed attribute criteria. It will help align, scale, and cluster the historical patterns automatically, providing an easy-to-understand visualization of past new product behavior. This visualization capability will help the modeler realize the risks, uncertainties, and variability in new product behavior, so the organization can make the appropriate decisions based on the uncertainties of new product launches.
The use of text analytics in real-world applications is growing very fast as organizations realize the untapped potential that is possible if unstructured data are analyzed and integrated into decision making. The field of text analytics will likely continue to grow given the exponential growth of unstructured
data both within and outside the organizations. The breadth of text analytics applications also continues to expand across industries; it never ceases to amaze me how many interesting applications are continuing to surface each day. Analyzing trends on social media can be a powerful exercise to gauge how well your new product launch is going early in the product life cycle to determine if the improved service or innovative idea has captured consumer interest. This type of analysis can give some insights on whether your initiative has had any impact on consumer demand.
RECOMMENDATIONS• Focus on collaboration between
supply chain and the commercial organizations; including Sales, Mar-keting, and Product Develop ment during the new product launch to ensure that the Supply Chain is consulted on pertinent decisions.
• Assess your predictive analytics capabilities to conduct attribute-based modeling and mine unstructured demand signals for additional patterns.
• Collect and leverage internal and external demand signals immediately after launch to refi ne the demand forecast, as well as sales/marketing investment strategies. ([email protected])
REFERENCES1. Chase, Jr., Charles W. Demand-Driven
Forecasting: A Structured Approach to
Forecasting. New York: John Wiley and
Sons. 2013, pp. 283-316.
2. Leonard, Michael, Michele Trovero, Thomas
Dickey, Samuel Guseman, and Robert
Celestino. “New Product Forecasting
Process: Combining Statistics and
Judgment.” SAS Institute Inc., April 2007.
Add to your credentials and get recognized by becoming an author for the recognized by becoming an author for the Journal of business Forecasting (JBF)
For information, contact our Chief EditorFor information, contact our Chief EditorDr. chaman l. Jain | email: [email protected]. chaman l. Jain | email: [email protected]
Write an Article for the JBF!
34 Copyright © 2014 Journal of Business Forecasting | All Rights Reserved | Fall 2014
SAS and all other SAS Institute Inc. product or service names are registered trademarks or trademarks of SAS Institute Inc. in the USA and other countries. ® indicates USA registration. Other brand and product names are trademarks of their respective companies. © 2011 SAS Institute Inc. All rights reserved. S72398US.0511
ANALYTICSAvoid wasting time and money.
SAS® Forecasting software helps your business optimize process automation and ef� ciency, so you can diagnose the past, test scenarios for the present, and plan effectively for the future. Decide with con� dence.
sas.com/forecastfor a free book
ANALYTICS
PRSRTSTD
U.S. Postage
PAID
Birmingham, AL
Permit No. 394
J o u r n a l o f
Business ForecastinG350 Northern Blvd. | Suite 203Great Neck NY 11021 USA
Phone: +1.516.504.7576Email: [email protected]: ibf.org
POSTMASTER:
PLEASE RUSH! CONTAINS DATED MATERIAL
3 Types of IBF Certifi cation
Certifi ed Professional Forecaster (CPF)
Advanced Certifi ed Professional Forecaster (ACPF)
Certifi ed Professional Forecasting Candidate (CPFC) | For Students & New Practitioners
FOR FURTHER INFORMATION & EXAM DATES VISIT: www.ibf.org/certifi cation.cfm OR CALL US: +1.516.504.7576
Demand Planning, Forecasting, & S&OP Certifi cation ProgramBecome a CPF Certifi ed Professional Forecaster
“ The reason I wanted IBF certification was to give me more knowledge about the forecasting area... It has helped me tremendously, not only with just being knowledgeable about the forecasting & planning area and best practices, but it also helped show other people that I am knowledgeable about what I am doing... It helped me not only to land the job, but get the compensation that I was looking for. Estee Lauder felt, given the fact I took the time to study and get certified meant that I really knew what I was doing. That made me more confident to take on a role and it made me feel I was working for a company that really understood what forecasting was all about.”
– Keyamma GarnesDirector of Demand Planning, ESTEE LAUDER
• Master Demand Planning, Forecasting, and S&OP
• Prepare for Today’s Rapidly Changing Marketplace
• Expand Your Career Opportunities
• Improve Your Leadership Opportunities & Job Security
• Build Credibility for Your Forecasting & Planning Organization
• Become a Catalyst for Change
• Update Your Supply Chain Education & Certifications with IBF
Companies with CPF or ACPF (partial list):
3MAlberto CulverAltria/ Phillip MorrisAOLAppleAstraZenecaAvedaBASFBaxter HealthcareBayerBehrBest BuyBoeingBoschBrown FormanCarharttCaterpillar
ChevronCisco SystemsCoca-ColaContinental TireCorning Coty, Inc.CumminsDealer TireDeltaDisneyRubbermaidDow CorningDr. Pepper SnappleDuPontE & J Gallo Winery FedExFruit of the LoomFuji Film Gap
GE General MillsGeorgia PacificGlaxoSmithKlineGoodyearHanes BrandsHarley-Davidson Motor CompanyHeineken HeinzHewlett PackardHollisterIngersoll-Rand CompanyIntuitJohn DeereJohnson & JohnsonKomatsu
Lilly McCormick & CoMead JohnsonMerrill LynchMichelinMicrosoftMonster Cable CorporationMotorola Mobility/ GoogleNavistar PartsNeiman MarcusNestle NikeNovartis OnStarOracle CorporationPanasonic Pepsi