Onkal International Journal of Forecasting
47
Northumbria Research Link Citation: Önkal, Dilek, Sinan Gönül, M., Goodwin, Paul, Thomson, Mary and Öz, Esra (2017) Evaluating expert advice in forecasting: Users’ reactions to presumed vs. experienced credibility. International Journal of Forecasting, 33 (1). pp. 280-297. ISSN 0169-2070 Published by: Elsevier URL: https://doi.org/10.1016/j.ijforecast.2015.12.009 <https://doi.org/10.1016/j.ijforecast.2015.12.009> This version was downloaded from Northumbria Research Link: http://nrl.northumbria.ac.uk/id/eprint/26764/ Northumbria University has developed Northumbria Research Link (NRL) to enable users to access the University’s research output. Copyright © and moral rights for items on NRL are retained by the individual author(s) and/or other copyright owners. Single copies of full items can be reproduced, displayed or performed, and given to third parties in any format or medium for personal research or study, educational, or not-for-profit purposes without prior permission or charge, provided the authors, title and full bibliographic details are given, as well as a hyperlink and/or URL to the original metadata page. The content must not be changed in any way. Full items must not be sold commercially in any format or medium without formal permission of the copyright holder. The full policy is available online: http://nrl.northumbria.ac.uk/policies.html This document may differ from the final, published version of the research and has been made available online in accordance with publisher policies. To read and/or cite from the published version of the research, please visit the publisher’s website (a subscription may be required.)
Transcript of Onkal International Journal of Forecasting

Northumbria Research Link
Citation: Önkal, Dilek, Sinan Gönül, M., Goodwin, Paul, Thomson, Mary and Öz, Esra(2017) Evaluating expert advice in forecasting: Users’ reactions to presumed vs.experienced credibility. International Journal of Forecasting, 33 (1). pp. 280-297. ISSN0169-2070
Published by: Elsevier
URL: https://doi.org/10.1016/j.ijforecast.2015.12.009<https://doi.org/10.1016/j.ijforecast.2015.12.009>
This version was downloaded from Northumbria Research Link:http://nrl.northumbria.ac.uk/id/eprint/26764/
Northumbria University has developed Northumbria Research Link (NRL) to enable usersto access the University’s research output. Copyright © and moral rights for items onNRL are retained by the individual author(s) and/or other copyright owners. Single copiesof full items can be reproduced, displayed or performed, and given to third parties in anyformat or medium for personal research or study, educational, or not-for-profit purposeswithout prior permission or charge, provided the authors, title and full bibliographicdetails are given, as well as a hyperlink and/or URL to the original metadata page. Thecontent must not be changed in any way. Full items must not be sold commercially in anyformat or medium without formal permission of the copyright holder. The full policy isavailable online: http://nrl.northumbria.ac.uk/policies.html
This document may differ from the final, published version of the research and has beenmade available online in accordance with publisher policies. To read and/or cite from thepublished version of the research, please visit the publisher’s website (a subscriptionmay be required.)

Evaluating expert advice in forecasting: users’ reactions to presumed vs.
experienced credibility
Dilek Önkal Bilkent University
Faculty of Business Administration 06800 Ankara, Turkey [email protected]
M. Sinan Gönül Department of Business Administration
Middle East Technical University 06800 Çankaya Ankara Turkey
Paul Goodwin School of Management
University of Bath Bath BA2 7AY
Mary Thomson Newcastle Business School
Northumbria University
Esra Öz Bilkent University
Faculty of Business Administration 06800 Ankara, Turkey

Evaluating expert advice in forecasting: users’ reactions to presumed vs.
experienced credibility
Abstract
In expert knowledge elicitation (EKE) for forecasting, the perceived credibility of an expert is
likely to affect the weighting attached to their advice. Four experiments have investigated
the extent to which the implicit weighting depends on the advisor’s experienced (reflecting
the accuracy of their past forecasts), or presumed (based on their status) credibility.
Compared to a control group, advice from a source with a high experienced credibility
received a greater weighting, but having a low level of experienced credibility did not reduce
the weighting. In contrast, a high presumed credibility did not increase the weighting relative
to a control group, while a low presumed credibility decreased it. When there were
opportunities for the two types of credibility to interact, a high experienced credibility tended
to eclipse the presumed credibility if the advisees were non-experts. However, when the
advisees were professionals, both the presumed and experienced credibility of the advisor
were influential in determining the weight attached to the advice.
KEY WORDS: source credibility; presumed credibility; experienced credibility; advice; forecasting; information use.

1. Introduction
The incorporation of experts’ knowledge and judgments into forecasting processes poses a
number of challenges, many of which are known to researchers who are seeking to improve
expert knowledge elicitation (EKE) methods (e.g., Aspinall, 2010; Bolger & Rowe, 2014,
2015; Budnitz et al, 1995; Cooke, 1991; Goodwin & Wright, 2014; Meyer & Booker, 1991;
Morgan, 2014; Morgan & Henrion, 1990). One of these challenges is the need to assess the
extent to which credence should be attached to an expert’s forecasts. Concerns like this are
relevant to the stages of EKE that involve the selection of experts, and to the subsequent
aggregation of their judgments when multiple experts are available. For example, either
implicit or explicit differential weights may be attached to individual experts’ judgments,
depending on assessments of the probable accuracy of their forecasts. Errors made at either
the selection or aggregation stages have the potential to harm the forecast accuracy. This
raises the question of what determines the level of credibility that is associated with an
expert’s forecast.
This paper investigates the extent to which two attributes of experts – their track
record of accuracy and their apparent status – influence the credibility of their forecasts. It
does so by measuring how much either non-experts or other experts revise their own
forecasts after they have received an advisor’s forecasts. Specifically, we investigate the
influences of two types of credibility: the expert’s track record as recalled by advisees (which
we term ‘experienced credibility’) and the expert’s status (which we term ‘presumed
credibility’). Our paper complements the work of Sah, Moore, and MacCoun (2013), who
looked at the extent to which an advisor’s track record and their confidence in their advice
influenced opinion revision. The issues of presumed status and track records are also
important because, as Armstrong suggested in his “seer sucker” theory, people are often

motivated to pay large sums for forecasts elicited from people labeled ‘experts’, even when
their forecasting accuracy is poor (Armstrong, 1980).
2. Relevant literature
Judgmental forecasts provided by experts are often used to inform people who are forming
their own opinions of how the future will unfold (Gönül, Önkal & Lawrence, 2006). The
domain of stock price forecasting is a prime example, being a field where a multi-billion
dollar industry exists, comprising both forecast providers and forecast users. This field
contains a great deal of uncertainty, and choosing a relatively inaccurate advisor can have
serious repercussions, particularly for investments such as retirement savings. Accordingly,
the credibility of the source of advice is likely to be of paramount importance; but how does
source credibility influence a user’s assessment of possible future stock prices? Do
experienced and presumed credibility impinge on these assessments to different degrees, and
what happens when these determinants yield conflicting indications of credibility?
Source credibility is an area of active research in many disciplines, including
psychology, business, marketing, finance, risk communication, and information and health
sciences (e.g., Berry & Shields, 2014; Chen & Tan, 2013; Gönül, Önkal & Goodwin, 2009;
Sah et al., 2013; Willemsen, Neijens & Bronner, 2012; Xie, Miao, Kuo, & Lee, 2011).
Expertise is argued to constitute a critical dimension of source credibility (e.g., Kelman &
Hovland, 1953). In fact, users have been shown to prefer ‘expert forecasts’ over ‘computer-
generated forecasts,’ even when they had no information about either the experts or the
statistical models generating these (actually identical) predictions (Önkal, Goodwin,
Thomson, Gönül, & Pollock, 2009).
In most situations, the greater the perceived expertise of the source of advice, the more
persuasive the advice will be (Hovland & Weiss, 1951; Johnson & Izzett, 1969; Kelman &
Hovland, 1953; Lirtzman & Shuv-Ami, 1986; McKnight & Kacmar, 2007; Pornpitakpan,

2004; Tormala & Clarkson, 2007). Furthermore, sources with high credibility have been
found to be more persuasive than those with low credibility (e.g., Rhine & Severance, 1970),
although there have been contrary findings (e.g., Dholakia, 1986; Dholakia & Strenthal,
1977).
The suggested link between the credibility of a source of advice and the resultant
change in an advisee’s attitudes and judgments is also acknowledged by research on advice-
taking (e.g. Yaniv, 2004; Bonaccio & Dalal, 2006; See et al., 2011; Sah et al., 2013). Van
Swol and Sniezek (2005) investigated five factors that may affect the acceptance of advice:
advisor confidence, advisor accuracy, the advisee’s trust in the advisor, the advisee’s prior
relationship with the advisor, and the advisee’s power to pay for the advisor’s
recommendations. Of these five factors, advisor confidence was found to have the most
significant impact. An advisor’s recommendations are more likely to be accepted if he/she
has confidence in them. However, if feedback on advisor accuracy is also available, that cue
will dominate, so that confident but inaccurate advisors will be perceived to be less credible
(Sah et al., 2013).
Surprisingly little research has focused on the different forms of credibility and the
potential interactions between them. One form is presumed credibility (Harvey & Fischer,
1997; Tseng & Fogg, 1999; Harvey, Harries & Fischer, 2000; Soll & Larrick, 2009; Bonaccio
& Dalal, 2010), which is based on stereotypes and assumptions about the source of the
advice. For instance, we may assume that a financial advisor will understand more about
stocks and shares than, say, a taxi driver. Experienced credibility, on the other hand, is based
on direct experience of the advisor, and results from interactions with them over time (Lim &
O’Connor, 1995; Tseng & Fogg, 1999; Soll & Mannes, 2011). For example, financial
advisors who have proved to be highly proficient in the past should eventually attain high
credibility in the minds of their clients.

Previous studies that have investigated advisor credibility have involved general
judgment tasks such as quizzes on computer knowledge (e.g., Sniezek & Van Swol, 2001;
Van Swol & Sniezek, 2005), movie reviews (e.g., Van Swol, 2011), historical events/almanac
items (e.g., Yaniv & Kleinberger, 2000; Yaniv, 2004), estimating alumni salaries (e.g., Soll &
Larrick, 2009; Bonaccio & Dalal, 2010), predicting the outcomes of sports events (e.g., Soll
& Mannes, 2011), and even estimating people’s weights from photographs (e.g., Sah et al.,
2013).
To add to this literature, we examine the specific influences of presumed and
experienced credibility, both separately and jointly, on advisees – who may be either non-
expert or expert – who are faced with the task of forecasting stock market prices. Two
experiments were used to investigate the effects of high and low presumed and experienced
credibility, separately, on the extent to which forecasting advice is influential. Our third and
fourth experiments then investigated the effects of their interactions on non-experts and
professionals, respectively. For example, how influential is advice when it is associated with
high presumed but low experienced credibility? The influence of the advisor was measured
by the extent to which people changed their initial forecasts in the light of the advice. The
next sections describe the designs and results of these studies. This is followed by an overall
discussion which considers the implications of the findings and provides suggestions for
future research.
3. Experiment 1 – experienced credibility
Some researchers have argued that experienced credibility is the most complex and reliable
way of making credibility judgments (Fogg, 1999; Tseng & Fogg, 1999; Wathern &
Burknell, 2002), and indeed, there is considerable evidence that the accuracy of prior stock
price forecasts is a key element of provider credibility (e.g., Hirst, Koonce, & Miller, 1999;
Lev & Penman, 1990). However, of necessity, experienced credibility can only be based on a

sample of the source’s forecasts, and, in stock market forecasting, it is possible for a short run
of highly accurate forecasts, achieved through luck rather than skill, to lead to an inflated
perception of the source’s credibility (Taleb, 2004). Thus, a high experienced credibility is
likely to be associated with a record of a high accuracy over the forecasts in the sample.
However, in the evaluation of the source’s credibility, recent forecast errors may be
overemphasized at the expense of the general performance. Nevertheless, we arrive at the
following hypothesis.
H1: Advice from a source with a high experienced credibility will have more influence on
user adjustments than advice from a source with a low experienced credibility, which, in turn,
will have more influence than advice from a source where the user has no such accuracy
experience.
Details of the experiment that we designed to test this hypothesis are given below.
3.1 Participants
The participants were 107 undergraduate business administration students who were taking a
business forecasting course at Bilkent University.1 Participation led to extra credit points; no
monetary incentives were given.
3.2 Design and procedure
Specially designed software based on the VBA (Visual Basic for Applications) platform was
used to administer the experiment. The software presented the participants with time series
plots for the weekly closing prices of 25 stocks. These stock prices belonged to real firms,
and were drawn from the ISE50 (Istanbul Stock Exchange) index, all from the same time
periods. Each time series plot displayed 30 weeks of past data. The participants were
1 The various experiments reported in current study were conducted with different participants. All three groups had similar gender breakdowns (with 45–52% of participants being female) and age compositions (the mean age was 22, with a range of 21–23).

informed that these were real stock price series, but the stock names were undisclosed and the
time periods concealed in order to prevent framing and extra information effects. The order
that the time series were presented to the participants was random.
The initial 12 stocks were used for building experience. For these series, in addition to
stock price data, the participants were also provided with forecasting advice in the form of a
point forecast and a 90% prediction interval for the price of the stock in the 31st week,
together with the actual observed price. During this stage, the participants were only required
to examine the time series graph, with the provided advice and the realized outcomes (all
plotted on the one graph), so that they could build their experience about the accuracy, and
hence, the experienced credibility, of the forecasting source. A sample screenshot for this
phase is attached in Appendix A. There were three experimental conditions, based on the
nature of the forecasting advice:
1. The high experienced credibility group (n = 38): For the initial 12 experience-
building series, the forecasting advice given to this group was highly accurate. The
advice was generated statistically, and the error levels were set to have mean absolute
percentage errors (MAPE) of 2.94% for the point forecasts and hit rates of 10/12
(83.3%) for the prediction intervals.
2. The low experienced credibility group (n = 34): The forecasting advice observed over
the initial 12 experience-building series was relatively inaccurate. The error levels
were set to have MAPEs of 14.94% for the point forecasts and hit rates of 2/12
(16.7%) for the intervals.
3. The control group – no forecasting advice (n = 35): The participants in this group did
not receive any forecast advice during the initial phase (to avoid building any
experience about the accuracy of the forecasting source). Thus, for the initial series,
these participants were only shown the time series plots and the realized outcomes.

Once these 12 series had been displayed, a single window appeared (for the high and low
experienced credibility groups only, not for the control group) and summarized the overall
performances of the forecasting advice provided. Next, a practice time series was provided, to
help the participants to get used to the interface. Following the practice series, 12 new stock
price series were displayed. In this phase, for each of the 12 stocks:
i. The participants were asked to make a one-period-ahead point forecast for the
stock’s closing price in week 31, with a 90% prediction interval. These forecasts
constituted the participants’ initial predictions.
ii. They were then provided with forecasting advice, in the form of a point forecast
and a 90% prediction interval. Note that all groups received exactly the same
advice in this second phase. The accuracy level of the advice provided was set
approximately midway between the high and low credibility levels (MAPEs of
9.10% for the point forecasts and hit rates of 50% for the interval forecasts). The
participants were not aware of this, as they were never shown the realized
outcomes from this phase.
iii. The participants were then requested to examine the forecasts provided, and to
revise their initial forecasts if they considered this necessary. A sample screenshot
from this phase is provided in Appendix A.
Before each experimental session, the instructions were discussed and detailed
examples of the use of the software were provided. At the end, each participant was presented
with a wrap-up questionnaire.
3.3 Performance measures
For each of the experiments here, two sets of results are reported. The first set reports the
judgmental adjustments applied to the initial forecasts (both point and interval predictions)

for each source credibility condition. The second set reports the findings on advice
utilization.
3.3.1 Judgmental adjustments of the initial forecasts
One would expect a direct link between the influence of the forecasting source and the
judgmental adjustments applied by the participants to their initial forecasts. If the advice
coming from the forecasting source is perceived to be persuasive, then, in general, the
adjustments to the initial predictions would be expected to be larger and more frequent for a
more credible source.
The frequency of adjustment was measured by the percentage of the initial point and
interval forecasts that were modified. An alteration to at least one of the upper or lower
bounds of an interval forecast was counted as an adjustment. The sizes of these adjustments
were assessed by using different measures for point and interval predictions. The measures
used are summarized in Table 1.
Table 1: Judgmental adjustment measures.
Frequency of adjustments
Size/magnitude of adjustments
Point forecasts % of initial point forecasts adjusted
AAP absolute adjustment in
point forecasts
APAP absolute % adjustment in
point forecasts Interval forecasts
% of initial interval forecasts adjusted
SAA sum of absolute
adjustments on interval bounds
APAI absolute % adjustment in
interval forecast width
The AAP and SAA measures were used by Goodwin, Önkal & Gönül (2013). The
APAP and APAI measures have been used in many previous studies (e.g., Gönül et al., 2006;
Önkal, Gönül & Lawrence, 2008), and were chosen to complement the AAP and SAA scores
by providing scale-free measurements. All of these scores receive the typical value of ‘0’
when the initial forecasts remain unadjusted. The formulae used to calculate these four
measures are as follows:

𝐴𝐴𝐴𝐴𝐴𝐴 = |adjusted point forecast − initial point forecast | (1)
𝑆𝑆𝐴𝐴𝐴𝐴 = |adjusted upper bound − initial upper bound | + |adjusted lower bound − initial lower bound | (2)
𝐴𝐴𝐴𝐴𝐴𝐴𝐴𝐴 = |adjusted point forecast −initial point forecast | × 100 (3)
initial point forecast
𝐴𝐴𝐴𝐴𝐴𝐴𝐴𝐴 = |adjusted interval width −initial interval width | × 100. (4) initial interval width
3.3.2 Advice utilization
Three scores for measuring the adoption of advice have been suggested in the literature
(Harvey & Fischer, 1997; Yaniv & Kleinberger, 2000; Yaniv, 2004; Bonaccio & Dalal,
2006). All of these scores measure the extent to which advice is used by considering how the
final point forecast is situated relative to the initial point forecast and the point forecast
provided.
The three scores are as follows.
i) Advice-shift 𝐴𝐴𝐴𝐴𝐴𝐴𝐴𝐴𝐴𝐴𝐴𝐴 𝑠𝑠ℎ𝐴𝐴𝑖𝑖𝑖𝑖 = adjusted point forecast − initial point forecast . (5)
provided point forecast − initial point forecast
In its standard form, this score, which was proposed by Harvey and Fischer (1997), has a
value between 0 and 1. A score of 0 represents perfect discounting of the advice (i.e., the
adjusted point forecast is equal to the initial point forecast, meaning that the advice provided
has no impact on the forecaster), while a score of 1 represents perfect utilization (i.e., the
adjusted point forecast is equal to the point forecast provided). A score that is smaller than
0.5 indicates that the final forecast is closer to the initial forecast, while a score over 0.5
indicates that it is closer to the prediction provided. One disadvantage of this measure is the
implicit assumption that the adjusted forecast should reside somewhere between the initial
forecast and the advice provided. Negative values or scores greater than one are often
considered “extraordinary” cases (Bonaccio & Dalal, 2006).

ii) Weight-of-advice (WoA) 𝑊𝑊𝑊𝑊𝐴𝐴 = |𝑎𝑎𝐴𝐴𝑎𝑎𝑎𝑎𝑠𝑠𝑖𝑖𝐴𝐴𝐴𝐴 𝑝𝑝𝑊𝑊𝐴𝐴𝑝𝑝𝑖𝑖 𝑖𝑖𝑊𝑊𝑓𝑓𝐴𝐴𝐴𝐴𝑎𝑎𝑠𝑠𝑖𝑖 − 𝐴𝐴𝑝𝑝𝐴𝐴𝑖𝑖𝐴𝐴𝑎𝑎𝑖𝑖 𝑝𝑝𝑊𝑊𝐴𝐴𝑝𝑝𝑖𝑖 𝑖𝑖𝑊𝑊𝑓𝑓𝐴𝐴𝐴𝐴𝑎𝑎𝑠𝑠𝑖𝑖| . (6)
|𝑝𝑝𝑓𝑓𝑊𝑊𝐴𝐴𝐴𝐴𝐴𝐴𝐴𝐴𝐴𝐴 𝑝𝑝𝑊𝑊𝐴𝐴𝑝𝑝𝑖𝑖 𝑖𝑖𝑊𝑊𝑓𝑓𝐴𝐴𝐴𝐴𝑎𝑎𝑠𝑠𝑖𝑖 − 𝐴𝐴𝑝𝑝𝐴𝐴𝑖𝑖𝐴𝐴𝑎𝑎𝑖𝑖 𝑝𝑝𝑊𝑊𝐴𝐴𝑝𝑝𝑖𝑖 𝑖𝑖𝑊𝑊𝑓𝑓𝐴𝐴𝐴𝐴𝑎𝑎𝑠𝑠𝑖𝑖|
The WoA measure was developed by Yaniv (2004), and is, in fact, simply the advice shift
score with absolute values of the numerator and denominator. The possible scores and their
interpretations are very similar to those of the former measure, with the exception that WoA
can never yield negative values. Thus, extraordinary cases occur only when the score is
greater than one.
iii) Weight-of-own estimate (WoE)
𝑊𝑊𝑊𝑊𝑊𝑊 = |𝑝𝑝𝑓𝑓𝑊𝑊𝐴𝐴𝐴𝐴𝐴𝐴𝐴𝐴𝐴𝐴 𝑝𝑝𝑊𝑊𝐴𝐴𝑝𝑝𝑖𝑖 𝑖𝑖𝑊𝑊𝑓𝑓𝐴𝐴𝐴𝐴𝑎𝑎𝑠𝑠𝑖𝑖 − 𝑎𝑎𝐴𝐴𝑎𝑎𝑎𝑎𝑠𝑠𝑖𝑖𝐴𝐴𝐴𝐴 𝑝𝑝𝑊𝑊𝐴𝐴𝑝𝑝𝑖𝑖 𝑖𝑖𝑊𝑊𝑓𝑓𝐴𝐴𝐴𝐴𝑎𝑎𝑠𝑠𝑖𝑖| . (7) |𝑝𝑝𝑓𝑓𝑊𝑊𝐴𝐴𝐴𝐴𝐴𝐴𝐴𝐴𝐴𝐴 𝑝𝑝𝑊𝑊𝐴𝐴𝑝𝑝𝑖𝑖 𝑖𝑖𝑊𝑊𝑓𝑓𝐴𝐴𝐴𝐴𝑎𝑎𝑠𝑠𝑖𝑖 − 𝐴𝐴𝑝𝑝𝐴𝐴𝑖𝑖𝐴𝐴𝑎𝑎𝑖𝑖 𝑝𝑝𝑊𝑊𝐴𝐴𝑝𝑝𝑖𝑖 𝑖𝑖𝑊𝑊𝑓𝑓𝐴𝐴𝐴𝐴𝑎𝑎𝑠𝑠𝑖𝑖|
Yaniv and Kleinberger (2000) suggested this score for measuring advice discounting. Again,
in its standard form, this measure yields a value between 0 and 1, where 1 represents perfect
discounting and 0 perfect utilization of the advice. Extraordinary cases are represented by
scores greater than one. Note that none of these scores are defined for cases where the initial
and provided point predictions are the same.
Table 2: Judgmental adjustments on initial forecasts in Experiment 1.
Point forecasts % of initial point forecasts adjusted AAP APAP
Experienced credibility: high 80.92% 0.35 4.37% (456) (456) (456)
Experienced credibility: low 79.90% 0.23 2.91% (408) (408) (408)
Control group 57.62% 0.22 2.76% (420) (420) (420)
F2,104 = 6.82, p = 0.002 η2 = 0.12 p
F2,104 = 5.75, p = 0.004 η2 = 0.10 p
F2,104 = 5.47, p = 0.006 η2 = 0.10 p
Interval forecasts % of initial interval forecasts adjusted SAA APAI
Experienced credibility: high 86.84% 0.72 25.30% (456) (456) (456)
Experienced credibility: low 85.54% 0.54 19.24% (408) (408) (408)
Control group 66.67% 0.47 15.53% (420) (420) (420)
F2,104 = 5.51, p = 0.005 η2 = 0.10 p
F2,104 = 4.39, p = 0.015 η2 = 0.08 p
F2,104 = 6.98, p = 0.001 η2 = 0.12 p

p 1,67 p
Note: the numbers in parentheses indicate the numbers of observations in each category.
3.4 Results: judgmental adjustments of the initial forecasts
Table 2 exhibits the frequency and mean size of the judgmental adjustments applied to the
initial point and interval predictions for each source condition. The F and p-values in Table 2
relate to one-way ANOVA analyses which take into account the repeated measures design of
the experiment. They reveal that there are significant differences among the three source
conditions across all measures for both point and interval forecasts. For point predictions,
groups that experienced any type of credibility adjusted significantly more often than
participants in the control group, who received no information from which to build any
source-related experience (high experienced credibility vs. control group: F1,71 = 10.62, p =
0.002, η2 = 0.13; low experienced credibility vs. control group: F =8.12, p = 0.006, η2 =
0.11; Tukey’s HSD – high experienced credibility vs. control group: p = 0.004; low
experienced credibility vs. control group: p = 0.007). However, the adjustment frequencies of
the high and low credibility groups were similar (p > 0.1).
In terms of the sizes of adjustments, the group experiencing high credibility applied
larger adjustments to the initial forecasts than either the low experienced credibility group
(Tukey’s HSD: p = 0.021 for AAP; p = 0.023 for APAP) or the control group (Tukey’s HSD:
p = 0.007 for AAP; p = 0.01 for APAP). On average, participants who experienced low
credibility made adjustments of similar sizes to those in the control group (p > 0.1 for both
AAP and APAP).
Similar findings apply to the interval predictions. The high and low experienced
credibility groups had similar adjustment frequencies (high vs. low: n.s., p > 0.1), but these
groups adjusted significantly more often than the control group (Tukey’s HSD: high vs.
control: p = 0.009; low vs. control: p = 0.020). The SAA and APAI scores indicate that the
high experienced credibility group modified their initial intervals by larger amounts than

either the control group (Tukey’s HSD: p = 0.014 for SAA; p = 0.001 for APAI) or the low
credibility group. However, the difference between the high and low experienced credibility
groups was not as pronounced as in the case of point predictions (Tukey’s HSD: p = 0.1 for
SAA; p = 0.06 for APAI). When the mean interval adjustments of the low experienced
credibility group were compared with those of the control group, they were similar in size (p
> 0.2 for both SAA and APAI).
3.5 Results: advice utilization
The advice utilization scores were calculated for all of the initial and adjusted forecast pairs
except for the rare (9 out of 1284) cases where the initial prediction was exactly equal to the
forecasting advice provided. In three of these cases, the initial predictions also equaled the
final forecasts, so they were assigned perfect discounting scores (0 for advice-shift and WoA,
1 for WoE). The remaining six pairs were omitted from the subsequent calculations. 86.76%
of all initial and adjusted forecast pairs had scores between 0 and 1 on the WoA and WoE
measures (1114 pairs out of 1284). The remaining 12.54% of pairs were classified as
“extraordinary” instances of using external advice. Table 3 shows the scores for advice-shift,
WoA and WoE for each source condition on the aggregate data (i.e., with the ordinary and
extraordinary cases combined).
Table 3: Mean advice utilization scores for both ordinary and extraordinary cases in Experiment 1.
Advice-shift WoA WoE
Experienced credibility: high 0.42 0.44 0.62 (455) (455) (455)
Experienced credibility: low 0.18 0.42 0.89 (406) (406) (406)
Control group 0.18 0.39 0.86 (417) (417) (417)
F2,104 = 4.65, p = 0.012 η2 = 0.08 p
N.S. p > 0.1 F2,104 = 3.46, p = 0.035 η2 = 0.06 p
Note: the numbers in parentheses indicate the numbers of observations in each category.

The results indicate that the differences in advice utilization across the credibility
groups were significant. The advice-shift scores suggest that the high experienced credibility
group shifted their initial forecasts closer to the predictions provided than either the low
credibility group (Tukey’s HSD: p = 0.046 ) or the control group (Tukey’s HSD: p = 0.033).
However, the group that were given advice from the low experienced credibility source did
not appear to use the advice any differently to the group who were not given any chance to
acquire experience about the source (p > 0.2).
Overall, these results suggest that, compared to situations where there is no means of
assessing a source’s probable accuracy, any experience of a source’s accuracy is likely to
increase the frequency of adjustments by similar amounts, regardless of what this accuracy is.
When equipped with no information with which to determine the credibility of the source,
individuals were more reluctant to modify their original forecasts.
However, it could be argued that influence can be measured more finely by scores that
reflect the sizes of the adjustments and the degree of advice utilization. These measures
indicate that a high experienced credibility leads to a greater influence than a low experienced
credibility, which is consistent with H1. Also, the source has more influence if a higher
accuracy of the forecasting source is experienced than if people have no experience of the
source’s accuracy. This also provides support for H1. In contrast, a low experienced
credibility did not lead to the advice having less influence than that of the control group, so
there was no support for this component of H1. Thus, while people in the low experienced
credibility condition adjusted more frequently than those in the control group, the average
sizes of their adjustments were similar.
The wrap-up questionnaire data provide further insights into these results. Rating their
performance perceptions for the advice provided (on a seven-point scale, with 1 = “very
poor” and 7 = “excellent”), participants gave mean scores of 4.53, 3.18 and 3.74 for the high
experienced credibility, low experienced credibility and control groups, respectively. The

differences among these ratings are significant (F2,104 = 11.28, p < 0.001 , η2p = 0.18), and
pairwise comparisons indicate that the differences between high and low (Tukey’s HSD: p <
0.001) and high and control (Tukey’s HSD: p = 0.019) are significant, while the difference
between ‘low’ and ‘control’ is not statistically significant (Tukey’s HSD: p > 0.1). These
findings provide further partial support for H1, but again, its third component is not
supported.
4. Experiment 2 – presumed credibility
The stock market is a domain in which financial advisors earn a living, at least in part, by
encouraging a presumption of expertise, regardless of their actual track record of success.
Kahneman (2011) has referred to the ‘illusion of financial skill’, and the fact that people are
often prepared to pay for advice only on the basis of presumed credibility suggests that it is
influential (Armstrong, 1980). As Gardner (2011) points out: “As social animals we are
exquisitely sensitive to status”, and, as such, the perceived quality of advice, and hence its
influence, are likely to depend to some extent on the status of the source. According to
expectation states theory, people judge one another on the basis of status characteristics,
which, in turn, influence expectations about performance competency (for detailed reviews,
see e.g., Berger, Fisek, Norman, & Zelditch, 1977; Correll & Ridgeway, 2003). This leads to
the following hypothesis:
H2 Advice from a source with a high presumed credibility will have more influence on user
adjustments than advice from a source with a low presumed credibility, which, in turn, will
have more influence than advice from an unattributed source.
Details of the experiment that we designed to test this hypothesis are given below.
4.1 Participants

The participants were 93 undergraduate business administration students who were taking a
business forecasting course at Bilkent University. No monetary incentives were given, but
participation in the study led to extra credit points.
4.2 Design and procedure
Since this experiment was designed to investigate the influence of the presumed credibility of
a forecasting source, there were no experience-building series. After a single practice series to
familiarize the participants with the software interface, participants were given time series
plots for the weekly closing prices of 12 stocks (the same stocks as in the second phase of
Experiment 1). As before, the participants were informed that these were real stock price
series with undisclosed stock names and concealed time periods. There were three
experimental conditions, depending on the nature of the forecasting advice:
1. The high presumed credibility group (n = 34): For each series, the forecasting advice
was presented with a label displaying the message: “Source of this forecast advice is a
well-known financial analyst with extensive knowledge of stock price forecasting”.
This was designed to encourage the participants to attribute a high presumed
credibility to the forecast source.
2. The low presumed credibility group (n = 31): For each series, the forecasting advice
was presented with a label displaying “Source of this forecast advice is a taxi
driver”, so as to foster a low presumed credibility of the source of the forecast
advice. It is worth noting that it is very common in Turkey (where the experiment
took place) for the taxi drivers to engage in conversations on the economy and
financial markets; so the participants treated this as a frequently encountered and
highly realistic situation. A sample screenshot from the practice series is provided in
Appendix B.

3. The control group – no presumed credibility (n = 28): The participants in this group
received the forecasting advice without any labels, so that no credibility about the
source could be presumed
For each stock, the task of the participants was the same as in Experiment 1. Participants in
all treatments received identical advice, and a wrap-up questionnaire was presented at the end
of the experiment.
4.3 Results: judgmental adjustments of initial forecasts
The frequency and mean sizes of judgmental adjustments for the different presumed
credibility conditions are displayed in Table 4.
Table 4: Judgmental adjustments to initial forecasts in Experiment 2.
Point forecasts % of initial point forecasts adjusted AAP APAP
Presumed credibility: high 86.03% 0.39 4.86% (408) (408) (408)
Presumed credibility: low 72.04% 0.22 2.75% (372) (372) (372)
Control group 76.19% 0.33 4.10% (336) (336) (336)
N.S. p = 0.08 F2,90 = 5.64, p = 0.005 η2 = 0.11 p
F2,90 = 5.66, p = 0.005 η2 = 0.11 p
Interval forecasts % of initial interval forecasts adjusted SAA APAI
Presumed credibility: high 91.18% 0.83 31.11% (408) (408) (408)
Presumed credibility: low 77.42% 0.45 17.26% (372) (372) (372)
Control group 83.93% 0.71 24.39% (336) (336) (336)
N.S. p = 0.09 F2,90 = 8.06, p = 0.001 η2 = 0.15 p
F2,90 = 7.97, p = 0.001 η2 = 0.15 p
Note: the numbers in parentheses indicate the numbers of observations in each category.
Table 4 shows that there are significant differences between the three source conditions in the
size of adjustments. However, while a similar pattern exists for the adjustment frequency, the
differences among the groups were not strong enough to reach statistical significance.

In terms of pairwise comparisons, for both point and interval forecasts, the group who
believed that they had received forecasting advice from a financial expert made larger
adjustments to their initial predictions than the group who believed that their advice source
was a taxi driver (Tukey’s HSD: p = 0.004 for AAP; p = 0.003 for APAP; p < 0.001 for SAA
and p < 0.001 for APAI). When the adjustments of the high presumed credibility group were
compared with those of the control group who did not receive any information about the
source, the differences in both frequency and size were all non-significant (all p > 0.05). The
low presumed credibility group, who believed that their forecasting advice was coming from
a taxi driver, adjusted their initial forecasts less than the control group. However, this
difference was generally small and attained statistical significance only in the case of SAA
(Tukey’s HSD: p = 0.029 for SAA). Thus, there was mixed support for H2.
4.4 Results: advice utilization
As in Experiment 1, the advice utilization scores were calculated for all initial and adjusted
forecast pairs except for the cases where the initial and provided forecasts were identical (this
occurred in only six out of 1116 cases). Of these six pairs, three also had the initial
predictions equal to the final forecasts, so perfect advice discounting scores (“0” for advice-
shift and WoA, “1” for WoE) were assigned. The remaining three pairs were omitted from
the subsequent calculations.
“Ordinary” cases of advice utilization were evident for 88.35% of all initial and
adjusted forecast pairs. The remaining pairs constituted the “extraordinary” instances. Table 5
provides advice-shift, WoA and WoE results for each source condition on the aggregate data
(ordinary and extraordinary cases combined).
Table 5. Mean advice utilization scores for both ordinary and extraordinary cases in Experiment 2. (Note: the numbers in parentheses indicate the numbers of observations in each category.)

p 1,63 p
Advice-shift WoA WoE
Presumed credibility: high 0.47 0.50 0.59 (407) (407) (407)
Presumed credibility: low 0.24 0.27 0.78 (371) (371) (371)
Control group 0.40 0.43 0.67 (335) (335) (335)
F2,90 = 6.27, p = 0.003 η2 = 0.12 p
F2,90 = 6.13, p = 0.003 η2 = 0.12 p
F2,90 = 6.23, p = 0.003 η2 = 0.12 p
Note: the numbers in parentheses indicate the numbers of observations in each category.
An inspection of Table 5 reveals that there are significant differences in advice
utilization among the three presumed credibility groups. All of the scores show that the group
who believed that they had received advice from a financial expert had much higher
utilization rates than the group who were told that they have received advice from a taxi
driver (F1,63 = 13.48, p < 0.001 , η2 = 0.18 for advice-shift , F = 13.24, p = 0.001, η2 =
0.17 for WoA and F1,63 = 13.06, p = 0.001, η2p = 0.17 for WoE; Tukey’s HSD: p = 0.002 for
advice-shift, p = 0.002 for WoA and p = 0.002 for WoE). This provides further support for
H2. However, there was no significant difference between the advice utilization levels of the
high presumed credibility group and the control group on any of the scores (p > 0.1 for
advice-shift, WoA and WoE), so again the second component of H2 was not supported. As
before, advice received from an anonymous source (as was the case with the control group)
enjoyed slightly (but not significantly) higher utilization rates than advice received from a
low credibility source (Tukey’s HSD: p = 0.07 for advice-shift, p = 0.07 for WoA and p > 0.1
for WoE).
Further insights into these results can be gathered from the wrap-up questionnaire data.
When the participants were asked for their perception of the advisor’s performance (via a
seven-point scale, with 1 = “very poor” and 7 = “excellent”), their mean ratings were 4.65,
3.19 and 4.18 for the high and low presumed credibility groups and the control group,
respectively. A one-way ANOVA revealed that these scores were significantly different
(F2,90 = 9.87, p < 0.001, η2p = 0.18). The difference between the high and low presumed

credibility groups was significant (Tukey’s HSD: p < 0.001), as was the difference between
the low presumed credibility group and the control group (Tukey’s HSD: p = 0.016).
However, the difference between the high credibility group and the control group was not
significant (Tukey’s HSD: p > 0.3). These findings are consistent with the results of the
experiment itself, and provide partial support for H2
Overall, these analyses reveal that when the presumed credibility of a forecasting
source is high, the advice received from that source is more influential than that received
from a source with a low presumed credibility. However, there was no evidence that a high
presumed credibility led to a greater influence than advice from an unattributed source. This
finding could be an indication of truth bias (Levine & McCornack, 1991; Levine, Park, &
McCornack,1999), which refers to the tendency to presume that messages received are true
rather than untrue, irrespective of the actual accuracy of the information conveyed. The
presumption of truth is reduced when there is a reason to infer that the message is untrue.
5. Experiment 3 – experienced and presumed credibility
In many circumstances, people will base their assessment of an expert’s credibility on both
their experience of the expert’s accuracy (i.e., advice source) and the presumed credibility of
the source. This raises the question of how the two forms of credibility interact, and, in
particular, what happens when they give conflicting indications.
The literature suggests five possible models of the relationship between a satisfaction
with advice and presumed and experienced credibility. Armstrong’s (1980) ‘seer sucker’
theory suggests a ‘presumption-only’ model, where people will be influenced by the advice
of those who they presume to have the status of experts, irrespective of their track record.
The predictions of this model are depicted in Figure 1a (the lines are intended to be
coincidental). This dominance of presumption may arise because people are not motivated to
examine advisors’ track records.
At the other extreme is an ‘experience-only’ model, where the presumed credibility has
no influence when experience of the advice is available. There is some support for this model
from research in other domains. For example, Brown, Venkatesh, Kuruzovich, and Massey
(2008) found that expectations had no influence on users’ satisfaction with the ease-of-use of
information systems; satisfaction depended only upon experience of the system. Similarly,
Irving and Meyer (1994) found that experiences rather than expectations determined levels of
job satisfaction. Brown et al. suggested that the predominance of experience may be a
recency effect, because experience always follows expectations. Indeed, very recent
experience appears to be particularly influential for forecasting, and a good reputation can be
lost easily after very few inaccurate forecasts (Yaniv & Kleinberger, 2000). Figure 1b
indicates the predictions of the experience-only model.
If presumption and experience of advice are both influential separately, then the
experience + presumption model in Figure 1c may apply. However, there is evidence that
satisfaction with the advice will depend upon whether the presumption is confirmed or
contradicted by the experience. Discrepancies between expectations and experiences have
been examined particularly in relation to satisfaction with products (e.g., Andersen, 1973)
and information systems (Bhattacherjee, 2001). Research in the two areas has produced
similar findings. For example, when experience is consistent with expectations, user
satisfaction with an information system is increased. This occurs even when expectations are
low, although the satisfaction levels are lower in these circumstances than when high
expectations are confirmed (Venkatesh & Goyal, 2010).
Brown et al. (2008) suggest two possible models of the formation of satisfaction when
such discrepancies arise. In the ‘disconfirmation model’, better-than-expected experiences
lead to a positive influence on satisfaction, because there is a ‘positive surprise’ effect, while
worse-than-expected experiences lead to a reduced satisfaction, because there is a

‘disappointment effect’. This model is consistent with the ‘met expectations hypothesis’,
which suggests that satisfaction depends on the difference between experiences and
expectations (e.g., Porter & Steers, 1973). The predictions of the ‘disconfirmation’ model in
the context of forecasting advice are shown in Figure 1d. In this model, a high experienced
credibility will always have more influence on the use of advice than a low experienced
credibility, since the former will raise satisfaction if it is unexpected, while the latter will
lower it if it is unexpected. Given Venkatesh and Goyal’s (2010) findings, the model also
predicts that high presumed and experienced credibility will have more influence than low
presumed and experienced credibility
However, while a ‘positive surprise’ may have a positive effect on variables such as job
satisfaction, which are related directly to the happiness of an individual, the same may not be
true in the case of forecasting advice. Here, a discrepancy between presumption and
experience may lead to psychological discomfort or cognitive dissonance (Festinger, 1957),
irrespective of whether the experience is better or worse than expected. In this case, an ‘ideal
point model’ (Brown et al., 2008) may apply. This model assumes there is an ideal ‘point’ of
experience where the differences between presumption and experience are at a minimum.
People do not like to be wrong, and therefore, in contrast to the ‘disconfirmation model’,
even a better-than-presumed experience will lead to a reduced satisfaction because the
discomfort of a thwarted presumption exceeds the satisfaction of the positive surprise
(Carlsmith & Aronson, 1963; Oliver, 1977, 1980; Woodside & Parrish, 1972). The
predictions of the ‘ideal point’ model for the influence of forecasting advice are shown in
Figure 1e. Here, the greatest influence on forecasters will be when both the presumed and
experienced credibility are high, as there will be both a synergistic effect, with each form of
credibility enhancing the influence of the other, and an absence of cognitive dissonance,
because the advisees do not experience any psychological discomfort (Elliot & Devine, 1994;
Szajna & Scamell, 1993). While a better-than-presumed experience may partly mitigate the

reduced satisfaction that arises from the discrepancy, an experience that is worse than
presumed will not serve to reduce this discomfort. Thus, it will reduce the satisfaction even
more. In a practical context, this reduction in satisfaction may result from annoyance that a
person described as an ‘expert’ has exhibited a poor performance, with catastrophic effects
for their credibility. This is reflected in the fact that the ‘low experienced credibility’ line in
Figure 1e has the greater absolute slope. In this model, it is also possible for the lines to
intersect, so that low presumed and experienced credibility could have more influence than
low presumed, high experienced credibility. This seems unlikely, but would arise if there was
a large amount of dissatisfaction from the discrepant experience.
Influence of advice
Low High
Low High
Low High
Presumed credibility Presumed credibility Presumed credibility
Influence of advice
Low High Low High
Presumed credibility Presumed credibility
(c) Experience + presumption (b) Experience-only (a) Presumption-only

= low experienced credibility = high experienced credibility
Figure 1. Five models predicting the influence of expert advice.
(e) Ideal-point (d) Disconfirmation

5.1 Participants
The participants were 65 undergraduate business administration students who were taking a
business forecasting course at Bilkent University. As with the previous studies, there were no
monetary incentives, but participation led to extra credit points.
5.2 Design and procedure
The design and procedure for Experiment 3 represented a combination of those of the
previous two studies. As before, specifically tailored software was used to administer the
experiment. The software presented time series plots for the weekly closing prices of 25
stocks (the same stocks that were used in Experiment 1), with the same initial 12 stocks
being used as the experience-building time series. Table 6 exhibits the four experimental
conditions based on the experienced accuracy and the presumed credibility cues that were
provided.
Table 6. Design for Experiment 3. High presumed credibility
“Source of this forecast advice is a well- known financial analyst with extensive knowledge of stock price forecasting”
Low presumed credibility “Source of this forecast advice is a taxi
driver”
High experienced credibility [Initial 12 experience-building series had a MAPE of 2.94% for the point forecasts and a hit rate of 83% for the intervals]
18 (G1)
16 (G3)
Low experienced credibility [Initial 12 experience-building series had a MAPE of 14.94% for the point forecasts and a hit rate of 17% for the intervals]
16 (G2) 15 (G4)
Note: the numbers in the cells indicate the numbers of participants, with group codes shown in parentheses.
The procedure followed by the participants was the same as that in Experiment 1.
5.3. Results: judgmental adjustments of initial forecasts
Table 7 displays the frequency and mean size of the judgmental adjustments to the initial
forecasts when both experienced and presumed credibility cues are present at the same time.

Table 7: Judgmental adjustments on the initial forecasts in Experiment 3.
Point forecasts % of initial point forecasts adjusted AAP APAP
Presumed high, experienced high 77.31% 0.46 5.79% (G1) (216) (216) (216) Presumed high, experienced low 42.71% 0.17 2.20% (G2) (192) (192) (192) Presumed low, experienced high 60.42% 0.33 4.12% (G3) (192) (336) (336) Presumed low, experienced low (G4)
43.89% (180)
0.22 (180)
2.88% (180)
F3,61 = 5.53, p = 0.002 η2 = 0.21 p
F3,61 = 6.77, p = 0.001 η2 = 0.25 p
F3,61 = 6.40, p = 0.001 η2 = 0.24 p
Interval forecasts % of initial interval forecasts adjusted SAA APAI
Presumed high, experienced high 81.02% 0.91 24.03% (G1) (216) (216) (216) Presumed high, experienced low 52.60% 0.40 11.97% (G2) (192) (192) (192) Presumed low, experienced high 64.58% 0.66 20.02% (G3) (192) (192) (192) Presumed low, experienced low 50.56% 0.46 19.05% (G4) (180) (180) (180)
F3,61 = 4.97, p = 0.011 η2 = 0.20 p
F3,61 = 6.05, p = 0.001 η2 = 0.23 p
F3,61 = 3.29, p = 0.026 η2 = 0.14 p
Note: the numbers in parentheses indicate the numbers of observations in each category.
2 × 2 factorial ANOVA analyses which take into account the repeated measures design of the
experiment were run to investigate the factor effects and the significance of the differences.
The F-test scores in Table 7 indicate that there exist significant differences among the four
credibility groups for all six measures considered.
For point forecasts, the experienced credibility factor had a significant main effect on
both the frequency (F1,61 = 13.02, p = 0.001, η2p = 0.18) and size (F1,61 = 15.40, p < 0.001,
η2p
= 0.20 for AAP; F1,61 =14.32, p < 0.001, η2p = 0.19 for APAP) of adjustments. Neither the
main effect of the presumed credibility condition nor the interaction effect between
experienced and presumed credibility were found to be significant (all p > 0.05). Pairwise
comparisons among the groups revealed that the high presumed and experienced credibility
group made larger adjustments and adjusted more frequently than the groups experiencing
low credibility (Tukey’s HSD for G1 vs. G2: p = 0.0043 for the percentage of point forecasts

p 1,61 p
p
p
adjusted, p = 0.0006 for AAP and p = 0.0008 for APAP; Tukey’s HSD for G1 vs. G4: p =
0.0073 for the percentage of point forecasts adjusted, p = 0.0074 for AAP and p = 0.0102 for
APAP). This may suggest that presumptions about the source do not have much influence
when the forecasters have a chance to actually experience high credibility (Tukey’s HSD for
G1 vs. G3: p > 0.1 for all measures). Thus, the results are consistent with an experience-only
model. None of the other differences between the groups were strong enough to attain
statistical significance (Tukey’s HSD p > 0.1).
Parallel findings were obtained for interval forecasts. For the percentage of initial
interval forecasts adjusted and the SAA scores, the only significant factor was the main effect
of experienced credibility (F1,61 = 8.95, p = 0.004, η2 = 0.13; F = 13.63, p < 0.001, η2 =
0.18, respectively). The presumed credibility factor and the interaction effect between the two
types of credibility were not found to have any impact on these two scores (all p > 0.1). The
largest and most frequent adjustments to the initial predictions were made when the
forecasters experienced a high credibility about a source that was presumed to be highly
credible (Tukey’s HSD for G1 vs. G2: p = 0.0261 for the percentage of point forecasts
adjusted and p = 0.0016 for SAA; Tukey’s HSD for G1 vs. G4: p = 0.0172 for the percentage
of point forecasts adjusted and p = 0.0074 for SAA). Similarly, the presumed credibility did
not have a significant effect when the experienced credibility was high (Tukey’s HSD for G1
vs. G3: p > 0.1 for all measures).
For the adjustment of the initial interval widths, as measured by APAI, both the main
effect of experienced credibility (F1,61 = 5.37, p = 0.024, η2 = 0.08) and its interaction with
presumed credibility (F1,61 = 3.89, p = 0.05, η2 = 0.06 ) were significant. The advice was
least influential when the experienced credibility was low despite the source having a high
presumed credibility. The pairwise comparisons also support this observation by showing that
the difference was most extreme between the G1 and G2 (Tukey’s HSD: p = 0.0149 for
p 1,61
APAI), whereas none of the other differences, including that between G1 and G3, were
distinct enough to reach statistical significance (Tukey’s HSD: p > 0.1 for APAI).
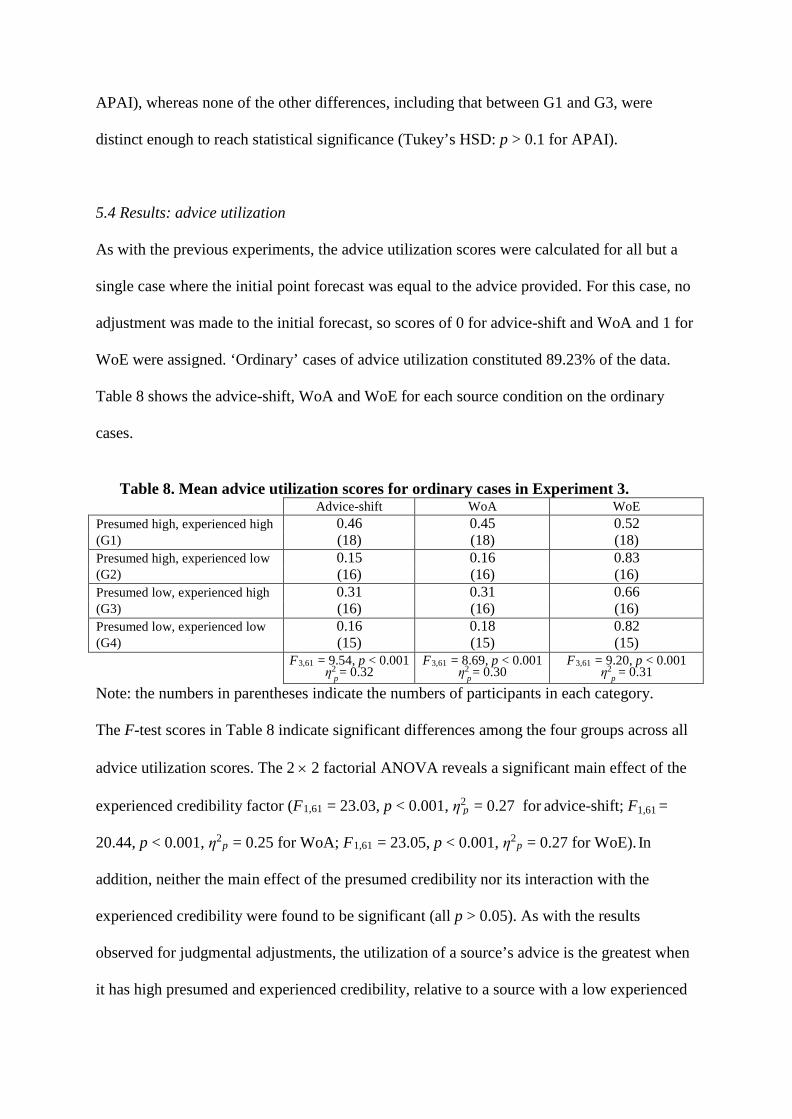
5.4 Results: advice utilization
As with the previous experiments, the advice utilization scores were calculated for all but a
single case where the initial point forecast was equal to the advice provided. For this case, no
adjustment was made to the initial forecast, so scores of 0 for advice-shift and WoA and 1 for
WoE were assigned. ‘Ordinary’ cases of advice utilization constituted 89.23% of the data.
Table 8 shows the advice-shift, WoA and WoE for each source condition on the ordinary
cases.
Table 8. Mean advice utilization scores for ordinary cases in Experiment 3.
Advice-shift WoA WoE Presumed high, experienced high 0.46 0.45 0.52 (G1) (18) (18) (18) Presumed high, experienced low 0.15 0.16 0.83 (G2) (16) (16) (16) Presumed low, experienced high 0.31 0.31 0.66 (G3) (16) (16) (16) Presumed low, experienced low 0.16 0.18 0.82 (G4) (15) (15) (15)
F3,61 = 9.54, p < 0.001 η2 = 0.32 p
F3,61 = 8.69, p < 0.001 η2 = 0.30 p
F3,61 = 9.20, p < 0.001 η2 = 0.31 p
Note: the numbers in parentheses indicate the numbers of participants in each category.
The F-test scores in Table 8 indicate significant differences among the four groups across all
advice utilization scores. The 2 × 2 factorial ANOVA reveals a significant main effect of the
experienced credibility factor (F1,61 = 23.03, p < 0.001, η2 = 0.27 for advice-shift; F =
20.44, p < 0.001, η2p = 0.25 for WoA; F1,61 = 23.05, p < 0.001, η2
p = 0.27 for WoE). In
addition, neither the main effect of the presumed credibility nor its interaction with the
experienced credibility were found to be significant (all p > 0.05). As with the results
observed for judgmental adjustments, the utilization of a source’s advice is the greatest when
it has high presumed and experienced credibility, relative to a source with a low experienced

credibility (Tukey’s HSD for G1 vs. G2: p = 0.0001 for advice-shift, p = 0.0002 for WoA and
p = 0.0002 for WoE; Tukey’s HSD for G1 vs. G4: p = 0.0003 for advice-shift, p = 0.0006 for
WoA and p = 0.0004 for WoE). Again, the presumed credibility does not seem to affect
advice acceptance if the perception about the source formed through experience is high
(Tukey’s HSD for G1 vs. G3: p > 0.1 for all measures).
Overall, the results from Experiment 3 generally suggest that when the forecasters have
presumptions about a source’s credibility and also experience the source’s accuracy over
time, the perceptions formed through experience dominate. This conforms to the ‘experience-
only’ model in Figure 1b. The only exception relates to the interval widths, as measured by
the APAI, where there was a significant interaction between the two types of credibility. It is
not clear why the results for the APAI followed a different pattern.
6. Experiment 4 – experienced and presumed credibility
The design and procedure of this study were identical to those of Experiment 3; the only
difference was that it involved professionals as participants. A total of 82 professionals who
regularly receive or give financial advice in sectors such as banking, finance, defense, energy
and IT, participated; Table 9 displays the work experience and age details for this participant
pool.
Table 9: Design of Experiment 4. High presumed credibility
“Source of this forecast advice is a well- known financial analyst with extensive knowledge on stock price forecasting”
Low presumed credibility “Source of this forecast advice is a taxi
driver”
High experienced credibility [Initial 12 experience-building series had a MAPE of 2.94% for the point forecasts and a hit rate of 83% for the intervals]
# of participants : 21 Mean work XP : 9.3 Mean age : 32.9
(G1)
# of participants : 20 Mean work XP : 12.1 Mean age : 35.2
(G3)
Low experienced credibility [Initial 12 experience-building series had a MAPE of 14.94% for the point forecasts and a hit rate of 17% for the intervals]
# of participants : 21 Mean work XP : 10.8 Mean age : 34.1
(G2)
# of participants : 20 Mean work XP : 7.4 Mean age : 31.2
(G4)

Note: the numbers in the cells indicate the numbers of professional participants, average years of work experience and average age, with the group codes shown in parentheses.
6.1. Results: judgmental adjustments of the initial forecasts
Table 10 displays the F-test scores of the four credibility groups for measures of adjustment
size, showing significant differences among the groups (APAP, AAP, SAA), with the
exception of APAI. In terms of adjustment frequencies, all groups’ scores were statistically
similar. Further 2 × 2 factorial ANOVA analyses, which take into account the repeated
measures design of the experiment, were run to investigate the factor effects that generated
these distinctions.
For point forecasts, both the experienced credibility (F1,78 = 5.08, p = 0.027, η2p = 0.06
for AAP; F1,78 = 5.65, p = 0.02, η2p = 0.07 for APAP) and the presumed credibility (F1,78 =
7.79, p = 0.007, η2p = 0.09 for AAP; F1,78 = 7.23, p = 0.009, η2
p = 0.08 for APAP) appeared
to have significant influences on the adjustment size. The interaction effect between
experienced and presumed credibility was not significant (p > 0.05). Pairwise comparisons
among the groups revealed that the high presumed and experienced credibility group (i.e.,
G1) made significantly larger adjustments than the group given advice from a low presumed
credibility source while also experiencing low credibility (i.e., G4) (Tukey’s HSD for G1 vs.
G4: p = 0.0034 for AAP and p = 0.0033 for APAP). None of the other differences among the
groups were strong enough to attain statistical significance (Tukey’s HSD: p > 0.1).
Table 10: Judgmental adjustments to initial forecasts.
Point forecasts % of initial point forecasts adjusted AAP APAP
Presumed high, experienced high (G1)
84.92% (252)
0.41 (252)
5.05% (252)
Presumed high, experienced low (G2)
79.37% (252)
0.32 (252)
3.87% (252)

p
Presumed low, experienced high (G3)
84.17% (240)
0.30 (240)
3.73% (240)
Presumed low, experienced low (G4)
82.08% (240)
0.23 (240)
2.78% (240)
N.S. F3,78 = 4.32, p = 0.007 η2 = 0.14 p
F3,78 = 4.33, p = 0.007 η2 = 0.14 p
Interval forecasts % of initial interval forecasts adjusted SAA APAI
Presumed high, experienced 96.03% 1.04 139.30% high (G1) (252) (252) (252) Presumed high, experienced low 90.48% 0.75 92.49% (G2) (252) (252) (252) Presumed low, experienced high 94.58% 0.82 104.70% (G3) (240) (240) (240) Presumed low, experienced low 92.08% 0.57 108.80% (G4) (240) (240) (240)
N.S. F3,78 = 6.85, p < 0.0001 η2 = 0.21 p
N.S.
Note: the numbers in parentheses indicate the numbers of observations in each category.
For interval forecasts, parallel findings were observed only for SAA scores. For the
size of the adjustments on the interval bounds (as operationalized by SAA), there were
significant main effects of both the presumed (F1,78 = 7.34, p = 0.008, η2 = 0.09) and
experienced (F1,78 = 13.08, p = 0.001, η2p = 0.14) credibility. The interaction effect was
insignificant. Pairwise comparisons on SAA suggested that the high presumed and
experienced credibility group made significantly larger adjustments than the groups
experiencing low credibility (Tukey’s HSD for G1 vs. G2: p = 0.0341; Tukey’s HSD for G1
vs. G4: p = 0.0002). The presumed credibility did not have a significant effect when the
experienced credibility was high (Tukey’s HSD for G1 vs. G3: p > 0.1), and the remaining
pairwise differences were also insignificant (Tukey’s HSD p > 0.1). Interestingly, the
presumed and experienced credibility factors were not influential in differentiating the sizes
of interval widths, as measured by APAI. Even though there were distinct adjustments to the
interval bounds (as designated by SAA scores), the changes in widths between the initial and
final intervals remained nearly the same across all groups.

6.2 Results: advice utilization
As in the analyses of previous experiments, the advice utilization scores were
calculated for all but the rare cases (12 out of 984) where the initial point forecast was exactly
equal to the advice provided. In three of these cases, the initial predictions were also equal to
the final forecasts, so they were assigned perfect discounting scores (0 for advice-shift and
WoA, 1 for WoE). The remaining nine cases were omitted from the calculations. ‘Ordinary’
cases of advice utilization constituted 71.24% of the data, and the remaining 28.46% cases
were classified as ‘extraordinary’. These extraordinary adjustments were not only more
numerous for the professionals’ predictions than for the students’ predictions, they also
contained quite extreme cases. As in the case of the students’ predictions in Experiment 3,
the subsequent analysis (as displayed in Table 11) was conducted for the ordinary cases of
advice utilization.
Table 11. Mean advice utilization scores for ordinary cases in professionals’ forecasts.
Advice-shift WoA WoE Presumed high, experienced 0.45 0.45 0.52 high (G1) (21) (21) (21) Presumed high, experienced low 0.36 0.34 0.62 (G2) (21) (21) (21) Presumed low, experienced high 0.34 0.36 0.63 (G3) (20) (20) (20) Presumed low, experienced low 0.25 0.26 0.72 (G4) (20) (20) (20)
F3,78 = 4.28, p = 0.007 η2 = 0.14 p
F3,78 = 3.73, p = 0.015 η2 = 0.13 p
F3,78 = 3.89, p = 0.012 η2 = 0.13 p
Note: the numbers in parentheses indicate the numbers of participants in each category.
The F-test scores in Table 11 indicate significant differences among the four groups
across all three scores. The 2 × 2 factorial ANOVA reveals that there are significant main
effects of both the experienced credibility factor (F1,78 = 5.60, p = 0.020, η2p = 0.07 for
advice-shift; F1,78 = 6.32, p = 0.014, η2p = 0.07 for WoA; and F1,78 = 5.25, p = 0.025, η2
p =
0.06 for WoE) and the presumed credibility factor (F1,78 = 7.24, p = 0.009, η2p = 0.08 for

advice-shift; F1,78 = 4.80, p = 0.032, η2p = 0.06 for WoA; and F1,78 = 6.40, p = 0.013, η2
p =
0.08 for WoE) across all utilization scores. None of the interaction effects are significant (all
p > 0.05). As with the results observed for judgmental adjustments, the utilization of its
advice is highest when a source has high presumed and experienced credibility, relative to a
source with low experienced and presumed credibility (Tukey’s HSD for G1 vs. G4: p =
0.0033 for advice-shift, p = 0.0072 for WoA and p = 0.0056 for WoE). The remaining
pairwise differences are all insignificant (Tukey’s HSD: p > 0.1).
Overall, the professional’s use of advice conformed with the ‘presumption + advice’
model (Figure 1c). None of the measures were consistent with the effects predicted by either
the disconfirmation or ideal points models.
6.3 Results: comparisons with findings of Experiment 3
Experiments 3 and 4 were identical except for their participants (i.e., students in
Experiment 3 vs. professionals in Experiment 4). Thus, a comparison of their findings is
important in enhancing our understanding of the way in which expert advice is used in
forecasting.
In terms of the frequency of adjustments (percentage of initial point and interval
forecasts adjusted), the professionals consistently adjusted a very high percentage (>79%),
regardless of the credibility group to which they belonged. The adjustment frequency was not
influenced by either the experienced or presumed credibility of the forecast source. This is in
line with extant work (e.g., Önkal & Gönül, 2005; Fildes, Goodwin, Lawrence, &
Nikolopoulos, 2009), showing that, for a number of reasons, professionals almost always
intervene to adjust the forecasts they receive.
The second main difference between the students and professionals was that, for the
students, the presumed credibility did not have any significant effect on any of the measures
(except the APAI) relating to the size of adjustments and the utilization of advice when

experienced credibility was present. Thus, when the students had access to the track record of
the advisor, this generally eclipsed any considerations of the advisor’s status. In contrast, the
professionals were influenced by both experienced and presumed credibility. When these
were low, they both led to significantly larger adjustments and lower advice utilization.
Hence, the professionals were sensitive to the advisor’s status even when their track record
was available. Thus, while the students’ use of advice was generally consistent with the
experience-only model, the professionals conformed to the experience + presumption model.
The third difference was that the professionals did not make any significant changes
to the width of their prediction intervals after receiving the advice. Hence, their adjustments
to the bounds of their intervals served only to shift them to a new location. In contrast, the
students did make significant changes to the widths of their intervals, depending on the
interaction between the experienced and presumed credibility of their advisor.
7. General discussion
Our four studies indicate that, when considered separately, both the presumed and
experienced credibility of an advisor/expert can have a significant effect on the extent to
which users revise their prior forecasts, irrespective of whether these are expressed as point
or interval forecasts. However, when both forms of credibility are available, the influence of
the advice differs between non-professional and professional advisees.
For non-professionals, with the exception of interval widths, there is no evidence that
the presumed credibility has any influence on advisees when the experienced credibility is
high. For professionals, who were perhaps sensitive to their own status, the relative status of
the advisor, as reflected by their presumed credibility, was influential. No evidence was
found to support either the ‘Presumption-only’ or ‘Disconfirmation’ models. The first of
these might apply only when advisees are not motivated to examine an advisor’s record or

have an inaccurate recall of this record. In Experiments 3 and 4, the participants were
presented with the record just before they made their forecasts. The absence of evidence for
the disconfirmation and ideal points models suggests that surprises or disappointments, where
an advisor’s performance differs from that which would be presumed, do not affect the
influence of advice. For the students, this appears to be because the advisor’s status was
ignored when their track record was available. On the other hand, the professionals did not
react to such contradictions even though they were sensitive to the status of the advisor,
possibly because their experience of financial forecasting meant that they were less
surprised when people with high presumed credibility were found to have poor track records,
and vice versa.
No rationale was given for the advisor’s forecasts, so participants’ assessments of the
expert’s credibility were not confounded with judgments about the plausibility of the reasons
for the advisor’s forecasts. In the study of presumed credibility (Experiment 2), Tables 4 and
5 show that people in the control and high presumed credibility groups typically made similar
adjustments to their initial forecasts, while those in the low presumed credibility group made
smaller adjustments. Thus, the presumption of a high credibility did not increase the
adjustments relative to unattributed advice. This suggests that the default position for the
advice appearing on the computer screen was that it had presumed credibility even if its
source was unknown, a finding that is consistent with truth-bias. Hence, the information
about the status of the source only made a difference when it had a negative effect. However,
even this difference was relatively small, suggesting that the presumed credibility of a source
based on its status does not have a strong effect.
A different and stronger effect was found in the case of experienced credibility. Here, it
was the low experienced credibility group that typically produced forecasts that were similar
to those of the control group. Thus, experience of highly accurate forecasts enhanced the

credibility of the source, relative to the control, but being presented with a sample of
relatively inaccurate forecasts did not detract from it. Several studies have found that people
have a high propensity to adjust, heavily discount or ignore, provided forecasts, whether they
come from a statistical method (e.g., Fildes et al., 2009) or a human expert (e.g., Önkal et al.,
2009). At the extreme, discounting can involve totally ignoring advice. Neither the control
group nor those who experienced inaccurate forecasts from the advisor had any reason to
attach credibility to the advised forecasts. Hence, they may well have both discounted at this
extreme level, with their own forecasts replacing the provided forecasts rather than adjusting
them. Accordingly, an absence of experienced credibility appears to lead to the same effect as
experience indicating low credibility. Only those experiencing highly accurate forecasts
would have had any reason to have developed a positive perception of their credibility and to
have paid some attention to them.
Overall, experienced credibility was more influential than presumed credibility. In
Experiments 3 and 4, information on the status of the advisor was displayed on the computer
screen after the track record of the advisor. This means that explanations based on the greater
recency of experience cannot apply here. It is more likely that the information on accuracy
was more congruent with the objectives of the task than the information on status (e.g.,
Bettman & Zins, 1979). The former was displayed in a graphical format, the forecast
adjustments were made on graphs too, and accuracy was directly relevant to what the
participants wanted to achieve. Highly accurate or highly inaccurate forecasts would have
had high levels of salience to the participants, so that the attention paid to the advisor’s
accuracy would probably have been greater than that paid to their status.
In all cases, people were generally prepared to change a large percentage of their
original forecasts when they received the advice, despite receiving no rationale to accompany
it. To some extent, this may be an artifact of experiments like this. People may feel obliged to
make adjustments because they feel that this is expected, especially if they have been

recruited because of their professional status; otherwise, why are they repeatedly being
invited to make adjustments? However, a similar phenomenon has been found in field
studies, where professional forecasters have been found to make large numbers of
unnecessary small adjustments to statistical forecasts, apparently merely to register that they
are doing their job (e.g., Fildes et al., 2009).
This work has a number of limitations and could also be extended in several ways.
Business undergraduates may not be typical of the people making stock market forecasts and
decisions. To some extent, they may be more knowledgeable than typical investors, as they
will have been taught courses in forecasting and finance. However, since the task did not
include contextual information like stock names, any expertise that business students had
about stocks was not directly useful for these anonymous stocks. Nevertheless, both they and
the professionals were prepared to make judgments on the basis of presumptions about
expertise that have little empirical justification (i.e., that ‘experts’ produce more accurate
stock market forecasts) and on the basis of relatively small samples of experienced accuracy.
Of course, the errors in their forecasts did not carry the risks of financial losses or missed
gains that would apply in real investing, but their responses to the stimuli, and the informal
feedback, suggest that they took the task seriously and engaged in it with interest. The
experiments were conducted as forecasting competitions and we observed that this motivated
them strongly, as they strove to outperform their colleagues.
Another potential limitation could involve the experimental design of Experiments 3
and 4, as these studies did not aim to control for the time spent on manipulation. For
experienced credibility, the participants may have chosen to spend more time examining the
performance on the trials, which may then make the experienced credibility more salient;
whereas for the presumed credibility, the participants are just told about the person’s
reputation, with potentially limited time being spent on this part of the task. It could be that
spending more time reading about advisor’s presumed credibility might make it more

powerful. Further work could benefit from incorporating such manipulation checks, as well
as from including advisor and advisee confidence as potentially important signals for tracking
advice use (Sah et al., 2013).
The experiments involved only three levels of presumed and experienced credibility
(low, none and high). In future, it may be worth testing the effects at more levels. For
example, in the context of information systems adoption, Venkatesh and Goyal (2010) found
non-linear relationships between people’s willingness to adopt systems and a range of values
of expectations and experience relating to the usefulness of a system. In addition, it would be
worth exploring the effect of presumed and experienced credibility when the advisor provides
a justification for their forecast, as this situation is often encountered in practice.
Along the lines suggested in EKE research, another promising research direction would
be to investigate combinations of elicited knowledge from multiple experts (Aspinall, 2010;
U.S. EPA, 2009) or expert panels (Budnitz et al., 1998) under conditions of varying
credibility levels. This would be especially critical for enhancing the effectiveness of the
Delphi (Bolger & Rowe, 2014; Rowe, Wright, & McColl, 2005; Bolger & Wright, 2011) and
scenario (Wright & Goodwin, 2009; Wright, Bradfield, & Cairns, 2013; Önkal, Sayım, &
Gönül, 2013) methodologies in organizational forecasting processes. Such work promises to
enhance our understanding of the ways in which forecast users and decision makers actually
assess expert advice, and how this evaluation process can be effectively supported.
8. Conclusions
Our studies indicate that, in forecasting, the weighting that is attached implicitly to expert
advice depends more on the observed accuracy of the advisor than on presumptions about
the advisor’s status. However, presumptions about the status of the advisor are influential
when no accuracy track record is available or when professionals are the recipients of the

advice, rather than students. These results have a number of implications for expert
knowledge elicitation (EKE). First, there is plenty of evidence that, in many fields, apparent
expertise is not correlated with forecasting accuracy. Also, more accurate forecasts can be
obtained from diverse groups of people, some of whom may not be regarded as experts (e.g.,
Tetlock & Gardner, 2015). This suggests that, in forecasting, presumed credibility may often
be misleading as an indication of the relative value of an expert’s judgments. In these cases,
EKE methods that protect the anonymity of experts, such as the Delphi method, are likely to
be advantageous.
Secondly, both students and professionals were prepared to change their initial
forecasts on the basis of a limited sample of evidence about the advisor’s track record. This
was in spite the fact that, especially in financial forecasting, a forecaster’s past record can be
a very poor guide to their future accuracy (e.g., Taleb, 2004). This suggests that in EKE
processes, when experts’ judgments are being selected or implicitly weighted, track records
should only be used when they provide a reliable indication of an expert’s likely future
performance. When this is not possible, information on track records should be suppressed. A
better indication of the quality of a judgment may be the rationale that underlies it. The
circulation of arguments that justify forecasts has been found to lead to improvements in the
accuracy of forecasts obtained using Delphi applications (Wright & Rowe, 2011).
References
Anderson, R. E. (1973). Consumer dissatisfaction: the effect of disconfirmed expectancy on perceived product performance. Journal of Marketing Research, 10(1), 38-44.
Armstrong, J. S. (1980). The seer-sucker theory: the value of experts in forecasting. Technology Review, 82, 16-24.
Aspinall, W. (2010). A route to more tractable expert advice. Nature, 463, 294–295. Berger, J., Fisek, M. H., Norman, R. Z., & Zelditch, M., Jr. (1977). Status characteristics and social
interaction: an expectation states approach. Elsevier, New York. Berry, T. R., & Shields, C. (2014). Source attributions and credibility of health and appearance
exercise advertisements: relationships with implicit and explicit attitudes and intensions. Journal of Health Psychology, 19, 242-252.

Bettman, J. R., & Zins, M. A. (1979). Information format and choice task effects in decision making. Journal of Consumer Research, 6, 141-153.
Bhattacherjee, A. (2001). Understanding information systems continuance: an expectation- confirmation model. MIS Quarterly, 25, 351-370.
Bolger, F., & Rowe, G. (2014). Delphi: somewhere between Scylla and Charybdis? Proceedings of the National Academy of Science USA, 111(41), E4284–E4284.
Bolger, F., & Rowe, G. (2015). The aggregation of expert judgment: do good things come to those who weight? Risk Analysis, 35, 5-11
Bolger, F., & Wright, G. (2011). Improving the Delphi process: Lessons from social psychological research. Technological Forecasting and Social Change, 78, 1500-1513.
Bonaccio, S., & Dalal, R. S. (2006). Advice taking and decision-making: An integrative literature review, and implications for the organizational sciences. Organizational Behavior and Human Decision Processes, 101, 127-151.
Bonaccio, S., & Dalal, R. S. (2010). Evaluating advisors: A policy-capturing study under conditions of complete and missing information. Journal of Behavioral Decision Making, 23, 227-249.
Brown, S. A., Venkatesh, V., Kuruzovich, J., & Massey, A. P. (2008). Expectation confirmation: An examination of three competing models. Organizational Behavior and Human Decision Processes, 105, 52-66.
Budnitz, R. J., Boore, D. M., Apostolakis, G., Cluff, L. S., Coppersmith, K. J., Cornell, C. A., & Moms, P. A. (1995). Recommendations for probabilistic seismic hazard analysis: guidance on uncertainty and use of experts, Vol. 1. Washington, DC: U.S. Nuclear Regulatory Commission.
Budnitz, R. J., Apostolakis, G., Boore, D. M., Cluff, L. S., Coppersmith, K. J., Cornell, C. A., & Morris, P. A. (1998). Use of technical expert panels: applications to probabilistic seismic hazard analysis. Risk Analysis, 18, 463-469.
Carlsmith, J. M., & Aronson, E. ( 1963). Some hedonic consequences of the confirmation and disconfirmation of expectancies. Journal of Abnormal Social Psychology, 66, 151-156.
Chen, W., & Tan, H.-T. (2013). Judgment effects of familiarity with an analyst’s name. Accounting, Organisations and Society, 38, 214-227.
Cooke R. M. (1991). Experts in uncertainty: opinion and subjective probability in science. Oxford: Oxford University Press.
Correll, S. J., & Ridgeway, C. L. (2003). Expectation states theory. In J. Delamater (Ed), Handbook of social psychology. Kluwer Academic/Plenum Publishers, New York.
Dholakia, R. R. (1986). Source credibility effects: A test of behavioural persistence. In M. Wallendorf & P. Anderson (eds.), Advances in consumer research, Vol. 14 (pp. 426-430). Provo, UT: Association of Consumer Research.
Dholakia, R. R., & Strenthal, B. (1977). Highly credible sources: persuasive facilitators or persuasive liabilities. Journal of Consumer Research, 3, 223-232.
Elliot, A. J., & Devine, P. G. (1994). On the motivational nature of cognitive dissonance: dissonance as psychological discomfort. Journal of Personality and Social Psychology, 67, 382-394.
Festinger, L. A. (1957). A theory of cognitive dissonance. Stanford, CA: Stanford University Press. Fildes, R., Goodwin, P., Lawrence, M., & Nikolopoulos, K. (2009). Effective forecasting and
judgmental adjustments: an empirical evaluation and strategies for improvement in supply- chain planning. International Journal of Forecasting, 25, 3-23.
Fogg, B. J. (1999). Persuasive technologies—Now is your chance to decide what they will persuade us to do –and how they’ll do it. Communications of the ACM, 42, 26-29.
Gardner, D. (2011). Future babble. Toronto: McClelland and Stewart. Gönül, M. S., Önkal, D., & Lawrence, M. (2006). The effects of structural characteristics of
explanations on the use of a DSS. Decision Support Systems, 42(3), 1481-1493. Gönül, M. S., Önkal, D., & Goodwin, P. (2009). Expectations, use and judgmental adjustment of
external financial and economic forecasts: an empirical investigation. Journal of Forecasting, 28, 19-37.
Goodwin, P., Gönül, M. S., & Önkal, D. (2013). Antecedents and effects of trust in forecasting advice. International Journal of Forecasting, 29, 354-366.
Goodwin, P., & Wright, G. (2014). Decision analysis for management judgment (5th ed.). Chichester: Wiley.
Harvey, N., & Fischer, I. (1997). Accepting help, improving judgment, and sharing responsibility. Organizational Behavior and Human Decision Processes, 70(2), 117-133.
Harvey, N., Harries, C., & Fischer, I. (2000). Using advice and assessing its quality. Organizational Behavior and Human Decision Processes, 81, 252-273.
Hirst, D. E., Koonce, L., & Miller, J. (1999). The joint effect of management’s prior forecast accuracy and the form of its financial forecasts on investor judgment. Journal of Accounting Research, 37, 101-124.
Hovland, C. I., & Weiss, W. (1951). The influence of source credibility on communication effectiveness. Public Opinion Quarterly, 15, 635-650.
Irving, P. G., & Meyer, J. P. (1994). Reexamination of the met-expectations hypothesis: A longitudinal analysis. Journal of Applied Psychology, 79, 937-949.
Johnson, H. H., & Izzett, R. (1969). Relationship between authoritarianism and attitude change as a function of source credibility and type of communication. Journal of Personality and Social Psychology, 13, 317-321.
Kahneman, D. (2011). Thinking fast and slow. New York: Farrar, Straus and Giroux. Kelman, H. C., & Hovland, C. I. (1953). Reinstatement of the communicator in delayed measurement
of opinion change. Journal of Abnormal and Social Psychology, 48, 327-325. Lev, B., & Penman, S. H. (1990). Voluntary forecast disclosure, nondisclosure and stock prices. Journal
of Accounting Research, 28, 49-76. Levine, T. R., & McCornack, S. A. (1991). The dark side of trust: Conceptualizing and measuring types
of communicative suspicion. Communication Monographs, 39, 325–340. Levine, T. R., Park, H. S., & McCornack, S. A. (1999). Accuracy in detecting truths and lies:
Documenting the “veracity effect”. Communication Monographs, 66, 125–144. Lim, J. S., & O'Connor, M. (1995). Judgmental adjustment of initial forecasts – its effectiveness and
biases. Journal of Behavioral Decision Making, 8, 149–168. Lirtzman, S. I., & Shuv-Ami, A. (1986).Credibility of source communication on products’ safety
hazards. Psychological Reports, 58, 235-244. McKnight, D. H., & Kacmar, C. J. (2007). Factors and effects of information credibility. ICEC’07, August
19-22, Minneapolis, Minnesota, USA. Meyer, M. A., & Booker, J. M. (1991). Eliciting and analyzing expert judgment: a practical guide.
London: Academic Press. Morgan, M. G. (2014). Use (and abuse) of expert elicitation in support of decision making for public
policy. Proceedings of the National Academy of Science USA, 111, 7176–7184. Morgan, M. G., & Henrion, M. (1990). Uncertainty: a guide to dealing with uncertainty in quantitative
risk and policy analysis. Cambridge: Cambridge University Press. Oliver, R. L. (1977). Effect of expectation and disconfirmation on postexposure product evaluations:
an alternative interpretation. Journal of Applied Psychology, 62(4), 480-486. Oliver, R. L. ( 1980). A cognitive model for the antecedents and consequences of satisfaction. Journal
of Marketing Research, 17(4), 460-469. Önkal, D., & Gönül, M. S. (2005). Judgmental adjustment: a challenge for providers and users of
forecasts. Foresight: The International Journal of Applied Forecasting, 1, 13-17. Önkal, D., Gönül, M. S., & Lawrence, M. (2008). Judgmental adjustments of previously-adjusted
forecasts. Decision Sciences, 39(2), 213-238. Önkal, D., Goodwin, P., Thomson, M., Gönül, M. S., & Pollock, A. (2009). The relative influence of
advice from human experts and statistical methods on forecast adjustments. Journal of Behavioral Decision Making, 22, 390–409.
Önkal, D., Sayım, K. Z., & Gönül, M. S. (2013). Scenarios as channels of forecast advice. Technological Forecasting and Social Change, 80, 772-788.

Pornpitakpan, C. (2004). The persuasiveness of source credibility: A critical review of five decades’ evidence. Journal of Applied Social Psychology, 34, 243-281.
Porter, L. W., & Steers, R. M. (1973). Organizational, work, and personal factors in employee turnover and absenteeism. Psychological Bulletin, 80, 151–176.
Rhine, R., & Severance, L. (1970). Ego-involvement, discrepancy, source credibility and attitude change. Journal of Personality and Social Psychology, 16, 175-190.
Rowe, G., Wright, G., & McColl, A. (2005). Judgment change during Delphi-like procedures: The role of majority influence, expertise, and confidence. Technological Forecasting and Social Change, 72, 377-399.
Sah, S., Moore, D. A., & MacCoun, R. J. (2013). Cheap talk and credibility: The consequences of confidence and accuracy on advisor credibility and persuasiveness. Organizational Behavior and Human Decision Processes, 121, 246-255.
See, K. E., Morrison, E. W., Rothman, N. B., & Soll, J. B. (2011). The detrimental effects of power on confidence, advice taking, and accuracy. Organizational Behavior and Human Decision Processes, 116, 272-285.
Sniezek, J. A., & Van Swol, L. M. (2001). Trust, confidence, and expertise in a judge-advisor system. Organizational Behavior and Human Decision Processes, 84, 288-307.
Soll, J. B., & Larrick, R. (2009). Strategies for revising judgment: how (and how well) people use others' opinions. Journal of Experimental Psychology: Learning, Memory and Cognition, 35, 780-805.
Soll, J. B., & Mannes, A. E. (2011). Judgmental aggregation strategies depend on whether the self is involved. International Journal of Forecasting, 21, 81-102
Szajna, B., & Scamell, R. W. (1993). The effects of information system user expectations on their performance and perceptions. MIS Quarterly, 17, 493-516.
Taleb, N. N. (2004) Fooled by randomness. Oakland, CA. Texere. Tetlock, P. E., & Gardner, D. (2015) Superforecasting: the art and science of prediction. London:
Random House Tormala, Z. L., & Clarkson, J. J. (2007). Assimilation and contrast in persuasion: The effects of source
credibility in multiple message situations. Personality and Social Psychology Bulletin, 33, 559- 571.
Tseng, S., & Fogg, B. J. (1999). Credibility and computing technology. Communications of the ACM, 42, 39-44.
U.S. EPA (2009). Expert elicitation task force white paper. Washington, DC: Science and Technology Policy Council. http://www.epa.gov/osa/pdfs/elicitation/Expert_Elicitation_White_Paper- January_06_2009.pdf. Accessed 7 July 2015.
Van Swol, L. M. (2011). Forecasting another's enjoyment versus giving the right answer: Trust, shared values, task effects, and confidence in improving the acceptance of advice. International Journal of Forecasting, 27, 103-120.
Van Swol, L. M., & Sniezek, J. A. (2005). Factors affecting the acceptance of expert advice. British Journal of Social Psychology, 44, 443-461.
Venkatesh, V., & Goyal, S. (2010). Expectation disconfirmation and technology adoption: polynomial modelling and response surface analysis. MIS Quarterly, 34(2), 281-303.
Wathern, C. N., & Burknell, J. (2002). Believe it or not: Factors influencing credibility on the web. Journal of the American Society for Information Science and Technology, 53(2), 134-144.
Willemsen, L. M., Neijens, P. C., & Bronner, F. (2012). The ironic effect of source identification on the perceived credibility of online product reviewers. Journal of Computer-Mediated Communication, 18, 16-31.
Woodside, A. G., & Parrish, J. (1972). Positive disconfirmation of expectation and the effect of effort on evaluation. Proceedings of the Annual Convention of the American Psychological Association, 7(2), 743-744.
Wright, G., Bradfield, R., & Cairns, G. (2013). Does the intuitive logics method – and its recent enhancements – produce “effective” scenarios? Technological Forecasting and Social Change, 80, 631-642.

Wright, G., & Goodwin, P. (2009). Decision making and planning under low levels of predictability: enhancing the scenario method. International Journal of Forecasting, 25, 813-825.
Wright, G., & Rowe, G. (2011). Group-based judgmental forecasting: An integration of extant knowledge and the development of priorities for a new research agenda. International Journal of Forecasting, 27, 1-13.
Xie, H., Miao, L., Kuo, P.-J., & Lee, B.-Y. (2011). Consumers’ responses to ambivalent online hotel reviews: The role of perceived source credibility and pre-decisional disposition. International Journal of Hospitality Management, 30, 178-183.
Yaniv, I. (2004). Receiving other people’s advice: influence and benefit. Organizational Behavior and Human Decision Processes, 93, 1–13.
Yaniv, I., & Kleinberger, E. (2000). Advice taking in decision making: egocentric discounting and reputation formation. Organizational Behavior and Human Decision Processes, 83(2), 260-281.

APPENDIX A
Experiment 1: Experience-building stage.
Experiment 1: Forecasting – judgmental adjustment phase for the practice series.
Cyan marks: participants’ initial predictions Magenta marks: provided forecasting advice Yellow marks: final adjusted forecasts given by participants

APPENDIX B
Experiment 2: Practice series for the low presumed credibility group.
Cyan marks: participants’ initial predictions Magenta marks: provided forecasting advice Yellow marks: final adjusted forecasts given by participants