Journal of Banking and - parsproje.com · [email protected] 1(J. Wang), [email protected]...
16
Journal of Banking and Finance 86 (2018) 37–52 Contents lists available at ScienceDirect Journal of Banking and Finance journal homepage: www.elsevier.com/locate/jbf China’s “Mercantilist” Government Subsidies, the Cost of Debt and Firm Performance Chu Yeong Lim a , Jiwei Wang b,∗ , Cheng (Colin) Zeng c a Singapore Institute of Technology, Singapore b Singapore Management University, Singapore c University of Manchester, UK a r t i c l e i n f o Article history: Received 30 June 2016 Accepted 2 September 2017 Available online 8 September 2017 JEL classification: G32 G38 H25 H71 Keywords: Government subsidies Cost of debt Firm performance a b s t r a c t China has been adopting a “mercantilist” policy by lavishing massive government subsidies on Chinese firms. Using hand-collected subsidy data on Chinese listed companies, we find that firms receiving more subsidies tend to have a lower cost of debt. However, such firms fail to have superior financial perfor- mance. Instead, firms with more subsidies tend to be overstaffed, which demonstrates higher social per- formance. These results are mainly driven by non-tax-based subsidies rather than tax-based subsidies. Overall, our results suggest that the Chinese government uses non-tax-based subsidies to achieve its so- cial policy objectives at the expense of firms’ profitability. © 2017 Elsevier B.V. All rights reserved. 1. Introduction During the past decade of the 21st century, the Chinese econ- omy has grown by leaps and bounds, overtaking the economies of Germany, UK, Japan and other developed countries to become the second largest in the world, with a GDP of 74.4 trillion Chinese yuan (US$10.8 trillion) in 2016, just behind the United States. This Chinese phenomenon has sparked considerable interest among academics and practitioners concerning the factors driving such growth in China’s economy. Instead of the free-market economic model adopted in most developed economies, China has been im- plementing a government-planned economic model, which has so far proven to be a “superior economic model” (Brandt and Rawski, 2008; Grove, 2010; Stern, 2011). One of the key features of the government-planned economic model is that the Chinese govern- The authors acknowledge the invaluable comments received from Carol Alexan- der (the Editor), two anonymous referees, and seminar participants at Renmin Uni- versity of China, Sun Yat-Sen University, and 2016 American Accounting Association Annual Meeting. All remaining errors are our own. ∗ Corresponding author. E-mail addresses: [email protected] (C.Y. Lim), [email protected] (J. Wang), [email protected] (Cheng (Colin) Zeng). ment makes five-year plans and offers favorable policies to spon- sored industries. Government subsidies are a form of policy instrument for the Chinese government to direct financial resources to industries and enterprises that it supports. In response to the government’s sub- sidies for Chinese enterprises, competitors have threatened retal- iation for what they view as unfair trade practices. For example, a report published by the European Council on Foreign Relations claims that Chinese “state-owned enterprises receive massive state subsidies and can therefore compete unfairly with European com- panies” (Godement et al., 2011, p.5). Robert Hormats, the Under Secretary for Economic, Energy and Agricultural Affairs at the U.S. State Department, argued that some “Chinese state-owned enter- prises and state-supported enterprises enjoy financial support, reg- ulatory privileges and immunities not generally available to their privately-owned competitors” (Hormats, 2011). Additionally, in a report issued by the Information Technology and Innovation Foun- dation, Atkinson (2012) stated that “it is time for policymakers in the United States and other countries to begin responding to today’s reality, for Chinese mercantilism represents a fundamental threat to not only the U.S. economy, but to the entire system of market and rules-based globalization”. 1 1 Mercantilism is an economic theory and practice that was dominant in Europe from the 16 th to the 18 th centuries. This practice promotes governmental regulation http://dx.doi.org/10.1016/j.jbankfin.2017.09.004 0378-4266/© 2017 Elsevier B.V. All rights reserved.
Transcript of Journal of Banking and - parsproje.com · [email protected] 1(J. Wang), [email protected]...

Journal of Banking and Finance 86 (2018) 37–52
Contents lists available at ScienceDirect
Journal of Banking and Finance
journal homepage: www.elsevier.com/locate/jbf
China’s “Mercantilist” Government Subsidies, the Cost of Debt and
Firm Performance
�
Chu Yeong Lim
a , Jiwei Wang
b , ∗, Cheng (Colin) Zeng
c
a Singapore Institute of Technology, Singapore b Singapore Management University, Singapore c University of Manchester, UK
a r t i c l e i n f o
Article history:
Received 30 June 2016
Accepted 2 September 2017
Available online 8 September 2017
JEL classification:
G32
G38
H25
H71
Keywords:
Government subsidies
Cost of debt
Firm performance
a b s t r a c t
China has been adopting a “mercantilist” policy by lavishing massive government subsidies on Chinese
firms. Using hand-collected subsidy data on Chinese listed companies, we find that firms receiving more
subsidies tend to have a lower cost of debt. However, such firms fail to have superior financial perfor-
mance. Instead, firms with more subsidies tend to be overstaffed, which demonstrates higher social per-
formance. These results are mainly driven by non-tax-based subsidies rather than tax-based subsidies.
Overall, our results suggest that the Chinese government uses non-tax-based subsidies to achieve its so-
cial policy objectives at the expense of firms’ profitability.
© 2017 Elsevier B.V. All rights reserved.
1
o
G
s
y
C
a
g
m
p
f
2
g
d
v
A
j
Z
m
s
C
e
s
i
a
c
s
p
S
S
p
u
h
0
. Introduction
During the past decade of the 21st century, the Chinese econ-
my has grown by leaps and bounds, overtaking the economies of
ermany, UK, Japan and other developed countries to become the
econd largest in the world, with a GDP of 74.4 trillion Chinese
uan (US$10.8 trillion) in 2016, just behind the United States. This
hinese phenomenon has sparked considerable interest among
cademics and practitioners concerning the factors driving such
rowth in China’s economy. Instead of the free-market economic
odel adopted in most developed economies, China has been im-
lementing a government-planned economic model, which has so
ar proven to be a “superior economic model” ( Brandt and Rawski,
008; Grove, 2010; Stern, 2011 ). One of the key features of the
overnment-planned economic model is that the Chinese govern-
� The authors acknowledge the invaluable comments received from Carol Alexan-
er (the Editor), two anonymous referees, and seminar participants at Renmin Uni-
ersity of China, Sun Yat-Sen University, and 2016 American Accounting Association
nnual Meeting. All remaining errors are our own. ∗ Corresponding author.
E-mail addresses: [email protected] (C.Y. Lim),
[email protected] (J. Wang), [email protected] (Cheng (Colin)
eng).
p
r
d
i
t
t
m
f
ttp://dx.doi.org/10.1016/j.jbankfin.2017.09.004
378-4266/© 2017 Elsevier B.V. All rights reserved.
ent makes five-year plans and offers favorable policies to spon-
ored industries.
Government subsidies are a form of policy instrument for the
hinese government to direct financial resources to industries and
nterprises that it supports. In response to the government’s sub-
idies for Chinese enterprises, competitors have threatened retal-
ation for what they view as unfair trade practices. For example,
report published by the European Council on Foreign Relations
laims that Chinese “state-owned enterprises receive massive state
ubsidies and can therefore compete unfairly with European com-
anies” ( Godement et al., 2011 , p.5). Robert Hormats, the Under
ecretary for Economic, Energy and Agricultural Affairs at the U.S.
tate Department, argued that some “Chinese state-owned enter-
rises and state-supported enterprises enjoy financial support, reg-
latory privileges and immunities not generally available to their
rivately-owned competitors” ( Hormats, 2011 ). Additionally, in a
eport issued by the Information Technology and Innovation Foun-
ation, Atkinson (2012) stated that “it is time for policymakers
n the United States and other countries to begin responding to
oday’s reality, for Chinese mercantilism represents a fundamental
hreat to not only the U.S. economy, but to the entire system of
arket and rules-based globalization”. 1
1 Mercantilism is an economic theory and practice that was dominant in Europe
rom the 16 th to the 18 th centuries. This practice promotes governmental regulation

38 C.Y. Lim et al. / Journal of Banking and Finance 86 (2018) 37–52
e
n
e
c
s
a
g
r
o
fi
S
s
h
p
a
2
o
a
l
C
b
a
p
t
g
d
“
c
e
S
g
t
(
t
a
m
m
t
a
C
k
i
G
i
c
g
t
m
u
j
t
o
fi
This paper examines how government subsidies affect a firm’s
cost of debt and its subsequent performance. Prior studies have in-
vestigated the relationships between cost of debt and various po-
litical factors, including political connections ( Li et al., 2008 ), polit-
ical rights ( Qi et al., 2010 ), state ownership ( Borisova and Meggin-
son, 2011; Borisova et al., 2015 ), policy risk ( Bradley et al., 2016 )
and national five-year plans ( Chen et al., 2013 ). However, as far as
we are aware, there have been very few studies that specifically
examine how government subsidies affect a firm’s cost of debt.
This is largely because the firm-level subsidy data is not publicly
available in most countries. Our study overcomes this obstacle by
using a unique set of hand-collected data on Chinese government
subsidies, and contributes to the literature on the economic conse-
quences of government subsidies.
We first investigate the effect of government subsidies on firms’
cost of debt. On the one hand, subsidies may lead to higher cost of
debt, if they create moral hazards for managers who wish to ac-
cumulate more cash than necessary through taking excess loans
and therefore incurring higher cost of debt. On the other hand,
subsidies may lead to lower cost of debt if the subsidies serve
as a substitute for more expensive debt financing. Lenders often
view subsidies as either explicit or implicit government guaran-
tees, which reduce the probability of default by the borrowers. In
addition, subsidies may result in increased cash flows that benefit
debt-holders more than equity holders, because debt-holders are
the first claimants upon the dissolution of a firm. Taken altogether,
the association between subsidies and the cost of debt remains an
empirical question.
Our results lend support to the latter argument that subsidies
are beneficial to firms by reducing their cost of debt. However,
such benefit appears not to translate into superior financial per-
formance. We find that government subsidies are not significantly
associated with Tobin’s Q, contradicting the widespread belief that
subsidies are an extra source of income to the recipient firms,
which can boost their financial performance and encourage them
to engage in unfair competition. Instead, we find a negative asso-
ciation between government subsidies and firms’ operating prof-
itability. We believe that this lack of improvement in financial per-
formance is partly because subsidies can encourage managers to
become complacent, which may in turn lead to lower efficiency
and wasted resources. In the subsequent analysis, we also find that
firms receiving more subsidies are more likely to be overstaffed,
consistent with Chinese government imposing unprofitable social
and political goals on recipient firms, which impair the firms’ prof-
itability.
Government subsidies granted to Chinese firms are typically
provided in two forms: tax-based and non-tax-based subsidies. The
government offers tax-based subsidies to firms that fulfill estab-
lished criteria, which are based on the national industrial or re-
gional development policies. While local governments used to ex-
tensively offer tax incentives to subsidize the local firms, this has
been abolished since 2007 ( Lee et al., 2017 ). As a result, the deci-
sions to offer tax incentives are largely concentrated in the hands
of the central government, and the local governments have to re-
sort to non-tax-based subsidies, including direct financial support
to firms. In general, non-tax-based subsidies are granted on a more
subjective basis, and such subsidies are prone to the influence of
political connections or government officials’ discretion ( Lee et al.,
2014 ). Consistent with these arguments, we find that non-tax-
based subsidies have a greater influence on the cost of debt and
social performance than do tax-based subsidies.
of a nation’s economy to augment state power at the expense of rival national pow-
ers. Common mercantilist policies include high tariffs and government subsidies on
domestic manufacturing and exports.
v
t
a
s
P
One concern in our study is that our results may be affected by
ndogeneity because government subsidies are likely to be endoge-
ous to other firm characteristics that could simultaneously influ-
nce the cost of debt and firm performance. To alleviate this con-
ern, we apply a two-stage least squares regression and a propen-
ity score matching approach. Our findings remain qualitatively un-
ffected.
Finally, we provide evidence on the heterogeneous effects of
overnment subsidies on cost of debt and firm performance. Our
esults show that the negative (positive) effect of subsidies on cost
f debt (overstaffing) is moderated among politically connected
rms and loss-making firms.
The remaining sections of the paper are organized as follows.
ection 2 describes the institutional setting of China’s government
ubsidies. In Section 3 , we review the literature and develop the
ypotheses. We explain the research design and describe the sam-
le and data in Sections 4 and 5 , respectively. The empirical results
re described in Sections 6 , and 7 concludes.
. China’s “mercantilist” government subsidies
In recent years, the Chinese government has been accused of
ffering numerous subsidies that result in an unfair competitive
dvantage for Chinese firms in the global market. Haley and Ha-
ey (2013) conservatively estimate that between 1985 and 2005,
hina spent over $300 billion (in nominal terms) to support the
iggest state-owned enterprises (SOEs). They also estimate the
mounts of subsidies to some key industries. For example, auto-
arts businesses received subsidies worth $28 billion from 2001
o 2011 in the form of heavily subsidized inputs such as low-cost
lass, steel and technology. The government has promised an ad-
itional $10.9 billion in subsidies to this industry by 2020. China’s
mercantilist” policy on government subsidies has also been criti-
ized by international politicians and think-tanks (e.g., Godement
t al., 2011; Hormats, 2011; Atkinson, 2012 ). Recently, the United
tates challenged the Chinese government in the World Trade Or-
anization (WTO) over its extensive export subsidy program, given
hat WTO rules prohibit members from offering export subsidies
Donnan and Hornby, 2015 ). As Rodrik (2013) commented, “Al-
hough China phased out many of its explicit export subsidies as
condition of membership in the WTO (which it joined in 2001),
ercantilism ’s support system remains largely in place.”
Government subsidies have been used as a policy tool by
any countries. From an economic perspective, there are at least
hree reasons why governments may decide to use subsidies as
policy instrument (see the literature review in Schwartz and
lements, 1999 ). Governments use subsidies to offset various mar-
et imperfections , because the “invisible hand” of the free market
s not sufficient to allocate resources in the most efficient way.
overnments may also use subsidies to obtain economies of scale
n production if some important industries are small in scale, and
annot compete with larger and more mature competitors in the
lobal market. The third reason could be that governments attempt
o use subsidies to accomplish their social policy objectives , such as
ore equitable distributions of consumption or income, or a lower
nemployment rate.
The Chinese government has sought to achieve all of these ob-
ectives by offering massive subsidies to favored industries and en-
erprises. Allen et al. (2005) suggest that government subsidies are
ne of the four most important sources of financing for Chinese
rms, along with bank loans, self-funding and foreign direct in-
estment. Chinese government subsidies are pervasive and persis-
ent, because China’s industrial development is directed and man-
ged by the central government through its five-year plans, which
tarted in 1953. Issued by the Central Committee of the Communist
arty of China and approved by China’s National People’s Congress,

C.Y. Lim et al. / Journal of Banking and Finance 86 (2018) 37–52 39
t
o
b
1
r
a
c
b
S
h
l
h
o
m
v
m
b
t
p
t
a
i
g
m
L
s
C
s
t
r
s
r
s
d
i
l
s
t
s
d
f
“
t
i
2
c
s
t
s
o
b
a
t
d
C
s
s
t
m
a
t
o
c
d
e
e
C
m
b
s
v
3
C
i
t
k
s
i
a
b
f
G
fi
t
b
t
fi
n
t
i
t
d
t
i
t
c
g
m
e
m
t
c
T
g
c
o
o
p
w
m
h
t
he five-year plans establish the broad parameters of the econ-
my, defining which industries, enterprises and products should
e targeted for preferential government support. For example, the
2th Five-Year Plan, covering 2011 to 2015, proposed to address
ising inequality and create an environment for greater sustain-
ble growth by prioritizing more equitable wealth distribution, in-
reased domestic consumption, improved social infrastructure and
etter social safety nets ( KPMG, 2011 ).
Both the central and local governments may subsidize firms.
ince the 1980s, the authority for allocating government subsidies
as been increasingly delegated to local governments. Although the
ocal governments are guided by central government policies, they
ave been given considerable discretion to determine the amounts
f subsidies granted to firms. The rationale is that the local govern-
ents have greater awareness concerning their own regions’ de-
elopment needs than the central government. The central govern-
ent then evaluates the performance of local government officials,
ased on the economic and social performance of local firms in
heir respective regions. This mode of performance evaluation, cou-
led with the delegation of authority to local governments, leads
o competition among the local officials to boost economic growth,
nd to do this by assisting both firms in distress and promis-
ng firms by offering them subsidies. The government subsidies
ranted to listed firms in distress can also contribute to earnings
anipulation as these firms seek to avoid delisting (e.g., Chen and
i, 2001; Chen et al., 2008; Zhu and Chen, 2009 ).
Government subsidies are provided in various forms. All of the
even types of government subsidies categorized by Schwartz and
lements (1999) have been used by the Chinese government to
upport various industries. 2 For example, the subsidies granted to
he steel industry include direct cash grants, energy and raw mate-
ial grants, land grants, credit subsidies in the form of debt-equity
waps, debt forgiveness, tax incentives, preferential loans and di-
ected credit from state-owned banks ( Price et al., 2006 ). Most
ubsidies are reported quite openly, but the total amount of subsi-
ies is unobservable, because a fraction of the subsidies is granted
n the form of non-monetary supports such as price subsidies or
and grants, which typically go unreported in company financial
tatements. Hence, our subsidy variables are likely to be underes-
imated, which could induce a bias against finding significant re-
ults. In other words, we would probably find greater use of subsi-
ies without the downward bias in the means of measurement.
In the Chinese context, our research focuses on the observable
orms of government subsidies, which have been reported under
other income” in the firms’ financial statements since 2007. Prior
o 2007, subsidies were reported as a separate line item in the
ncome statements. According to prior literature ( Zou and Adams,
008; Lee et al., 2014; 2017 ), China’s government subsidies can be
lassified into two broad categories: tax-based and non-tax-based
ubsidies. The tax-based subsidies are generally offered in response
o China’s industrial and regional development policies. These sub-
idies are often given to firms located in special economic zones,
r those that invest in projects and/or operate in sectors favored
y the government. In general, tax-based subsidies are granted on
less subjective basis, as their allocation must be anchored on es-
ablished guidelines and policies. In contrast, non-tax-based subsi-
ies are granted more subjectively, at the discretion of government
2 The seven categories of government subsidies given by Schwartz and
lements (1999) are direct government payments to producers or consumers (cash
ubsidies), government guarantees and interest subsidies to enterprises (credit sub-
idies), reductions of specific tax liabilities (tax subsidies), government equity par-
icipation (equity subsidies), government provisions of goods and services at below-
arket prices (in-kind subsidies), government purchases of goods and services at
bove-market prices (procurement subsidies) and government regulatory actions
hat change market prices or market access (regulatory subsidies).
o
o
f
h
a
o
v
i
a
fficials, and these subsidies are subject to the influence of politi-
al connections. Lee et al. (2014) use both interviews and archival
ata to reveal that Chinese tax-based subsidies are more transpar-
nt than non-tax-based subsidies.
The criticisms of Chinese government subsidies motivate us to
xamine the economic consequences of the subsidies received by
hinese listed firms. Our study aims to investigate how govern-
ent subsidies affect firms’ cost of debt and firm performance in
oth financial and social terms. We also inquire if the tax-based
ubsidies and non-tax-based subsidies have different effects, by
irtue of their different nature.
. Prior literature and hypotheses development
Debt financing is crucial to the development and growth of
hinese firms. Allen et al. (2005) find that the Chinese bank-
ng sector (which is predominantly state-owned) is much larger
han its financial market, and this dominance of banks over mar-
ets is greater than in many Western countries. Although non-
tate firms are typically discriminated against by the state bank-
ng sector, there are alternative channels for debt financing such
s the non-state banking sector, venture capital, or reputation-
ased and relationship-based financing. The use of alternative in-
ormal financing channels may help to explain the findings of
uariglia et al. (2011) that non-state firms do not experience ef-
ciency losses from credit constraints in the formal banking sec-
or. However, Ayyagari et al. (2010) find that Chinese firms with
ank financing grow faster than firms without bank financing, and
hese authors question whether reputation- and relationship-based
nancing is responsible for the performance of the fastest-growing
on-state firms in China. Furthermore, Chen et al. (2013) show that
he firms in government-supported industries enjoy faster growth
n equity and debt financing, with lower cost of capital than firms
hat are not in government-supported industries. These studies
emonstrate that debt financing is crucial to Chinese firms, and
hat government support can influence the terms of debt financ-
ng. These findings provide us with a reason to study the effects
hat subsidies (as a form of government support) have on firms’
ost of debt, and consequently on firm performance.
We draw on the prior literature concerning various forms of
overnment support to hypothesize how government subsidies
ay affect both the cost of debt and firm performance. Gov-
rnment support may provide either explicit or implicit govern-
ent guarantees to creditors, because governments are reluctant
o allow the companies they support to default, which would
ause unemployment and loss of control over vital industries.
herefore, debt-holders expect governments to bail out struggling
overnment-supported companies, which could result in a lower
ost of debt. Borisova and Megginson (2011) examine government
wnership as a means of government support. They find that
n average, across 60 European partially privatized SOEs, a one-
ercentage-point decrease in government ownership is associated
ith an increase of three-quarters of a basis point in credit spread.
In contrast, Stiglitz (1993) warns that the reluctance of govern-
ents to allow firms to fail is likely to increase managerial moral
azard. Borisova et al. (2015) use a sample of 43 countries and find
hat government ownership is positively associated with the cost
f debt in non-crisis years, but negatively associated with the cost
f debt in crisis years. They argue that there are two opposing ef-
ects of government ownership on the cost of debt. On the one
and, government ownership leads to managerial moral hazard
nd reduces investor monitoring. On the other hand, government
wnership offers implicit guarantees that the government will pro-
ide support to avoid firm insolvencies, for the sake of maintain-
ng social and political stability. During the non-crisis period, man-
gerial moral hazard dominates over the government guarantees
40 C.Y. Lim et al. / Journal of Banking and Finance 86 (2018) 37–52
t
p
c
i
l
l
a
o
m
t
c
j
v
v
p
p
v
p
i
m
d
t
e
a
t
fi
s
t
w
f
4
4
t
C
p
A
r
b
s
s
a
t
b
S
t
a
r
f
3 We exclude credit subsidies from the total amounts of government subsidies
because credit subsidies are closely related to cost of debt. Our results are qualita-
tively the same when we include all subsidies in the empirical tests.
effect. However, during the crisis period, the government guar-
antees become relatively more important in reducing the cost of
debt.
We view government subsidies as a substitute form of govern-
ment support or ownership, and we apply the same argument con-
cerning the effects of government subsidies on the cost of debt.
Hence, there may be two major effects of government subsidies on
the cost of debt. Government subsidies provide financial support to
recipient firms, and could be regarded as government guarantees
by creditors. Hence firms with more government subsidies may
have a lower cost of debt. However, creditors may be concerned
that government subsidies will increase managerial moral hazard
through complacency on the part of firm managers, who may ag-
gressively take on greater debt and mismanage their firms. Both
the moral hazard and increased leverage can enhance the possi-
bility of firm default, and consequently debt investors may charge
firms that receive subsidies higher rates for debt. Moreover, subsi-
dies imply greater policy risks, as the recipient firms have to re-
spond to the needs of the governments that provide them with
those subsidies. Greater policy risks can lead to a higher cost of
debt for the firm concerned ( Bradley et al., 2016 ). Our null hypoth-
esis, therefore, is formulated as follows:
H1a: Government subsidies have no effect on firms’ cost of debt
Following Lee et al. (2014) , we identify two main forms of gov-
ernment subsidies: tax-based and non-tax-based subsidies. Tax-
based subsidies are granted for the industrial sectors or projects fa-
vored by the government, according to prescribed tax policies and
regulations. Firms have little discretion on how these tax-based
subsidies are granted. Thus, there is a low probability of obtain-
ing tax-based subsidies through political favoritism or other oppor-
tunistic channels. Also, investors may not view tax-based subsidies
as signals of implicit government guarantees. The interview find-
ings of Lee et al. (2014) reveal that tax-based subsidies are granted
on a more objective basis, and are less likely to be influenced by
the discretion of government officials.
Non-tax-based subsidies, however, are subject to greater discre-
tion than tax-based subsidies. This increased discretion leads to
greater moral hazard and a higher possibility of wasteful activities.
Consequently, greater non-tax-based subsidies could imply more
political favoritism and enhanced government support or guaran-
tees for the firms receiving such subsidies. One of the comments
highlighted by Lee et al. (2014) is that “because the fiscal resources
of local governments can be limited, firms eligible for non-tax sub-
sidies must be further selected and this process can involve a cer-
tain degree of subjectivity.” Whether the effects of non-tax-based
subsidies and tax-based subsidies on the cost of debt are similar is
an empirical question. Our null hypothesis is as follows:
H1b: Tax-based and non-tax-based subsidies have no differential
effects on firms’ cost of debt.
Firm performance is a function of the firm managers’ ability to
run their firms efficiently and profitably, according to the available
investment opportunities and financing cost. There may be oppos-
ing effects of subsidies on firm performance.
Government subsidies are a direct form of support that the
government provides to recipient firms. The competitors of Chi-
nese firms allege that government subsidies provide China-based
firms with an unfair competitive advantage ( Schuman, 2012 ). If
government subsidies are utilized well by the recipient firms, as
means to improve their operational processes, to enhance their re-
search and development capabilities, or to upgrade their market-
ing strategies, then these subsidies would lead to improved firm
performance. Jacob et al. (2016) find that fund performance de-
creased substantially following the phase-out of tax subsidies for
Canadian Labor-Sponsored Venture Capital Corporations, indicating
hat government subsidies in Canada has a positive effect on firm
erformance. In addition, if government subsidies result in a lower
ost of debt, then the savings in interest and reduced cost of rais-
ng capital should also have a positive impact on firm performance.
However, if government subsidies create moral hazards and
ead to complacency on the part of managers, such subsidies may
ead to worsened firm performance. This theory follows prior liter-
ture, which suggests a positive relationship between government
wnership and cost of debt, due to managerial moral hazard and
onitoring gaps ( Borisova et al., 2015 ). Another possibility is that
here may be conditions attached to the subsidies. The firms re-
eiving subsidies may be obligated to fulfill social and political ob-
ectives imposed by the Chinese government, for example, by pro-
iding greater employment to the community or protecting the en-
ironment. These objectives may reduce firm efficiency and lead to
oorer firm performance. We therefore state the second null hy-
othesis as follows.
H2a: Government subsidies have no effect on firm performance
Lee et al. (2014) find that tax-based subsidies are more
alue-relevant than non-taxed-based subsidies, because “the trans-
arency of tax based subsidies renders them more predictable to
nvestors, which in turn facilitates the incorporation of this infor-
ation into their valuation decisions.” However, tax-based subsi-
ies do not contribute toward the firms’ operating profits before
ax. Hence, a reduction in taxes through tax-based subsidies is not
xpected to cause better firm performance (as measured by oper-
ting profit before tax) even though tax-based subsidies increase
he net income after tax. Whether tax-based subsidies improve
rm performance depends on how the managers use the saved re-
ources in their firms’ operations. The same argument applies to
he non-tax-based subsidies. Hence, it is of interest to investigate
hether tax-based and non-tax-based subsidies have different ef-
ects on firm performance. This leads to the following hypothesis:
H2b: Tax-based and non-tax-based subsidies have no differential
effects on firm performance.
. Research design
.1. Government subsidies and firms’ cost of debt
We estimate the following equation to test the relationship be-
ween government subsidies and the cost of debt:
O D i,t+1 = α + β1 Subsidy i,t +
∑
Control v ariables i,t + ε i,t (1)
In Eq. (1) , i and t denote firm and year, respectively. The de-
endent variable is the cost of debt ( COD ). Following Zou and
dams (2008) , we measure the cost of debt as interest expenses
eported in the income statement plus capitalized interest, scaled
y total debt. The independent variable of interest is government
ubsidies, which includes total subsidies ( SUB ), non-tax-based sub-
idies ( NTSUB ) and tax-based subsidies ( TSUB ). SUB is calculated
s the sum of subsidies excluding credit subsidies, scaled by to-
al assets. 3 NT SUB ( T SUB ) is calculated as the non-tax-based (tax-
ased) subsidies excluding credit subsidies, scaled by total assets.
pecifically, the tax-based subsidies include the rebates of various
axes, such as the value-added tax, consumption tax or export tax,
nd the non-tax-based subsidies are largely provided through di-
ect cash grants or debt forgiveness.
We follow prior research by including several determinants
or cost of debt. Larger firms generally have lower default risk,

C.Y. Lim et al. / Journal of Banking and Finance 86 (2018) 37–52 41
a
(
c
u
o
a
b
t
s
i
d
i
c
fi
e
m
fi
s
e
s
t
m
i
i
S
i
L
d
o
o
C
c
w
B
o
v
w
i
a
c
e
t
a
p
o
p
i
b
t
a
4
p
P
w
a
p
i
v
t
i
s
f
n
m
C
m
f
n
r
e
p
2
p
(
w
E
w
S
a
b
i
a
s
a
b
t
c
a
m
f
a
a
r
p
l
d
o
s
r
h
t
e
(
t
i
e
t
b
t
b
s
o
g
R
4 The Sinopec Shanghai Petrochemical Company Limited employed 38,0 0 0 people
for its core business in 1998. When it attempted to lay off more than 17,0 0 0 em-
ployees in subsequent years, its government shareholder prevented the layoffs, and
forced the firm to seek alternative solutions.
nd therefore may bear lower interest costs than smaller firms
Petersen and Rajan, 1994 ). Thus, firm size ( SIZE ) is included as a
ontrol variable. The pre-subsidy return on assets ( PROA ) can be
sed to proxy for earnings management incentives. A higher value
f PROA is indicative of a lower likelihood of earnings management,
nd hence a lower cost of debt. PROA is calculated as the difference
etween net income and total government subsidies, scaled by to-
al assets. Moreover, we control for capital structure, which is mea-
ured as the ratio of total debt to total assets ( LEV ). Higher borrow-
ngs may indicate that the borrower can finance with lower cost of
ebt. On the other hand, higher leverage beyond a certain level
ncreases default risk and cost of debt. The effect of LEV on the
ost of debt is therefore an empirical question. In addition, younger
rms tend to be riskier and have a higher rate of failure than long-
stablished firms ( Leeth and Scott, 1989 ). As a result, younger firms
ay have higher cost of debt than mature firms. We measure the
rm age ( AGE ) using the natural logarithm of the number of years
ince the firm’s inception.
As Zou and Adams (2008) indicate, the influence of state own-
rship on the cost of debt is unknown ex ante . On the one hand,
tate ownership may expose lenders to higher credit risks, and
herefore the lenders may require a higher interest rate than nor-
al. On the other hand, a government shareholder may use its
nfluence to help a firm secure favorable bank loans. Hence, we
nclude state ownership ( SOE ) as a control variable in the model.
OE is a dummy variable, which takes the value of 1 if the firm
s ultimately controlled by government agencies and 0 otherwise.
ikewise, we control for political connection ( POLICON ), which is a
ummy variable that equals 1 if the CEO or chairman is a current
r former (1) government official, (2) military official, (3) member
f the People’s Congress or (4) member of the People’s Political
onsultative Conference.
Firms with more tangible assets may be able to provide more
ollateral, which reduces the risk faced by the lenders. Therefore,
e expect an inverse relation between tangible assets ratio ( TANGI-
LE ) and cost of debt. We define tangible asset intensity as the sum
f fixed assets and inventory, scaled by total assets. In the same
ein, sales growth ( SG ) is also expected to be negatively associated
ith the cost of debt ( Petersen and Rajan, 1994 ). The sales growth
s computed as the year-on-year growth in sales revenue. Addition-
lly, firms with a higher interest coverage ratio ( COVER ) are more
apable of repaying their debts than those with lower interest cov-
rage. The interest coverage ratio is defined as earnings before in-
erest and tax ( EBIT ) divided by interest charges.
Corporate governance is also an important factor in determining
firm’s cost of debt. Anderson et al. (2004) find that board inde-
endence and board size are negatively associated with the cost
f debt, because these corporate governance mechanisms may im-
rove the transparency of financial information. Board size ( BSIZE )
s measured as the natural logarithm of the number of board mem-
ers, and board independence ( INDPT ) is calculated as the propor-
ion of independent directors on a board. The variable definitions
re provided in Appendix 1 .
.2. Government subsidies and firm performance
To further examine the effect of government subsidies on firm
erformance, we estimate the following equation:
ER F i,t+1 = α + β1 Subsidy i,t +
∑
Control v ariables i,t + ε i,t (2)
here three measures are used to proxy for firm performance vari-
bles, including Q, OPROFIT and EXC_EMP. Q is widely used in the
rior literature to measure market performance, and this variable
s calculated as follows: (market value of common equity + book
alue of long-term debt and current liabilities) / book value of to-
al assets. OPROFIT is a commonly used measure for financial prof-
tability, which is calculated as operating profit divided by total as-
ets. The OPROFIT measure may also eliminate the potential con-
ounding effect of government subsidies, which are reported as
on-operating profit in a firm’s income statements. EXC_EMP is a
easure of excess employment.
It has been well recognized in the prior literature that despite
hina’s move toward a market-oriented economy, local govern-
ent officials still have strong incentives to boost employment by
orcing local enterprises to limit layoffs and increase job opportu-
ities. The reason for these incentives is that social harmony and
egional employment remain the primary objectives of local gov-
rnments, and improvements in these areas constitute important
romotion criteria for local officials ( Lin and Li, 2004; Chen et al.,
013 ). This pattern of incentives is corroborated by the example
rovided by Tian and Estrin (2008) . 4 Following previous literature
Zeng and Chen, 2006; Chen et al., 2013; Wang and Wang, 2013 ),
e use the following model to estimate excess employment:
MP i,t = α + β1 SIZE i,t + β2 AG i,t + β3 SG i,t + β4 F A i,t + ε i , (3)
here EMP is the number of employees divided by total assets,
IZE is the logarithm of total assets, AG is the growth ratio of total
ssets, SG is the growth ratio of sales, and FA is fixed assets divided
y total assets. We estimate the above cross-section regression by
ndustry-year with at least 10 observations. The estimated residu-
ls are our proxy for excess employment.
The main independent variable in Eq. (2) is also government
ubsidies, as defined in Eq. (1) . We include a few control vari-
bles which may also affect firm performance. Firm size ( SIZE ) has
een shown to be an important determinant of performance. On
he one hand, large firms have specialized managerial and finan-
ial resources, and they enjoy economies of scale in production
nd greater formation. On the other hand, large firms tend to have
ore layers of management and long-standing barriers between
unctional departments. Therefore, the relation between firm size
nd performance is not clear. Firm age ( AGE ) is also regarded as
critical factor affecting performance. As George (2005) indicates,
esource slack is time-dependent in both its accumulation and de-
loyment, so that younger firms have less slack than more estab-
ished firms. This situation puts the more established firms at a
isadvantage in terms of future performance.
Capital structure ( LEV ) is another widely accepted determinant
f firm performance. On the one hand, debt financing exerts pres-
ure on managers to perform, thereby reducing the moral hazard-
elated activities of managers ( Jensen, 1986 ). On the other hand,
igher leverage means higher agency cost due to divergence of in-
erests between shareholders and debt-holders. Thus, the overall
ffect of leverage on firm performance remains unknown.
Trueman (1986) suggests that the level of capital expenditure
CAPX ) may serve to signal information about a project’s future re-
urns, with a higher level of expenditure signaling more favorable
nformation. Thus, we expect a positive relation between capital
xpenditure and firm value. We define the capital expenditure in-
ensity as the annual expenditure in acquiring fixed and intangi-
le assets, divided by total assets. Similarly, as faster growing firms
end to have higher valuation, we also expect a positive relation
etween sales growth ( SG ) and firm value.
Wei et al. (2005) document a negative association between
tate ownership ( SOE ) and firm value. In addition the influence
f political connections ( POLICON ) on firm performance is contin-
ent on which measure of performance is used. Using ROA and
OE as the performance measures, Li et al. (2008) find evidence
42 C.Y. Lim et al. / Journal of Banking and Finance 86 (2018) 37–52
Table 1
Sample selection.
Panel A: Sample selection process Observations
Initial firm-year sample 9312
Less:
Observations with missing total or classified subsidies 1692
Observations with missing values on cost of debt 754
Observations with missing values on other variables 2713
Final sample 4153
Panel B: Distribution of firm-years by industry
Industry CSRC code # of firm-years % of subsidized firm-years
Agriculture, forestry & fishery A 87 95.40
Mining B 117 80.34
Food & drink C0 178 92.13
Textiles & apparel C1 149 89.93
Timber & furnishings C2 8 10 0.0 0
Paper & printing C3 64 89.06
Petrochemicals C4 420 93.10
Electronics C5 184 97.81
Metals & non-metals C6 380 90.53
Machinery C7 637 92.46
Pharmaceuticals C8 273 93.77
Other manufacturing C9 24 83.33
Utilities D 237 82.70
Construction E 80 86.25
Transportation F 176 72.73
Information technology G 199 93.97
Wholesale & retail trade H 321 80.06
Real estate J 356 60.67
Social services K 50 66.00
Communication & culture L 50 94.00
Comprehensive M 163 88.96
Total 4153 86.64
Table 2
Summary statistics this table presents summary statistics of vari-
ables used in the main analyses. The variables are defined in
Appendix 1 . All variables except dummy variables are winsorized at
the 1% and 99% levels.
Mean Std. p25 p50 p75
COD t + 1 0.093 0.116 0.048 0.068 0.095
Q t + 1 1.954 1.217 1.213 1.540 2.191
OPROFIT t + 1 0.026 0.070 0.005 0.028 0.059
EXC_EMP t + 1 0.244 0.567 0.0 0 0 0.0 0 0 0.181
SUB t 0.004 0.008 0.0 0 0 0.002 0.005
NTSUB t 0.004 0.007 0.0 0 0 0.001 0.004
TSUB t 0.001 0.003 0.0 0 0 0.0 0 0 0.0 0 0
SIZE t 21.951 1.228 21.096 21.859 22.698
ROS t 0.0 0 0 0.0 0 0 0.0 0 0 0.0 0 0 0.0 0 0
PROA t 0.025 0.064 0.007 0.027 0.052
LEV t 0.232 0.151 0.113 0.218 0.331
COVER t 6.325 53.400 2.4 4 4 5.185 11.536
TANGIBLE t 0.462 0.180 0.331 0.463 0.595
SG t 19.311 39.320 0.632 14.486 31.375
CAPX t 0.319 0.204 0.159 0.294 0.464
AGE t 15.663 4.235 12.0 0 0 15.0 0 0 18.0 0 0
POLICON t 0.172 0.377 0.0 0 0 0.0 0 0 0.0 0 0
SOE t 0.659 0.474 0.0 0 0 1.0 0 0 1.0 0 0
BSIZE t 2.201 0.204 2.197 2.197 2.303
INDPT t 0.365 0.050 0.333 0.333 0.375
t
t
D
d
fi
b
e
b
v
f
s
p
o
t
y
5
t
s
c
p
e
t
(
S
s
w
o
m
that political connections tend to enhance firm value. However,
drawing on market measures of performance such as stock returns,
Fan et al. (2007) find that political connections destroy firm value
for IPO firms. Both state ownership and political connection are
included to control for the effects of government intervention on
firm performance.
Finally, we consider the influence of board attributes on
firm performance. In particular, the board size ( BSIZE ) effect has
been widely discussed in prior literature. There are two oppos-
ing views. Some studies find that as the board size increases,
here are greater difficulties with communication and coordina-
ion, which can limit firm value ( Eisenberg et al., 1998 ). However,
alton et al. (1999) conduct a meta-analysis of 131 firms which
ocuments a significantly positive relation between board size and
nancial performance. In addition, board independence ( INDPT ) is
elieved to have an effect on firm performance (e.g., Baysinger
t al., 1985; Rosenstein and Wyatt, 1990; Dalton et al., 1999 ). Thus,
oth board size and board independence are included as control
ariables.
To address the potential reverse causality issues that could arise
rom estimating a contemporaneous relation between government
ubsidies and the dependent variables, we apply a lead-lag ap-
roach in which the dependent variables in Eqs. (1) and (2) are
ne year ahead of the independent and control variables. In addi-
ion, to control for year and industry fixed effects, we include the
ear and industry dummy variables.
. Sample and data
We manually collect data on government subsidies, including
he total subsidies, credit subsidies, tax-based and non-tax-based
ubsidies. In addition, the data on political connections and the
haracteristics of provincial leaders are hand-collected from multi-
le sources, including annual reports and the websites of local gov-
rnments. The remaining data used in this study are obtained from
he China Securities Markets and Accounting Research Database
CSMAR).
We begin our sample selection with all firms listed on the
hanghai and Shenzhen stock exchanges from 2007 to 2011. Our
ample period begins in 2007 because this was the first year in
hich all Chinese listed firms were mandated to adopt a new set
f accounting standards under which the recognition and measure-
ent of government subsidies are different from those under the
C.Y. Lim et al. / Journal of Banking and Finance 86 (2018) 37–52 43
o
d
a
O
s
u
o
a
v
s
i
u
h
i
(
T
p
(
t
s
a
0
a
T
o
fi
6
6
f
fi
t
I
c
S
o
l
w
b
h
t
a
t
c
a
c
s
d
m
f
t
i
r
a
w
a
c
t
Table 3
Government subsidies and the cost of debt this table presents OLS re-
gression results regarding the effect of government subsidies in year t
on cost of debt in year t + 1. The variables are defined in Appendix 1 .
All variables except dummy variables are winsorized at the 1% and
99% levels. The numbers reported in parentheses are t -statistics cor-
rected for heteroskedasticity and clustered by firm. ∗∗∗ , ∗∗ and ∗ in-
dicate significant differences at the 1%, 5% and 10% levels, based on
two-tailed t -tests.
Dependent = COD t + 1
(1) (2) (3) (4)
SUB t −0.622 ∗∗
( −2.442)
NTSUB t −0.653 ∗∗ −0.641 ∗∗
( −2.113) ( −2.074)
TSUB t −0.830 ∗ −0.752
( −1.656) ( −1.502)
SIZE t −0.0 0 0 −0.0 0 0 −0.0 0 0 −0.0 0 0
( −0.052) ( −0.028) ( −0.019) ( −0.049)
PROA t −0.246 ∗∗∗ −0.248 ∗∗∗ −0.231 ∗∗∗ −0.247 ∗∗∗
( −5.002) ( −4.980) ( −4.829) ( −4.964)
LEV t −0.127 ∗∗∗ −0.127 ∗∗∗ −0.124 ∗∗∗ −0.127 ∗∗∗
( −5.199) ( −5.206) ( −5.136) ( −5.203)
AGE t 0.001 0.001 0.001 0.001
(1.041) (1.093) (1.030) (1.033)
SOE t −0.003 −0.003 −0.003 −0.003
( −0.539) ( −0.571) ( −0.587) ( −0.541)
POLICON t −0.005 −0.005 −0.005 −0.005
( −1.046) ( −1.092) ( −1.086) ( −1.040)
TANGIBLE t −0.016 −0.016 −0.017 −0.016
( −0.940) ( −0.945) ( −1.003) ( −0.941)
SG t −0.0 0 0 −0.0 0 0 −0.0 0 0 −0.0 0 0
( −0.595) ( −0.754) ( −0.470) ( −0.551)
COVER t 0.0 0 0 0.0 0 0 0.0 0 0 0.0 0 0
(0.827) (0.859) (0.823) (0.823)
BSIZE t −0.0 0 0 −0.0 0 0 0.0 0 0 0.0 0 0
( −0.013) ( −0.033) (0.039) (0.0 0 0)
INDPT t −0.058 −0.059 −0.056 −0.059
( −1.594) ( −1.620) ( −1.538) ( −1.601)
Constant 0.083 0.081 0.079 0.083
(1.530) (1.500) (1.458) (1.523)
YEAR Y Y Y Y
INDUSTRY Y Y Y Y
Observations 4153 4153 4153 4153
Adjusted R 2 0.045 0.045 0.044 0.045
i
b
t
w
c
p
(
n
P
d
f
h
p
f
p
b
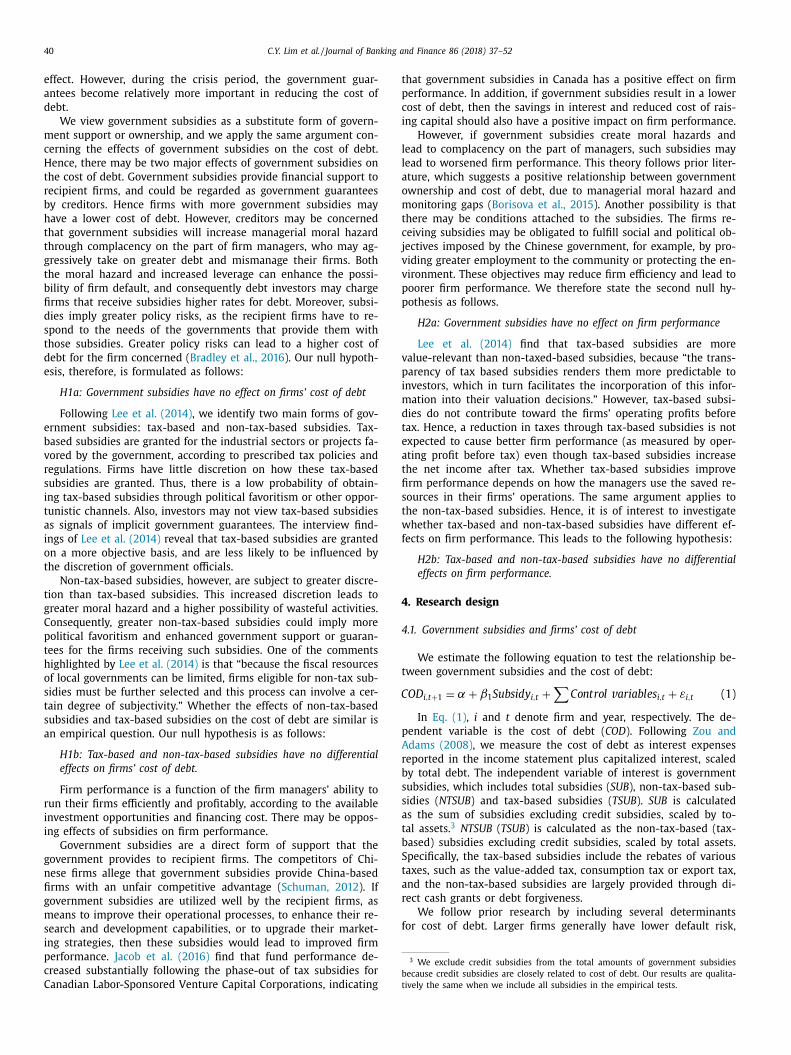
ld Chinese GAAP. 5 As the tests of our hypotheses require that the
ependent variables are one year ahead of the independent vari-
bles, the data collection period ends in 2012 rather than 2011.
f the 9312 non-financial firm-year observations available for the
ample period, we eliminate 1692 observations with missing val-
es on subsidies, 754 observations with missing values on the cost
f debt and 2713 observations with insufficient data on other vari-
bles. This leaves us with a final sample of 4153 firm-year obser-
ations (1239 unique firms) to test the hypotheses throughout the
tudy. Panel A of Table 1 summarizes our sample selection process.
Panel B of Table 1 presents the distribution of firm-years across
ndustries, which are classified according to China Securities Reg-
latory Commission (CSRC) categories. The five industries with the
ighest percentage of subsidized firms include Timber and Furnish-
ng (100%), Electronics (97.81%), Agriculture, Forestry and Fishery
95.40%), Communication and Culture (94.00%), and Information
echnology (93.97%). This pattern is generally consistent with the
rioritized industries as designated in China’s 11th Five-year Plan
2006–2010).
Table 2 provides the descriptive statistics of variables used in
he main analyses. The average percentages of government sub-
idies over total assets, non-tax-based subsidies over total assets,
nd tax-based subsidies over total assets in the sample are 0.4%,
.4% and 0.1%, respectively. Unreported data reveal that the aver-
ge percentage of government subsidies over total sales is 1.3%.
he sample firms have an average cost of debt of 9.3%, leverage
f 23.2% and average PROA of 2.5%. More than half (65.9%) of the
rms in the sample are SOEs and 17.2% are politically connected.
. Empirical results
.1. Main analyses
This subsection presents the main empirical results on the ef-
ects that government subsidies have on firms’ cost of debt and
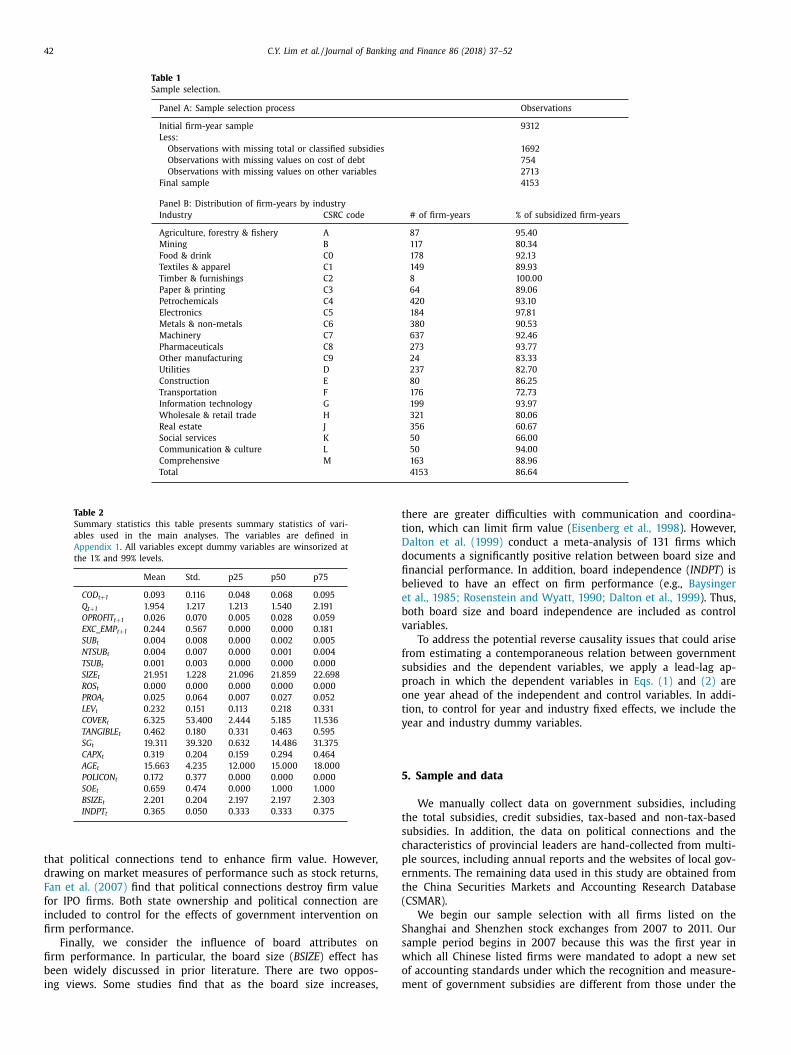
rm performance. Table 3 reports the results concerning the rela-
ionship between government subsidies and the firms’ cost of debt.
n general, government subsidies have a negative effect on firms’
ost of debt. Column (1) reveals that the estimated coefficient on
UB is −0.622, with a statistical significance level at the 5%. The
ther three columns indicate that this negative association exists
argely for non-tax-based subsidies. These results are consistent
ith the argument that government subsidies, especially non-tax-
ased subsidies, provide government support for these firms to en-
ance their credit standings, reduce the credit risks for lenders to
hese firms, and thus reduce the firms’ cost of debt. These results
re also consistent with prior evidence that government support
hrough government ownership, government control and/or politi-
al connections is negatively related to the cost of debt ( Borisova
nd Megginson, 2011; Houston et al., 2014 ). The estimated coeffi-
ients on the control variables show that firms with higher pre-
ubsidy ROA ( PROA ) and higher leverage ( LEV ) incur lower cost of
ebt.
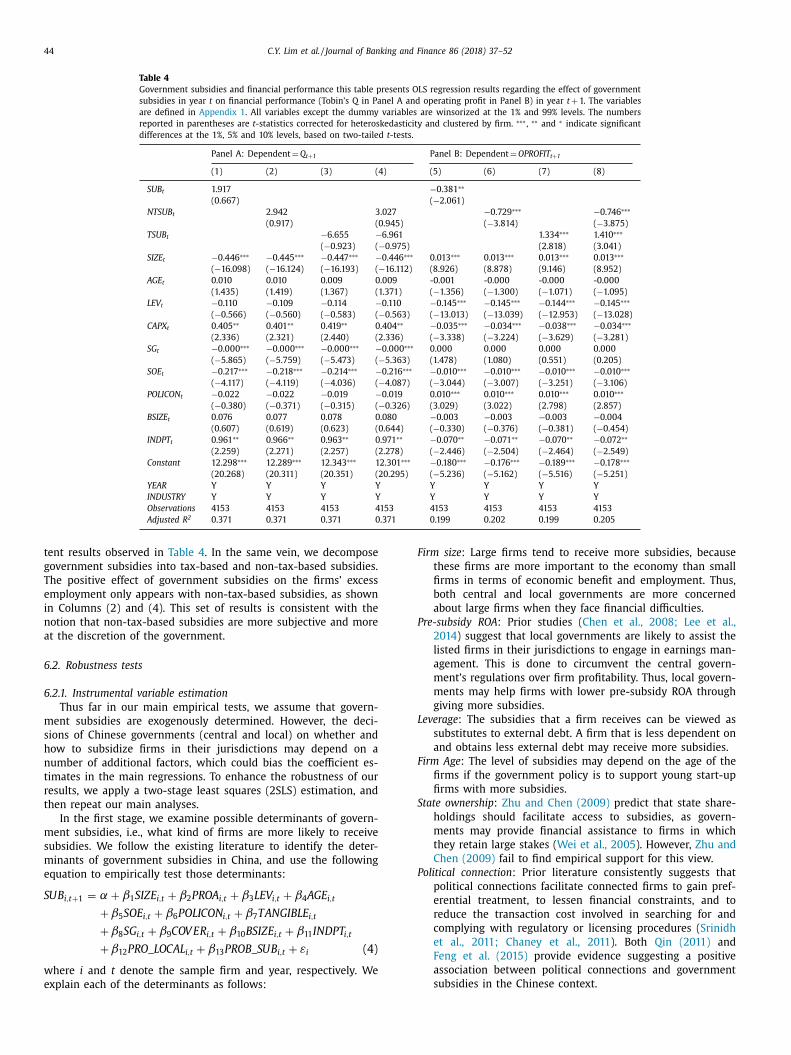
Table 4 shows the effects of government subsidies on the firms’
arket performance (measured by Tobin’s Q) and accounting per-
ormance (measured by operating profit). Panel A shows that nei-
her the non-tax-based nor the tax-based subsidies have a signif-
cant effect on the firms’ market performance. Panel B shows the
egression results for the firms’ accounting performance. As shown
5 In the old Chinese GAAP, the government subsidies were largely recognized
s subsidy income. The accounting method under new Chinese GAAP is based on
hether the government subsidy is related to income or to assets. Subsidies that
re related to income (assets) should be recognized as profit or loss (deferred in-
ome, and amortized to profit or loss on a straight-line basis over the useful life of
he asset).
m
t
d
m
g
s
fi
n Column (5), there is a statistically significantly negative relation
etween government subsidies and OPROFIT . The significance of
he coefficient of non-tax-based subsidies ( NTSUB ) remains when
e decompose SUB into tax-based and non-tax-based subsidies. In
ontrast, the relation between tax-based subsidies and accounting
erformance is significantly positive, as shown in Columns (7) and
8). Overall, government subsidies have a mixed effect on firms’ fi-
ancial performance.
Regarding the control variables, the results are also inconsistent.
anel A reveals that larger firms, firms with lower capital expen-
itures, and firms with fewer independent directors have lower
uture Tobin’s Q. Nevertheless, in Panel B, the above firms have
igher future operating profits.
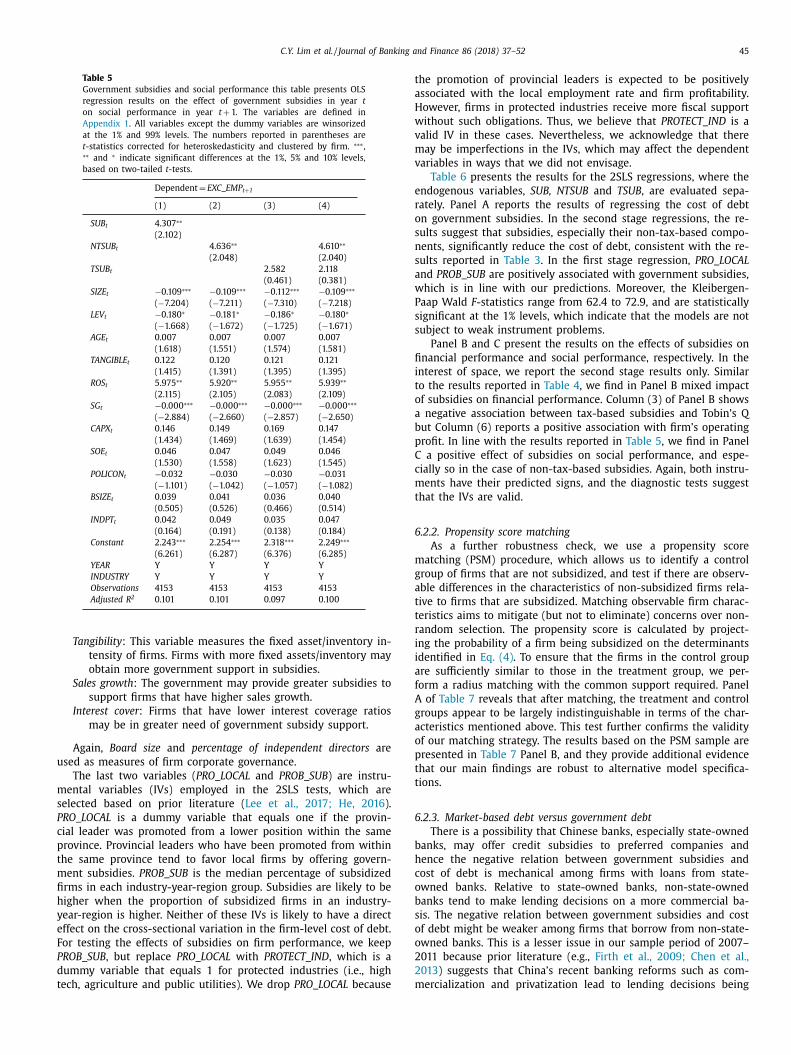
In addition to the financial performance, we use the excess em-
loyment measure to assess the firms’ social performance. The ef-
ects of government subsidies on firm social performance are re-
orted in Table 5 . There is a statistically significant association
etween government subsidies and social performance. The esti-
ated coefficient on SUB reported in Column (1) is 4.307, with a
-statistic of 2.102 and a significance level of 5%. This result in-
icates that firms with more government subsidies tend to hire
ore employees than necessary, which is consistent with Chinese
overnment imposing social objectives when offering government
ubsidies to firms. The excess employment may be detrimental to
rm financial performance, which helps to explain the inconsis-
44 C.Y. Lim et al. / Journal of Banking and Finance 86 (2018) 37–52
Table 4
Government subsidies and financial performance this table presents OLS regression results regarding the effect of government
subsidies in year t on financial performance (Tobin’s Q in Panel A and operating profit in Panel B) in year t + 1. The variables
are defined in Appendix 1 . All variables except the dummy variables are winsorized at the 1% and 99% levels. The numbers
reported in parentheses are t -statistics corrected for heteroskedasticity and clustered by firm. ∗∗∗ , ∗∗ and ∗ indicate significant
differences at the 1%, 5% and 10% levels, based on two-tailed t -tests.
Panel A: Dependent = Q t + 1 Panel B: Dependent = OPROFIT t + 1
(1) (2) (3) (4) (5) (6) (7) (8)
SUB t 1.917 −0.381 ∗∗
(0.667) ( −2.061)
NTSUB t 2.942 3.027 −0.729 ∗∗∗ −0.746 ∗∗∗
(0.917) (0.945) ( −3.814) ( −3.875)
TSUB t −6.655 −6.961 1.334 ∗∗∗ 1.410 ∗∗∗
( −0.923) ( −0.975) (2.818) (3.041)
SIZE t −0.446 ∗∗∗ −0.445 ∗∗∗ −0.447 ∗∗∗ −0.446 ∗∗∗ 0.013 ∗∗∗ 0.013 ∗∗∗ 0.013 ∗∗∗ 0.013 ∗∗∗
( −16.098) ( −16.124) ( −16.193) ( −16.112) (8.926) (8.878) (9.146) (8.952)
AGE t 0.010 0.010 0.009 0.009 -0.001 -0.0 0 0 -0.0 0 0 -0.0 0 0
(1.435) (1.419) (1.367) (1.371) ( −1.356) ( −1.300) ( −1.071) ( −1.095)
LEV t −0.110 −0.109 −0.114 −0.110 −0.145 ∗∗∗ −0.145 ∗∗∗ −0.144 ∗∗∗ −0.145 ∗∗∗
( −0.566) ( −0.560) ( −0.583) ( −0.563) ( −13.013) ( −13.039) ( −12.953) ( −13.028)
CAPX t 0.405 ∗∗ 0.401 ∗∗ 0.419 ∗∗ 0.404 ∗∗ −0.035 ∗∗∗ −0.034 ∗∗∗ −0.038 ∗∗∗ −0.034 ∗∗∗
(2.336) (2.321) (2.440) (2.336) ( −3.338) ( −3.224) ( −3.629) ( −3.281)
SG t −0.0 0 0 ∗∗∗ −0.0 0 0 ∗∗∗ −0.0 0 0 ∗∗∗ −0.0 0 0 ∗∗∗ 0.0 0 0 0.0 0 0 0.0 0 0 0.0 0 0
( −5.865) ( −5.759) ( −5.473) ( −5.363) (1.478) (1.080) (0.551) (0.205)
SOE t −0.217 ∗∗∗ −0.218 ∗∗∗ −0.214 ∗∗∗ −0.216 ∗∗∗ −0.010 ∗∗∗ −0.010 ∗∗∗ −0.010 ∗∗∗ −0.010 ∗∗∗
( −4.117) ( −4.119) ( −4.036) ( −4.087) ( −3.044) ( −3.007) ( −3.251) ( −3.106)
POLICON t −0.022 −0.022 −0.019 −0.019 0.010 ∗∗∗ 0.010 ∗∗∗ 0.010 ∗∗∗ 0.010 ∗∗∗
( −0.380) ( −0.371) ( −0.315) ( −0.326) (3.029) (3.022) (2.798) (2.857)
BSIZE t 0.076 0.077 0.078 0.080 −0.003 −0.003 −0.003 −0.004
(0.607) (0.619) (0.623) (0.644) ( −0.330) ( −0.376) ( −0.381) ( −0.454)
INDPT t 0.961 ∗∗ 0.966 ∗∗ 0.963 ∗∗ 0.971 ∗∗ −0.070 ∗∗ −0.071 ∗∗ −0.070 ∗∗ −0.072 ∗∗
(2.259) (2.271) (2.257) (2.278) ( −2.446) ( −2.504) ( −2.464) ( −2.549)
Constant 12.298 ∗∗∗ 12.289 ∗∗∗ 12.343 ∗∗∗ 12.301 ∗∗∗ −0.180 ∗∗∗ −0.176 ∗∗∗ −0.189 ∗∗∗ −0.178 ∗∗∗
(20.268) (20.311) (20.351) (20.295) ( −5.236) ( −5.162) ( −5.516) ( −5.251)
YEAR Y Y Y Y Y Y Y Y
INDUSTRY Y Y Y Y Y Y Y Y
Observations 4153 4153 4153 4153 4153 4153 4153 4153
Adjusted R 2 0.371 0.371 0.371 0.371 0.199 0.202 0.199 0.205
tent results observed in Table 4 . In the same vein, we decompose
government subsidies into tax-based and non-tax-based subsidies.
The positive effect of government subsidies on the firms’ excess
employment only appears with non-tax-based subsidies, as shown
in Columns (2) and (4). This set of results is consistent with the
notion that non-tax-based subsidies are more subjective and more
at the discretion of the government.
6.2. Robustness tests
6.2.1. Instrumental variable estimation
Thus far in our main empirical tests, we assume that govern-
ment subsidies are exogenously determined. However, the deci-
sions of Chinese governments (central and local) on whether and
how to subsidize firms in their jurisdictions may depend on a
number of additional factors, which could bias the coefficient es-
timates in the main regressions. To enhance the robustness of our
results, we apply a two-stage least squares (2SLS) estimation, and
then repeat our main analyses.
In the first stage, we examine possible determinants of govern-
ment subsidies, i.e., what kind of firms are more likely to receive
subsidies. We follow the existing literature to identify the deter-
minants of government subsidies in China, and use the following
equation to empirically test those determinants:
SUB i,t+1 = α + β1 SIZE i,t + β2 P ROA i,t + β3 LEV i,t + β4 AGE i,t
+ β5 SOE i,t + β6 P OLICON i,t + β7 T ANGIBLE i,t
+ β8 SG i,t + β9 COV ER i,t + β10 BSIZE i,t + β11 INDP T i,t
+ β12 P RO _ LOCAL i,t + β13 P ROB _ SUB i,t + ε i (4)
where i and t denote the sample firm and year, respectively. We
explain each of the determinants as follows:
Firm size : Large firms tend to receive more subsidies, because
these firms are more important to the economy than small
firms in terms of economic benefit and employment. Thus,
both central and local governments are more concerned
about large firms when they face financial difficulties.
Pre-subsidy ROA : Prior studies ( Chen et al., 2008; Lee et al.,
2014 ) suggest that local governments are likely to assist the
listed firms in their jurisdictions to engage in earnings man-
agement. This is done to circumvent the central govern-
ment’s regulations over firm profitability. Thus, local govern-
ments may help firms with lower pre-subsidy ROA through
giving more subsidies.
Leverage : The subsidies that a firm receives can be viewed as
substitutes to external debt. A firm that is less dependent on
and obtains less external debt may receive more subsidies.
Firm Age : The level of subsidies may depend on the age of the
firms if the government policy is to support young start-up
firms with more subsidies.
State ownership : Zhu and Chen (2009) predict that state share-
holdings should facilitate access to subsidies, as govern-
ments may provide financial assistance to firms in which
they retain large stakes ( Wei et al., 2005 ). However, Zhu and
Chen (2009) fail to find empirical support for this view.
Political connection : Prior literature consistently suggests that
political connections facilitate connected firms to gain pref-
erential treatment, to lessen financial constraints, and to
reduce the transaction cost involved in searching for and
complying with regulatory or licensing procedures ( Srinidh
et al., 2011; Chaney et al., 2011 ). Both Qin (2011) and
Feng et al. (2015) provide evidence suggesting a positive
association between political connections and government
subsidies in the Chinese context.
C.Y. Lim et al. / Journal of Banking and Finance 86 (2018) 37–52 45
Table 5
Government subsidies and social performance this table presents OLS
regression results on the effect of government subsidies in year t
on social performance in year t + 1. The variables are defined in
Appendix 1 . All variables except the dummy variables are winsorized
at the 1% and 99% levels. The numbers reported in parentheses are
t -statistics corrected for heteroskedasticity and clustered by firm. ∗∗∗ , ∗∗ and ∗ indicate significant differences at the 1%, 5% and 10% levels,
based on two-tailed t -tests.
Dependent = EXC_EMP t + 1
(1) (2) (3) (4)
SUB t 4.307 ∗∗
(2.102)
NTSUB t 4.636 ∗∗ 4.610 ∗∗
(2.048) (2.040)
TSUB t 2.582 2.118
(0.461) (0.381)
SIZE t −0.109 ∗∗∗ −0.109 ∗∗∗ −0.112 ∗∗∗ −0.109 ∗∗∗
( −7.204) ( −7.211) ( −7.310) ( −7.218)
LEV t −0.180 ∗ −0.181 ∗ −0.186 ∗ −0.180 ∗
( −1.668) ( −1.672) ( −1.725) ( −1.671)
AGE t 0.007 0.007 0.007 0.007
(1.618) (1.551) (1.574) (1.581)
TANGIBLE t 0.122 0.120 0.121 0.121
(1.415) (1.391) (1.395) (1.395)
ROS t 5.975 ∗∗ 5.920 ∗∗ 5.955 ∗∗ 5.939 ∗∗
(2.115) (2.105) (2.083) (2.109)
SG t −0.0 0 0 ∗∗∗ −0.0 0 0 ∗∗∗ −0.0 0 0 ∗∗∗ −0.0 0 0 ∗∗∗
( −2.884) ( −2.660) ( −2.857) ( −2.650)
CAPX t 0.146 0.149 0.169 0.147
(1.434) (1.469) (1.639) (1.454)
SOE t 0.046 0.047 0.049 0.046
(1.530) (1.558) (1.623) (1.545)
POLICON t −0.032 −0.030 −0.030 −0.031
( −1.101) ( −1.042) ( −1.057) ( −1.082)
BSIZE t 0.039 0.041 0.036 0.040
(0.505) (0.526) (0.466) (0.514)
INDPT t 0.042 0.049 0.035 0.047
(0.164) (0.191) (0.138) (0.184)
Constant 2.243 ∗∗∗ 2.254 ∗∗∗ 2.318 ∗∗∗ 2.249 ∗∗∗
(6.261) (6.287) (6.376) (6.285)
YEAR Y Y Y Y
INDUSTRY Y Y Y Y
Observations 4153 4153 4153 4153
Adjusted R 2 0.101 0.101 0.097 0.100
u
m
s
P
c
p
t
m
fi
h
y
e
F
P
d
t
t
a
H
w
v
m
v
e
r
o
s
n
s
a
w
P
s
s
fi
i
t
o
a
b
p
C
c
m
t
6
m
g
a
t
t
r
i
i
a
f
A
g
a
o
p
t
t
6
b
h
c
o
b
s
o
o
2
2
m
Tangibility : This variable measures the fixed asset/inventory in-
tensity of firms. Firms with more fixed assets/inventory may
obtain more government support in subsidies.
Sales growth : The government may provide greater subsidies to
support firms that have higher sales growth.
Interest cover : Firms that have lower interest coverage ratios
may be in greater need of government subsidy support.
Again, Board size and percentage of independent directors are
sed as measures of firm corporate governance.
The last two variables ( PRO_LOCAL and PROB_SUB ) are instru-
ental variables (IVs) employed in the 2SLS tests, which are
elected based on prior literature ( Lee et al., 2017; He, 2016 ).
RO_LOCAL is a dummy variable that equals one if the provin-
ial leader was promoted from a lower position within the same
rovince. Provincial leaders who have been promoted from within
he same province tend to favor local firms by offering govern-
ent subsidies. PROB_SUB is the median percentage of subsidized
rms in each industry-year-region group. Subsidies are likely to be
igher when the proportion of subsidized firms in an industry-
ear-region is higher. Neither of these IVs is likely to have a direct
ffect on the cross-sectional variation in the firm-level cost of debt.
or testing the effects of subsidies on firm performance, we keep
ROB_SUB , but replace PRO_LOCAL with PROTECT_IND , which is a
ummy variable that equals 1 for protected industries (i.e., high
ech, agriculture and public utilities). We drop PRO_LOCAL because
he promotion of provincial leaders is expected to be positively
ssociated with the local employment rate and firm profitability.
owever, firms in protected industries receive more fiscal support
ithout such obligations. Thus, we believe that PROTECT_IND is a
alid IV in these cases. Nevertheless, we acknowledge that there
ay be imperfections in the IVs, which may affect the dependent
ariables in ways that we did not envisage.
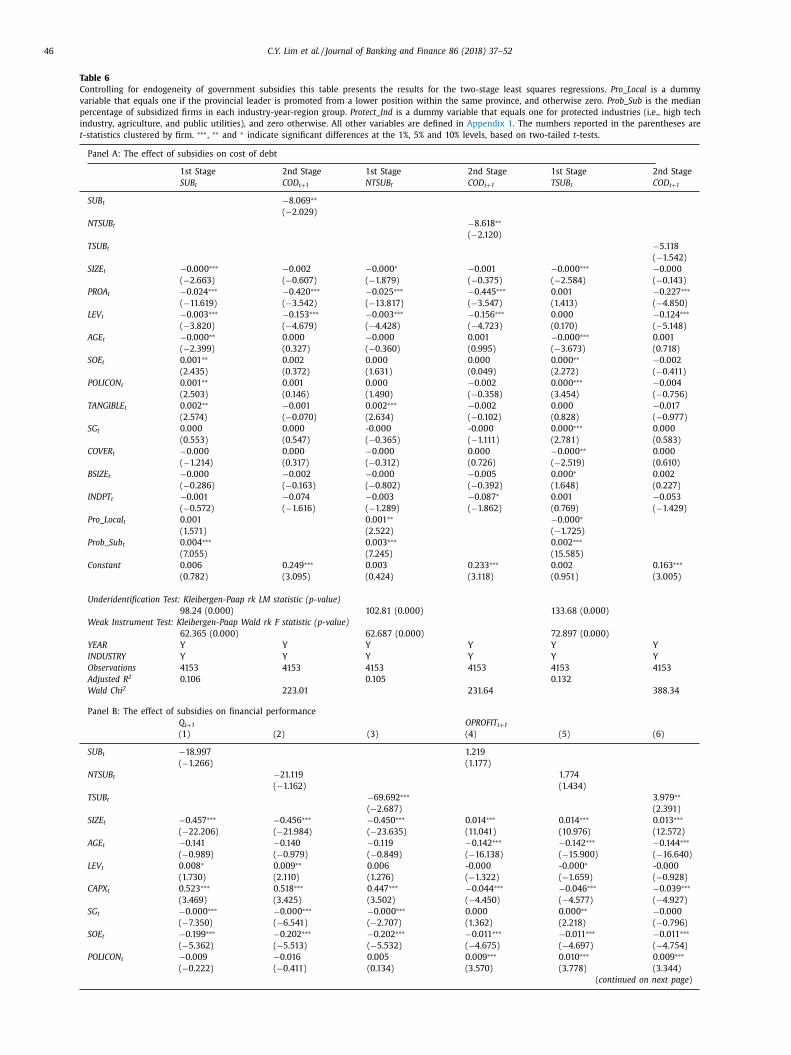
Table 6 presents the results for the 2SLS regressions, where the
ndogenous variables, SUB, NTSUB and TSUB , are evaluated sepa-
ately. Panel A reports the results of regressing the cost of debt
n government subsidies. In the second stage regressions, the re-
ults suggest that subsidies, especially their non-tax-based compo-
ents, significantly reduce the cost of debt, consistent with the re-
ults reported in Table 3 . In the first stage regression, PRO_LOCAL
nd PROB_SUB are positively associated with government subsidies,
hich is in line with our predictions. Moreover, the Kleibergen-
aap Wald F -statistics range from 62.4 to 72.9, and are statistically
ignificant at the 1% levels, which indicate that the models are not
ubject to weak instrument problems.
Panel B and C present the results on the effects of subsidies on
nancial performance and social performance, respectively. In the
nterest of space, we report the second stage results only. Similar
o the results reported in Table 4 , we find in Panel B mixed impact
f subsidies on financial performance. Column (3) of Panel B shows
negative association between tax-based subsidies and Tobin’s Q
ut Column (6) reports a positive association with firm’s operating
rofit. In line with the results reported in Table 5 , we find in Panel
a positive effect of subsidies on social performance, and espe-
ially so in the case of non-tax-based subsidies. Again, both instru-
ents have their predicted signs, and the diagnostic tests suggest
hat the IVs are valid.
.2.2. Propensity score matching
As a further robustness check, we use a propensity score
atching (PSM) procedure, which allows us to identify a control
roup of firms that are not subsidized, and test if there are observ-
ble differences in the characteristics of non-subsidized firms rela-
ive to firms that are subsidized. Matching observable firm charac-
eristics aims to mitigate (but not to eliminate) concerns over non-
andom selection. The propensity score is calculated by project-
ng the probability of a firm being subsidized on the determinants
dentified in Eq. (4) . To ensure that the firms in the control group
re sufficiently similar to those in the treatment group, we per-
orm a radius matching with the common support required. Panel
of Table 7 reveals that after matching, the treatment and control
roups appear to be largely indistinguishable in terms of the char-
cteristics mentioned above. This test further confirms the validity
f our matching strategy. The results based on the PSM sample are
resented in Table 7 Panel B, and they provide additional evidence
hat our main findings are robust to alternative model specifica-
ions.
.2.3. Market-based debt versus government debt
There is a possibility that Chinese banks, especially state-owned
anks, may offer credit subsidies to preferred companies and
ence the negative relation between government subsidies and
ost of debt is mechanical among firms with loans from state-
wned banks. Relative to state-owned banks, non-state-owned
anks tend to make lending decisions on a more commercial ba-
is. The negative relation between government subsidies and cost
f debt might be weaker among firms that borrow from non-state-
wned banks. This is a lesser issue in our sample period of 2007–
011 because prior literature (e.g., Firth et al., 2009; Chen et al.,
013 ) suggests that China’s recent banking reforms such as com-
ercialization and privatization lead to lending decisions being
46 C.Y. Lim et al. / Journal of Banking and Finance 86 (2018) 37–52
Table 6
Controlling for endogeneity of government subsidies this table presents the results for the two-stage least squares regressions. Pro_Local is a dummy
variable that equals one if the provincial leader is promoted from a lower position within the same province, and otherwise zero. Prob_Sub is the median
percentage of subsidized firms in each industry-year-region group. Protect_Ind is a dummy variable that equals one for protected industries (i.e., high tech
industry, agriculture, and public utilities), and zero otherwise. All other variables are defined in Appendix 1 . The numbers reported in the parentheses are
t -statistics clustered by firm. ∗∗∗ , ∗∗ and ∗ indicate significant differences at the 1%, 5% and 10% levels, based on two-tailed t -tests.
Panel A: The effect of subsidies on cost of debt
1st Stage 2nd Stage 1st Stage 2nd Stage 1st Stage 2nd Stage
SUB t COD t + 1 NTSUB t COD t + 1 TSUB t COD t + 1
SUB t −8.069 ∗∗
( −2.029)
NTSUB t −8.618 ∗∗
( −2.120)
TSUB t −5.118
( −1.542)
SIZE t −0.0 0 0 ∗∗∗ −0.002 −0.0 0 0 ∗ −0.001 −0.0 0 0 ∗∗∗ −0.0 0 0
( −2.663) ( −0.607) ( −1.879) ( −0.375) ( −2.584) ( −0.143)
PROA t −0.024 ∗∗∗ −0.420 ∗∗∗ −0.025 ∗∗∗ −0.445 ∗∗∗ 0.001 −0.227 ∗∗∗
( −11.619) ( −3.542) ( −13.817) ( −3.547) (1.413) ( −4.850)
LEV t −0.003 ∗∗∗ −0.153 ∗∗∗ −0.003 ∗∗∗ −0.156 ∗∗∗ 0.0 0 0 −0.124 ∗∗∗
( −3.820) ( −4.679) ( −4.428) ( −4.723) (0.170) ( −5.148)
AGE t −0.0 0 0 ∗∗ 0.0 0 0 −0.0 0 0 0.001 −0.0 0 0 ∗∗∗ 0.001
( −2.399) (0.327) ( −0.360) (0.995) ( −3.673) (0.718)
SOE t 0.001 ∗∗ 0.002 0.0 0 0 0.0 0 0 0.0 0 0 ∗∗ −0.002
(2.435) (0.372) (1.631) (0.049) (2.272) ( −0.411)
POLICON t 0.001 ∗∗ 0.001 0.0 0 0 −0.002 0.0 0 0 ∗∗∗ −0.004
(2.503) (0.146) (1.490) ( −0.358) (3.454) ( −0.756)
TANGIBLE t 0.002 ∗∗ −0.001 0.002 ∗∗∗ −0.002 0.0 0 0 −0.017
(2.574) ( −0.070) (2.634) ( −0.102) (0.828) ( −0.977)
SG t 0.0 0 0 0.0 0 0 -0.0 0 0 -0.0 0 0 0.0 0 0 ∗∗∗ 0.0 0 0
(0.553) (0.547) ( −0.365) ( −1.111) (2.781) (0.583)
COVER t −0.0 0 0 0.0 0 0 −0.0 0 0 0.0 0 0 −0.0 0 0 ∗∗ 0.0 0 0
( −1.214) (0.317) ( −0.312) (0.726) ( −2.519) (0.610)
BSIZE t −0.0 0 0 −0.002 −0.0 0 0 −0.005 0.0 0 0 ∗ 0.002
( −0.286) ( −0.163) ( −0.802) ( −0.392) (1.648) (0.227)
INDPT t −0.001 −0.074 −0.003 −0.087 ∗ 0.001 −0.053
( −0.572) ( −1.616) ( −1.289) ( −1.862) (0.769) ( −1.429)
Pro_Local t 0.001 0.001 ∗∗ −0.0 0 0 ∗
(1.571) (2.522) ( −1.725)
Prob _ Sub t 0.004 ∗∗∗ 0.003 ∗∗∗ 0.002 ∗∗∗
(7.055) (7.245) (15.585)
Constant 0.006 0.249 ∗∗∗ 0.003 0.233 ∗∗∗ 0.002 0.163 ∗∗∗
(0.782) (3.095) (0.424) (3.118) (0.951) (3.005)
Underidentification Test: Kleibergen-Paap rk LM statistic (p-value)
98.24 (0.0 0 0) 102.81 (0.0 0 0) 133.68 (0.0 0 0)
Weak Instrument Test: Kleibergen-Paap Wald rk F statistic (p-value)
62.365 (0.0 0 0) 62.687 (0.0 0 0) 72.897 (0.0 0 0)
YEAR Y Y Y Y Y Y
INDUSTRY Y Y Y Y Y Y
Observations 4153 4153 4153 4153 4153 4153
Adjusted R 2 0.106 0.105 0.132
Wald Chi 2 223.01 231.64 388.34
Panel B: The effect of subsidies on financial performance
Q t + 1 OPROFIT t + 1 (1) (2) (3) (4) (5) (6)
SUB t −18.997 1.219
( −1.266) (1.177)
NTSUB t −21.119 1.774
( −1.162) (1.434)
TSUB t −69.692 ∗∗∗ 3.979 ∗∗
( −2.687) (2.391)
SIZE t −0.457 ∗∗∗ −0.456 ∗∗∗ −0.450 ∗∗∗ 0.014 ∗∗∗ 0.014 ∗∗∗ 0.013 ∗∗∗
( −22.206) ( −21.984) ( −23.635) (11.041) (10.976) (12.572)
AGE t −0.141 −0.140 −0.119 −0.142 ∗∗∗ −0.142 ∗∗∗ −0.144 ∗∗∗
( −0.989) ( −0.979) ( −0.849) ( −16.138) ( −15.900) ( −16.640)
LEV t 0.008 ∗ 0.009 ∗∗ 0.006 -0.0 0 0 -0.0 0 0 ∗ -0.0 0 0
(1.730) (2.110) (1.276) ( −1.322) ( −1.659) ( −0.928)
CAPX t 0.523 ∗∗∗ 0.518 ∗∗∗ 0.447 ∗∗∗ −0.044 ∗∗∗ −0.046 ∗∗∗ −0.039 ∗∗∗
(3.469) (3.425) (3.502) ( −4.450) ( −4.577) ( −4.927)
SG t −0.0 0 0 ∗∗∗ −0.0 0 0 ∗∗∗ −0.0 0 0 ∗∗∗ 0.0 0 0 0.0 0 0 ∗∗ −0.0 0 0
( −7.350) ( −6.541) ( −2.707) (1.362) (2.218) ( −0.796)
SOE t −0.199 ∗∗∗ −0.202 ∗∗∗ −0.202 ∗∗∗ −0.011 ∗∗∗ −0.011 ∗∗∗ −0.011 ∗∗∗
( −5.362) ( −5.513) ( −5.532) ( −4.675) ( −4.697) ( −4.754)
POLICON t −0.009 −0.016 0.005 0.009 ∗∗∗ 0.010 ∗∗∗ 0.009 ∗∗∗
( −0.222) ( −0.411) (0.134) (3.570) (3.778) (3.344)
( continued on next page )
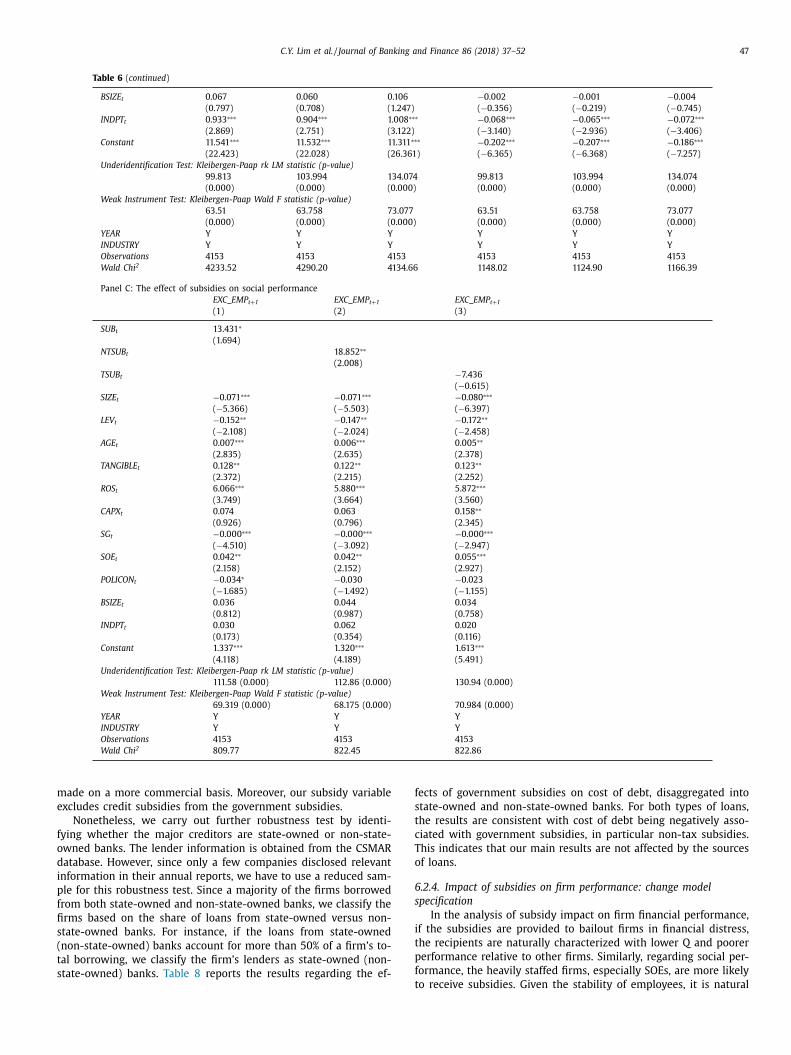
C.Y. Lim et al. / Journal of Banking and Finance 86 (2018) 37–52 47
Table 6 ( continued )
BSIZE t 0.067 0.060 0.106 −0.002 −0.001 −0.004
(0.797) (0.708) (1.247) ( −0.356) ( −0.219) ( −0.745)
INDPT t 0.933 ∗∗∗ 0.904 ∗∗∗ 1.008 ∗∗∗ −0.068 ∗∗∗ −0.065 ∗∗∗ −0.072 ∗∗∗
(2.869) (2.751) (3.122) ( −3.140) ( −2.936) ( −3.406)
Constant 11.541 ∗∗∗ 11.532 ∗∗∗ 11.311 ∗∗∗ −0.202 ∗∗∗ −0.207 ∗∗∗ −0.186 ∗∗∗
(22.423) (22.028) (26.361) ( −6.365) ( −6.368) ( −7.257)
Underidentification Test: Kleibergen-Paap rk LM statistic (p-value)
99.813 103.994 134.074 99.813 103.994 134.074
(0.0 0 0) (0.0 0 0) (0.0 0 0) (0.0 0 0) (0.0 0 0) (0.0 0 0)
Weak Instrument Test: Kleibergen-Paap Wald F statistic (p-value)
63.51 63.758 73.077 63.51 63.758 73.077
(0.0 0 0) (0.0 0 0) (0.0 0 0) (0.0 0 0) (0.0 0 0) (0.0 0 0)
YEAR Y Y Y Y Y Y
INDUSTRY Y Y Y Y Y Y
Observations 4153 4153 4153 4153 4153 4153
Wald Chi 2 4233.52 4290.20 4134.66 1148.02 1124.90 1166.39
Panel C: The effect of subsidies on social performance
EXC_EMP t + 1 EXC_EMP t + 1 EXC_EMP t + 1 (1) (2) (3)
SUB t 13.431 ∗
(1.694)
NTSUB t 18.852 ∗∗
(2.008)
TSUB t −7.436
( −0.615)
SIZE t −0.071 ∗∗∗ −0.071 ∗∗∗ −0.080 ∗∗∗
( −5.366) ( −5.503) ( −6.397)
LEV t −0.152 ∗∗ −0.147 ∗∗ −0.172 ∗∗
( −2.108) ( −2.024) ( −2.458)
AGE t 0.007 ∗∗∗ 0.006 ∗∗∗ 0.005 ∗∗
(2.835) (2.635) (2.378)
TANGIBLE t 0.128 ∗∗ 0.122 ∗∗ 0.123 ∗∗
(2.372) (2.215) (2.252)
ROS t 6.066 ∗∗∗ 5.880 ∗∗∗ 5.872 ∗∗∗
(3.749) (3.664) (3.560)
CAPX t 0.074 0.063 0.158 ∗∗
(0.926) (0.796) (2.345)
SG t −0.0 0 0 ∗∗∗ −0.0 0 0 ∗∗∗ −0.0 0 0 ∗∗∗
( −4.510) ( −3.092) ( −2.947)
SOE t 0.042 ∗∗ 0.042 ∗∗ 0.055 ∗∗∗
(2.158) (2.152) (2.927)
POLICON t −0.034 ∗ −0.030 −0.023
( −1.685) ( −1.492) ( −1.155)
BSIZE t 0.036 0.044 0.034
(0.812) (0.987) (0.758)
INDPT t 0.030 0.062 0.020
(0.173) (0.354) (0.116)
Constant 1.337 ∗∗∗ 1.320 ∗∗∗ 1.613 ∗∗∗
(4.118) (4.189) (5.491)
Underidentification Test: Kleibergen-Paap rk LM statistic (p-value)
111.58 (0.0 0 0) 112.86 (0.0 0 0) 130.94 (0.0 0 0)
Weak Instrument Test: Kleibergen-Paap Wald F statistic (p-value)
69.319 (0.0 0 0) 68.175 (0.0 0 0) 70.984 (0.0 0 0)
YEAR Y Y Y
INDUSTRY Y Y Y
Observations 4153 4153 4153
Wald Chi 2 809.77 822.45 822.86
m
e
f
o
d
i
p
f
fi
s
(
t
s
f
s
t
c
T
o
6
s
i
t
p
f
ade on a more commercial basis. Moreover, our subsidy variable
xcludes credit subsidies from the government subsidies.
Nonetheless, we carry out further robustness test by identi-
ying whether the major creditors are state-owned or non-state-
wned banks. The lender information is obtained from the CSMAR
atabase. However, since only a few companies disclosed relevant
nformation in their annual reports, we have to use a reduced sam-
le for this robustness test. Since a majority of the firms borrowed
rom both state-owned and non-state-owned banks, we classify the
rms based on the share of loans from state-owned versus non-
tate-owned banks. For instance, if the loans from state-owned
non-state-owned) banks account for more than 50% of a firm’s to-
al borrowing, we classify the firm’s lenders as state-owned (non-
tate-owned) banks. Table 8 reports the results regarding the ef-
tects of government subsidies on cost of debt, disaggregated into
tate-owned and non-state-owned banks. For both types of loans,
he results are consistent with cost of debt being negatively asso-
iated with government subsidies, in particular non-tax subsidies.
his indicates that our main results are not affected by the sources
f loans.
.2.4. Impact of subsidies on firm performance: change model
pecification
In the analysis of subsidy impact on firm financial performance,
f the subsidies are provided to bailout firms in financial distress,
he recipients are naturally characterized with lower Q and poorer
erformance relative to other firms. Similarly, regarding social per-
ormance, the heavily staffed firms, especially SOEs, are more likely
o receive subsidies. Given the stability of employees, it is natural
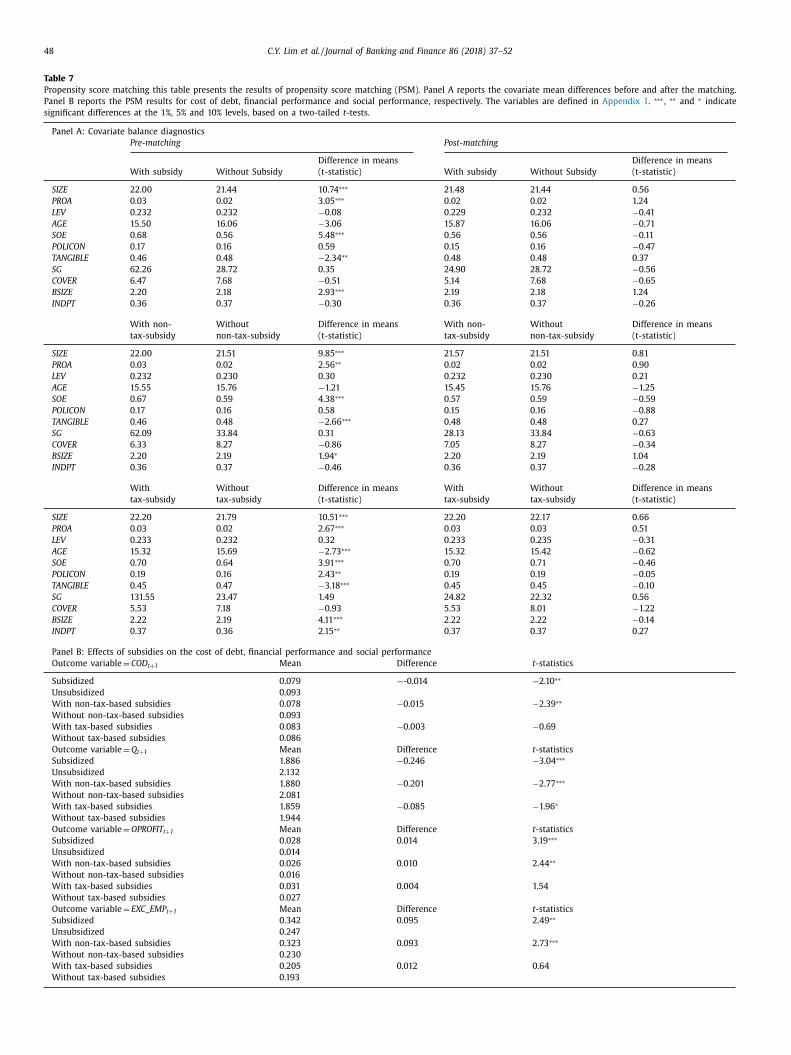
48 C.Y. Lim et al. / Journal of Banking and Finance 86 (2018) 37–52
Table 7
Propensity score matching this table presents the results of propensity score matching (PSM). Panel A reports the covariate mean differences before and after the matching.
Panel B reports the PSM results for cost of debt, financial performance and social performance, respectively. The variables are defined in Appendix 1 . ∗∗∗ , ∗∗ and ∗ indicate
significant differences at the 1%, 5% and 10% levels, based on a two-tailed t -tests.
Panel A: Covariate balance diagnostics
Pre-matching Post-matching
With subsidy Without Subsidy
Difference in means
(t-statistic) With subsidy Without Subsidy
Difference in means
(t-statistic)
SIZE 22.00 21.44 10.74 ∗∗∗ 21.48 21.44 0.56
PROA 0.03 0.02 3.05 ∗∗∗ 0.02 0.02 1.24
LEV 0.232 0.232 −0.08 0.229 0.232 −0.41
AGE 15.50 16.06 −3.06 15.87 16.06 −0.71
SOE 0.68 0.56 5.48 ∗∗∗ 0.56 0.56 −0.11
POLICON 0.17 0.16 0.59 0.15 0.16 −0.47
TANGIBLE 0.46 0.48 −2.34 ∗∗ 0.48 0.48 0.37
SG 62.26 28.72 0.35 24.90 28.72 −0.56
COVER 6.47 7.68 −0.51 5.14 7.68 −0.65
BSIZE 2.20 2.18 2.93 ∗∗∗ 2.19 2.18 1.24
INDPT 0.36 0.37 −0.30 0.36 0.37 −0.26
With non-
tax-subsidy
Without
non-tax-subsidy
Difference in means
(t-statistic)
With non-
tax-subsidy
Without
non-tax-subsidy
Difference in means
(t-statistic)
SIZE 22.00 21.51 9.85 ∗∗∗ 21.57 21.51 0.81
PROA 0.03 0.02 2.56 ∗∗ 0.02 0.02 0.90
LEV 0.232 0.230 0.30 0.232 0.230 0.21
AGE 15.55 15.76 −1.21 15.45 15.76 −1.25
SOE 0.67 0.59 4.38 ∗∗∗ 0.57 0.59 −0.59
POLICON 0.17 0.16 0.58 0.15 0.16 −0.88
TANGIBLE 0.46 0.48 −2.66 ∗∗∗ 0.48 0.48 0.27
SG 62.09 33.84 0.31 28.13 33.84 −0.63
COVER 6.33 8.27 −0.86 7.05 8.27 −0.34
BSIZE 2.20 2.19 1.94 ∗ 2.20 2.19 1.04
INDPT 0.36 0.37 −0.46 0.36 0.37 −0.28
With
tax-subsidy
Without
tax-subsidy
Difference in means
(t-statistic)
With
tax-subsidy
Without
tax-subsidy
Difference in means
(t-statistic)
SIZE 22.20 21.79 10.51 ∗∗∗ 22.20 22.17 0.66
PROA 0.03 0.02 2.67 ∗∗∗ 0.03 0.03 0.51
LEV 0.233 0.232 0.32 0.233 0.235 −0.31
AGE 15.32 15.69 −2.73 ∗∗∗ 15.32 15.42 −0.62
SOE 0.70 0.64 3.91 ∗∗∗ 0.70 0.71 −0.46
POLICON 0.19 0.16 2.43 ∗∗ 0.19 0.19 −0.05
TANGIBLE 0.45 0.47 −3.18 ∗∗∗ 0.45 0.45 −0.10
SG 131.55 23.47 1.49 24.82 22.32 0.56
COVER 5.53 7.18 −0.93 5.53 8.01 −1.22
BSIZE 2.22 2.19 4.11 ∗∗∗ 2.22 2.22 −0.14
INDPT 0.37 0.36 2.15 ∗∗ 0.37 0.37 0.27
Panel B: Effects of subsidies on the cost of debt, financial performance and social performance
Outcome variable = COD t + 1 Mean Difference t -statistics
Subsidized 0.079 −-0.014 −2.10 ∗∗
Unsubsidized 0.093
With non-tax-based subsidies 0.078 −0.015 −2.39 ∗∗
Without non-tax-based subsidies 0.093
With tax-based subsidies 0.083 −0.003 −0.69
Without tax-based subsidies 0.086
Outcome variable = Q t + 1 Mean Difference t -statistics
Subsidized 1.886 −0.246 −3.04 ∗∗∗
Unsubsidized 2.132
With non-tax-based subsidies 1.880 −0.201 −2.77 ∗∗∗
Without non-tax-based subsidies 2.081
With tax-based subsidies 1.859 −0.085 −1.96 ∗
Without tax-based subsidies 1.944
Outcome variable = OPROFIT t + 1 Mean Difference t -statistics
Subsidized 0.028 0.014 3.19 ∗∗∗
Unsubsidized 0.014
With non-tax-based subsidies 0.026 0.010 2.44 ∗∗
Without non-tax-based subsidies 0.016
With tax-based subsidies 0.031 0.004 1.54
Without tax-based subsidies 0.027
Outcome variable = EXC_EMP t + 1 Mean Difference t -statistics
Subsidized 0.342 0.095 2.49 ∗∗
Unsubsidized 0.247
With non-tax-based subsidies 0.323 0.093 2.73 ∗∗∗
Without non-tax-based subsidies 0.230
With tax-based subsidies 0.205 0.012 0.64
Without tax-based subsidies 0.193
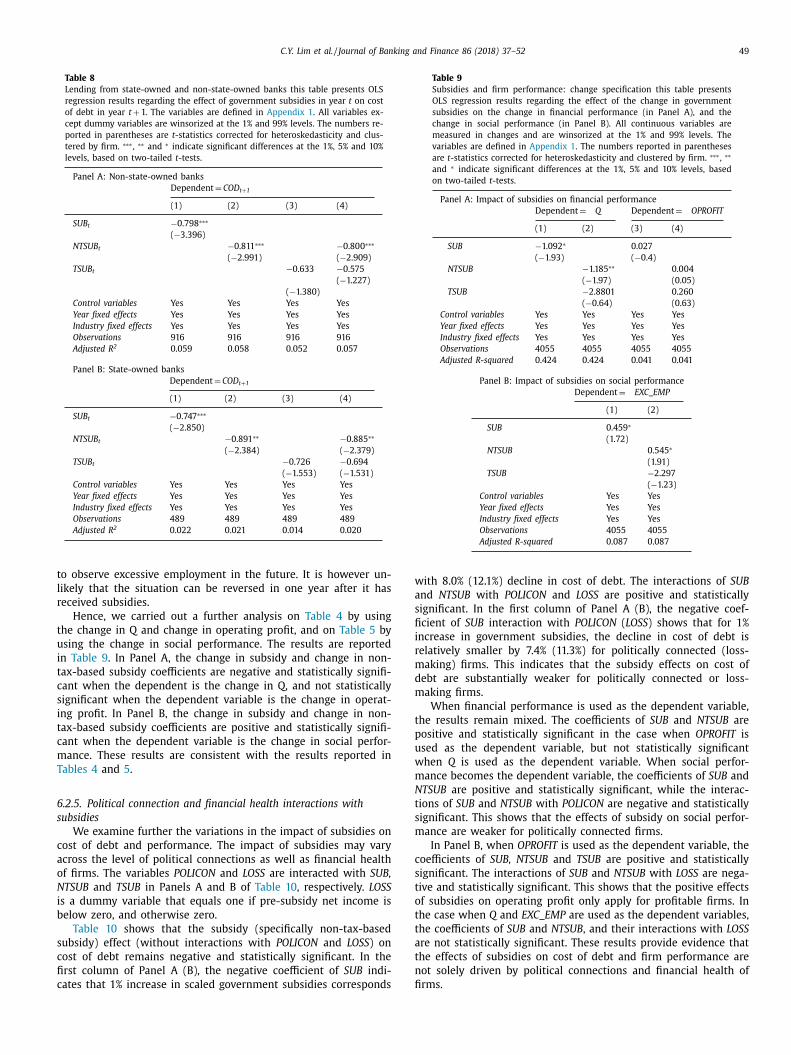
C.Y. Lim et al. / Journal of Banking and Finance 86 (2018) 37–52 49
Table 8
Lending from state-owned and non-state-owned banks this table presents OLS
regression results regarding the effect of government subsidies in year t on cost
of debt in year t + 1. The variables are defined in Appendix 1 . All variables ex-
cept dummy variables are winsorized at the 1% and 99% levels. The numbers re-
ported in parentheses are t -statistics corrected for heteroskedasticity and clus-
tered by firm. ∗∗∗ , ∗∗ and ∗ indicate significant differences at the 1%, 5% and 10%
levels, based on two-tailed t -tests.
Panel A: Non-state-owned banks
Dependent = COD t + 1
(1) (2) (3) (4)
SUB t −0.798 ∗∗∗
( −3.396)
NTSUB t −0.811 ∗∗∗ −0.800 ∗∗∗
( −2.991) ( −2.909)
TSUB t −0.633 −0.575
( −1.380)
( −1.227)
Control variables Yes Yes Yes Yes
Year fixed effects Yes Yes Yes Yes
Industry fixed effects Yes Yes Yes Yes
Observations 916 916 916 916
Adjusted R 2 0.059 0.058 0.052 0.057
Panel B: State-owned banks
Dependent = COD t + 1
(1) (2) (3) (4)
SUB t −0.747 ∗∗∗
( −2.850)
NTSUB t −0.891 ∗∗ −0.885 ∗∗
( −2.384) ( −2.379)
TSUB t −0.726 −0.694
( −1.553) ( −1.531)
Control variables Yes Yes Yes Yes
Year fixed effects Yes Yes Yes Yes
Industry fixed effects Yes Yes Yes Yes
Observations 489 489 489 489
Adjusted R 2 0.022 0.021 0.014 0.020
t
l
r
t
u
i
t
c
s
i
t
c
m
T
6
s
c
a
o
N
i
b
s
c
fi
c
Table 9
Subsidies and firm performance: change specification this table presents
OLS regression results regarding the effect of the change in government
subsidies on the change in financial performance (in Panel A), and the
change in social performance (in Panel B). All continuous variables are
measured in changes and are winsorized at the 1% and 99% levels. The
variables are defined in Appendix 1 . The numbers reported in parentheses
are t -statistics corrected for heteroskedasticity and clustered by firm. ∗∗∗ , ∗∗
and ∗ indicate significant differences at the 1%, 5% and 10% levels, based
on two-tailed t -tests.
Panel A: Impact of subsidies on financial performance
Dependent = �Q Dependent = �OPROFIT
(1) (2) (3) (4)
�SUB −1.092 ∗ 0.027
( −1.93) ( −0.4)
�NTSUB −1.185 ∗∗ 0.004
( −1.97) (0.05)
�TSUB −2.8801 0.260
( −0.64) (0.63)
Control variables Yes Yes Yes Yes
Year fixed effects Yes Yes Yes Yes
Industry fixed effects Yes Yes Yes Yes
Observations 4055 4055 4055 4055
Adjusted R-squared 0.424 0.424 0.041 0.041
Panel B: Impact of subsidies on social performance
Dependent = �EXC_EMP
(1) (2)
�SUB 0.459 ∗
(1.72)
�NTSUB 0.545 ∗
(1.91)
�TSUB −2.297
( −1.23)
Control variables Yes Yes
Year fixed effects Yes Yes
Industry fixed effects Yes Yes
Observations 4055 4055
Adjusted R-squared 0.087 0.087
w
a
s
fi
i
r
m
d
m
t
p
u
w
m
N
t
s
m
c
s
t
o
t
t
a
t
n
fi
o observe excessive employment in the future. It is however un-
ikely that the situation can be reversed in one year after it has
eceived subsidies.
Hence, we carried out a further analysis on Table 4 by using
he change in Q and change in operating profit, and on Table 5 by
sing the change in social performance. The results are reported
n Table 9 . In Panel A, the change in subsidy and change in non-
ax-based subsidy coefficients are negative and statistically signifi-
ant when the dependent is the change in Q, and not statistically
ignificant when the dependent variable is the change in operat-
ng profit. In Panel B, the change in subsidy and change in non-
ax-based subsidy coefficients are positive and statistically signifi-
ant when the dependent variable is the change in social perfor-
ance. These results are consistent with the results reported in
ables 4 and 5 .
.2.5. Political connection and financial health interactions with
ubsidies
We examine further the variations in the impact of subsidies on
ost of debt and performance. The impact of subsidies may vary
cross the level of political connections as well as financial health
f firms. The variables POLICON and LOSS are interacted with SUB,
T SUB and T SUB in Panels A and B of Table 10 , respectively. LOSS
s a dummy variable that equals one if pre-subsidy net income is
elow zero, and otherwise zero.
Table 10 shows that the subsidy (specifically non-tax-based
ubsidy) effect (without interactions with POLICON and LOSS ) on
ost of debt remains negative and statistically significant. In the
rst column of Panel A (B), the negative coefficient of SUB indi-
ates that 1% increase in scaled government subsidies corresponds
ith 8.0% (12.1%) decline in cost of debt. The interactions of SUB
nd NTSUB with POLICON and LOSS are positive and statistically
ignificant. In the first column of Panel A (B), the negative coef-
cient of SUB interaction with POLICON ( LOSS ) shows that for 1%
ncrease in government subsidies, the decline in cost of debt is
elatively smaller by 7.4% (11.3%) for politically connected (loss-
aking) firms. This indicates that the subsidy effects on cost of
ebt are substantially weaker for politically connected or loss-
aking firms.
When financial performance is used as the dependent variable,
he results remain mixed. The coefficients of SUB and NTSUB are
ositive and statistically significant in the case when OPROFIT is
sed as the dependent variable, but not statistically significant
hen Q is used as the dependent variable. When social perfor-
ance becomes the dependent variable, the coefficients of SUB and
TSUB are positive and statistically significant, while the interac-
ions of SUB and NTSUB with POLICON are negative and statistically
ignificant. This shows that the effects of subsidy on social perfor-
ance are weaker for politically connected firms.
In Panel B, when OPROFIT is used as the dependent variable, the
oefficients of SUB, NTSUB and TSUB are positive and statistically
ignificant. The interactions of SUB and NTSUB with LOSS are nega-
ive and statistically significant. This shows that the positive effects
f subsidies on operating profit only apply for profitable firms. In
he case when Q and EXC_EMP are used as the dependent variables,
he coefficients of SUB and NTSUB , and their interactions with LOSS
re not statistically significant. These results provide evidence that
he effects of subsidies on cost of debt and firm performance are
ot solely driven by political connections and financial health of
rms.
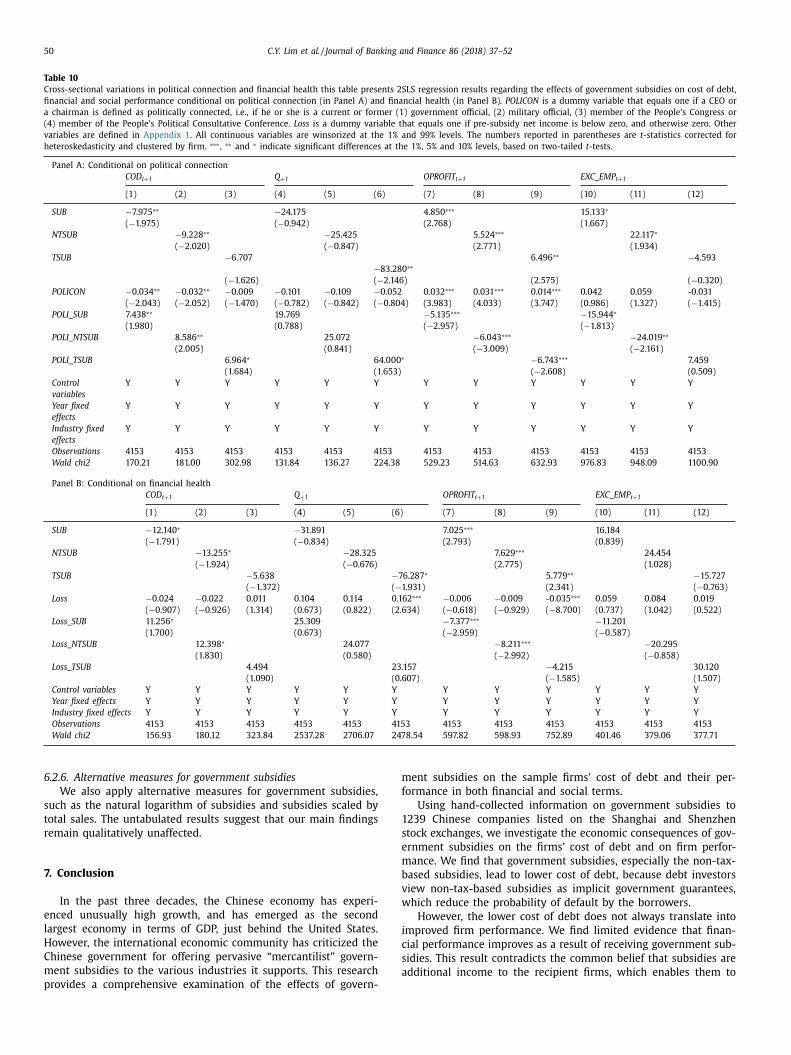
50 C.Y. Lim et al. / Journal of Banking and Finance 86 (2018) 37–52
Table 10
Cross-sectional variations in political connection and financial health this table presents 2SLS regression results regarding the effects of government subsidies on cost of debt,
financial and social performance conditional on political connection (in Panel A) and financial health (in Panel B). POLICON is a dummy variable that equals one if a CEO or
a chairman is defined as politically connected, i.e., if he or she is a current or former (1) government official, (2) military official, (3) member of the People’s Congress or
(4) member of the People’s Political Consultative Conference. Loss is a dummy variable that equals one if pre-subsidy net income is below zero, and otherwise zero. Other
variables are defined in Appendix 1 . All continuous variables are winsorized at the 1% and 99% levels. The numbers reported in parentheses are t -statistics corrected for
heteroskedasticity and clustered by firm. ∗∗∗ , ∗∗ and ∗ indicate significant differences at the 1%, 5% and 10% levels, based on two-tailed t -tests.
Panel A: Conditional on political connection
COD t + 1 Q + 1 OPROFIT t + 1 EXC_EMP t + 1
(1) (2) (3) (4) (5) (6) (7) (8) (9) (10) (11) (12)
SUB −7.975 ∗∗ −24.175 4.850 ∗∗∗ 15.133 ∗
( −1.975) ( −0.942) (2.768) (1.667)
NTSUB −9.228 ∗∗ −25.425 5.524 ∗∗∗ 22.117 ∗
( −2.020) ( −0.847) (2.771) (1.934)
TSUB −6.707
−83.280 ∗∗6.496 ∗∗ −4.593
( −1.626) ( −2.146) (2.575) ( −0.320)
POLICON −0.034 ∗∗ −0.032 ∗∗ −0.009 −0.101 −0.109 −0.052 0.032 ∗∗∗ 0.031 ∗∗∗ 0.014 ∗∗∗ 0.042 0.059 -0.031
( −2.043) ( −2.052) ( −1.470) ( −0.782) ( −0.842) ( −0.804) (3.983) (4.033) (3.747) (0.986) (1.327) ( −1.415)
POLI_SUB 7.438 ∗∗ 19.769 −5.135 ∗∗∗ −15.944 ∗
(1.980) (0.788) ( −2.957) ( −1.813)
POLI_NTSUB 8.586 ∗∗ 25.072 −6.043 ∗∗∗ −24.019 ∗∗
(2.005) (0.841) ( −3.009) ( −2.161)
POLI_TSUB 6.964 ∗ 64.0 0 0 ∗ −6.743 ∗∗∗ 7.459
(1.684) (1.653) ( −2.608) (0.509)
Control
variables
Y Y Y Y Y Y Y Y Y Y Y Y
Year fixed
effects
Y Y Y Y Y Y Y Y Y Y Y Y
Industry fixed
effects
Y Y Y Y Y Y Y Y Y Y Y Y
Observations 4153 4153 4153 4153 4153 4153 4153 4153 4153 4153 4153 4153
Wald chi2 170.21 181.00 302.98 131.84 136.27 224.38 529.23 514.63 632.93 976.83 948.09 1100.90
Panel B: Conditional on financial health
COD t + 1 Q + 1 OPROFIT t + 1 EXC_EMP t + 1
(1) (2) (3) (4) (5) (6) (7) (8) (9) (10) (11) (12)
SUB −12.140 ∗ −31.891 7.025 ∗∗∗ 16.184
( −1.791) ( −0.834) (2.793) (0.839)
NTSUB −13.255 ∗ −28.325 7.629 ∗∗∗ 24.454
( −1.924) ( −0.676) (2.775) (1.028)
TSUB −5.638 −76.287 ∗ 5.779 ∗∗ −15.727
( −1.372) ( −1.931) (2.341) ( −0.763)
Loss −0.024 −0.022 0.011 0.104 0.114 0.162 ∗∗∗ −0.006 −0.009 -0.035 ∗∗∗ 0.059 0.084 0.019
( −0.907) ( −0.926) (1.314) (0.673) (0.822) (2.634) ( −0.618) ( −0.929) ( −8.700) (0.737) (1.042) (0.522)
Loss_SUB 11.256 ∗ 25.309 −7.377 ∗∗∗ −11.201
(1.700) (0.673) ( −2.959) ( −0.587)
Loss_NTSUB 12.398 ∗ 24.077 −8.211 ∗∗∗ −20.295
(1.830) (0.580) ( −2.992) ( −0.858)
Loss_TSUB 4.494 23.157 −4.215 30.120
(1.090) (0.607) ( −1.585) (1.507)
Control variables Y Y Y Y Y Y Y Y Y Y Y Y
Year fixed effects Y Y Y Y Y Y Y Y Y Y Y Y
Industry fixed effects Y Y Y Y Y Y Y Y Y Y Y Y
Observations 4153 4153 4153 4153 4153 4153 4153 4153 4153 4153 4153 4153
Wald chi2 156.93 180.12 323.84 2537.28 2706.07 2478.54 597.82 598.93 752.89 401.46 379.06 377.71
m
f
1
s
e
m
b
v
w
i
c
s
a
6.2.6. Alternative measures for government subsidies
We also apply alternative measures for government subsidies,
such as the natural logarithm of subsidies and subsidies scaled by
total sales. The untabulated results suggest that our main findings
remain qualitatively unaffected.
7. Conclusion
In the past three decades, the Chinese economy has experi-
enced unusually high growth, and has emerged as the second
largest economy in terms of GDP, just behind the United States.
However, the international economic community has criticized the
Chinese government for offering pervasive “mercantilist” govern-
ment subsidies to the various industries it supports. This research
provides a comprehensive examination of the effects of govern-
ent subsidies on the sample firms’ cost of debt and their per-
ormance in both financial and social terms.
Using hand-collected information on government subsidies to
239 Chinese companies listed on the Shanghai and Shenzhen
tock exchanges, we investigate the economic consequences of gov-
rnment subsidies on the firms’ cost of debt and on firm perfor-
ance. We find that government subsidies, especially the non-tax-
ased subsidies, lead to lower cost of debt, because debt investors
iew non-tax-based subsidies as implicit government guarantees,
hich reduce the probability of default by the borrowers.
However, the lower cost of debt does not always translate into
mproved firm performance. We find limited evidence that finan-
ial performance improves as a result of receiving government sub-
idies. This result contradicts the common belief that subsidies are
dditional income to the recipient firms, which enables them to

C.Y. Lim et al. / Journal of Banking and Finance 86 (2018) 37–52 51
c
t
m
g
h
s
s
g
A
R
A
A
A
A
B
B
B
B
B
C
C
C
C
D
D
E
F
F
F
G
G
G
G
H
H
H
H
J
J
K
L
L
L
L
L
P
P
Q
Q
R
R
S
S
ompete by reducing the prices of their products or by enlarging
heir market share. We argue that the observed lack of improve-
ent in financial performance is caused by the social and political
oals imposed by the Chinese government. We find that firms with
igher non-tax-based government subsidies demonstrate higher
ocial performance in terms of excess employment. Overall, our re-
ults are robust to tests on endogeneity in the relations between
overnment subsidies, cost of debt, and firm performance.
ppendix 1. Variable Definitions
Variables Definition
Dependent variables
COD (Interest expenses + capitalized interest)/total debt
Q (Market value of common equity + book value of
long-term debt and current liabilities)/book value
of total assets
OPROFIT Operating profit/total assets
EXC_EMP Residuals estimated from the following equation:
EMP i,t =
α + β1 SIZE i,t + β2 AG i,t + β3 SG i,t + β4 F A i,t + ε i where
EMP is the number of employees divided by total
assets, SIZE is the logarithm of total assets, AG is
the growth ratio of total assets, SG is the growth
ratio of sales, and FA is fixed assets divided by total
assets.
Independent variables
SUB Total government subsidies excluding credit
subsidies, scaled by total assets
NTSUB Non-tax-based government subsidies excluding
credit subsidies, scaled by total assets
TSUB Tax-based government subsidies, scaled by total
assets
Control variables
SIZE Natural logarithm of total assets
PROA Pre-subsidy ROA, measured as (net income –
subsidies)/total assets
ROS Sales revenue/total assets
LEV Total debt divided by total assets
AGE Natural logarithm of the number of years since the
firm’s inception
SOE = 1 for firms ultimately controlled by government
agencies, and otherwise 0
POLICON = 1 if a CEO or a chairman is defined as politically
connected, i.e., if he or she is a current or former
(1) government official, (2) military official, (3)
member of the People’s Congress or (4) member of
the People’s Political Consultative Conference
CAPX Annual expenditure in acquiring fixed assets and
intangible assets divided by total assets
TANGIBLE The sum of fixed assets and inventory, scaled by
total assets
COVER EBIT scaled by interest charges (interest
expense + capitalized interest)
SG (Current sales revenue-last year’s sales
revenue)/last year’s sales revenue
BSIZE Natural logarithm of the number of board
members
INDPT The percentage of independent directors in a board
eferences
llen, F. , Qian, J. , Qian, M. , 2005. Law, finance, and economic growth in China. J.
Finan. Econ. 77, 57–116 . nderson, R.C. , Mansi, S.A. , Reeb, D.M. , 2004. Board characteristics, accounting re-
port integrity, and the cost of debt. J. Acc. Eco. 37 (3), 315–342 . tkinson, R.D., 2012. Enough is enough: confronting Chinese innova-
tion mercantilism. Inf. Technol. Innovation Found. Downloadable fromhttp://www.itif.org/publications/2012/02/28/enough- enough- confronting-
chinese- innovation- mercantilism .
yyagari, M. , Demirguc-Kunt, A. , Maksimovic, V. , 2010. Formal versus informal fi-nance: evidence from China. Rev. Financ. Studies 23, 3048–3097 .
aysinger, B.D. , Butler, H.N. , 1985. Corporate governance and the board of directors:performance effects of changes in board composition. J. Law Eco. Organiz. 1 (1),
101–124 .
orisova, G. , Fotak, V. , Holland, K. , Megginson, W.L. , 2015. Government ownershipand the cost of debt: evidence from government investments in publicly traded
firms. J. Financ. Eco 118 (1), 168–191 . orisova, G. , Megginson, W.L. , 2011. Does government ownership affect the cost of
debt? Evidence from privatization. Rev. Financ. Studies 24, 2693–2737 . radley, D. , Pantzalis, C. , Yuan, X. , 2016. Policy risk, corporate political strategies,
and the cost of debt. J. Cor. Financ. 40, 254–275 . randt, L. , Rawski, T.G. , 2008. China’s Great Economic Transformation. Cambridge
University Press .
haney, P.K. , Faccio, M. , Parsley, D. , 2011. The quality of accounting information inpolitically connected firms. J. Acc. Eco. 51 (1), 58–76 .
hen, D., Li, O.Z., Xin, F., 2013. Five-Year Plans, China Finance and their Conse-quences Working paper, available at SSRN: http://ssrn.com/abstract=2259388 or
http://dx.doi.org/10.2139/ssrn.2259388 . hen, X. , Lee, C.J. , Li, J. , 2008. Government assisted earnings management in China.
J. Acc. Public Policy 27, 262–274 .
hen, X. , Li, J. , 2001. Exploring the role of local government fiscal supports in ac-counting performance of the listed companies. Kuaiji Yanjiu ( J. Acc. Res. ) 12,
20–28 (in Chinese) . alton, D.R. , Daily, C.M. , Johnson, J.L. , Ellstrand, A.E. , 1999. Number of directors and
financial performance: a meta-analysis. Aca. Manage. J. 42 (6), 674–686 . onnan, S., Hornby, L., 2015. US challenges ‘illegal’ Chinese export subsidies.
Financ. Times. February 11, 2015. Available at https://www.ft.com/content/
155ede14- b1a2- 11e4- a830- 00144feab7de . isenberg, T. , Sundgren, S. , Wells, M.T. , 1998. Larger board size and decreasing firm
value in small firms. J. Financ. Eco. 48 (1), 35–54 . an, J.P. , Wong, T.J. , Zhang, T. , 2007. Politically connected CEOs, corporate gover-
nance, and post-IPO performance of China’s newly partially privatized firms. J.Financial Eco. 84 (2), 330–357 .
eng, X. , Johansson, A. , Zhang, T. , 2015. Mixing business with politics: political par-
ticipation by entrepreneurs in China. J. Banking Financ. 59, 220–235 . irth, M. , Lin, C. , Liu, P. , Wong, S.M. , 2009. Inside the black box: bank credit alloca-
tion in China’s private sector. J. Banking Financ. 33 (6), 1144–1155 . eorge, G. , 2005. Slack resources and the performance of privately held firms. Aca.
Manage. J. 48 (4), 661–676 . odement, F, Parello-Plesner, J., Richard, A., 2011. China’s scramble for Europe.
Eur. Counc. Foreign Relations Available at: http://www.ecfr.eu/page/-/ECFR37 _
Scramble _ For _ Europe _ AW _ v4.pdf . rove, A., 2010. How America can create jobs. Businessweek. July 1, 2010. Available
at http://www.bloomberg.com/bw/magazine/content/10 _ 28/b4186048358596. htm .
uariglia, A. , Liu, X. , Song, L. , 2011. Internal finance and growth: microeconometricevidence on Chinese firms. J. Dev. Eco. 96, 79–94 .
aley, U. , Haley, G. , 2013. Subsidies to Chinese Industry: State Capitalism, Business
Strategy and Trade Policy. Oxford University Press . e, G. , 2016. Fiscal support and earnings management. Int. J. Acc. 51 (1), 57–84 .
ormats, R.D., 2011. Addressing the Challenges of the China Model. U.S. Departmentof State Available at http://www.state.gov/e/rls/rmk/20092013/2011/157205.
htm . ouston, J.F. , Jiang, L. , Lin, C. , Ma, Y. , 2014. Political connections and the cost of bank
loans. J. Acc. Res. 52 (1), 193–243 . acob, M. , Johan, S. , Schweizer, D. , Zhan, F. , 2016. Corporate finance and the gov-
ernance implications of removing government support programs. J.Banking Fi-
nance 63, 35–47 . ensen, M.C. , 1986. Agency cost of free cash flow, corporate finance, and takeovers.
Am. Eco. Rev. 76 (2), 323–329 . PMG China’s 12th Five Year Plan: Overview . Available at .
ee, E. , Walker, M. , Zeng, C. , 2014. Do Chinese government subsidies affect firmvalue. Acc., Organiza. Soc. 39 (3), 149–169 .
ee, E. , Walker, M. , Zeng, C. , 2017. Do Chinese state subsidies affect voluntary cor-
porate social responsibility disclosure. J. Acc. Public Policy 36 (3), 179–200 . eeth, J.D. , Scott, J.A. , 1989. The incidence of secured debt: evidence from the small
business community. J. Financ. Quant. Anal. 24 (3), 379–394 . i, H. , Meng, L. , Wang, Q. , Zhou, L. , 2008. Political connections, financing and firm
performance: evidence from Chinese private firms. J. Dev. Eco. 87, 283–299 . in, J.Y. , Li, Z. , 2004. Policy burden, moral hazard and soft budget constraint. Eco.
Res. J. 2, 17–27 (in Chinese) .
etersen, M.A. , Rajan, R.G. , 1994. The benefits of lending relationships: evidencefrom small business data. J. Financ. 49 (1), 3–37 .
rice, A. , Weld, C. , Nance, D. , Zucker, P. , 2006. The China Syndrome: How Subsidiesand Government Intervention Created the World’s Largest Steel Industry. Wiley
Rein & Fielding LLP . i, Y. , Roth, L. , Wald, J.K. , 2010. Political rights and the cost of debt. J. Financ. Eco.
95, 202–226 .
in, B. , 2011. Political Connection, Government patronage and Firm performance:Evidence from Chinese manufacturing Firms. University of Hong Kong Working
paper . odrik, D., 2013. The New Mercantilist Challenge. Project Syndicate Avail-
able at http://www.project- syndicate.org/commentary/the- return- of- mercantilism-by-dani-rodrik .
osenstein, S. , Wyatt, J.G. , 1990. Outside directors, board independence, and share-
holder wealth. J. Financ. Eco. 26 (2), 175–191 . chuman, M., 2012. Are China’s big state companies a big problem for the global
economy. Time. February 15, Available at http://business.time.com/2012/02/15/ are- chinas- big- state- companies- a- big- problem- for- the- global- economy/ .
chwartz, G. , Clements, B. , 1999. Government subsidies. J. Eco. Surv. 13 (2), 119–147 .
52 C.Y. Lim et al. / Journal of Banking and Finance 86 (2018) 37–52
W
Z
Z
Srinidh, B. , Zhang, H. , Zhang, T. , 2011. Transparency in Politically Connected firms:Evidence from Private Sector Firms in China. City University of Hong Kong
Working paper . Stern, A., 2011. China’s superior economic model. Wall Street J..
December 1, 2011. Available at http://www.wsj.com/articles/SB10 0 01424052970204630904577056490023451980 .
Stiglitz, J.E. , 1993. The role of the state in financial markets. In: Proceedings of theWorld Bank Annual Conference on Development Economics, pp. 19–61 .
Tian, L. , Estrin, S. , 2008. Retained state shareholding in Chinese PLCs: does govern-
ment ownership always reduce corporate value. J. Compar. Eco. 36 (1), 74–89 . Trueman, B. , 1986. The relationship between the level of capital expenditures and
firm value. J. Financ. Quant. Anal. 21 (2), 115–129 .
ang, X. , Wang, S. , 2013. Chairman’s government background, excess employmentand government subsidies: evidence from Chinese local state-owned enter-
prises. China J. Acc. Res. 6 (1), 51–74 . Wei, Z. , Xie, F. , Zhang, S. , 2005. Ownership structure and firm value in China’s pri-
vatized firms: 1991–2001. J. Financ. Quant. Anal. 40 (1), 87–108 . eng, Q. , Chen, X. , 2006. State stockholder, excessive employment and labor cost.
Eco. Res. J. 5, 74–86 (in Chinese) . Zhu, S. , Chen, Y.S. , 2009. Government subsidy decisions, earnings management
incentives, and loss reversals of listed firms. China Acc. Financ. Rev. 11 (3),
115–140 . ou, H. , Adams, M.B. , 2008. Debt capacity, cost of debt, and corporate insurance. J.
Financ. Quant. Anal. 43 (2), 433–466 .