Journal of Applied Sciences & Environmental Sustainability ... · In coastal engineering, ... Dean...
63
Journal of Applied Sciences & Environmental Sustainability (JASES) VOLUME 1 ISSUE 3 DECEMBER, 2013 JASES.ORG | ISSN:2360-8013
Transcript of Journal of Applied Sciences & Environmental Sustainability ... · In coastal engineering, ... Dean...

Journal of Applied Sciences & Environmental Sustainability (JASES)
VOLUME 1 ISSUE 3 DECEMBER, 2013
JASES.ORG | ISSN:2360-8013
Table of Contents
Remote Detection Of Shoreline Changes At Kerteh Bay, Terengganu Malaysia …………………………………………………… 1
Assessing the Perceptions of Regional Stakeholders on Benefits of PFI for Infrastructure Provision ………………. 10
QoS Performance for Monitoring and Optimization of Data and VoIP traffic in WiMAX Network Mac Layer………… 21
Evaluation of Groundwater Interaction with Lake L5, Universiti Teknologi Petronas, Malaysia, using Seepage Meter and Mini-Piezometer………… 38

Towards Safer Laboratories: An Incident-Report Safety Knowledge Transfer Model …………………….. 46

©Journal of Applied Sciences & Environmental Sustainability (JASES) 1 (3): 12-20, 2013
1
Research Article
Detection of shoreline changes at Kerteh Bay, Terengganu Malaysia remotely
Lawal Abdul Qayoom Tunji, AP Mustafa Hashim Ahmad and AP Khamarulzaman Wan Yusuf
Department of Civil Engineering, Universiti Teknologi PETRONAS Seri Iskandar, Tronoh 31750, Perak, Malaysia Email: [email protected] Tel +6 014 923 6294
ARTICLE INFO Article history Received: 27/08/2013 Accepted: 04/11/2013
A b s t r a c t Erosion has been a problem at the Kerteh Bay Coast of Malaysia for over a decade. Installation of three submerged breakwaters was put in place to mitigate the erosion problem in 1996. But unfortunately the projects has not been monitored to ascertain how well the problem has been mitigated. Actual field monitoring only commenced in 2011 after about 14 years. This paper discuses the performance of the installed submerged breakwater being monitored using a waterline technique of remote sensing. Satellite imageries of the study area of years, 2006, 2008 and 2009 were acquired for the purpose of monitoring.
© Journal of Applied Sciences & Environmental Sustainability. All rights reserved.
Coastal erosion, remote Sensing, tidal correction
1. Introduction
Coastal erosion is a global problem; at least 70% of sandy beaches around the world are recessional
(Bird,1985). Approximately 86% of U.S East Coast barrier beaches (excluding evolving spit areas) have
experienced erosion during the past 100 years (Galgano et al., 2004).Widespread erosion is also well
documented in California (Moore et al., 1999) and in the Gulf of Mexico (Morton and McKenna, 1999).
This natural phenomenon is said to be reported in Asian and other countries along the ocean. Erosion has
been reported in China (Bilan, 1993), also in Vietnam by Mazda et al. (1997).
Shoreline changes are an important consideration for coastal scientist, engineers, and those engaged
in coastal management and engineering design. The location of the shoreline and its historical rate of
change can provide important information for the design of coastal protection, plans for coastal
development, and the calibration and verification of numerical models, etc. (Hanson et al, 1998). To
©Journal of Applied Sciences & Environmental Sustainability (JASES) 1 (3): 12-20, 2013
2
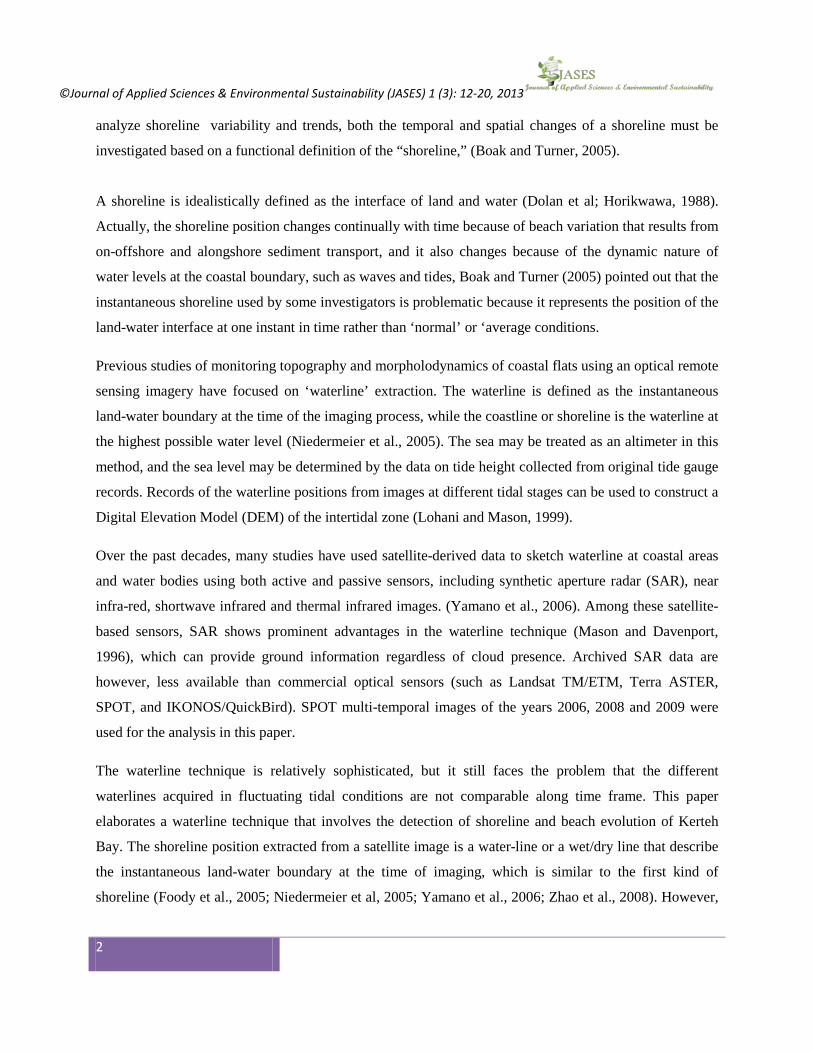
analyze shoreline variability and trends, both the temporal and spatial changes of a shoreline must be
investigated based on a functional definition of the “shoreline,” (Boak and Turner, 2005).
A shoreline is idealistically defined as the interface of land and water (Dolan et al; Horikwawa, 1988).
Actually, the shoreline position changes continually with time because of beach variation that results from
on-offshore and alongshore sediment transport, and it also changes because of the dynamic nature of
water levels at the coastal boundary, such as waves and tides, Boak and Turner (2005) pointed out that the
instantaneous shoreline used by some investigators is problematic because it represents the position of the
land-water interface at one instant in time rather than ‘normal’ or ‘average conditions.
Previous studies of monitoring topography and morpholodynamics of coastal flats using an optical remote
sensing imagery have focused on ‘waterline’ extraction. The waterline is defined as the instantaneous
land-water boundary at the time of the imaging process, while the coastline or shoreline is the waterline at
the highest possible water level (Niedermeier et al., 2005). The sea may be treated as an altimeter in this
method, and the sea level may be determined by the data on tide height collected from original tide gauge
records. Records of the waterline positions from images at different tidal stages can be used to construct a
Digital Elevation Model (DEM) of the intertidal zone (Lohani and Mason, 1999).
Over the past decades, many studies have used satellite-derived data to sketch waterline at coastal areas
and water bodies using both active and passive sensors, including synthetic aperture radar (SAR), near
infra-red, shortwave infrared and thermal infrared images. (Yamano et al., 2006). Among these satellite-
based sensors, SAR shows prominent advantages in the waterline technique (Mason and Davenport,
1996), which can provide ground information regardless of cloud presence. Archived SAR data are
however, less available than commercial optical sensors (such as Landsat TM/ETM, Terra ASTER,
SPOT, and IKONOS/QuickBird). SPOT multi-temporal images of the years 2006, 2008 and 2009 were
used for the analysis in this paper.
The waterline technique is relatively sophisticated, but it still faces the problem that the different
waterlines acquired in fluctuating tidal conditions are not comparable along time frame. This paper
elaborates a waterline technique that involves the detection of shoreline and beach evolution of Kerteh
Bay. The shoreline position extracted from a satellite image is a water-line or a wet/dry line that describe
the instantaneous land-water boundary at the time of imaging, which is similar to the first kind of
shoreline (Foody et al., 2005; Niedermeier et al, 2005; Yamano et al., 2006; Zhao et al., 2008). However,

©Journal of Applied Sciences & Environmental Sustainability (JASES) 1 (3): 12-20, 2013
3
to accurately asses the movement trends of the beach, an MSL tidal-datum-based shoreline indicator is
practically necessary.
2.0 Materials and Methods
2.1 Study area
The study area is located within a town called Kerteh in the district of Kemamam in Southern
Terengganu, Malaysia, about 30 km or 20 minutes’ drive north of Chukai. Kerteh is the base of operations
for Petronas in Terengganu, overseeing the oil platform operations off the state’s coast. Kemamam is a
district of2,536 km2 area with a population of 174,876. It geographical location is 4º 31! 38" N and 103º
28! 9" E. The stretch of the beach protected is approximately 2100m.
Figure 1.0: Map of study area
The study area is characterized with much of its coast to be a series of large and small hook-shaped bays,
fully exposed to direct wave attack (especially during the NEmonsoon)from the South China Sea. The
geomorphologic feature of Kerteh bay is such that its development is controlled by protruding headlands.
Most of the bays along this region are considered to be in dynamic equilibrium; this is when constant
supply of material from upcoast or within its embayment is passing through the bay and beyond the

©Journal of Applied Sciences & Environmental Sustainability (JASES) 1 (3): 12-20, 2013
4
downcoast headland. The littoral drift rate, associated with the dynamically stable configuration of Kerteh
Bay, has been computed to be some 210,000 m3/yr of which more than 80% is transported during the
NE-monsoon period.
The cause of the coastal erosion at the study area Kerteh bay, was studied by Tilmans et al. (1992). Some
major causes were highlighted by the researchers. The
beach platform at Kerteh bay is such that there exists a continual longshore sediment transport from
upcoast to downcoast, disruption of this dynamic stability may easily occur when upcoast sediment
supply is (partly) cut off which can result into erosion of the coast leading to a larger indentation of the
bay configuration. If the entire upcoast sediment supply is cut off, the bay would become even more
indented until littoral drift ceases.
2.2 DETERMINATION OF SHORELINE
In coastal engineering, the change in shoreline positions is commonly used to evaluate practical beach
change. The sophisticated method is called the one-line model or shoreline change model. It is assumed
that the beach moves offshore or onshore with one bottom profiles as shown in Figure 2. The figures
shows three beach profiles at three different: At time ti, the waterline is located at xi,
away from the origin of the transformed coordinates, and the corresponding water depth is hi above or
below MSL, when the sea surface is at MSL, the MSL-datum-based shoreline is located at zi away from
the origin. Figure 2 illustrates an example of a beach profile moving from right to the left. If the extracted
waterlines from satellite images at time t2 and t3 are located at x2 and x3, respectively, x3>x2. Extracted
waterlines (x2 and x3) without consideration of tidal effect imply that the beach moves from the left to the
right. This inference conflicts with the assumption figures 2. Shifting the extracted water to the MSL-
datum-based shoreline position is necessary to accurately estimate the beach movement. (Wei and Hsien,
2009)

©Journal of Applied Sciences & Environmental Sustainability (JASES) 1 (3): 12-20, 2013
5
Figure 2: Beach profiles at three different times symbolic notation
The Gausian algorithm was first applied on the satellites images to improve the quality of the images, the
three satellite images is geo-refenced using image-image registration method. Classification image is
classified using ISODATA (unsupervised) method of classification. Subsetting, reducing the area of
interest was also performed on each of the images for a more detailed analysis. The flow chart for the
procedure applied to extract the shoreline is given in Figure 3.

©Journal of Applied Sciences & Environmental Sustainability (JASES) 1 (3): 12-20, 2013
6
Figure 3.0: Flow chart of procedure for shoreline extraction
3. Results and Discussion
Images were acquired as in Figure 3.0, subsetting was performed to reduce the area of interest as in Figure 3.1.
Satellite imageries
Geo-referencing
Subsetting
Subsetting
Classification
Tidal data acquisition
Water line extraction
Water line corrected based on tide
Area of erosion and accretion

©Journal of Applied Sciences & Environmental Sustainability (JASES) 1 (3): 12-20, 2013
7
Figure 3.0: Acquired image of 2009 of the study area
Figure 3.1: Subset of the acquired image
The study area was reduced to 10 region of areas to improve the analysis on each area. Each of the smaller
areas was classified as shown in Figure 3.2 using the ISODATA method of classification.
©Journal of Applied Sciences & Environmental Sustainability (JASES) 1 (3): 12-20, 2013
8
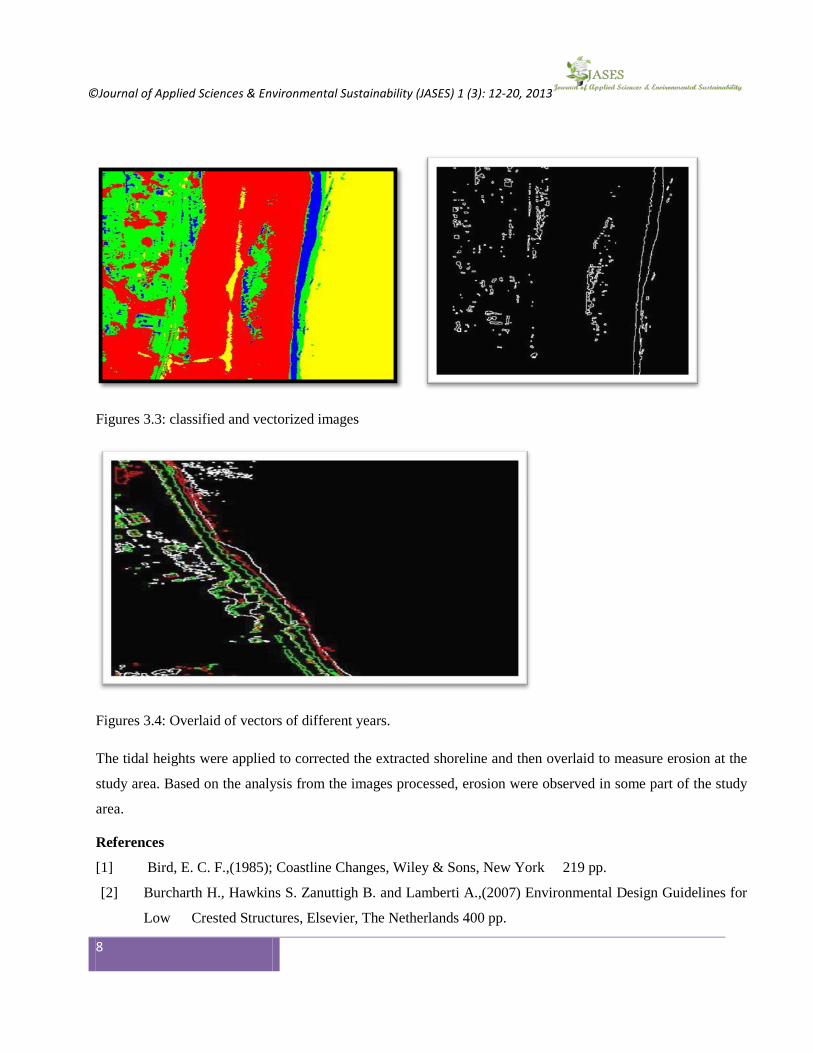
Figures 3.3: classified and vectorized images
Figures 3.4: Overlaid of vectors of different years.
The tidal heights were applied to corrected the extracted shoreline and then overlaid to measure erosion at the
study area. Based on the analysis from the images processed, erosion were observed in some part of the study
area.
References
[1] Bird, E. C. F.,(1985); Coastline Changes, Wiley & Sons, New York 219 pp.
[2] Burcharth H., Hawkins S. Zanuttigh B. and Lamberti A.,(2007) Environmental Design Guidelines for
Low Crested Structures, Elsevier, The Netherlands 400 pp.

©Journal of Applied Sciences & Environmental Sustainability (JASES) 1 (3): 12-20, 2013
9
[3] Bermudez, J. L. and Peinado, M.D. (2005) El Riesgo de Tsunami en Andalucia, Spin Cero, 9: 3-8
[4] Chasten, M. A., Rosati, J. D., McCormick, J.W., (1993), Engineering design guidance for detached
breakwater as shoreline stabilization structures. US Army Corps of Engineers, Waterway
Experiment Station, Vicksburg, Report CERC 93-19. 125 pp.
[5] Dally, W. R., & Pope, J. (1986). Detached breakwaters for shore protection. CERC-IR-86-1. In:
Vicksburg, MS: US Army Corps of Engineers, Coastal Engineering Research Centre.
[6] Dean R. G and R. A Dalrymple,(2001) Coastal Processes with Engineering Applications, Cambridge
University Press 488p.
[7] Dean, R. G., Browder, A., Goodrich, M.S., Donaldson, D.G., 1994. Model tests of the proposed P.E.P.
reef installation at Vero Beach, Florida. Tech. Rep. UFL/COEL-94-012, Coastal and
Oceanographic Engineering Department. University of Florida, Gainesville, FL. 28 pp.
[8] Dean, R. G., Chen, R., Browder, A.E., 1997. Full scale monitoring study of a submerged breakwater.
Coastal Engineering, vol. 29. Palm Beach, Florida USA, pp. 291-315.
[9] Deguchi, I., Sawarangi, T., 1986. Beach Fill at two coasts of different configuration. Proc. 20th
International Conference on Coastal Engineering ASCE, Taipei, Taiwan, pp. 1032-1046.
Appendix
Figure 1: Maximum Tardiness (example)

©Journal of Applied Sciences & Environmental Sustainability 1 (3): 1-11, 2013
10
Research Article
Assessing the Perceptions of Regional Stakeholders on benefits of PFI for infrastructure provision
Abdullahi A. Umar, Noor Amila Wan Abdullah Zawawi, Dept. of Civil Engineering, Universiti Teknologi PETRONAS
Bandar Seri Iskandar 31750 Tronoh Perak, Malaysia
Email: [email protected] Tel +6 017 461 5710
ARTICLE INFO Article history Received: 2/04/2013 Accepted: 21/10/2013
A b s t r a c t The Private Finance initiative (PFI) has been touted as providing value for money (VFM) than any other form of public procurement. While it cannot be denied that PFI has helped provide infrastructures faster than would have been possible relying solely on public budget, the VFM argument which is the most claimed benefit has continued to be elusive. This study which sought the perceptions of stakeholders attending two (2) PFI-focused conferences held in Malaysia through survey questionnaires, on the benefits of PFI in infrastructure since its introduction into the public sphere found, consistent with earlier commentators, that among the major benefits achieved so far, value for money fails to rank among the most important benefits of PFI procurement strategy. The delegates ranked 1) encouraging a more innovative public sector, 2) Improved business confidence, 3) Contribution to economic growth, 4) Better accountability, 5) increased investment in infrastructure, and 6) helping government spread payment over life of the asset, as the most important benefits derived so far from PFI procurement strategy out of 20 identified benefits, with value for money coming a distant 14th place on the list. © Journal of Applied Sciences & Environmental Sustainability. All rights reserved.
PFI, Benefits, Strategy, Value for money, public procurement
1. Introduction
The involvement of private participation in infrastructure provision has been on-going for a long time under
the traditional procurement method. However, their involvement was limited to advisory roles/consultancy,
design, planning, environmental impact assessment, representing the client as an independent umpire,
construction and maintenance. However, since the advent of the public sector reform tagged ‘New public
Management (NPM), which is the attempt to implement management ideas from business and private sector
into the public services (Haynes, 2003); there has occurred a dramatic change in the form and substance of
private involvement in the provision of public infrastructure. Faced with increasing external debt, shortage

©Journal of Applied Sciences & Environmental Sustainability 1 (3): 1-11, 2013
11
of funds, population explosion in developing countries, there evolved an urgent need for other means of
providing public services so that government can turn its attention to more critical areas requiring funding.
This urgent need for an alternative source of financing infrastructure led to the evolution of what is today
known in many climes as Public private Partnerships (PPP) or Private Finance Initiatives (PFI). In some
jurisdictions, the PFI is synonymous with the PFI (CBI, 2007) but in the UK, the PFI is considered a special
case of PPP where all finances for the asset including the design, construction and maintenance thereof is
included in the contract arrangement for the duration of the contract in return for a service charge (Fewings,
2005, p. 280). While this is not the first time governments have been known to undertake this complex
method of infrastructure provision, (Hodge & Greve, 2007) highlights five different ‘families’ of this
partnership between government and the private sector. They include:
[1.] Institutional co-operation for joint production (Netherlands Ports Authority)
[2.] Long-term infrastructure contracts (UK PFI)
[3.] Public policy Networks (in which loose stakeholder relationships are emphasised)
[4.] Civil society and community development
[5.] Urban renewal and Downtown Economic Development (USA)
Outsourcing is also a form of this partnership if the subject of the deal is a public infrastructure, so also are
a number of privatisations undertaken in the past like the Malaysian PLUS Highway contract which
connects the North and South of peninsula Malaysia. It is difficult to really say which is a total
privatisation or a partnership in the sense in which governments want the electorates to understand them.
However (Broadbent & Laughlin, 2003) provide a simple measure which in our opinion sufficiently
differentiate between core privatisation and the present day partnerships being bandied around the globe,
they observed that the simple difference between the two concepts is the presence of ‘a regime of state price
regulation’. This does not mean that network infrastructures which are monopolistic in nature were not
privatised in the early days of the privatisation exercise in many countries, however the loss of democratic
control and exorbitant increases in service fees led to takeovers by various government wanting to avoid the
political backlash that ensued. In response to how citizens viewed privatisation (Hodge & Greve, 2009)
observed that a number of governments have tried to avoid using the term ‘privatisation’ or ‘contracting
out’ in favour of speaking about ‘partnerships’. The push for market mechanism in the provision of
infrastructure were also as a result of particular interest groups like the multi-lateral financial institutions
who made the involvement of private operators a condition for extending loans to governments. For
example, the world bank provided a $20 million loan to the government of Bolivia on the condition that it
privatised its water and sewerage utilities in La Paz and Cochabamba, this the government did but due to
exorbitant rate hikes the residents took to the streets and eventually the concession was revoked
(Bonnardeaux, 2009). Latin America has been the most active in term of private involvement in network
infrastructure, however, they also contain the most amount of renegotiated contracts which (Guasch, 2004)

©Journal of Applied Sciences & Environmental Sustainability 1 (3): 1-11, 2013
12
puts at 50%. Lobbying pressure and support for Private involvement in infrastructure also come from
interest groups likely to benefit from the policy, including, banks, lawyers and contractors (Parker &
Hartley, 2003), this position was also echoed by (Dombkins, 2006) who argues that “We are not seeing any
public push for more PFIs, nor are we seeing Audit Offices finding and reporting on the benefits that PFIs
are delivering to society. Unfortunately, all too often PFI are promoted by merchant banks which see PFI as
pots of gold. However, the benefits that are attributed to the PFI are not unique. Other forms of procurement
have the potential to deliver many of the benefits claimed by the PFI, however because of the insistence and
pressure by the central government to use only the PFI for new capital projects there has been little
opportunity to develop these” (Cartlidge, 2004). A situation was reported by (Cohn, 2008) where a regional
government had to create a self-inflicted financial crisis just to get the public to support the use of PFI. In
spite of the horrid experiences, PFIs are “attractive to governments because they provide for the
construction of the essential infrastructure without direct capital outlay and the delivery of related services
without the need for the public sector employees to maintain and operate infrastructure projects” (English &
Guthrie, 2003). Therefore following on the heels of (Hodge & Greve, 2009) question on ‘how have Long
Term Infrastructure Contracts (LTIC-Type) PPPs performed according to historical evidence till date? And
the assessments of (Estache, 2005), questions if we are switching to Private Participation in Infrastructure
Divorces? This paper seeks to assess, from the perceptions of stakeholders across five regions that filled
out survey questionnaires, if the main benefits promised by PFI are being achieved?
2. The state of the practice
The public sector has always been criticised for its inefficiency in providing public services efficiently,
instead of giving thoughts to how to overcome this problem their jobs were outsourced to the private sector
in the form of Public private partnerships (PPP) or Private Finance Initiatives (PFI). a number of reasons
have been put up to support the need for private involvement in infrastructure, (Hodge & Greve, 2009)
observed that some of the reasons presented under John Major’s government for adopting the PFI include 1)
get around public sector debt restrictions, 2) reduce pressure on public sector budget, 3) better value for
money for taxpayers, 4) Better accountability, 5) Better On-time and On-Budget delivery, 6) Greater
Innovations in service delivery, 7) Encouraging a more innovative public sector, 8) Improved business
confidence and 9) Boost sales of professional PPP services abroad. The (MOF, 2004) also claims that the
main aims of implementing PPPs in Singapore include: (a) allowing the public sector to get better value for
money in the delivery of public services; (b) offering the private sector more business opportunities and
more room to innovate and offer efficient solutions for public services; and (c) combining the expertise of
the government and the private sector to meet the needs of the public effectively and efficiently. Other
studies observed that the PFI was adopted to reduce pressure on public finances (Asenova & Beck, 2010),
faster provision of services than would have been possible relying solely on the government (Parker &

©Journal of Applied Sciences & Environmental Sustainability 1 (3): 1-11, 2013
13
Hartley, 2003), private sector expertise, innovations and operational efficiency (Zhang & Kumaraswamy,
2001) & (Siang, 2008), technology transfer (Li, Akintoye, Edwards, & Hardcastle, 2005), value for money
(VFM) (Parker & Hartley, 2003), (Cartlidge, 2004) and costs savings (The Commission on PPP, 2001).
(Fewings, 2005, p. 280) Also observed that, the PFI helps manage the twin risks of time and cost overruns,
however, under the traditional procurement these two risks are taken care of under the Liquidated and
Ascertained Damages (LAD) clauses in the conditions of contract. Therefore, the claims are not specific to
the PFI alone. The major risks in a PFI are construction risks which only occur during the initial period of
asset provision and this may fall within the first 3 years of the contract and after construction most of the
risks are no longer there, however, with the improved technology in the industry, these risks have been
greatly reduced to be of any significant threat. Some consortiums have used this period to renegotiate the
terms of their loans with their financiers resulting in huge gains from refinancing which, in spite of the
provision for refinancing gains sharing, consortium are still reluctant to share the gains with the public
sector client. (Shaoul, 1999) points out that, in the Greenwich Hospital Scheme, seven of the eight risks said
to be transferred to the private investors related to the construction phase of the project and therefore could
not threaten the income of the investors during the operational phase of the project. As the PFI becomes
more and more used in practice, problems and failures have been observed in the management of many
projects like the Eurotunnel, Railtrack, motorways concessions in Mexico or Urban motorway TEO in Lyon
(Meunier & Quinet, 2010). The problems and criticisms being encountered has resulted in reduced adoption
of the PFI approach. (Estache, 2005) Cites a PriceWaterHouseCoopers’ report (PwC, 2005) where it is
claimed that there appears to be a significant drop in private involvement in infrastructure from a peak of
$131 billion in 1997, to less than $50billion in 2003. The situation has seen large infrastructure projects
which would otherwise have been contracted to the private sector being retained in-house, for example the
state of California in the U.S recently approved a whopping $68 billion of public funds in the form of bonds
for the provision of a proposed high speed rail (Lin, 2012), this is coming from a country that has been at
the fore of pushing for private involvement in infrastructure provision. (Nickson & Vargas, 2002) argue that
infrastructure concessions bring about five problems namely, 1) Moral hazard where one party behaves
opportunistically after signing the contract, 2) Asymmetric information, where one party has more
information about quality and cost of inputs than the other party, 3) Problem of ‘first mover’, where the
winning bidder has the advantage of securing future contracts with the same party, 4) High participation
costs which limits competition and costs are passed onto the users and finally 5) The presence of monopoly
where the franchise is protected from market forces by an excessively long period of more than 10 years.
This is especially more serious in network utilities. (Gaffney, Pollock, Price, & Shaoul, 1999) argue that
investment under the private finance initiative cost more than the public sector procurement, the position is
also supported by (Blanc-Brude, Goldsmith, & Välilä, 2009) who found that the PFI was 24% more
expensive than the traditional procurement on roads, however, they asserted that the extra cost was for risks

©Journal of Applied Sciences & Environmental Sustainability 1 (3): 1-11, 2013
14
being borne by the private sector. But (Gaffney, Pollock, Price, & Shaoul, 1999) countered the risk transfer
argument by claiming that the amount of risk transfer to the private sector under the PFI was exaggerated.
In order to limit the criticisms levelled against the PFI, governments and the PFI policy advocates came up
with the Public Sector Comparator (PSC), a hypothetical control project assumed to be representative of
how the public sector ‘would have financed the project’ under consideration, that is used to assess if the PFI
option would deliver better value for money than if the project were done traditionally. However, (Pollock,
Shaoul, & Vickers, 2002) point out that the discount rate adopted has a crucial impact on whether PFI offers
better value that the traditional grant system. While the PSC being used employs a discount rate of 6%,
generally it has been shown that 3% is used for public sector borrowing hence would make the project
cheaper if financed through public borrowing. (UNISON Scotland, 2007) observed that obsessive secrecy
and claims of commercial confidentiality has made it difficult to obtain figures to properly assess the
validity of value for money (VFM) claims being espoused by the government. Relevant documents have
frequently either not been published or have had key financial information withheld. (Shaoul, Stafford, &
Stapleton, 2012) Supported this view by arguing that there is a need for information to be accessible to the
public, and in particular a stream of information between the public and private sector partners needs to be
developed and disseminated to achieve accountability for public money that is increasingly spent in the
private sector. In conclusion, the experiences on the Balmoral high school, Cochabamba (Nickson &
Vargas, 2002), Indah water Konsortium (Abdul-aziz, 2001 ) and the Buy-backs of of Skye Bridge (bought
back at 26.7 million pounds),Inverness Airport (bought back in 2005 at 25 million pounds only 1.6 %
cheaper than PSC figures), and West Lothian College (UNISON Scotland, 2007) seem to portray a different
story from what was promised at the inking of the various contracts. (Mehra, 2005) Has also presented a list
of 100 PFI projects (in Canada, Australia and the UK) which have faced at least one of the risks the PFI was
said to prevent (time overruns, cost overruns, service cuts, design problems etc). The best reading of the
situation is that private involvement in infrastructure (Budds & McGranahan, 2003 ) has achieved neither
the scale nor benefits anticipated. This leads to the question, has the PFI delivered on its promises?
3. Research methodology
A literature review was carried out to identify the basic assumptions upon which governments have decided
to adopt the PFI procurement strategy in the belief that knowledge accumulates and one can learn from and
build on what others have done in the past (Webster & Watson, 2002). In total 20 benefits of PFI were
identified from the literature and included in the survey questionnaire. The survey questionnaires were
targeted at delegates at 2 PFI/infrastructure-focused conferences in Kuala Lumpur, Malaysia with a
combined total of 300 delegates from 28 countries. 165 questionnaires were successfully distributed, but
only 44 were returned resulting in a return rate of about 26.6% . This is comparable with (Proverbs, Holt, &
Olomoaiye, 1999)’s 21% achieved in the UK. The collected data were entered into SPSS statistical software

©Journal of Applied Sciences & Environmental Sustainability 1 (3): 1-11, 2013
15
version 17.0 and analysed to draw inferences, while the relative importance index (RII) was used to rank the
benefits as perceived by the respondents. The index generates values between 0 to 1 and the closer to 1 a
value gets the more important it is perceived to be. The relative importance index (RII) was used by
(Odusami, 2002) to rank the skills of effective project leaders as perceived by Construction Professionals,
while (Enshassi, Mohamed, & El Karriri, 2010) used the RII to rank factors affecting the Bid/No Bid
Decision in the Palestinian construction industry and was also used by (Fugar & Agyakwah‐Baah, 2010) to
rank delay factors in construction projects in Ghana.
4. Results and Discussion
The results reveal that 8 of the respondents were delegates from Africa, 27 from Australasia (a grouping of
Asia and Australia), 6 from the Middle East, 1 delegate from Europe and 2 delegates from North America.
In terms of sector, 28 of the delegates belonged to the public sector while 16 were in the private sector. The
reliability test carried out on the data returned a Cronbach’s alpha of 0.947, using the guide provided by
(George & Mallery, 2003, p. 231) an alpha Greater than 0.9 = Excellent; this shows that the data collection
instrument was reliable. In terms of validity, a generally accepted rule of thumb for explaining construct
validity was provided by (Hinton, Brownlow, McMurray, & Cozens, 2004) who pointed out a validity test
score of more than 0.90 is statistically considered excellent; 0.70 - 0.90 is high, 0.5 - 0.7 is moderate while
below 0.50 indicates a low validity rate of the variables, meaning that the questionnaire did not measure
what it was constructed to measure. However, for this data, the average extracted value obtained was 0.76
which indicates a high overall validity of the data; hence, the high validity value obtained is a clear
indication that the questionnaire measured what it was constructed to measure (Dewberry, 2004).
The Spearman Rank Correlation Coefficient may be employed as a test statistic to test a hypothesis of no
association/no agreement between pairs of measurements from two populations. For a given value of alpha
(level of significance) and for a two-tailed test, the rejection region of null hypothesis (Ho) occurred if rs ≥
ro or if rs ≤ -ro, where ro is the critical value of Spearman’s Rank Correlation Coefficient (Mendenhall,
Reinmuth, & Beaver, 1993, p. 1006) . The degree of agreement is expressed as a “correlation coefficient”.
In terms of the correlation in their ranking, the guide provided by (Cohen, 1992) was employed in
explaining the results of the spearman’s correlation coefficient tests. According to his guide, the
correlations are either positive or negative depending on the direction. If the value carries a negative value,
then there might be a strong, weak, moderate or perfectly negative correlation; the same goes for positive
values. His guide is as follows, 0.0=none/trivial, 0.1/-0.1=weak/small, 0.3/-0.3=moderate/medium, 0.5/-
0.5=strong/large and 1.0/-1.0= perfect, hence the closer to 1.0 the value gets, the stronger the correlation.
On the correlation in terms of ranking between the three regions under consideration, The spearman’s
correlation coefficient between the ranking of African/Australasian delegates was found to be (rho) ρ=0.31
which suggests a moderate/medium positive correlation; that between Australasian/Middle East delegates

©Journal of Applied Sciences & Environmental Sustainability 1 (3): 1-11, 2013
16
was (rho) ρ=0.48 which indicates strong/large positive correlation while between Middle East/African
delegates was (rho) ρ=0.07 indicating a weak/small positive correlation. However, (Corder & Foreman,
2009, p. 123) observed that “the correlation strength assignments vary for different types of statistical tests
and that the r values are not based on a linear scale”.
Table 1: RII of the perceived benefits of PFI as ranked by Respondents
Benefits from adopting PFI Africa Ranking Aus/Asia Ranking M/East Ranking Overall Ranking
1 Encouraged a more innovative public sector 0.83 7 0.73 10 0.83 2 0.80
2 Improved business confidence 0.85 3 0.75 4 0.80 3 0.80
3 Contribution to economic growth 0.80 10 0.75 5 0.83 1 0.79
4 Better accountability 0.85 4 0.72 12 0.80 6 0.79
5 Increased investments in infrastructure 0.80 11 0.76 3 0.77 7 0.78
6 Help government spread payment for asset 0.83 8 0.78 1 0.73 11 0.78
7 Greater innovation in service delivery 0.78 12 0.74 7 0.80 4 0.77
8 Improved efficiency through competition 0.78 13 0.74 8 0.80 5 0.77
9 On-time delivery of assets 0.85 5 0.76 2 0.70 12 0.77
10 On-budget delivery of assets 0.85 6 0.72 13 0.70 14 0.76
11 Reduce pressure on public budget 0.88 1 0.71 14 0.70 15 0.76
12 Helped achieve technology transfer 0.75 15 0.74 9 0.77 8 0.75
13 Helped overcom design and constn risks 0.83 9 0.74 6 0.67 18 0.75
14 Provide better value for money 0.88 2 0.65 19 0.67 19 0.73
15 Boost sale of professional PFI services abroad 0.70 17 0.7 17 0.77 9 0.72
16 Better access and affordability for end-users 0.70 18 0.69 18 0.77 10 0.72
17 Improves governnace 0.75 16 0.7 16 0.70 16 0.72
18 Help get around public sector debt restriction 0.70 19 0.73 11 0.70 13 0.71
19 Contribute to fiscal stabilisation 0.78 14 0.7 15 0.63 20 0.70
20 Helps eliminate corruption 0.70 20 0.62 20 0.70 17 0.67 Table 1 below shows the benefits which have been ranked using their relative importance index (RII)
values. The responses by the delegates from the various regions were assessed and ranked differently, and
later an overall ranking was carried out. A cursory look at the ranking shows that African delegates had
more consensus among their ratings, followed by Middle East delegates while the Australasian delegates
had the least convergence within regions. As can be seen from the table, the overall ranking shows that
‘Encouraging a more innovative public sector’ was ranked as the most important benefit that has been
achieved through the use of the PFI with an RII=0.80. However this benefit was ranked in 7th place by
African delegates, 10th place by Australasia and 2nd place by Middle East delegates. The reason is not far-
fetched, the advent of the PFI has brought out the inadequacies in the public sector and governments across

©Journal of Applied Sciences & Environmental Sustainability 1 (3): 1-11, 2013
17
the globe have responded by funding training programmes to enhance public sector skills hence the rating
given to that factor.
In 2nd place was ‘improve business confidence’ which actually tied in RII values with the above benefit
(RII=0.80). The spate of foreign participation in infrastructure contributed to this factor’s ranking, because
most PFI projects were executed by foreign contractors with the technical know-how for complex projects.
‘Contribution to economic growth’ RII=0.79 ranked 3rd, this is not surprising because the link between
infrastructure availability and economic growth have been established by researchers in economic
development including (Thanh & Dapice, 2009) & (World Bank, 2007.). But in terms of region on this
benefit, it was ranked by African delegates in 10th place, Australasia 5th place and Middle East delegates
ranked it in 1st place.
Better accountability tied in 3rd place with an RII=0.79, this points to the fact that PFI has helped achieve
better accountability owing to the limited amount of money spent by the public sector to get such complex
projects. The costs incurred are mostly in relation to hiring of consultants and in contract management. The
respondents’ ranked ‘increased investments in infrastructure’ in 4th place overall, while African delegates
ranked it in 11th place, Australasia 3rd place and 7nd place by Middle East delegates. Generally, using PFI,
the government can afford to approve multiple contracts running into billion since they are not required to
make any contributions to the project in ‘theory’, hence the favourable ranking. In 5th place is ‘help
government spread payment over the life of the project’, this is especially through of the UK and some
countries in Europe where for example Shadow Tolls are used on motor ways. But African delegates ranked
this benefit in 8th place, Australasia 1st place and 11th place by Middle East delegates. The ranking given to
this benefit by the Australasia delegates seem to reflect their longer experiences with the PFI. The most
surprising ranking on the table is the benefit ‘Provide better value for money (VFM), while the overall
ranking placed it at 14th place which is not enviable since it is the most often cited reason for PFI adoption
by the proponents, even more surprising is the ranking attributed to it by Australasia and Middle East
delegates, they both ranked it faraway 19th place. It would appear that their experiences with failed PFI
projects like Indah water Konsortium in Malaysians which changed ownership 3 times in seven years before
the government took it over and Sydney Airport rail and the Cross Sydney tunnel in Australia may have
influenced their perception of Value for Money in PFI. This finding is consistent with the arguments put
forward by (Pollock, Shaoul, & Vickers, 2002) & (Hodge & Greve, 2009) that so far the evidence of value
for money on current PFI projects cannot really stand up to public scrutiny. But from the response of the
African delegates ‘provide better value for money’ and ‘reduce pressure on public budget’ tied in 1st place.
This is not surprising though, considering that Africa has not had much experience with PFI and tend to
attribute the high levels of infrastructure development they witness in more developed climes as resulting
from the PFI. The 3 regions surprisingly only tied in one ranking only, that is benefit number 17, ‘improve
governance’ which they all ranked in 16th place. Interestingly, the least ranked benefit of the PFI was ‘help

©Journal of Applied Sciences & Environmental Sustainability 1 (3): 1-11, 2013
18
eliminates corruption’ RII=0.67, this was also the position the African and Australasian delegates consigned
the benefit to-20th place while the middle East delegates ranked it in 17th place. However, the import of this
ranking of corruption seem to suggest that new channels of corruption evolved to replace the ones which
existed under the traditional procurement era
5. Conclusions
The PFI procurement strategy was said to promise a lot of benefits for the adopting government and its
citizens and hence achieved great growth in the last two decades. However, recent experiences seem to
show that the promised benefits are not being achieved and the various governments across the globe have
leant a new trick of shifting emphasis on some benefits more than others. The value for money being
emphasized as the most important benefit of the PFI is being shown not to exist from the view point of
many professional and academic analyses. The findings from this study have further reinforced that
position. Therefore, it has become pertinent for governments to reappraise their reasons for adopting the PFI
procurement strategy. The purported benefits of the PFI can be provided by other procurement methods if
well implemented. In terms of cost, governments should look towards what Malaysian is doing on their 2nd
Penang Bridge. As for practitioners, it is high time, they re-asses the rationale for the PFI as all its selling
points have been erased leaving a battered procurement strategy open to credible criticism from even the
most unlearned.
References Abdul-aziz, A.-R. (2001 ). Unraveling Of Bot Scheme: Malaysia’s Indah Water Konsortium . Journal of
Construction Engineering and Management , 457-460. Asenova, D., & Beck, M. (2010). Crucial Silences: When accountability met PFI and Finance Capital .
Critical Perspectives on Accounting, 21, 1-13. Blanc-Brude, F., Goldsmith, H., & Välilä, T. (2009). A Comparison of Construction Contract Prices for
Traditionally Procured Roads and Public–Private Partnerships. Review of Industrial Organisations, 35, 19-40.
Bonnardeaux, D. (2009). The Cochabamba "Water War": An Anti-Privatisation Poster Child? Frontier Centre for Public Policy.
Broadbent, J., & Laughlin, R. (2003). Public Private Partnership: An Introduction. Accounting, Auditing & Accountability Journal, Vol. 16 No.3, 332-341.
Budds, J., & McGranahan, G. (2003 ). Are the debates on water privatization missing the point? Experiences from Africa, Asia and Latin America . Environment & Urbanization,15(2) , 87-113.
Cartlidge, D. (2004). Procurement of Built Assets. Oxford: Elsevier Butterworth-Heinemann. CBI. (2007). Going Global: The World of Public Private Partnerships. UK: Confederation of British
Industries. Cohen, J. (1992). A Power Primer. Psychological Bulletin,112(1), 155-159. Cohn, D. (2008). The New Public Autonomy? Public Private Partnerships in a Multi-level,
MultiAccountable, Political Environment: The case of British Columbia, Canada. Policy and Society,27, 29-42.

©Journal of Applied Sciences & Environmental Sustainability 1 (3): 1-11, 2013
19
Corder, G. W., & Foreman, D. I. (2009). Non-Parametric Statistics for Non-Statisticians: A Step-by-Step Approach. NewJersey: John Wiley & Sons.
Dewberry, C. (2004). Statistical Methods for Organizational Research. .: Routledge. Dombkins, D. (2006). A Vision for the Future of PPP: Achieving Cutting Edge Strategies for the
Management of Future Projects . Public Private Partnerships Summit – 16 and 17 May 2006. zurich: Public Private Partnerships Summit .
English, L. M., & Guthrie, J. (2003). Driving Privately Financed Projects in Australia: What makes them tick? Accounting, Auditing & Accountability Journal, 16 (3), 493-511.
Enshassi, A., Mohamed, S., & El Karriri, A. (2010). Factors Affecting the Bid/No Bid Decision in the Palestinian Construction Industry. Journal of Financial Management of Property and Construction, 15(2).
Estache, A. (2005). PPI partnerships versus PPI divorces in LDCs: (or are we switching from PPPI to PPDI?). Washington D.C: World Bank.
Fewings, P. (2005). Construction Project Management: An Integrated Approach. Abingdon: Taylor & Francis.
Fugar, F. D., & Agyakwah‐Baah, A. B. (2010). Delays in building construction projects in Ghana. Australasian Journal of Construction Economics and Building,10 (1/2), 103‐116.
Gaffney, D., Pollock, A. M., Price, D., & Shaoul, J. (1999). PFI in the NHS-Is there an Economic Case? British Medical Journal, 319, 116-119.
George, D., & Mallery, P. (2003). SPSS for Windows step by step: A simple guide and reference. 11.0 update (4th ed.). Boston: Allyn & Bacon.
Guasch, J.-L. (2004). Granting and Renegotiating Infrastructure Concessions. Washington D.C: The World Bank Institute of Development Studies.
Haynes, P. (2003). Managing complexity in the Public Services. Glasgow,London : Bell & Bain Ltd . Hinton, P., Brownlow, C., McMurray, I., & Cozens, B. (2004). SPSS Explained. United Kingdom:
Routledge. Hodge, G. A., & Greve, C. (2007). Public–Private Partnerships: An International Performance Review.
Public Administration Review,67(3), 545–558. Hodge, G. A., & Greve, C. (2009). PPPs:The Passage of Time Permits a Sober Reflection. Economic
Affairs 29 (1), 33-39. Li, B., Akintoye, A., Edwards, P., & Hardcastle, C. (2005). Perceptions of Positive and Negative factors
influencing the attractiveness of PPP/PFI Procurement for Construction Projects in the UK: Findings from a questionnaire survey. Engineeering, Construction and Architectural Management, 12 (2), 125-148.
Lin, J. (06 07, 2012). California OKs funding for high-speed rail line. Retrieved 09 07, 2012, from U-T Sandiego News : http://www.utsandiego.com/news/2012/jul/06/california-oks-funding-for-high-speed-rail-line/
Mehra, N. (2005). Flawed, Failed, Abandoned, 100 P3s: Canadian and International Evidence. Ontario: Ontario Health Coalition.
Mendenhall, W., Reinmuth, J., & Beaver, R. (1993). Statistics for Management and Economics. California: Duxbury Press.
Meunier, D., & Quinet, E. (2010). Tips and Pitfalls in PPP Design. Research in Transportation Economics,30, 126-138.
MOF. (2004). Public Private Partnerships Handbook: Version 1. Singapore: Ministry of Finance Singapore.

©Journal of Applied Sciences & Environmental Sustainability 1 (3): 1-11, 2013
20
Nickson, A., & Vargas, C. (2002). The Limitation of Water Regulation: The Failure of the Cochabamba Concession in Bolivia. Bulletin of Latin American Research, 21(1), 99-120.
Odusami, K. T. (2002). Perceptions of Construction Professionals Concerning Important Skills of Effective Project Leaders. Journal of Management in Engineering, 18 , 61-67.
Parker, D., & Hartley, K. (2003). Transaction costs, Relational Contracting and Public Private Partnerships: A case study of UK Defence. Journal of Purchasing and Supply Management, 9 , 97-108.
Parker, D., & Hartley, K. (2003). Transaction Costs,Relational Contracting and Public Private Partnerships: A Case Study of UK Defence. Journal of Purchasing and Supply Management, 9, 97-108.
Pollock, A., Shaoul, J., & Vickers, N. (2002). Private Finance and "Value for Money" in NHS Hospitals: A Policy in Search of a Rationale? British Medical Journal, 324, 1205-1209.
Proverbs, D., Holt, G., & Olomoaiye, P. (1999). European construction contractors: a productivity appraisal of in-situ concrete operations. Journal of Construction Management and Economics, 17(1), 221-230.
Shaoul, J. (1999). The Private Finance Initiative: Looking Glass World of PFI. Public Finance, 14-16. Shaoul, J., Stafford, A., & Stapleton, P. (2012). Accountability and Corporate Governance of public private
partnerships . Critical Perspectives on Accounting , xxx-xxx. Siang, L. Y. (2008). Private Finance Initiatives-Infrastructure and utilities Development. The Ingenieur
Journal, 36, 6-9. Thanh, N. X., & Dapice, D. (2009). Vietnam’s Infrastructure Constraints . Cambridge : United Nations
Development Programme . The Commission on PPP. (2001). Building Better Partnerships. London: Institute of Public Policy
Research. UNISON Scotland. (2007). AT What Cost? Scotland: UNISON Scotland. Webster, J., & Watson, R. T. (2002). Analyzing The Past To Prepare For The Future: Writing A Literature
Review . MIS Quarterly, 26 ( 2 ), xiii-xxiii. World Bank. (2007.). The Growth Report. Washington D.C: World Bank Growth Commission. Zhang, Q., & Kumaraswamy, M. (2001). Hong Kong Experience in Managing BOT Projects. Journal of
Construction Engineering Management, 127 (2), 154-162.

Ibrahim et al. / Journal of Applied Sciences & Environmental Sustainability (JASES)1 (1): 54-61, 2013
21
Research Article
QoS Performance for Monitoring and Optimization of Data and VoIP traffic in WiMAX Network Mac Layer
Ibrahim A. Lawal1, Abas Md Said1 and Abubakar Aminu Mu’azu1
1 Department of Computer & Information Sciences, Universiti Teknologi PETRONAS
Seri Iskandar, Tronoh 31750, Perak, Malaysia Email: [email protected] ARTICLE INFO Article history Received: 27/11/2012 Accepted: 20/12/2013
A b s t r a c t In this paper we are providing a concept of Worldwide Interoperability for Microwave Access (WiMAX) network performance for QoS monitoring and optimization solution for Base Station (BS) with multimedia application to equate quality and cost. The Physical and MAC layer of WiMAX Technology refer to the IEEE 802.16 standard defines five different data delivery service classes that can be used in order to satisfy Quality of Service (QoS) requirements of different applications such as VoIP, videoconference, FTP, Web, etc. We have developed six scenarios to compares the performance obtained using two different types of MAC layer delivery service class used to transport VoIP traffic the Unwanted Grant Service (UGS) and real-time polling service (rtPS). In each scenario the number of fixed BS and SS has been increased from one to six in the BS and four to twenty four in the SS to cover more required users. All the simulation results are optimized based on networks and area, and the results indicate that the delay sensitive traffic fluctuates beyond its nominal rate, having the possibility to give back some of its reserved bandwidth; ertPS has the advantage to permit the transmission of Best effort (BE) traffic than UGS and also the traffic priority for UGS is high as compared to rtPS. © Journal of Applied Sciences & Environmental Sustainability. All rights reserved.
Base Station, Subscriber Station, WiMAX, Physical Layer, MAC Layer, OPNET Modeler, QoS
1. Introduction
Due to its large coverage area, low cost of deployment and high speed data rates, WiMAX is
a promising technology for providing wireless last-mile connectivity. Worldwide
Interoperability for Microwave Access (WiMAX) is one of the most important broadband
wireless technologies and is anticipated to be a viable alternative to traditional wired
broadband techniques due to its cost efficiency. Being an emerging technology, WiMAX
supports multimedia applications such as voice over IP (VoIP), voice conference and online
gaming since it is necessary to provide Quality of Service (QoS) guaranteed with different
characteristics. Therefore, an effective scheduling is critical for the WiMAX system. Many
traffic scheduling algorithms are available for wireless networks, e.g. Round Robin,
Proportional Fairness (PF) scheme and Integrated Cross-layer scheme (ICL). Among these

Ibrahim et al. / Journal of Applied Sciences & Environmental Sustainability (JASES)1 (1): 54-61, 2013
22
conventional schemes, some cannot differentiate services, while some can fulfil the service
differentiation with high-complexity implementation (Xiaodong and Georgious, 2004).
WiMAX has undoubtedly emerged as the most promising leading technology for broadband
connection in wide area networks. Its light infrastructure makes it very cheap and easy to
deploy and thus WiMAX becomes an effective solution to the last mile wireless connection
problem which include multipath fading, environmental factors (such as heavy rains),
interference and varying SLA demands amongst a host of other problems. It is especially
effective in rural areas where wired infrastructures are difficult to install (Jha et al, 2010).
WiMAX quality of service (QOS) depends generally on the 802.16 Layers 1 and 2, as these
provide all important base station with an inherently difficult environment compared to, say,
a wire line broadband network. In particular, 802.16d used Orthogonal Frequency Division
Multiplexing. The capabilities of these technologies have a direct impact on end-user services
and QOS (Vinit and Ajay 2010).
Generally speaking, OFDM provides a simple, relatively straightforward scheduler design,
giving best performance for larger packet sizes, as the overhead/padding problem isn’t so
important. This makes it better for the needs of certain data services, such as legacy TDM
(Vinit and Ajay 2010).
WiMAX has undoubtedly emerged as the most promising leading technology for broadband
connection in wide area networks. Its light infrastructure makes it very cheap and easy to
deploy and thus WiMAX becomes an effective solution to the last mile wireless connection
problem which include multipath fading, environmental factors (such as heavy rains),
interference and varying SLA demands amongst a host of other problems. It is especially
effective for rural areas where wired infrastructures are difficult to install as shown in Figure
1 below (IEEE Standard 802.16, 2004).

Ibrahim et al. / Journal of Applied Sciences & Environmental Sustainability (JASES)1 (1): 54-61, 2013
23
Figure 1 WiMAX based on 802.16 standards
1.1 WIMAX QoS and Scheduling Services
The organizing service plays a huge role in determining the QoS in WiMAX. It determines
the information-handling systems using the MAC scheduler for data transport around the
connection. Each connection is indicated an association identifier (CID) and several QoS
parameters. The organizing service determines the quantity of the UL and DL transmission
options, in addition to BW allocation systems. Initially, four different service types were
supported in the 802.16 standard: Unsolicited Grant Service (UGS), real-time polling service
(rtPS), non-real-time polling service (nrtPS) and Best Effort (BE) (Lee et al, 2006 and Jha et
al, 2010).
1. The UGS (Unwanted Grant Service) resembles the CBR (Constant Bit Rate) service at
(Asynchronous Transfer Mode) ATM, which produces a collection size burst periods. A
reverse lookup might be accustomed to replacing T1/E1 wired line or possibly a continuing
rate service. Furthermore, it might be accustomed to support real-time programs for instance
Voice over IP or streaming programs. Even though the UGS, may possibly not function as
the finest choice for the Voice over IP because it might waste bandwidth through the off
amount of voice calls Lee et al, 2006 and Jha et al, 2010).
2. The rtPS (real-time polling service) is ideal for an adaptable bit rate real-time service for
instance Voice over IP. Every polling interval, BS polls as well as they asked to transmit
between requests (bandwidth request) whether or not this has data to provide. The BS grants
or loans or financial loans the data burst using UL-MAP-IE upon its reception.

Ibrahim et al. / Journal of Applied Sciences & Environmental Sustainability (JASES)1 (1): 54-61, 2013
24
3. The nrtPS (non-real-time polling service) is much like the rtPS with the exception that it
enables contention based polling.
4. In Best Effort (BE) Service can be used as programs for example e-mail or FTP, by which
there's no strict latency requirement. The allocation mechanism is a continuation based while
using varying funnel. Another service type known as ertPS (extended rtPS) was brought to
support variable rate real-time services for example Voice over internet protocol and video
streaming (Poulin, 2006). We have an edge on UGS and rtPS for Voice over internet protocol
applications since it carries lower overhead than UGS and rtPS as showed in table 1.
TABLE 1: WiMAX QoS and Scheduling Services
1.2 Voice over IP (VoIP)
A VoIP application typically works as follows. First, a voice signal is sampled, digitized, and
encoded using a given algorithm/coder. The encoded data (called frames) is packetized and
transmitted using RTP/UDP/IP. At the receiver’s side, data is de-packetized and forwarded to
a play out buffer, which smoothes out the delay incurred in the network. Finally, the data is
decoded and the voice signal is reconstructed. The quality of the reconstructed voice signal is
subjective and therefore is measured by the mean opinion score (MOS). MOS is a subjective
quality score that ranges from 1 (worst) to 5 (best) and is obtained by conducting subjective
surveys. Though these methods provide a good assessment technique, they fail to provide an
on-line assessment which might be made use for adaptation purpose. The ITU-T E-Model
Service Flow
Definition Applications
UGS Real time data streams with fixed size data packets issued at periodic intervals
T1/E1, VoIP without silence suppression.
rtPS Real time data streams with variable size data packets issued at periodic intervals
MPEG video, VoIP with Silence suppression
nrtPS Delay Tolerant data streams with variable size data packets issued at periodic intervals
FTP, Telnet
BE Delay Tolerant data streams, background traffic or any either application without significant QoS constrains
HTTP, E-mail

Ibrahim et al. / Journal of Applied Sciences & Environmental Sustainability (JASES)1 (1): 54-61, 2013
25
(Poulin, 2006),has provided a parametric estimation for this purpose. It is an R-factor that
combines different aspects of voice quality impairment. It is given by
R = 100 − Is − Ie − Id + A ……. (1)
Where Id is the signal-to-noise impairments associated with typical switched circuit networks
paths, Ie is an equipment impairment factor associated with the losses due to the codecs and
network, Id represents the impairment caused by the mouth to- ear delay, and A compensates
for the above impairments under various user conditions and is known as the expectation
factor.
The R-score is related to MOS through the following non-linear mapping (Vinit and Ajay
2010).
MOS = 1+0.0345R + 6.5 × 10⁻⁶R(R − 50)(100 − R)………. (2)
For 0 ≤ R ≤ 100. If R < 0, MOS takes the value of 1and similarly, if R > 100, MOS takes the
value of 4.6.
Among all the factors in the equation (1), only the Id and I are typically considered variables
in VoIP (Dang, Prasad, and Niemegeers, 2007). Using default values for all other factors, the
expression for R-factor given by equation (1) can be reduced to
R = 93.5 – Ie – Id……… (3)
1.3 Network Dimensioning and Design
WiMAX are operating in a combination of licensed and unlicensed bands. The unlicensed
bands are usually both the 2.4 GHz and 5.8 GHz bands. Licensed spectrum provides
operators the control of using the band, permitting them to develop a high-quality network.
The unlicensed band, however, allows independents to supply backhaul services for hotspots
(SRamachandran et al, 2002). Typical area licensed WiMAX spectrum allocations are:
• Lower 700 MHz (US) with 2x6 MHz channels
• GHz Multichannel Multipoint Distribution Service with 15.5 MHz in US and 72 MHz
in Canada
• 3.5 GHz Wireless Local Loop with 2 x 2hMHz channel blocks
• 5.8 GHz UNI (license exempt) with 80 MHz allocation (Parsaee, Yarali, and
Ebrahimzad, 2004)

Ibrahim et al. / Journal of Applied Sciences & Environmental Sustainability (JASES)1 (1): 54-61, 2013
26
WiMAX access networks will often be deployed in point to multipoint cellular fashion in
which a single base station provides wireless coverage to some set of end user stations in the
coverage area. The technology behind WiMAX have been optimized to offer both large
coverage distances of up to 30 kilometers under Line of Sight (LOS) situations and a typical
cell range of up to 8 kilometers under No LOS (NLOS) (Jha et al, 2010). In a NLOS, a signal
reaches the receiver through reflections, scattering, and diffractions. The signals reaching the
receiver includes many aspects of indirect and direct paths with various delay spreads,
attenuation, polarizations, and stability compared to the direct path.
WiMAX technology solves or mitigates the challenge as a result of NLOS conditions by
utilizing OFDM, Sub channelization, directional antennas, transceiver diversity, adaptive
modulation, error correction and power control (C. Hoymann et al, 2007). The NLOS
technology also reduces installation expenses by developing the under-the-eaves Customer
Premise Equipment (CPE) installation possible and easing the problem of locating adequate
CPE mounting locations. Both LOS and NLOS coverage conditions are controlled by
propagation characteristics of the environment, radio link budget and path loss. In each case
relays assist to extend the range of the BS footprint coverage permitting a cost-efficient
deployment and service (Jha et al, 2010).
This paper discusses about the performance of the MAC Layer by applying different QoS
applications using the OPNET Modeler Simulation Tool. The purpose of this study was to
examine a case of QoS deployment over a WiMAX network and to examine the capability of
a WiMAX network to deliver adequate QoS for voice and data applications. The concept of
WiMAX network performance for QoS monitoring and optimization solution for Base
Station (BS) with multimedia application to equate quality and cost was discussed. The
methodologies taken include creating the WiMAX network, deploying the required
applications, deploying QoS configurations within the WiMAX last-mile, adjusting the QoS
configurations within a WiMAX network to meet voice requirements, and further adjusting
the QoS configurations to improve data application performance, without degrading the
performance of voice.
2. Related Literatures
The IEEE 802.16 technology (WiMAX) is a promising alternative to 3G or wireless LAN for
providing last-mile connectivity by radio link due to its large coverage area, low cost of

Ibrahim et al. / Journal of Applied Sciences & Environmental Sustainability (JASES)1 (1): 54-61, 2013
27
deployment and high speed data rates. The standard specifies the air-interface between a
Subscriber Station (SS) and a Base Station (BS). The IEEE 802.16- 2004 standard also
known as 802.16d, was published in October, 2004(IEEE Standard 802.16-2004). This was
further developed into the mobile WiMAX standard referred to as IEEE 802.16e- 2005 or
802.16 (IEEE Standard 802.16e-2005) also according to Ramachandran et al (2002) it is design
to support mobile users. IEEE 802.16 can be used not only as xDSL replacement for small
business customers but also as a mobile internet access technology. There have been few
studies focusing on performance evaluation of IEEE 802.16 WiMAX Networks using
OPNET.
Rangel et al (2006) Studied performance evaluation of IEEE 802.16 for Broadband Wireless
Access, however, they used OPNET’s DOCSIS models to simulate the IEEE 802.16 MAC.
Dang et al, (2007) Studied performance analysis of QoS scheduling in Broadband IEEE 802.16
Based Networks, Although using OPNET WiMAX models, they focused mainly on
implementing their own scheduling algorithms. However, in the IEEE 802.16 standard, the
scheduler is left open for implementation, thus creating an avenue for a healthy competition
amongst manufacturers. While the standard defines the required procedures and messages for
schedulers, it does not offer encouraging means to provide performance, reliability, or
Quality of Service (QoS).
Also Dang et al, (2007). Studied performance of scheduling algorithms for WiMAX networks,
some of their work is quite related to our works. However they focused mainly on
implementing some existing scheduling algorithms.
3. Simulation Setup & Results
Model for Implementation in this experiment, we used OPNET Modeler version 16.0 with
WiMAX Module capability (OPNET Modeler). We designed six scenarios to Improve Voice
scenario and Improve Data scenario including one scenario with one BS only and rest of five
scenarios has two three, four, five and six base stations with four subscribers station around
each. The network consist an IP backbone containing one server connected to the IP
backbone. Subscriber station Transmission Power is set to 0.5 W. Base Station Transmission
Power is set to be 5W. The Path loss and Multipath Model are set to Pedestrian. The
parameters of Subscriber Station and Base Station can be seen at Table 1 and Table 2. A

Ibrahim et al. / Journal of Applied Sciences & Environmental Sustainability (JASES)1 (1): 54-61, 2013
28
detailed explanation of the simulated network model together with configured traffic that was
developed for the Mac Layer QoS Performance of UGS and rtPS are discussed.
Basic parameters associated with WiMAX Configuration attributes, Application
Configuration, Application Profile, Task Definition, BSs configuration and Subscribers
Station for the proposed Master-Slave model in fixed WiMAX are configured.
Table 1 shows the simulation setup parameters used in the scenario by including additional
BS, SS, and number of master BS and simulation time.
TABLE 2: Service flows supported in WiMAX
Service-Flow Designation Defining QoS Parameters Application Examples
Unsolicited-Grant Service (UGS)
Maximum sustained rate, Maximum latency tolerance, Jitter tolerance
Voice over IP (VoIP) without silence suppression
Real-Time Polling Service (rtPS)
Minimum reserved rate, Maximum sustained rate, Maximum latency tolerance, Traffic priority
Streaming audio and video, MPEG (Motion Picture Experts Group) encoded
Non-Real-TimePolling Service (nrtPS)
Minimum reserved rate, Maximum sustained rate, Traffic priority
File Transfer Protocol (FTP)
Best-Effort Service (BE) Maximum-sustained rate, Traffic priority
Web-browsing, Data transfer
Extended Real-Time Polling Service (ErtPS)
Minimum reserved rate, Maximum sustained rate, Maxi-mum latency tolerance, Jitter tolerance, Traffic priority
VoIP with silence suppression
TABLE 3. Simulation Parameters
Efficiency Mode Mobility and Ranging Enabled
MAC Service Class Definition (QoS) 1) UGS e.g. VoIP (IP Telephony)
2) rtPS e.g. MPEG (High Resolution Video)
Modulation Technique Wireless OFDM
Number of Subcarriers 2048
Ibrahim et al. / Journal of Applied Sciences & Environmental Sustainability (JASES)1 (1): 54-61, 2013
29
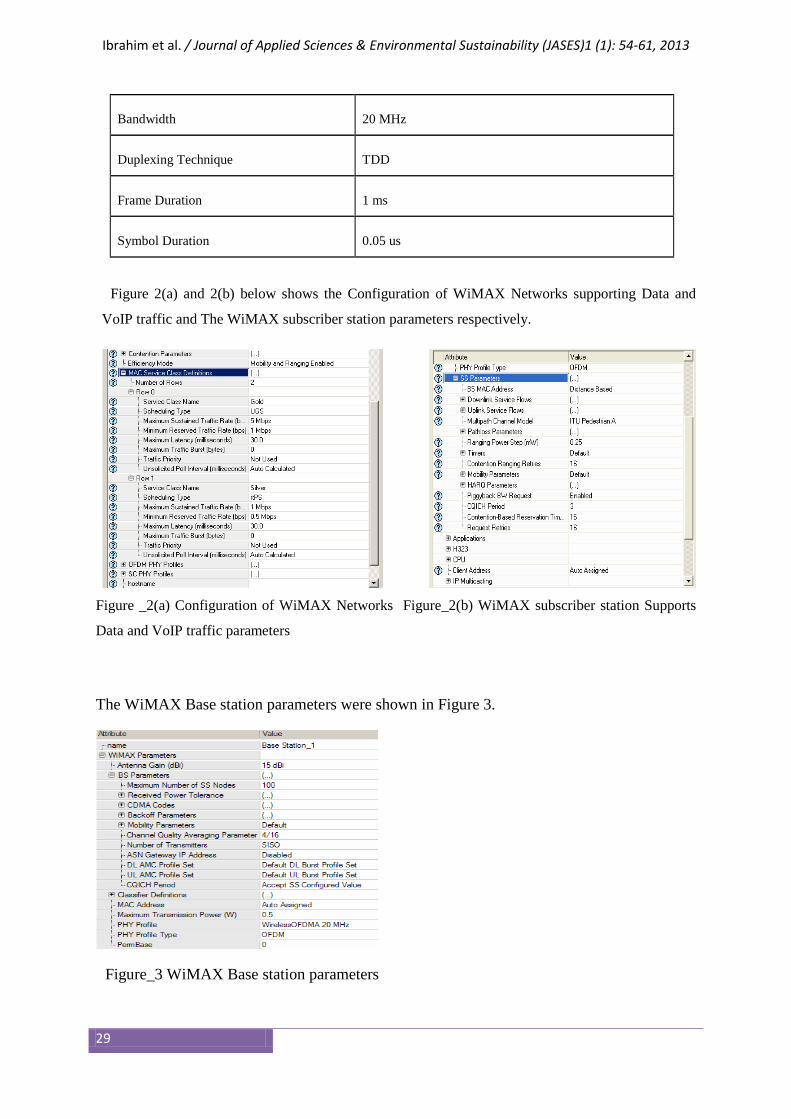
Figure 2(a) and 2(b) below shows the Configuration of WiMAX Networks supporting Data and
VoIP traffic and The WiMAX subscriber station parameters respectively.
Figure _2(a) Configuration of WiMAX Networks Figure_2(b) WiMAX subscriber station Supports
Data and VoIP traffic parameters
The WiMAX Base station parameters were shown in Figure 3.
Figure_3 WiMAX Base station parameters
Bandwidth 20 MHz
Duplexing Technique TDD
Frame Duration 1 ms
Symbol Duration 0.05 us

Ibrahim et al. / Journal of Applied Sciences & Environmental Sustainability (JASES)1 (1): 54-61, 2013
30
3.1 Scenarios of WiMAX Mac Layer QoS Performance for UGS and rtPS Model
3.1.1 Scenario_1
In this scenario, one WiMAX BSs were developed with four SSs around each BS as shows
in Figure 4. All the BSs are connected to the IP backbone (Internet) using point- to- point
protocol (ppp). Basic parameters associated with WiMAX Configuration attributes,
Application Configuration, Application Profile, BS configuration and SS for the model are
configured.
Figure 4_ Mac Layer QoS Performance of UGS and rtPS (scenario_1)
3.1.2 Scenario_2
In this scenario, two WiMAX BSs were developed with eight SSs around each BS as shows
in Figure 5. All the BSs are connected with IP backbone (Internet) using point- to- point
protocol (ppp). Basic parameters associated with WiMAX Configuration attributes,
Application Configuration, Application Profile, BS configuration and SS for the model are
configured. All parameters are same as scenario 1

Ibrahim et al. / Journal of Applied Sciences & Environmental Sustainability (JASES)1 (1): 54-61, 2013
31
Figure 5_ Mac Layer QoS Performance of UGS and rtPS (scenario_2)
3.1.3 Scenario_3
In this scenario, three WiMAX BSs were developed with eight SSs around each BS as
shows in Figure 6. All the BSs are connected to the IP backbone (Internet) using point- to-
point protocol (ppp). Basic parameters associated with WiMAX Configuration attributes,
Application Configuration, Application Profile, BS configuration and SS for the model are
configured. All parameters are same as scenario 1.
Figure 6_ Mac Layer QoS Performance of UGS and rtPS (scenario_3)
3.1.4 Scenario_4
In this scenario, four WiMAX BSs were developed with eight SSs around each BS as shows
in Figure 7. All the BSs are connected to the IP backbone (Internet) using point- to- point
protocol (ppp). Basic parameters associated with WiMAX Configuration attributes,

Ibrahim et al. / Journal of Applied Sciences & Environmental Sustainability (JASES)1 (1): 54-61, 2013
32
Application Configuration, Application Profile, BS configuration and SS for the model are
configured. All parameters are same as scenario 1.
Figure 7_ Mac Layer QoS Performance of UGS and rtPS (scenario_4)
3.1.5 Scenario_5
In this scenario, three WiMAX BSs were developed with eight SSs around each BS as shows
in Figure 8. All the BSs are connected to the IP backbone (Internet) using point- to- point
protocol (ppp). Basic parameters associated with WiMAX Configuration attributes,
Application Configuration, Application Profile, BS configuration and SS for the model are
configured. All parameters are same as scenario1.
Figure 8_ Mac Layer QoS Performance of UGS and rtPS (scenario_5)
3.1.6 Scenario_6
In this scenario, five WiMAX BSs were developed with eight SSs around each BS as shows
in Figure 9. All the BSs are connected to the IP backbone (Internet) using point- to- point
protocol (ppp). Basic parameters associated with WiMAX Configuration attributes,

Ibrahim et al. / Journal of Applied Sciences & Environmental Sustainability (JASES)1 (1): 54-61, 2013
33
Application Configuration, Application Profile, BS configuration and SS for the model are
configured. All parameters are same as scenario 1
Figure _9 Mac Layer QoS Performance of UGS and rtPS (scenario_2)
3.2 Results & Analysis
This section shows the results and analysis obtained through simulation in OPNET Modeler
for average WiMAX, average WiMAX Delay and average WiMAX Load.
3. 2.1 Average WiMAX Throughput Results
Figure 10 shows the result obtained in the design of scenario 6 of the average Throughput
graph.
Figure 10 WiMAX average Throughput graph
3.2.2 Average WiMAX T Delay Results The following Figure shows the result obtained from scenario 1 to 6 for the average Load.

Ibrahim et al. / Journal of Applied Sciences & Environmental Sustainability (JASES)1 (1): 54-61, 2013
34
Figure_11 WiMAX average Load.
3.2.3 Average WiMAX T Delay Results
The following Figure 12 shows the result obtained from scenario 1 to 6 for the WiMAX
average delay.
Figure 12 WiMAX average Delay
3.3 Analysis of the Results
In this research, we have divided our work into six different scenarios with the help of
OPNET Modeler. Here two types of MAC layer QoS are used and they are UGS and rtPS
having application of Voice over IP (VoIP) and MPEG respectively. Also the traffic priority
for UGS is high as compared to rtPS. In each scenario the number of Base Stations and
Subscriber Stations are increased to enhance the performance. Through different scenario we

Ibrahim et al. / Journal of Applied Sciences & Environmental Sustainability (JASES)1 (1): 54-61, 2013
35
have compare the throughput, delay and load with respect to time. The simulation parameters
used in this model are listed in Table 2.
Here the global analyses of all the scenarios are done and the comparison of average
throughput (packets/sec), average load (packets/sec) and average delay (sec) are given.
Figure 10 indicates the comparison between Through-puts (packets/sec) Vs Simulation Time
of all six scenarios. In all scenarios every SS can communicate simultaneously with each
other through base station. Simulation time is taken as 60 seconds, after simulation we have
observed that throughput of scenario 1 is nearly about 0.6 packets/sec, scenario 2 have 0.89
packets/sec, scenario 3 have 1.1 packets/sec, scenario 4 have 1.4 packets/sec, scenario 5
have 1.89 packets/sec and scenario 6 have 2.45 packets/sec. Figure 11 indicates the
comparison between Loads (packets/sec) Vs Simulation Time in each scenario. Scenario 1
have 0.139 packets/sec, scenarios 2 have 0.219 packets/sec, scenario 3 have 0.21 packets/sec,
scenario 4 have 0.168 packets /sec, scenario 5 have 0.242 packets/sec, and scenario 6 have
the highest load of about 0.239 packets/sec.
Figure 12 indicates the result between Delays (sec) Vs. Simulation Time. We have seen that
delay of scenario 1 has 0.00319 sec throughout the simulation time (constant delay).
Similarly scenario 2 have 0.00168 sec initially and remains constant at 0.00148 sec, scenario
3 delay is vary from 0.0048 to 0.00379 sec, scenario 4 varies from 0.0015 to 0.0034 sec,
scenario 5 varies between 0.00579 to 0.00538 sec and scenario 6 varies from 0.00392 to
0.00164 sec.
4. Conclusions
In this research we have discussed the concept of WiMAX network performance for QoS
monitoring and optimization solution for Base Station with multimedia application to equate
quality and cost. Six scenarios was developed to compares the performance obtained using
two different types of MAC layer delivery service class used to transport VoIP traffic the
UGS and rtPS. In each scenario the number of fixed BS and SS has been increased from one
to six in the BS and four to twenty four in the SS to cover more required users. All the
simulation results are based on optimized networks and area. The results indicate that the
delay sensitive traffic fluctuates beyond its nominal rate, having the possibility to give back
some of its reserved bandwidth; ertPS has the advantage to permit the transmission of Best
effort (BE) traffic than UGS and also the traffic priority for UGS is high as compared to rtPS.

Ibrahim et al. / Journal of Applied Sciences & Environmental Sustainability (JASES)1 (1): 54-61, 2013
36
References 1. Xiaodong Cai, and Georgious B.G., “Error Probability Minimizing Pilots ts for OFDM With M-
PSKModulation Over Rayleigh Fading Channels,”IEEE Transactions on Vehicular Technology, vol 53, no.1,January,2004.
2. R. K. Jha, A. V. Wankhede and U. D. Dalal, “A Survey of Mobile WiMAX IEEE 802.16 m,” International Journal of Computer Science and Information Security, Vol. 8, No. 1, 2010, pp. 125-131.
3. IEEE Standard 802.16-2004, “IEEE Standard for Local and Metropolitan Area Networks, Part 16: Air interface for Fixed Broadband Access Systems,” October, 2004.
4. Vinit Grewal and Ajay K Sharma (2010) On Performance Evaluation of Different QoS Mechanisms and AMC scheme for an IEEE 802.16 based WiMAX Network, International Journal of Computer Applications (0975 – 8887)Volume 6– No.7,
5. R. K. Jha, A. V. Wankhede and U. D. Dalal, “WiMAX System Simulation and Performance Analysis under the Influence of Jamming,” International Journal of Scien-tific Research, Vol. 1, No. 1, 2010, pp. 20-26.
6. H. Lee, T. Kwon, D.H. Cho, “Extended-rtPS Algorithm for VoIP Services in IEEE 802.16 systems”, ICC 2006.
7. R. K. Jha, A. V. Wankhede and U. D. Dalal, “A Survey of Mobile WiMAX IEEE 802.16 m,” International Journal of Computer Science and Information Security, Vol. 8, No. 1, 2010, pp. 125-131.
8. D. Poulin, The challenges of WiMAX design, IET Communications Engineer, 27–28, 2006. B. L. Dang, Y. Zhao, V. Prasad, I. Niemegeers, “Performance study of scheduling algorithms for WiMAX networks”, OPNETWORK 2007.
9. S. Ramachandran, C. W. Bostian, S. F. Midkiff, “Performance Evaluation of IEEE 802.16 for Broadband
10. Wireless Access”, OPNETWORK 2002. 11. White Paper,” IEEE 802.16a Standard and WiMAX Igniting Broadband Wireless Access”,
WiMAX Forum. 12. G. Parsaee, A.Yarali, E. Ebrahimzad, “MMSE-DFE Equalizer Design for OFDM Systems with
Insufficient Cyclic Prefix”, Proceeding of IEEE VTC04 conference on Sept. 26-29, 2004, Los Angeles, Ca.
13. C. Hoymann, M. Dittrich, S. Goebbels and B. Walke, “Dimensioning Cellular WiMAX Part II: Multihop WiMAX Networks”, in Proceedings of IEEE mobile WiMAX, Mar 2007.
14. R. K. Jha, A. V. Wankhede and U. D. Dalal, “A Survey of Mobile WiMAX IEEE 802.16 m,” International Journal of Computer Science and Information Security, Vol. 8, No. 1, 2010, pp. 125-131.
15. IEEE Standard 802.16-2004, “IEEE Standard for Local and Metropolitan Area Networks, Part 16: Air interface for Fixed Broadband Access Systems,” October, 2004.
16. IEEE Standard 802.16e-2005, “IEEE Standard for Local and Metropolitan Area Networks—Part 16: Air Interface for Fixed and Mobile Broadband Wireless Access Sys-tems Amendment 2,” 28 February 2006.
17. S. Ramachandran, C. W. Bostian and S. F. Midkiff, “Per-formance Evaluation of IEEE 802.16 for Broadband Wireless Access,” OPNETWORK, 2002.
18. V. Rangel, J. Gomez and J. Ortiz, “Performance Analysis of QoS Scheduling in Broadband IEEE 802.16 Based Networks,” OPNETWORK, 2006.
19. B. L. Dang, Y. Zhao, V. Prasad and I. Niemegeers, “Per-formance Study of Scheduling Algorithms for WiMAX Networks,” OPNETWORK, 2007.

Ibrahim et al. / Journal of Applied Sciences & Environmental Sustainability (JASES)1 (1): 54-61, 2013
37
20. OPNET Modeler [Online].Available: http://www.opnet.com/products/modeler/home.html
AUTHORS PROFILE
Ibrahim A. Lawal is a Ph.D. Candidate in IT at the Universiti Teknologi PETRONAS Malaysia, Department of Information and Computer & Information Science. He received his B.Sc. in Mathematics, Postgraduate Diploma in Computer Science and M.Sc. in Computer Science from Bayero University Kano Nigeria. He is also a Cisco Certified Network Associate from Cisco Networking Academy U.S.A. He is now a Lecturer in the Department of Computer Science, Federal College of Education Kano, Nigeria. His research interests include Computer Networks, WLAN, Ad hoc Networks and Mesh Networks, VoIP, IPv6, QoS and WiMAX.
Abas Md Said obtained the Bachelor of Science and the Master of Science from the Western University, USA. He received his PhD degree from Loughborough University, UK. He is working as an Associate Professor in Universiti Teknologi PETRONAS, Malaysia. His current research interests include VoIP, Networks, Visualization and Computer Graphics.
Abubakar Aminu Mu’azu received his BSc. degree in computer science from Usmanu Danfodiyo University Sokoto, Nigeria, in 2003, and the MSc. in Information Technology Management from the Universiti Teknologi Malaysia (UTM), in 2010. He currently is pursuing his PhD studies at Universiti Teknologi PETRONAS, Malaysia. He is an assistant Lecturer of computer science at the Umaru Musa Yar’adua University Katsina Nigeria. His current research interests include VANET simulation, intelligent transportation systems, quality of service, routing protocol design, and implementation. He is also a member of the IEEE computer society.

©Journal of Applied Sciences & Environmental Sustainability (JASES) 1 (3): 46-53, 2013
38 | P a g e
Research Article
Evaluation of Groundwater Interaction with Lake L5, Universiti Teknologi Petronas, Malaysia, using Seepage Meter and Mini-Piezometer Kalu Uka Orji*1, Emmanuel Olisa1 & Emmanuel Achara Bitrus1 Department of Civil Engineering, Universiti Teknologi PETRONAS Seri Iskandar, Tronoh 31750, Perak, Malaysia Email: [email protected] ARTICLE INFO Article history Received: 17/08/2012 Accepted: 20/12/2013
A b s t r a c t Malaysia has many abandoned mining lakes. These lakes are rarely used for raw water supply in water treatment despite their abundance. This is based on the general view that they are just mere retention ponds. However, there is growing acknowledgement that surface water features such as rivers and lakes can interact with underlying aquifers and this water movement can have significant implications on water quantity. This research investigated the interaction between mining lake water and groundwater using Lake L5 at the Universiti Teknologi PETRONAS, Perak, Malaysia, as a case study. Seepage meters and Mini-Piezometers were used to estimate the seepage flux rates, direction, and magnitude of water flow between the aquifer and the lake water within the months of August and November 2013. The seepage flux rates ranged from 2.47 Lm-2day-1 to 7.33 Lm-2day-1for August and 3.45 Lm-2day-1 to 11.08 Lm-2day-1 for November and the Vertical Hydraulic Gradients (VHG) of the Mini-Piezometers was within the range of 0.016 to 0.190 in August and 0.022 to 0.196 November respectively. The results from these methods were all positive, and confirmed that groundwater was being discharge into the lake water; and that the farther the monitoring equipment from the shoreline, the lesser the groundwater discharge. More study is required to be carried out for a longer period, under different hydrological conditions and time of the year, and at several locations. © Journal of Applied Sciences & Environmental Sustainability. All rights reserved.
Mining Lake, Groundwater, Interaction, Seepage Meters, Mini-Piezometers, Recharge
1. Introduction
Surface water such as river is the major source of water and accounts for 97% of drinking water supply for domestic, industrial and agriculture in Malaysia [1]. Abandoned tin mining lakes represent significant water body, particularly in the States of Perak, Selangor, and Negeri Sembilan. These mining pools are seldom used as sources of water for the treatment of public water supply despite their abundance. They have basically been used for irrigation, recreational activities, aquaculture activities and retention ponds. Perak State has about 63% of Malaysian ex-tin mining pools [2 & 3]. The reason is based on the general view that mining lakes are more of retention ponds which can easily be dried up when used for water supply. However, research has shown that lakes can exchange water with underlying aquifers and this water movement can have significant implications on water quantity and quality [4, 5, & 6]. The degree and nature of connectivity between lakes and groundwater resources influence the extraction, potential, contamination, and flow characteristics. The interaction between lakes and groundwater forms the basic framework in the estimation of water budgets for water supply and also groundwater transports of chemical solutes to the surface water bodies [4].
These exchange between groundwater and lakes can take place in three dimensions: some lakes recharge groundwater throughout the entire lake beds; others are being recharged by the groundwater
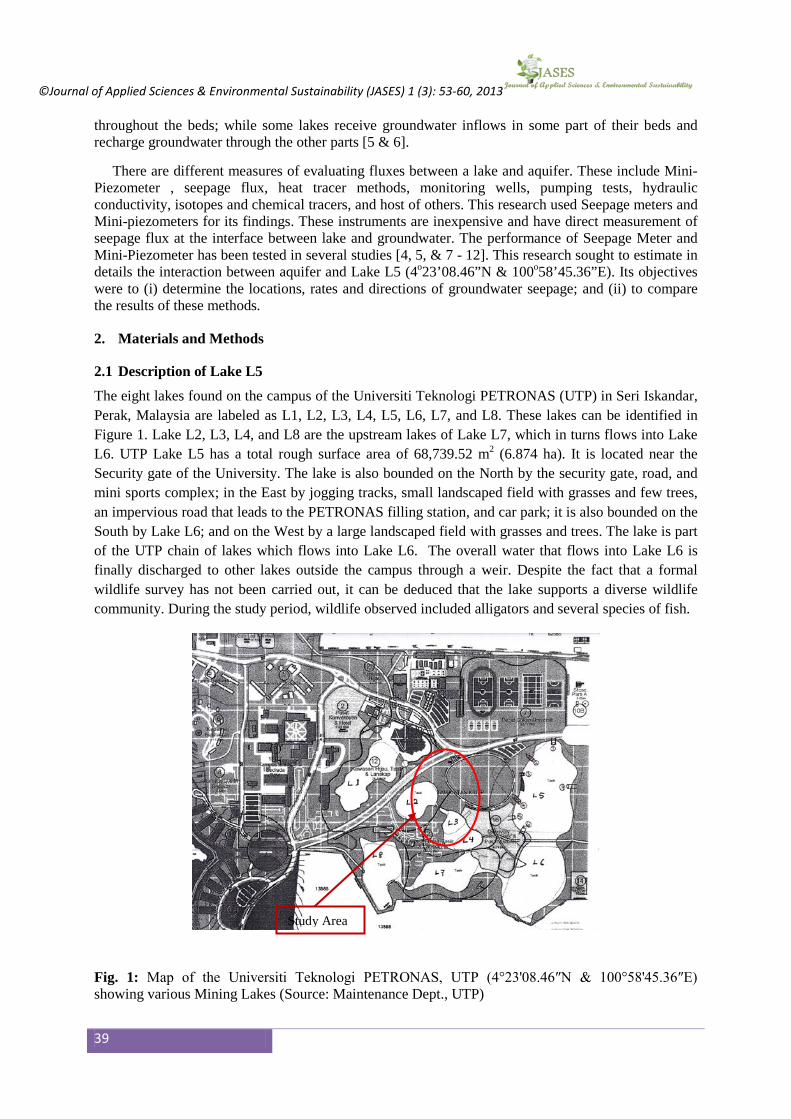
©Journal of Applied Sciences & Environmental Sustainability (JASES) 1 (3): 53-60, 2013
39
throughout the beds; while some lakes receive groundwater inflows in some part of their beds and recharge groundwater through the other parts [5 & 6].
There are different measures of evaluating fluxes between a lake and aquifer. These include Mini-Piezometer , seepage flux, heat tracer methods, monitoring wells, pumping tests, hydraulic conductivity, isotopes and chemical tracers, and host of others. This research used Seepage meters and Mini-piezometers for its findings. These instruments are inexpensive and have direct measurement of seepage flux at the interface between lake and groundwater. The performance of Seepage Meter and Mini-Piezometer has been tested in several studies [4, 5, & 7 - 12]. This research sought to estimate in details the interaction between aquifer and Lake L5 (4o23’08.46”N & 100o58’45.36”E). Its objectives were to (i) determine the locations, rates and directions of groundwater seepage; and (ii) to compare the results of these methods.
2. Materials and Methods
2.1 Description of Lake L5
The eight lakes found on the campus of the Universiti Teknologi PETRONAS (UTP) in Seri Iskandar, Perak, Malaysia are labeled as L1, L2, L3, L4, L5, L6, L7, and L8. These lakes can be identified in Figure 1. Lake L2, L3, L4, and L8 are the upstream lakes of Lake L7, which in turns flows into Lake L6. UTP Lake L5 has a total rough surface area of 68,739.52 m2 (6.874 ha). It is located near the Security gate of the University. The lake is also bounded on the North by the security gate, road, and mini sports complex; in the East by jogging tracks, small landscaped field with grasses and few trees, an impervious road that leads to the PETRONAS filling station, and car park; it is also bounded on the South by Lake L6; and on the West by a large landscaped field with grasses and trees. The lake is part of the UTP chain of lakes which flows into Lake L6. The overall water that flows into Lake L6 is finally discharged to other lakes outside the campus through a weir. Despite the fact that a formal wildlife survey has not been carried out, it can be deduced that the lake supports a diverse wildlife community. During the study period, wildlife observed included alligators and several species of fish.
Fig. 1: Map of the Universiti Teknologi PETRONAS, UTP (4°23'08.46″N & 100°58'45.36″E) showing various Mining Lakes (Source: Maintenance Dept., UTP)
Study Area

©Journal of Applied Sciences & Environmental Sustainability (JASES) 1 (3): 46-53, 2013
40 | P a g e
2.2 Methods Two experiments were conducted within the study area in August and November 2013. The experiments include measuring the groundwater discharge using seepage meters and mini-piezometers. These two months fall in dry and rainy seasons in Perak, Malaysia. 2.2.1 Groundwater Seepage Meter The quantity of groundwater seepage into the lake and vice versa was estimated using seepage meters. These meters were designed, constructed and installed at four different locations (T1 to T4) on the lake bed (Figure 2a & c). Seepage flux of the lake’s groundwater was then measured by enclosing a particular area of the lake bottom with a cylinder vented to a plastic bag [4, 9, 10, & 13]. The meter was constructed using a 200 L steel drum (diameter = 0.57 m) that was cut into halves. Four flanges were welded at the top of the closed end of the drum and each flange was tied to a 6kg of rock. This was done to ensure that during installation, the drum moved down to the bottom of the lake without interference. The drum’s bung hole whose diameter was 0.5 inch was fitted with a watertight connector that was connected to a 10L polyethylene bag through a 2 meter hose (diameter = 15 mm) and was tightened using hose clamps and rubber bands. Prior to the installation of the seepage meter, 1L of water was introduced into the polyethylene bag and tied to the hose. This was recorded as the initial volume of water in the bag. The seepage meter equalized with the groundwater for twenty four hours before data collection. The collected water in the bag over the twenty four hours represented the amount of groundwater seepage which could enter or exit the lake through the lake’s bottom. The seepage flux was calculated as follows: (1) Where,
Q = Seepage flux or seepage volume per area (lm-2day-1)
Vf = Final Volume of water in the bag (l)
Vo = Initial Volume of water in the bag (l)
t = Time elapsed between when the bag was connected and disconnected (day)
A = Surface Area of the chamber (0.255 m2). The values of seepage flux were multiplied by a correction factor of 1.05, which was introduced by Belanger and Montgomery [14] to take care of all the possible errors due to flow resistance to the drum and the plastic bag during the measurements. 2.2.2 Mini Piezometers Mini-Piezometer is used to measure the direction of water flow between surface water body such as a lake, stream or river and aquifer (Figure 2b). It determines the characterization of the magnitude and direction of vertical hydraulic gradient (VHG) [15 &16]. The Vertical Hydraulic Gradient (VHG) values at certain depths in a single point between a lake and groundwater were computed using the formula: (2)
Where,

©Journal of Applied Sciences & Environmental Sustainability (JASES) 1 (3): 53-60, 2013
41
dh = hydraulic head difference between the mini-piezometer and lake stage (cm)
dl = vertical distance between the lake bed and the midpoint of the perforated screen mini-piezometer (cm) [5 &17].
Four piezometer stations (P1 to P4) were installed at different locations of the lake (Figure 2a). The PVC piezometer has an outer diameter of 2 cm. There were 12 mini-piezometers used for the study and had perforated screens of various lengths. They were installed by a hand auger, and drilling of 10 cm wide borehole. The auger material was used to backfill the borehole after installation. The lake water levels (h2) were measured with a meter rule, midpoints of the perforated areas marked, and groundwater levels obtained using the water level meter (YAMAYO Million Rope Water Level Measure – 50 m). A positive value of VHG indicates groundwater recharges the lake while a negative value shows the opposite. Three mini-piezometers were installed perpendicular to the shoreline at each station so as to measure the head differences and to characterize the magnitude and directions of the VHG.
3. Results and Discussions
3.1 Seepage Meter
The various volumes of water obtained using seepage meters in these four locations are shown in Table 1. The seepage flux rates ranged from 2.47 Lm-2day-1 to 7.33 Lm-2day-1for August and 3.45 Lm-
2day-1 to 11.08 Lm-2day-1 for November. The highest seepage flux for the seasons was obtained near the shoreline. The research indicated that the seepage fluxes decreased with increasing distance from the shoreline. It also revealed that all the four locations for the two seasons experienced recharge of groundwater into the lake (Figure 3a). Anne & Kirsti, 2011 and Kelvin et al, 1997 obtained similar results [5 &17].
P1
T2
T3 P2
P3
P4 T1
T4
c b a
Fig. 2: (a) UTP Lake L5 showing Mini-Piezometer and Seepage meter Stations (b) Vertical Hydraulic gradient in a down welling and upwelling region of the lakebed (Adapted from Anne & Kirsti, 2011) and (c) Seepage Meter

©Journal of Applied Sciences & Environmental Sustainability (JASES) 1 (3): 46-53, 2013
42 | P a g e
Mon
th
(201
3)
Loc
atio
n
Lak
e’s
Dep
th
(m)
Dat
e
n I (m)
Initi
al
Vol
ume
(L)
Fina
l V
olum
e (L
) C
hang
e in
V
olum
e Se
epag
e Fl
ux
(Lm
-2da
y-
1
Aug
ust T1 1.85 28/8/13 1.05 3.65 1.0 2.78 1.78 7.33
T2 5.0 29/8/13 1.05 11.0 1.0 2.00 1.00 4.12 T3 7.19 30/8/13 1.05 28.10 1.0 1.65 0.65 2.68 T4 8.3 31/8/13 1.05 99.00 1.0 1.60 0.60 2.47
Nov
embe
r
T1 2.6 12/11/13
1.05 3.80 1.0 3.69 2.69 11.08
T2 5.47 13/11/13
1.05 10.54 1.0 2.20 1.20 4.94
T3 7.8 14/11/13
1.05 30.06 1.0 2.10 1.10 4.53
T4 10.03 15/11/13
1.05 98.12 1.0 1.84 0.84 3.45
I = distance from shoreline (m), n = correction factor
Fig. 3a: Relationship between groundwater recharge and distance from shoreline at Lake L5, UTP with seepage meter
3.2 Mini Piezometer
It can be shown from Table 2 and Figure 3b-e that there were upward flows of groundwater in the experimental hydraulic head differences (dh) within the four stations. The results obtained for the vertical hydraulic gradients (VHG) were all positive for August and November. The results also showed that more water was recharged from groundwater into the lake in November (rainy season) than August (dry season). This could be as result of the increase in groundwater table due to precipitation. It was also deduced from the study that the greater the installation depth of the mini-piezometer, the higher the level of groundwater in the pipe (h1). The results from the study were
Table 1: Summary of Seepage Meter Data Obtained at UTP Lake L5 in August and November 2013
a

©Journal of Applied Sciences & Environmental Sustainability (JASES) 1 (3): 53-60, 2013
43
similar to the ones obtained by Anne and Kirsti, 2011 and Rosenberry and LaBaugh, 2008 in which their hydraulic head differences (dh) did not exceed 30 cm. It also confirmed what was obtained using the seepage meter in relation to shoreline distance and amount of groundwater recharge.
Month Station Locations I(m) dl(cm) h1(cm) h2(cm) dh(cm) VHG
Aug
ust 2
013
1 A1 0.8 52 16 11 5 0.096 A2 2 97 19 14 5 0.052 A3 3 150 50 47 3 0.020
2 B1 0.8 120 23 12 11 0.092 B2 2 120 33 28.7 4.3 0.036 B3 3 120 38 35.8 2.2 0.018
3 C1 0.8 160 104.1 73.6 30.5 0.190 C2 2 172 105 82 23 0.133 C3 3 185 106 86.3 19.7 0.107
4 D1 0.8 100 33.3 30.5 2.8 0.028 D2 2 146 47 44 3 0.021 D3 3 135 47.5 45.4 2.1 0.016
Nov
embe
r 201
3
1 A1 0.8 50 20 13 7 0.140 A2 2 100 23 17 6 0.060 A3 3 150 65 61 4 0.027
2 B1 0.8 120 27 14 13 0.108 B2 2 120 35.2 30 5.2 0.043 B3 3 120 42.6 40 3 0.022
3 C1 0.8 168 109 76 33 0.196 C2 2 170 110 84 26 0.153 C3 3 189.4 114.5 91 23.5 0.124
4 D1 0.8 103 37.5 34 3.5 0.034 D2 2 146 52.5 48 4.5 0.031 D3 3 136 53.5 51 2.5 0.018
I = distance from shoreline (m), dl = the vertical distance between the lakebed and the midpoint of the perforated mini-piezometer (cm), h1 = the level of groundwater in the mini-piezometer, h2 = the lake water level, dh = head difference (cm), VHG = Vertical Hydraulic Gradient
Table 2: Mini-Piezometer Data collected at Lake L5, for August and November, 2013
b c

©Journal of Applied Sciences & Environmental Sustainability (JASES) 1 (3): 46-53, 2013
44 | P a g e
Fig. 3b-e: Relationship between groundwater recharge and distance from shoreline at Lake L5, UTP with mini-piezometers [l = Distance from shoreline]
Conclusion
This research was to examine the groundwater–lake water exchange. The goal was characteristically to
investigate the directions and rates of groundwater seepage with mini-piezometers and seepage meters.
This was realized from the conducted experiments. The results above showed that water was being
recharged from groundwater to the lake. The average seepage flux of the lake was 4.15 Lm-2day-1 and
VHG was 0.080 for August; and 6 Lm-2day-1 and VHG was 0.080 for November. This showed that
later water recharge was higher in rainy season than dry season due to precipitation. However,
directions and flow rates between the lake water and groundwater could be dynamic and change over
time and space due to response to seasonal weather conditions and water flow. In order to fully
ascertain the groundwater – surface water interactions of Lake L5, it is recommended that a longer
period of study be conducted under different hydrological conditions and time of the year and at
several locations.
Acknowledgements
The authors are thankful to the authorities of the Universiti Teknologi PETRONAS, especially the
Department of Civil Engineering for providing the facilities for this study.
References
[1] Lim, C. H. State of Water Resource in Malaysia: Dialogue on “Water Environment Partnership in
Asia WEPA”, Ministry of Natural Resources and Environment: Malaysia, 2008.
[2] Nurlidia, M., Muhammad, A. Z. M. S. & Hafizah, A. Investigation of Pb Dispersal and
Accumulation around Untreated Former Tin Mines in Perak, Malaysia, 2nd Int. Conference on
Chemical, Biological and Environmental Engineering (ICBEE2010): Kuala Lumpur, 2010.
d e
©Journal of Applied Sciences & Environmental Sustainability (JASES) 1 (3): 53-60, 2013
45
[3] Muhammad, A. A., Mohd, J. M. & Ismail, Y. Study of Water Quality and Heavy Metals in Soils
and Water of Ex-Mining Area of Bestari Jaya, Peninsular Malaysia, Int. Journal of Basic and Applied
Sci. Vol. 10, No. 3, 2010.
[4] Brodie, R. S., Baskaran, S., Ransley, T. & Spring, J. The seepage Meter: Progressing a simple
method of directly measuring water flow between surface water and groundwater systems, Australian
Journal of Earth Sciences: An International Geoscience Journal of the Geological Society of Australia,
56: 1, 3-11, 2009.
[5] Anne, R. & Kirsti, K. N. Characterization of groundwater – lake water interactions at Pyhajarvi, a
lake in SW Finland, Boreal Environment Research 16: 363 – 380, 2011.
[6] Kalbus, E., Reinstorf, F. & Schirmer, M. Measuring methods for groundwater – surface water
interactions: a review. Journal of Hydrol. Earth Syst. Sci., 10, 873 – 887, 2006.
[7] Hirsch, J. D. & Randazzo, A. F. Hydraulic seepage within an astatic Karstic lake, North – Central
Florida. In: Groundwater: Past Achievements and Future Challenges (ed. By O. Sililo), 159 – 164. A.
A. Balkema, Rotterdam, The Netherlands, 2000.
[8] Makoto, T. Change in Groundwater Seepage Rate into Lake Biwa, Japan, Japan Journal Limnol.,
56, 4, 261 – 267, 1995.
[9] Donald, O. R. A seepage Meter designed for use in flowing water, Journal of Hydrology, Vol. 359,
pg 118-130, 2008.
[10] Lee, D. R. A device for Measuring Seepage flux in lakes and estuaries, Limnol, Oceanogr. 22:
140-147, 1977.
[11] William, W. W. & Kevin, E. S. Results of Seepage meter and mini – piezometer study, Lake
Mead, Nevada, Journal of Groundwater, Vol. 22, No. 5, 1984.
[12] Simpkins, W. W. A multiscale investigation of groundwater flow at clear lake, Iowa.
Groundwater Journal, 44: 35 – 46, 2006.
[13] Boyle, D. R. Design of a seepage meter for measuring groundwater fluxes in the nonlittoral zones
of lakes – Evaluation in a boreal forest lake, Limnol, Oceanogr., 39(3), 670-681, 1994.
[14] Belanger, T.V. & Montgomery, M.T. Seepage meter errors. Limnology and Oceanography
37:1787-1795, 1992.
[15] Lee, D. R. & Cherry, J. A. A field exercise on groundwater flow using seepage meter and mini –
piezometers. Journal of Geol. Education, 27: 6 – 20, 1978.
[16] Rosenberry, D. O. & LaBaugh, J. W. (eds.). Field Techniques for estimating water fluxes between
surface water and groundwater, techniques and methods 4–D2. SGS, Reston, Virginia, 2008.
[17] Kelvin, M., Lee, O. & Patricia, H. Lake Adair Diagnostic Study, City of Orlando Public Works
Department, Storm Utility Bureau, Florida, USA, 1997.

©Journal of Applied Sciences & Environmental Sustainability (JASES) 1 (3): 38-52, 2013
46
Research Article
Towards Safer Laboratories: An Incident-Report Safety Knowledge Transfer Model Ibraheem M. Dooba*, Ahmad Kamil Mahood and Jafreezal Jaafar Department of Computer & Information Sciences, Universiti Teknologi PETRONAS Seri Iskandar, Tronoh 31750, Perak, Malaysia Email: [email protected] ARTICLE INFO Article history Received: 27/03/2012 Accepted: 12/11/2013
A b s t r a c t Accidents in academia, although seldom reported, happen all the time due to the nature of the materials academic institutions have to work with in their research projects. The Incident Report-Based Safety Knowledge Transfer (IRSKT) model we advocated in this paper identifies the elements neccessary for social systems in academia to extract, disseminate and use new safety knowledge emanating from incident reports. The purpose of the paper is to understand how developments in systems thinking and materiality of knowledge can influence understanding of safety knowledge transfer (SKT); and to propose a new systems-based safety knowledge transfer model founded on incident reports.The paper is a review of the literature on safety knowledge transfer, materiality of knowledge and systems thinking; leading to the proposal of a new SKT paradigm.The paper shows that the IRSKT model is well suited to analyzing safety knowledge transfer in both complex and small-scale systems in academia. The paper argues that in academic institutions where safety of students and researchers is important, the ability to extract knowledge from incidents reports – which is an assesible and ready estimate of safety situations in organizations - is vital for establishing safe laboratories and learning environments. The capacity for effective exchange and utilization of safety information inherent in incident reports by employees, equipment manufacturers, professional bodies and government agencies as reflected in IRSKT will inform the decisions to build in safety in machinery, better safety rules, effective safety campaigns and enhance safety conscious behaviours in academia. © Journal of Applied Sciences & Environmental Sustainability. All rights reserved.
Accidents,incident reports, laboratory accidents, knowledge transfer, Safety knowledge, Systems analysis
Introduction
Incidents – even catastrophic ones – are not uncommon in research laboratories in the academia. The
nature of research institutions constrains them to work with machinery and materials that are Gordian
in complexity and that could be fatal when mistakes occur or when materials and machine behave in
unpredictable ways. This complexity makes accidents and fatalities almost inevitable.

©Journal of Applied Sciences & Environmental Sustainability (JASES) 1 (3): 38-36, 2013
47 | P a g e
Incidents in academia could emanate from chemical inhalation, contamination with biological fluids,
electric shock, lost of control of heavy machinery and so forth. For instance Davanzo et al., (2007)
reported that between 2004 to 2006 alone, 497 cases of accidents with instruments contaminated with
biological fluids were reported among a university healthcare staff. Some of the cases were as serious
as hepatitis B, HIV and HCV (hepatitis C virus). Some of the accidents in academic institutions are so
severe that some experts advocate the inclusion of safety studies in business schools curricula
(Stewart, Ledgerwood, & May, 1996).
Given that an accident and the resulting incident report have the capacity to immediately call attention
of stakeholders, including regulating agencies to safety issues, the significance of the report can not be
overstressed. However, there is scant research attention focusing on the nature of the knowledge
extracted from such reports and how it is transferred within universities and among the stakeholders.
Further, knowledge is the most important asset in organizations and nations, not only because it is the
prime source of wealth(Parent, Roy, & St-Jacques, 2007) but also because it saves lives. To increase
research output, graduate students and professors are required to work with increasingly complex
machines and within the confines of equally complex structures. In such environments, accidents
happen; and because human lives are involved in such incidents, their occurence is taken seriously by
the schools, supervising agencies, manufacturers and professional associations. To underscore such
importance, legislations exist in many countries requiring organizations to record and report incidents.
The mechanism by which that requirement is fulfilled is by filing incident reports (Tyler, 2007).
Incident here means an accident or a near-miss.
Every incidents associated with any kind of personal injury is required to be documented. Based on
the kind of injury, its seriousness as well as implications, accidents may also be required to be reported
to the associated regulating agencies. However, some accidents which do not cause any specific
personal injury will likewise have to be reported. Due to the importance of such reports, organizations
are usually careful in ensuring that various requirements of reporting are fully understood and
complied with. It can also be crucial to preserve significant evidence on many grounds. As it will be
probably needed for an organisation’s investigation of an incident in a bid to avoid its reoccurrence
(Tyler, 2007). Incident reports are used to fulfill many purposes such as feedback for safety
programmes in organizations, data for insurance claims, yardstick to assess old safety rules by
government agencies, and grounds for creating new ones.
The extant literature tends to focus on research findings as transferable safety knowledge. Even
experts that are affiliated with safety research institutes operationalize safety knowledge as research
findings. For example, among the objectives of the Robert Sauvé Research Institute on Workplace
Health & Safety (IRSST) based in Canada, are to:
“To add new, interdisciplinary research and KT [Knowledge Transfer] capacity related to workplace
injury and permanent structures for ongoing capacity enhancement linking the participating

©Journal of Applied Sciences & Environmental Sustainability (JASES) 1 (3): 38-52, 2013
48
organisations and to build a network of research and community WHS collaborators in Atlantic
Canada linked to the three Québec research organisations with their established social capital of
community and institutional connections, thus creating a truly Eastern Canadian regional
organisation(Roy, Parent, & Desmarais, 2003)” But they define “knowledge [as] research findings”
(p. 159).
Based on this conceptualization, for knowledge to transfer there must be research preceding it.
Therefore, safety knowledge is a commodity created by researchers for onward transmission to end-
users. Even researchers who argue for the social contextual importance of knowledge transformation
and translation do so with the belief that the social exchange has to be set off by researchers.
Baines (2007)drawing on data collected as part of a larger qualitative study of health and safety issues
in the Canadian social services sector, explains that such efforts of knowledge translation, as
currently conceptualised as well as organized, is limited and also constraining by means of its very
own discourse associated with research neutrality, and through the political economy regarding
research institutes and also organizations which grant research funds. These entities are inclined to
encourage people generating journal articles and discourage people spending time getting the research
accessible to those who need it.
Still Knowledge translation is actually an increasing requirement in an increasing number of studies.
Since prevention as well as intervention tend to be the specific and also preferred final results,
knowledge translation has special prominence in safety studies. Baines argues that utilizing
knowledge to enhance health and safety practice would be greater if perhaps knowledge translation
was incorporated into the research methodology, specifically as an appraisal of research validity. As
Baines argues, transfer of knowledge from research institutions to practice remains a problem and the
effectiveness of introducing knowledge translation as a form of validity remains to be seen.
However, researchers are increasingly championing other sources of knowledge other than scientific
studies e.g. the significant role of social systems in knowledge acquisitions creation, utilization and
sharing.
In arguing for the inclusion of social systems in the generation and dissemination of knowledge,
Parent and his colleagues (Parent et al., 2007) introduced the Dynamic Knowledge Transfer Capacity
(DKTC) model which promotes a new systemic as well as generic framework to describe the parts
required for social systems to generate, disseminate and utilize new knowledge to address their needs.
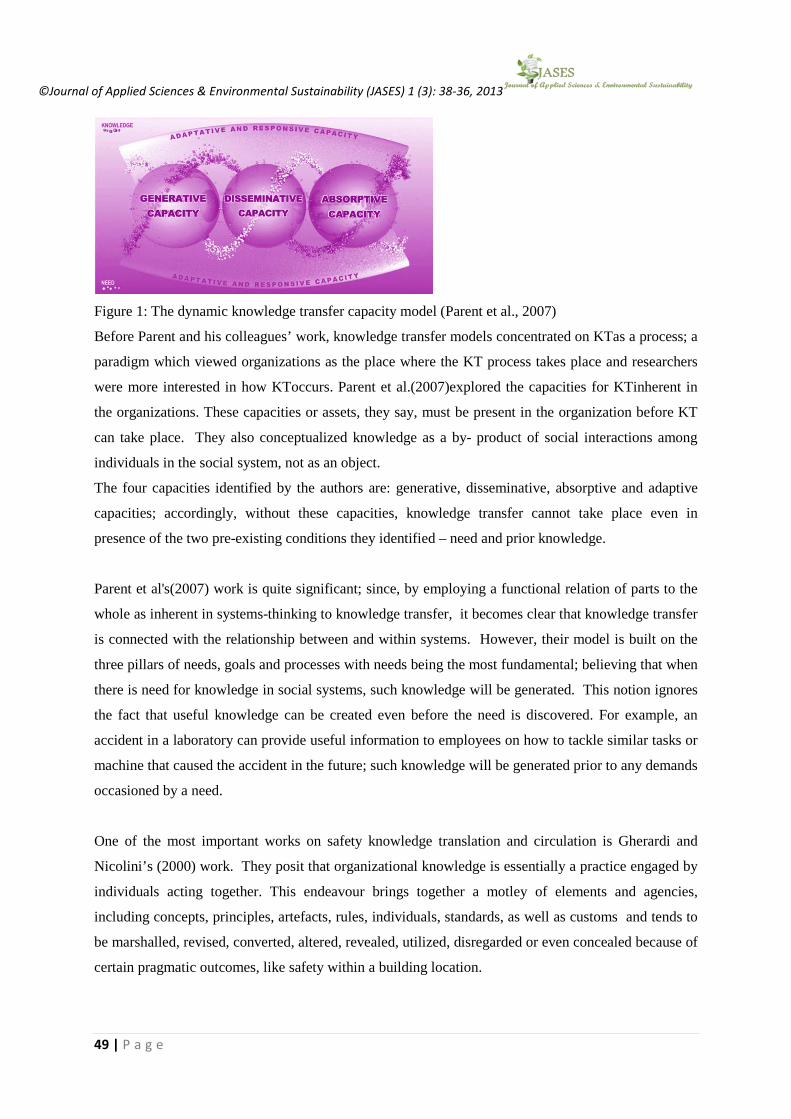
©Journal of Applied Sciences & Environmental Sustainability (JASES) 1 (3): 38-36, 2013
49 | P a g e
Figure 1: The dynamic knowledge transfer capacity model (Parent et al., 2007)
Before Parent and his colleagues’ work, knowledge transfer models concentrated on KTas a process; a
paradigm which viewed organizations as the place where the KT process takes place and researchers
were more interested in how KToccurs. Parent et al.(2007)explored the capacities for KTinherent in
the organizations. These capacities or assets, they say, must be present in the organization before KT
can take place. They also conceptualized knowledge as a by- product of social interactions among
individuals in the social system, not as an object.
The four capacities identified by the authors are: generative, disseminative, absorptive and adaptive
capacities; accordingly, without these capacities, knowledge transfer cannot take place even in
presence of the two pre-existing conditions they identified – need and prior knowledge.
Parent et al's(2007) work is quite significant; since, by employing a functional relation of parts to the
whole as inherent in systems-thinking to knowledge transfer, it becomes clear that knowledge transfer
is connected with the relationship between and within systems. However, their model is built on the
three pillars of needs, goals and processes with needs being the most fundamental; believing that when
there is need for knowledge in social systems, such knowledge will be generated. This notion ignores
the fact that useful knowledge can be created even before the need is discovered. For example, an
accident in a laboratory can provide useful information to employees on how to tackle similar tasks or
machine that caused the accident in the future; such knowledge will be generated prior to any demands
occasioned by a need.
One of the most important works on safety knowledge translation and circulation is Gherardi and
Nicolini’s (2000) work. They posit that organizational knowledge is essentially a practice engaged by
individuals acting together. This endeavour brings together a motley of elements and agencies,
including concepts, principles, artefacts, rules, individuals, standards, as well as customs and tends to
be marshalled, revised, converted, altered, revealed, utilized, disregarded or even concealed because of
certain pragmatic outcomes, like safety within a building location.

©Journal of Applied Sciences & Environmental Sustainability (JASES) 1 (3): 38-52, 2013
50
Safety as a type of organizational know-how thus remains located within the process of continuous
routines (Gherardi & Nicolini, 2000). Further, it possesses both express as well as implicit aspects.
Additionally, it is connected to and intermediated through artefacts, which means, it is material in
addition to being a mental representation. Using examples derived from the observation data, the
authors discuss how safety-linked knowledge is formed, transferred, as well as constantly expanded in
addition to being revised inside the organizing system via the interaction involving action as well as
some sort of logical relation. As significant as Gherardi and Nicolini’s (2000) work is, incident report
is presumably subsumed under the generic classes of artefacts and rules and therefore we are yet to
know how safety knowledge is specifically extracted from incident reports.
Materiality of Knowledge
Advocates of the materiability of knowledge view knowledge as performative, not representational
(Orlikowski, 2006). Thus, knowledge is not only a long-lasting, or important element — but also, an
active and continuous communal outcome. This is a perspective of knowing in practice that is getting
significant research interest by many experts such as (Blackler 1995; Lave, 1988; Nicolini, Gherardi,
and Yanow, 2003; Tsoukas, 2005). This points us to pay attention to knowledge that is not only static
or simply constant, but like an ability created and also recreated within continual communal
behaviours.
The practice perspective of knowledge drives us to recognize knowing as emergent (as a result of daily
actions and therefore usually “in the making”), embodied (as apparent in this kind of ideas such as
tacit knowing as well as experiential learning), and embedded (based within the socio-historic setting
of people’s lives in addition to work) (Orlikowski, 2002). To this specific notion (Orlikowski, 2006)
contributes an additional crucial element, which is, that knowing is often material.
Dailyroutines along with the knowledge produced as a consequence of such interactions can be
profoundly locked up within what Orlikowski called the "stuff" (forms, artifacts, settings, as well as
infrastructures) around, with and within which people operate. Think of any kind of human activity,
then consider the accompanying materiality. It is clear that a lot of an individual's actions are quite
influenced by “stuff” like research structures, equipment, vehicles, laboratory garments, spaces,
furniture, electronic gadgets, stationery, and so forth. Some"stuff" are less conspicous like water, air,
electrical energy, information as well as voice systems. Although sometimes, we realize realize this
materiality of knowledge inour actions. Yet "on another level, the level of conceptualizing and
theorizing, we tend to disregard this knowing, and render our accounts of knowledge in organizations
without attention to material matters" ( Orlikowski 2006, p. 2).
Orlikowski (2006) asserts that an individual’s action is not only dependent on artefacts, but that it is
also formed by them. Absent the material stuff of daily existence, our actions would not be feasible.
Therefore, action inevitably necessitates materiality. Further, just as materiality is inherent in action,
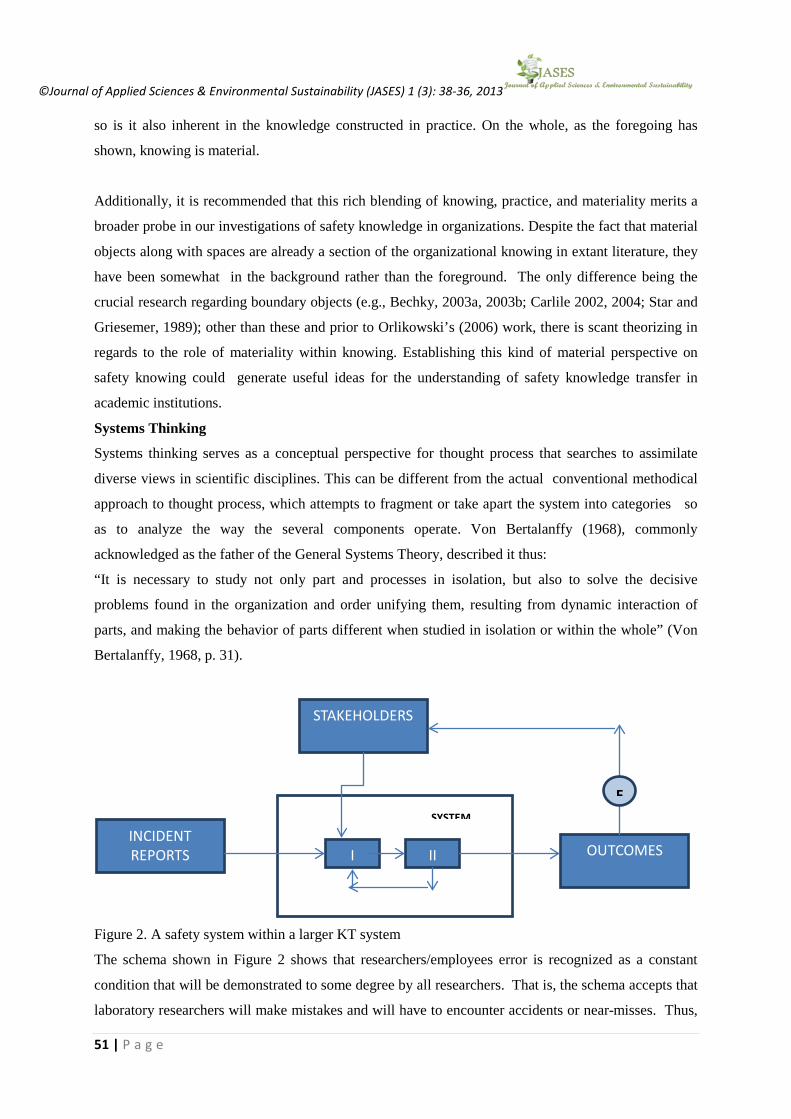
©Journal of Applied Sciences & Environmental Sustainability (JASES) 1 (3): 38-36, 2013
51 | P a g e
so is it also inherent in the knowledge constructed in practice. On the whole, as the foregoing has
shown, knowing is material.
Additionally, it is recommended that this rich blending of knowing, practice, and materiality merits a
broader probe in our investigations of safety knowledge in organizations. Despite the fact that material
objects along with spaces are already a section of the organizational knowing in extant literature, they
have been somewhat in the background rather than the foreground. The only difference being the
crucial research regarding boundary objects (e.g., Bechky, 2003a, 2003b; Carlile 2002, 2004; Star and
Griesemer, 1989); other than these and prior to Orlikowski’s (2006) work, there is scant theorizing in
regards to the role of materiality within knowing. Establishing this kind of material perspective on
safety knowing could generate useful ideas for the understanding of safety knowledge transfer in
academic institutions.
Systems Thinking
Systems thinking serves as a conceptual perspective for thought process that searches to assimilate
diverse views in scientific disciplines. This can be different from the actual conventional methodical
approach to thought process, which attempts to fragment or take apart the system into categories so
as to analyze the way the several components operate. Von Bertalanffy (1968), commonly
acknowledged as the father of the General Systems Theory, described it thus:
“It is necessary to study not only part and processes in isolation, but also to solve the decisive
problems found in the organization and order unifying them, resulting from dynamic interaction of
parts, and making the behavior of parts different when studied in isolation or within the whole” (Von
Bertalanffy, 1968, p. 31).
Figure 2. A safety system within a larger KT system
The schema shown in Figure 2 shows that researchers/employees error is recognized as a constant
condition that will be demonstrated to some degree by all researchers. That is, the schema accepts that
laboratory researchers will make mistakes and will have to encounter accidents or near-misses. Thus,
STAKEHOLDERS
OUTCOMES INCIDENT REPORTS
I II
SYSTEM
F
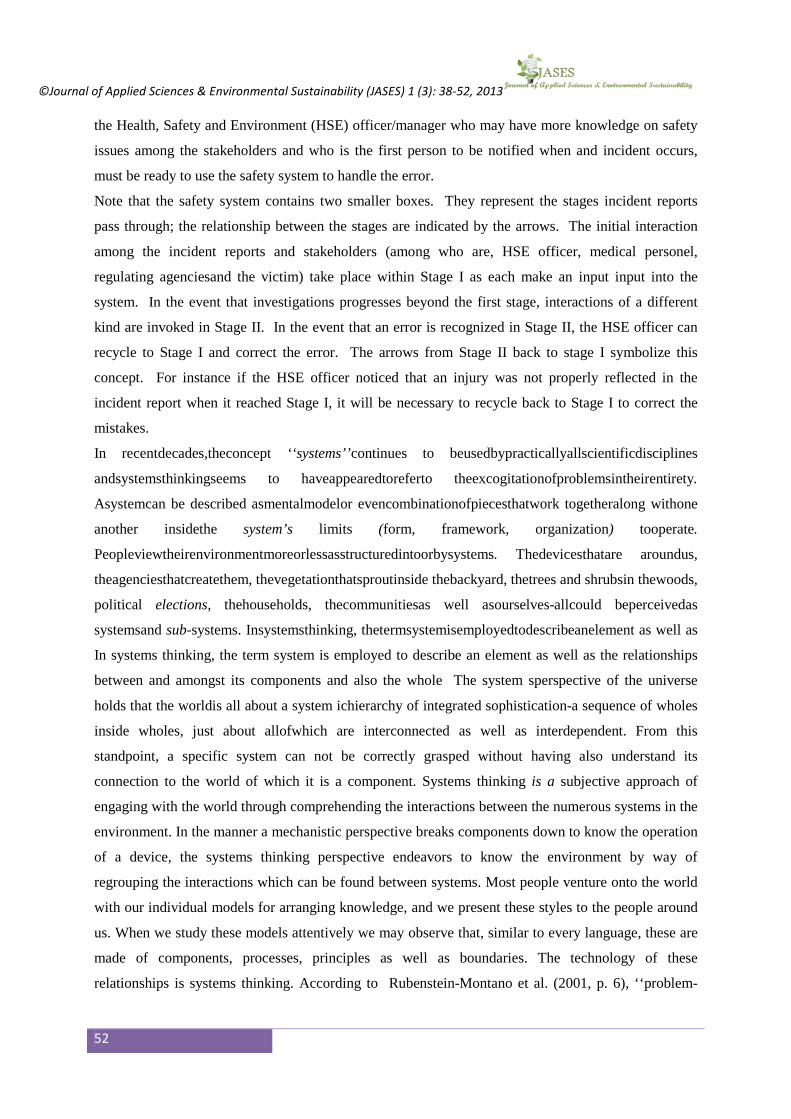
©Journal of Applied Sciences & Environmental Sustainability (JASES) 1 (3): 38-52, 2013
52
the Health, Safety and Environment (HSE) officer/manager who may have more knowledge on safety
issues among the stakeholders and who is the first person to be notified when and incident occurs,
must be ready to use the safety system to handle the error.
Note that the safety system contains two smaller boxes. They represent the stages incident reports
pass through; the relationship between the stages are indicated by the arrows. The initial interaction
among the incident reports and stakeholders (among who are, HSE officer, medical personel,
regulating agenciesand the victim) take place within Stage I as each make an input input into the
system. In the event that investigations progresses beyond the first stage, interactions of a different
kind are invoked in Stage II. In the event that an error is recognized in Stage II, the HSE officer can
recycle to Stage I and correct the error. The arrows from Stage II back to stage I symbolize this
concept. For instance if the HSE officer noticed that an injury was not properly reflected in the
incident report when it reached Stage I, it will be necessary to recycle back to Stage I to correct the
mistakes.
In recentdecades,theconcept ‘‘systems’’continues to beusedbypracticallyallscientificdisciplines
andsystemsthinkingseems to haveappearedtoreferto theexcogitationofproblemsintheirentirety.
Asystemcan be described asmentalmodelor evencombinationofpiecesthatwork togetheralong withone
another insidethe system’s limits (form, framework, organization) tooperate.
Peopleviewtheirenvironmentmoreorlessasstructuredintoorbysystems. Thedevicesthatare aroundus,
theagenciesthatcreatethem, thevegetationthatsproutinside thebackyard, thetrees and shrubsin thewoods,
political elections, thehouseholds, thecommunitiesas well asourselves-allcould beperceivedas
systemsand sub-systems. Insystemsthinking, thetermsystemisemployedtodescribeanelement as well as
In systems thinking, the term system is employed to describe an element as well as the relationships
between and amongst its components and also the whole The system sperspective of the universe
holds that the worldis all about a system ichierarchy of integrated sophistication-a sequence of wholes
inside wholes, just about allofwhich are interconnected as well as interdependent. From this
standpoint, a specific system can not be correctly grasped without having also understand its
connection to the world of which it is a component. Systems thinking is a subjective approach of
engaging with the world through comprehending the interactions between the numerous systems in the
environment. In the manner a mechanistic perspective breaks components down to know the operation
of a device, the systems thinking perspective endeavors to know the environment by way of
regrouping the interactions which can be found between systems. Most people venture onto the world
with our individual models for arranging knowledge, and we present these styles to the people around
us. When we study these models attentively we may observe that, similar to every language, these are
made of components, processes, principles as well as boundaries. The technology of these
relationships is systems thinking. According to Rubenstein-Montano et al. (2001, p. 6), ‘‘problem-

©Journal of Applied Sciences & Environmental Sustainability (JASES) 1 (3): 38-36, 2013
53 | P a g e
solving in this way involves pattern finding to enhance understanding of, and responsiveness to, the
problem’’.
In 1972, Ackoff and Emery, two renowned systems thinkers, suggestedtheidea of
purposeful systemstostrengthentheconceptthatsystemsarisewithin thecontextofparticulargoals. Holland
(1962) hadformalizedthenotionof adaptive systemswhichrepresentthebasic
need for systemstoadjustas well asconformtoalterationsinthe system’s contexttobetter
attaintheirgoals.Shakun (1981) after thatsuggestedtheconceptofresponsivesystemstopermit
themannersystemslearnfrompreviousoperationtoenhancefunctioningandproficiency.
Lastly, Rubenstein-Montano et al. (2001, p. 6), indicated that: Results from systems thinking rely
greatly on precisely how a system is defined due to the fact that systems thinking looks at associations
between the several components associated with the system. Limitations ought to be established to
differentiate what parts of the world are actually covered within the system and also what components
are regarded as the environment of the system. The actual environment of the system may impact
problem solving due to the fact that it influences the system, however it is not part of the system.
Consequently, knowledge transfer inside as well as in between systems should start with a solid
definition of the system being referenced, together with its limitations (Parent et al., 2007); moreover,
it will be beneficial to view academic institutions with a potpoouri of sub systems usually housed at
one location, using the systems approach. Utilizing this perspective will also make it easier to
appreciate the flow of safety knowledge translation from incident reports.
The Incident Report-Based Safety Knowledge Transfer (IRSKT) model
The Incident Report-Based Safety Knowledge Transfer (IRSKT) model proffers a unique systemic as
well as universal theoretical account for specifying the parts and steps necessary to get social systems
to create, share as well as utilize new knowledge from incident reports in academia.
By employing the all emcompassing systems theory perspective to knowledge exchange, we can
understand knowledge transfer as connected to the actual interactions among, as well as within
systems; for example, one can see how the systems are associated with specific goals as well as
processes. The systemic viewpoint permits observing knowledge transfer through the way in which
knowledge is transferred (the process), as well as what components enable knowledge exchange to
achieve success. Since all systems contain limits, the model considers the area inside which
knowledge transfer generally occurs. The IRSKT model is not opposed to the classic knowledge
transfer models which refer to knowledge transfer as being a process, but it also concentrates on the
parts and the steps an incident report must take in a social system before knowledge transfer can take
place.Figure 2 shows that the model contains an accident or a near-miss as the precursor of knowledge

©Journal of Applied Sciences & Environmental Sustainability (JASES) 1 (3): 38-52, 2013
54
translation. The specific components of incident report based knowledge transfer are explained in the
next pages.
Figure 2. The Incident Report-Based Safety Knowledge Transfer (IRSKT) model
Basic Components of the incident report knowledge transfer process
The transfer process has four basic components. They consist of:
1. The incident report
2. The stakeholders (researchers, safety inspectors, machine manufacturers, government
agencies, professional bodies, and so forth.)
3. The safety knowledge transfer system
4. The outcomes of the safety transfer system
1. Incident report input
The incident report inputs brings into the system not only the nature of the accident or near-
miss but also problems and concerns about machines, structures and operations; including how prone
some locations, certain researchers and materials are to incidents. These provide a lot of background
and direction towards safety culture in the organization. The particular way these materials and
persons are integrated gives the incident or set of incidents a pattern. Thus, the stakeholders must be
prepared to respond to the patterns of the incidents.
2. Stakeholders’ input
©Journal of Applied Sciences & Environmental Sustainability (JASES) 1 (3): 38-36, 2013
55 | P a g e
Besides the incident reports, the stakeholders too, input certain skills, knowledge, and
attitudes into the system. For example, the Health Safety and Environment (HSE) manager must
institute an effective procedure on passing the information about the incident to other stakeholders
and to develop a sound human relationship with the victim that is based on trust, understanding, and
respect. A professional relationship must be established with the victim regardless of the victim’s
behaviour, attitudes, creeds, race, sex, or socioeconomic status so that further details about the
incident could come to light.Further, safety inspectors must monitor the trend of incidents in
organizations and classify type, nature, severity and other information into categories to help them
modify or enforce the existing rules. Researchers in the institution have the responsibility for being
competent in the use of those tools, techniques, and strategies demanded by the safety culture.
These include such skills as observation, testing, operation and the use of a variety of other safety
techniques.
3. The Safety System
The inputs made by the stakeholders and incident reports interact within the safety system.
The type of interaction that takes place depends upon the nature of the safety system used by the
institution and the calibre of inputs made into this system by the stakeholders and incident reports.
For example, a particular safety system may not be appropriate for an incident of a certain
department or from a particular service. For other incidents, the system may be adequate but the
stakeholders may not be able to control or efficiently input their own input sufficiently to enable
safety knowledge move from one stage of the transfer to another. The stakeholders may be “turned
off” by the frequency or natures of the incidents experienced by an individual or department and
thus lose sight of professional responsibilities. A stakeholder may fail to make the type of inputs
into the system that would make safety knowledge transfer a facilitative process.
The type of interaction that takes place within a safety knowledge transfer system also
depends upon the input into the system made by the incident reports. The report may not be
sufficiently detailed enough to facilitate the extraction of safety knowledge into the system. Or, the
victim may be deceptive or dishonest in communications with an HSE department. Inputs can be
used to the advantage of the organization if the stakeholders utilize a safety knowledge transfer
system that has the capability of providing guidelines for working with a wide range of materials
and persons, and if the HSE department has the appropriate skills, knowledge, and attitudes to input
into the safety knowledge transfer system. It is the primary responsibility of the HSE and not the
victim to provide the necessary conditions for effective human interaction.

©Journal of Applied Sciences & Environmental Sustainability (JASES) 1 (3): 38-52, 2013
56
4. Safety knowledge outcomes
The last basic component of the safety knowledge transfer from incident report is the output or
outcomes of the interaction between the stakeholders and incidents that have taken place within the
safety knowledge transfer system used by the organization. Any time incidents happen and the HSE
and incident reports engage in the knowledge transfer process there is some kind of outcome as a
product of their interaction. This is the “payoff’” of the safety process and the HSE “moment of
truth”.
The outcomes of safety system can be positive or negative for the research institution. For the
institution which attains the goals established in the system design, the outcomes represent a
rewarding experience. Perhaps the organization has made a decision that will change some machines
or structures in the organization. The organization may have obtained information that will help in
getting a certain job done safely. Or, perhaps the organization has learned how employees can handle
certain procedural situations. Whatever outcome emanates from the safety system, the stakeholders
receive it as a feedback; this is shown by the letter F in figure 2. The feedback informs the
stakeholders whether to modify the system, leave it as it is or change the system. The stakeholders also
use the feedback to fashion products and services towards an optimum safety system.
Case Study
To test the applicability of our model, we used and academic intuition as a case study. HSE
department agreed to use one our model to report a certain incident that occurred in the laboratory.
First, the case was a test tube explosion of by undergraduate student, which was started by incident
reports are used to fulfill many purposes such as feedback for safety programmes in organizations,
data for insurance claims, yardstick to assess old safety rules by government agencies, and grounds for
creating new ones.Given that an accident and the resulting incident report have the capacity to
immediately call attention of stakeholders, including regulating agencies to safety issues, the
significance of the report can not be overemphasized. However, there is little research attention
focusing on the nature of the knowledge extracted from such reports and how it is transferred within
the organization and among the stakeholders.
Therefore, this paper argues for the fusion of systems thinking and materiality of knowledge in
understanding safety knowledge transfer (SKT); and to propose a new systems-based safety
knowledge transfer model founded on incident reports. As a review of the literature on safety
knowledge transfer, materiality of knowledge and systems thinking; it leads to the proposal of a new
SKT paradigm. The Incident Report-Based Safety Knowledge Transfer (IRSKT) model identifies the
elements neccessary for social systems in workplaces to extract, disseminate and use new knowledge
emanating from incident reports.

©Journal of Applied Sciences & Environmental Sustainability (JASES) 1 (3): 38-36, 2013
57 | P a g e
HSE investigates
Severe?
Remains in the filing system
File incident report
Incident Tracking and follow-up System
Meets recommendatio
n of HSE?
File the report of follow-up
Send alert to all departments
External alertInternal alert
No
Yes
Close File
Yes
Management meets on the
incident
Management makes
recommendations?
Close File
No
Another follow-up by HSE
Yes
Equipment and
personnel need testing
Pass
Remove
machine or
discipline
employee
Resolvednegative
HSE writes reports
Incident
Management briefed for the last time.
Incident report process
Yes
Fig 4: Incident reporting process at an academic institution
The Incident Report-Based Safety Knowledge Transfer (IRSKT) model proffers a unique systemic as
well as universal theoretical account for specifying the parts and steps necessary to get social systems
to create, share as well as utilize new knowledge from incident reports.
By employing the all emcompassing systems theory perspective to knowledge exchange, we can
understand knowledge transfer as connected to the actual interactions among, as well as within
systems; for example, one can see how the systems are associated with specific goals as well as
processes. The systemic viewpoint permits observing knowledge transfer through the way in which
knowledge is transferred (the process), as well as what components enable knowledge exchange to
achieve success. The IRSKT model is not opposed to the classic knowledge transfer models which
refer to knowledge transfer as being a process, but it also concentrates on the parts and the steps an
incident report must take in a social system before knowledge transfer can take place.
In sum, we offer a new safety knowledge transfer paradigm that views safety knowledge as a systemic,
emergent, embedded and materially entangled representation of reality. The proposed knowledge
transfer model is different from earlier attempts, concentrating movement of safety information in

©Journal of Applied Sciences & Environmental Sustainability (JASES) 1 (3): 38-52, 2013
58
incident reports and the significance stakeholders must attach to them to minimize both human and
machine error.
Conclusion
This study shows that the IRSKT model is well suited to analyzing safety knowledge transfer in
both complex and small-scale systems. Empirical studies in various systems (of complexity)
environments will help affirm and enrich the model. The paper sees that in academia where safety of
researchers and students is important, the ability to extract knowledge from incidents reports – which
is an assesible and ready estimate of safety situations in academic institutions - is vital for establishing
safe laboratories. The capacity for effective exchange and utilization of safety information inherent in
incident reports by employees, equipment manufacturers, professional bodies and government
agencies as reflected in IRSKT will inform the decisions to build in safety in machinery, better safety
rules, effective safety campaigns and enhance safety conscious behaviours in institutions.
References
Ackoff, R. L., Emery, F. E., Ackoff, R. L., & Ackoff, R. L. (1972). On purposeful systems Aldine-
Atherton.
Baines, D. (2007). The case for catalytic validity: Building health and safety through knowledge
transfer. Policy and Practice in Health and Safety, 5(1), 75-89.
Bechky, B. A. (2003). Object lessons: Workplace artifacts as representations of occupational
jurisdiction. American Journal of Sociology, , 720-752.
Bechky, B. A. (2003). Sharing meaning across occupational communities: The transformation of
understanding on a production floor. Organization Science, , 312-330.
Bertalanffy, L. (1968). General system theory. New York: George Braziller,
Carlile, P. R. (2002). A pragmatic view of knowledge and boundaries: Boundary objects in new
product development. Organization Science, , 442-455.
Carlile, P. R. (2004). Transferring, translating, and transforming: An integrative framework for
managing knowledge across boundaries. Organization Science, , 555-568.
Davanzo, E., Bruno, A., Beggio, M., Frasson, C., Morandin, M., Giraldo, M., et al. (2007). Biologic
risk due to accident in academic personnel]. [Il rischio biologico da incidente nel personale
sanitario universitario] Giornale Italiano Di Medicina Del Lavoro Ed Ergonomia, 29(3 Suppl),
761-762.
Dobbins, M., Robeson, P., Ciliska, D., Hanna, S., Cameron, R., O'Mara, L., et al. (2009). A
description of a knowledge broker role implemented as part of a randomized controlled trial
evaluating three knowledge translation strategies. Implementation Science : IS, 4, 23.

©Journal of Applied Sciences & Environmental Sustainability (JASES) 1 (3): 38-36, 2013
59 | P a g e
Gherardi, S., & Nicolini, D. (2000). To transfer is to transform: The circulation of safety knowledge.
Organization, 7(2), 329.
Hellman, M. A., Savage, E. P., & Keefe, T. J. (1986). Epidemiology of accidents in academic
chemistry laboratories. part 1. accident data survey. Journal of Chemical Education, 63(11), 267.
Holland, J. J., & Hoyer, B. H. (1962). Early stages of enterovirus infection. Cold Spring Harbor
Symposia on Quantitative Biology, , 27 101.
Ju-xin, L., Jin-chuan, Z., & Zhong-ying, L. (2007). Research of agent based farm product safety
knowledge transfer model [J]. Computer Knowledge and Technology (Academic Exchange), 17
Kramer, D. M., & Cole, D. C. (2003). Sustained, intensive engagement to promote health and safety
knowledge transfer to and utilization by workplaces. Science Communication, 25(1), 56.
Kramer, D. M., Cole, D. C., & Leithwood, K. (2004). Doing knowledge transfer: Engaging
management and labor with research on employee health and safety. Bulletin of Science,
Technology & Society, 24(4), 316.
Kramer, D. M., & Wells, R. P. (2005). Achieving buy-in: Building networks to facilitate knowledge
transfer. Science Communication, 26(4), 428.
Kramer, D., & Cole, D. C.(2003). sustained, intensive engagement to promote health and safety
knowledge transfer and utilization by workplaces. Science Communication, 25(1), 56-82.
Mitton, C., Adair, C. E., McKenzie, E., Patten, S. B., & Perry, B. W. (2007). Knowledge transfer and
exchange: Review and synthesis of the literature. Milbank Quarterly, 85(4), 729-768.
Orlikowski, W. J. (2002). Knowing in practice: Enacting a collective capability in distributed
organizing. Organization Science, 13(3), 249-273.
Orlikowski, W. J. (2002). Knowing in practice: Enacting a collective capability in distributed
organizing. Organization Science, 13(3), 249-273.
Orlikowski, W. J. (2006). Material knowing: The scaffolding of human knowledgeability. European
Journal of Information Systems, 15(5), 460.
Parent, R., Roy, M., & St-Jacques, D. (2007). A systems-based dynamic knowledge transfer capacity
model. Journal of Knowledge Management, 11(6), 81-93.
Pesta, S., & Kaufman, J. A. (1986). Laboratory safety in academic institutions. Journal of Chemical
Education, 63(10), 242.
Pingleton, S. K., Davis, D. A., & Dickler, R. M. Characteristics of quality and patient safety curricula
in major teaching hospitals. American Journal of Medical Quality, 25(4), 305-311.
Roy, M., Parent, R., & Desmarais, L. (2003). Knowledge networking: A strategy to improve
workplace health and safety knowledge transfer. Electronic Journal of Knowledge Management,
1(2), 159-166.

©Journal of Applied Sciences & Environmental Sustainability (JASES) 1 (3): 38-52, 2013
60
Rubenstein-Montano, B., Liebowitz, J., Buchwalter, J., McCaw, D., Newman, B., & Rebeck, K.
(2001). A systems thinking framework for knowledge management. Decision Support Systems,
31(1), 5-16.
Rubenstein-Montano, B., Liebowitz, J., Buchwalter, J., McCaw, D., Newman, B., & Rebeck, K.
(2001). A systems thinking framework for knowledge management. Decision Support Systems,
31(1), 5-16.
Shakun, M. F. (1981). Formalizing conflict resolution in policy making. International Journal of
General Systems, 7(3), 207-215.
Shamian, J., & El-Jardali, F. (2007). Healthy workplaces for health workers in canada: Knowledge
transfer and uptake in policy and practice. Healthcare Papers, 7(I), 6.
Star, S. L., & Griesemer, J. R. (1989). Institutional ecology,translations' and boundary objects:
Amateurs and professionals in berkeley's museum of vertebrate zoology, 1907-39. Social Studies
of Science, 19(3), 387.
Stewart, W. H., Ledgerwood, D. E., & May, R. C. (1996). Educating business schools about safety &
health is no accident. Journal of Business Ethics, 15(8), 919-926.
Tyler, M. (2007). Tolley's workplace accident handbook Elsevier.
Ward, V., House, A., & Hamer, S. (2009). Developing a framework for transferring knowledge into
action: A thematic analysis of the literature. Journal of Health Services Research & Policy, 14(3),
156.
Ward, V., House, A., & Hamer, S. (2009). Knowledge brokering: The missing link in the evidence to
action chain? Evidence &# 38; Policy: A Journal of Research, Debate and Practice, 5(3), 267-
279.
Wilk, I. (1977). Chemical accidents in academic institutions-A critical commentary on accidents
reported in the university of california system. Journal of Chemical Education, 54(10), 415.